5 mapping tools that uncover insights to help you win in the marketplace
TRANSCRIPT

5 Mapping Tools That Uncover Insights to Help
You Win in the Marketplace

Business Intelligence (BI) Facts
80% of all business data has a geographic attribute
Adding location intelligence to data enables users to easily uncover insights to win in the marketplace.
By using mapping tools such as color, size, and other visualization techniques, you can clearly see your biggest problems and opportunities
Humans are visual learners; maps help us understand data better than spreadsheets
In fact, you can use geo tools to solve five common problems
Let’s take a look…
#1Finding Your Biggest Opportunities or Issues
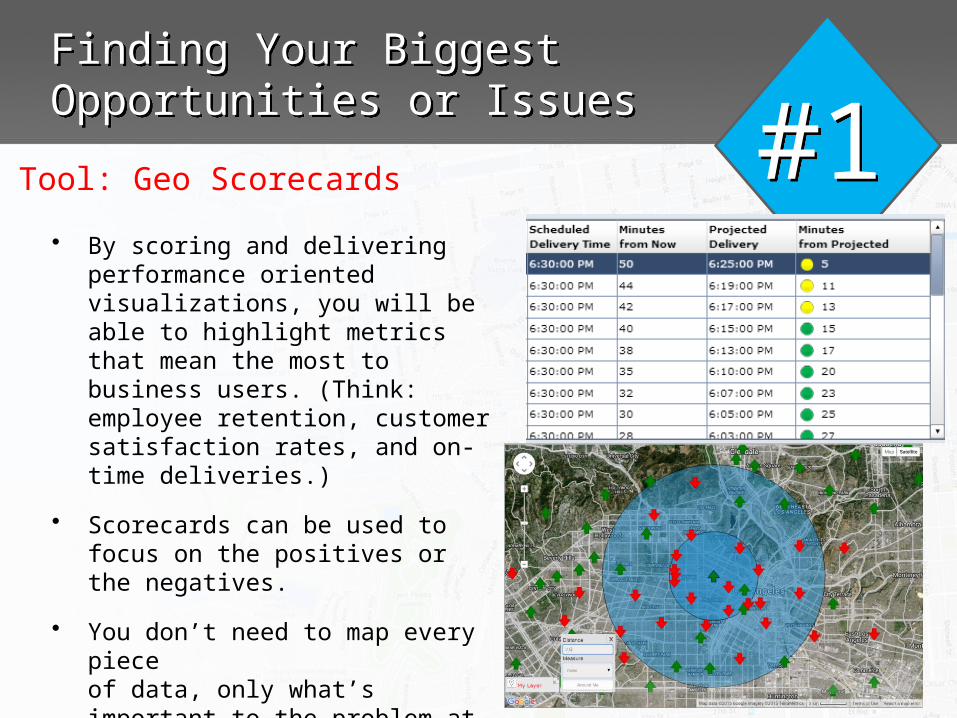
• By scoring and delivering performance oriented visualizations, you will be able to highlight metrics that mean the most to business users. (Think: employee retention, customer satisfaction rates, and on-time deliveries.)
• Scorecards can be used to focus on the positives or the negatives.
• You don’t need to map every piece of data, only what’s important to the problem at hand.
Tool: Geo Scorecards

#1Finding Your Biggest Opportunities or Issues
• Rather than showing where all your deliveries occurred, only show those that were delinquent
• Analyze the data to determine causes and either plan for or eliminate future delinquent deliveries.
– Mechanical, weather, traffic, driver related conditions
– Errors in logistical planning
Example: Delinquent Deliveries

#2Analyzing Business Performance Across Geographies
Tool: Drillable Data
• With the ability to transform tabular, relational, and multidimensional data, you can thoroughly analyze the facts, resulting in better, data-backed decisions.
• From territory to state to facility to customer to asset, you’ll have one view from top down (or bottom up).

#2Analyzing Business Performance Across Geographies
• Many enterprises manage and delegate operational and sales responsibilities based on geographies or territories. Using geography to visualize and navigate multiple performance indicators can be a powerful management tool.
• For top/down strategic discussions or store-level tactical reviews, a clear hierarchical view of performance can be useful at all levels of an enterprise.
• In this example, one global consumer goods organization could visualize sales and marketing spend down to the store-level.
Example: Store Performance

#3Determining Where Customers Are Concentrated
Tool: Heat Maps / Choropleths
• Heat maps are popular for representing relationships of grouped boxes and use color and size to visually communicate.
• Choropleth is a fancy term used for heat maps where the shape/size merely represents geography. Applying color quickly pops out critical data and shows your hottest (and coldest) locales, showing where to focus your efforts.
#3Determining Where Customers Are Concentrated
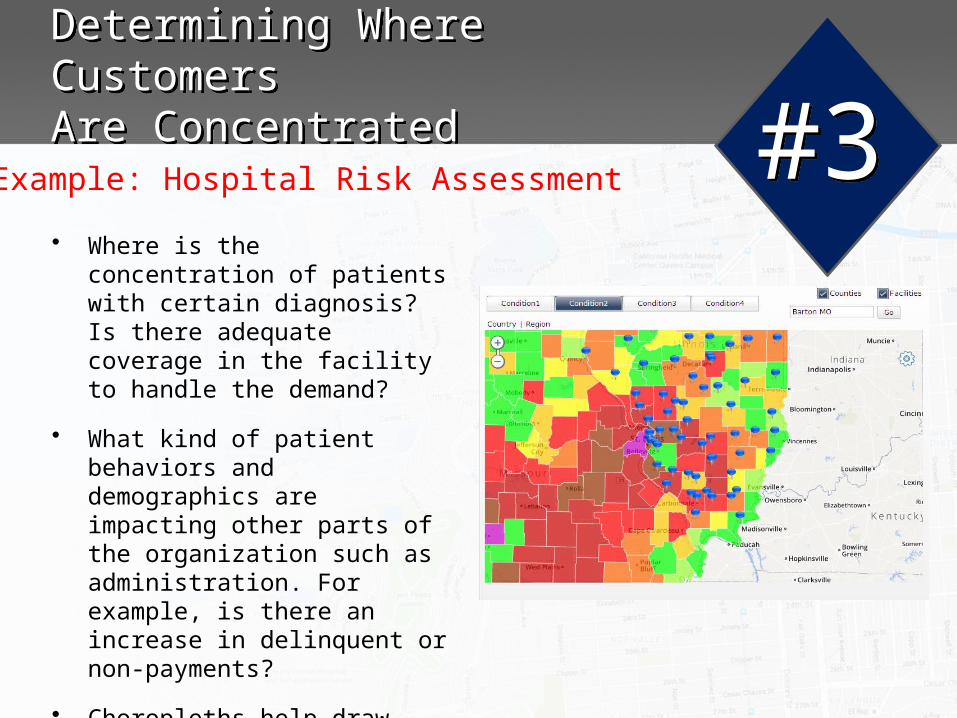
• Where is the concentration of patients with certain diagnosis? Is there adequate coverage in the facility to handle the demand?
• What kind of patient behaviors and demographics are impacting other parts of the organization such as administration. For example, is there an increase in delinquent or non-payments?
• Choropleths help draw attention to outliers on both ends of the scale and can also visually indicate density.
Example: Hospital Risk Assessment

#4Finding Opportunities You Might be Missing
Tool: Mashups
• Layering multiple un-like data sources that are only linked by geography can visually uncover opportunities or deficiencies that may be buried inside a spreadsheet.
• The beauty of mashups is that the data does not need to be linked in any way.
• Mashups also create new opportunities to aggregate and combine data by geography.
#4Finding Opportunities You Might be Missing
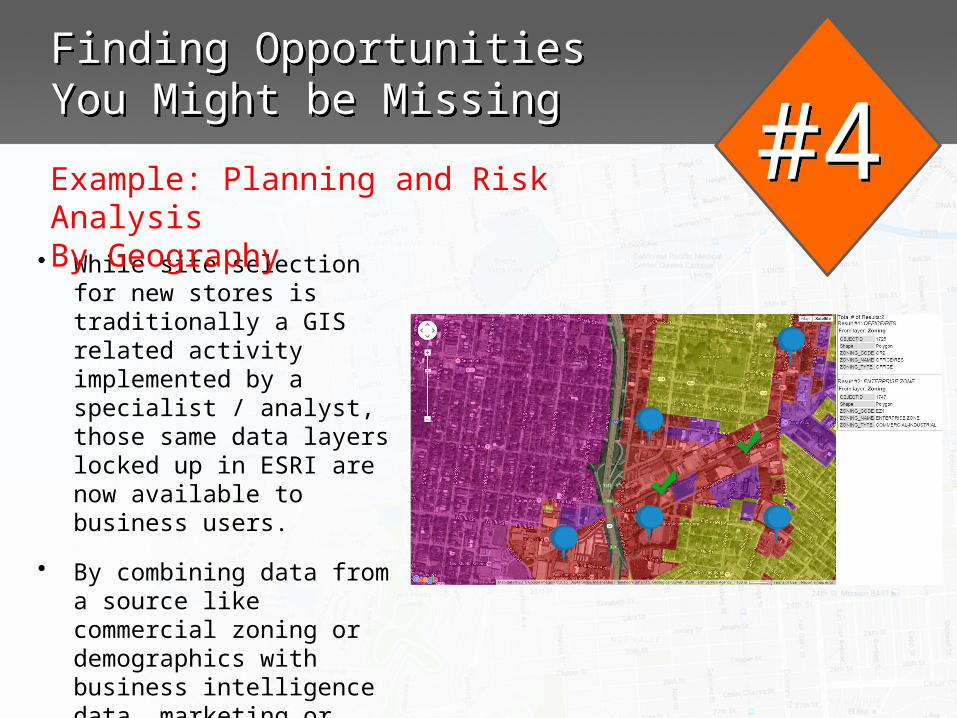
• While site selection for new stores is traditionally a GIS related activity implemented by a specialist / analyst, those same data layers locked up in ESRI are now available to business users.
• By combining data from a source like commercial zoning or demographics with business intelligence data, marketing or operational workers now have access to plan events with more information at their fingertips.
Example: Planning and Risk Analysis By Geography
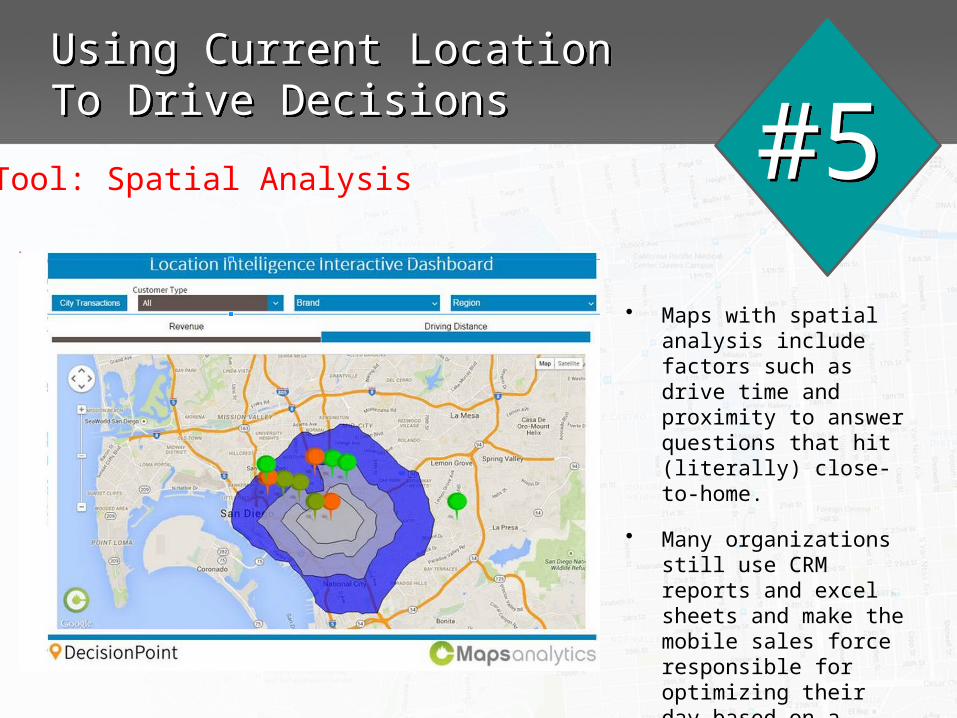
#5Using Current Location To Drive Decisions
Tool: Spatial Analysis
• Maps with spatial analysis include factors such as drive time and proximity to answer questions that hit (literally) close-to-home.
• Many organizations still use CRM reports and excel sheets and make the mobile sales force responsible for optimizing their day based on a number of variables.

#5Using Current Location To Drive Decisions
• Distance and proximity can be invaluable when considering the cost and risk of moving materials.
• By assessing which customers are in closer proximity of refineries compared to competitors, this advantage can be used not only to win customers, but maximize profits by gaining better insights to the field earlier in the sales cycle.
Example: Routing Resources and Assets
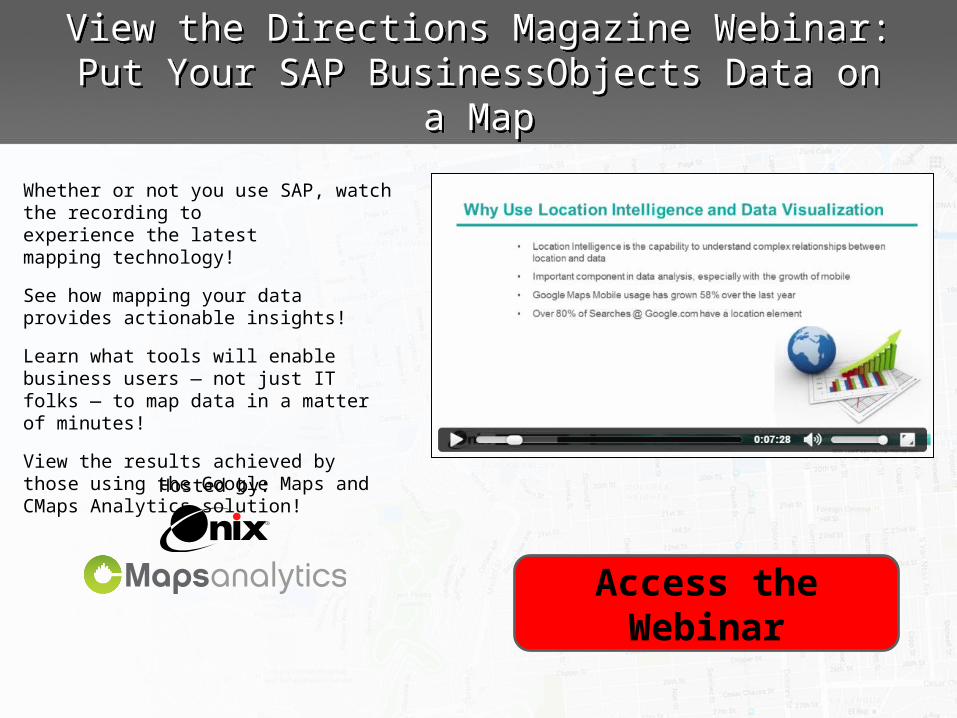
Whether or not you use SAP, watch the recording to experience the latest mapping technology!
See how mapping your data provides actionable insights!
Learn what tools will enable business users — not just IT folks — to map data in a matter of minutes!
View the results achieved by those using the Google Maps and CMaps Analytics solution!
Access the Webinar
View the Directions Magazine Webinar:Put Your SAP BusinessObjects Data on a Map
Hosted by: