70–80 above average

1
Queensland's extended wet and dry periods Australian Rainfall Periods (April to March) Relative to Historical Records 1889–2020 Data: Tuesday, 9 June 2020 Created: Tuesday, 16 June 2020 10:18:01 AM 0 0 10 -10 -1 1 20 -20 -2 2 30 -30 -3 3 1889 1890 1891 1892 1893 1894 1895 1896 1897 1898 1899 1900 1901 1902 1903 1904 1905 1906 1907 1908 1909 1910 1911 1912 1913 1914 1915 1916 1917 1918 1919 1920 1921 1922 1923 1924 1925 1926 1927 1928 1929 1930 1931 1932 1933 1889 – 1896 (7 Year) Above-average seasons – rainfall was 41% above the long term average. i l Livestock increased with property expansion into the Queensland interior. l Sheep numbers in Queensland exceeded 20M head. l Widespread flooding in most of rural Queensland. l Major Brisbane floods (1889, 1890 and 1893). l Nation-wide depression with low wool and beef prices with stock unable to be sold. l Rabbits, kangaroos, flystrike, cattle ticks and prickly pear followed settlers. Tick fever reduced cattle numbers by 50-90%. The “ rabbit fence” was finished in 1891; free netting wire was offered to kangaroo infestation areas. l Artesian bores sunk and bore drains developed from 1887. 1896 – 1903 (7 Year) Rainfall for this dry period was 46% below the previous wet period. i l Federation drought: heatwaves, bushfires and dust storms associated with >40% livestock losses in Queensland. l Livestock numbers in Queensland reduced from 6.5M to 2.5M cattle and from 19M to 7M sheep. l Western New South Wales impacted by soil erosion and woody weed infestation (1898/99). l Properties in western New South Wales were abandoned with collapse in carrying capacity, resulting in the Royal Commission investigating financial stress in the Western Division. l Sir Sidney Kidman acquired properties and nearly lost all by 1901 due to the severity and widespread nature of this drought. l Tropical Cyclone Mahina struck Bathurst Bay (Cape York) on 4 March 1899. The surrounding region sufferred a massive storm surge from the category 5 system, killing over 400 people – the largest death toll of any natural disaster in Australian history. Reports recorded that grass was ripped from the ground on the islands offshore and that fish and dolphins were left in trees 15m above sea level. 1903 – 1911 (8 Year) A period of recovery with average to above average rainfall; 46% above the previous dry period. i l Sheep numbers returned to 20M head following the Federation drought. l Annual widespread flooding in most of rural Queensland. l Prickly pear declared a noxious weed (1910); estimates of spreading was at 930 ha per day. l Northern Queensland abattoirs purchased cattle stations to guarantee kill numbers and industry viability. 1911 – 1916 (5 Year) Rainfall for this dry period was 27% below the previous wet period. i l Two periods of severe drought occurred (from 1911 & from 1914) with comparisons made with the severity of the Federation drought. l Drought closed down pastoral stations, with heavy stock losses and interruptions to services. l “ In August (1915) not a blade of grass was to be seen between Rockhampton and Longreach.” l Crops on the Darling Downs failed and little sugar cane was harvested on the coast (e.g. 1916); wheat crop failed (e.g. 1911 & 1915). 1916 – 1922 (6 Year) Rainfall 43% above the previous dry period. i l Soldier settler blocks (>23,000; 9.3Mha) were provided Australia-wide post World War I – expectations of success were over-optimistic due to this wet period, along with world-wide food shortages and a wool boom. About a third of the settlers (nearly 12,000) had abandoned their farms within a few years due to many settlers’ lack of farm management skills, inadequate advisory services, excessive prices for stock and equipment, the fall in commodity prices in 1920-24, poor quality of Crown lands, over-valuation of properties, inadequate farm sizes, heavy capital debt and interest burdens, and unsatisfactory commonwealth state relations. l Wheat harvests were low in 1918 & 1919. l By 1919 prickly pear had covered 25Mha in Queensland and northern New South Wales. l Cattle numbers peaked post-Federation drought (6.5M head in 1922). l Peak artesian bore discharge occurred from flowing bores. 1922 – 1933 (11 Year) Rainfall 26% below the previous wet period. i l Severe drought resulted in large-scale wheat feeding of the state sheep flock, which reduced government revenue. l World-wide depression occurred, with declining agricultural prices. l Cactoblastis cactorum moth introduced in 1926 to combat prickly pear – eradicated by 1929. l During 1930s cattle lost in drought equalled the number of cattle sold off properties. l The first contour banks for erosion control were surveyed and constructed in the Darling Downs. l South Australia had substantial loss of perennial vegetation and soil erosion (1925/6 – 1929/30), resulting in eventual government legislation (Soil Conservation Act 1939) for regulation of carrying capacity. 0 0 10 -10 -1 1 20 -20 -2 2 30 -30 -3 3 1933 1934 1935 1936 1937 1938 1939 1940 1941 1942 1943 1944 1945 1946 1947 1948 1949 1950 1951 1952 1953 1954 1955 1956 1957 1958 1959 1960 1961 1962 1963 1964 1965 1966 1967 1968 1969 1970 1971 1972 1973 1974 1975 1976 1977 1978 1979 1980 1981 1982 1983 1933 – 1941 (8 Year) Rainfall for this wet period was 13% above the previous dry period. i l Queensland cattle accounted for 45% of the national herd in 1930s/40s, but wool was the dominant industry. l Rural production increased due to the outbreak of World War II. l British government purchased the entire Australian wool clip. Wool prices increased, prices were fixed to control inflation. l In the Gascoyne region of Western Australia there was severe drought (1935/36 – 1940/41). It resulted in a substantial loss of perennial shrubs, soil erosion and sheep and cattle losses which were documented in the West Australian Royal Commission into the Financial and Economic Position of the Pastoral Industry in the Leasehold Areas (1940). l Landmark shipment of Brahman cattle (31 head) from USA to north Queensland took place (1933). 1941 – 1948 (7 Year) Rainfall was 10% below the previous wet period. i l Agricultural prices were fixed to control inflation during the war period. l Pasture shortages resulted in reduced wool production with large stock losses; sheep numbers in Queensland fell from 24M head (1941) to 16M head in 1948. l In western New South Wales, substantial dust storms and animal losses during 1941/42 – 1944/45 were graphically portrayed in Sir Russell Drysdale's paintings and Keith Newman's Sydney Morning Herald reports, supporting the need for government action. 1948 – 1957 (9 Year) Rainfall for this wet period was 42% above the previous dry period. i l The War Service Land Settlement Scheme provided farms in every state for over 12,000 returned soldiers – a significant reduction from post-World War I. In general, efforts to avoid the mistakes of the past were successful; comprehensive training, greater care in selection and subdivision of land, with much larger scale funding, ensured most soldier settlers remained on the land to achieve a reasonable standard of living. l High export prices in the post-war years benefited many landholders. Sheep properties were in high production and good prices as a result of the “ wool boom”, where wool was selling “ a pound (weight) for a pound (paid)” in association with demand for uniforms (Korean war). l Despite the overall favourable period, in 1951 there were 9 months of record low rainfall associated with substantial stock losses – captured as a series of photographs and paintings by the artist Sir Sidney Nolan who travelled throughout Queensland and the Northern Territory in 1952 under commission for the Brisbane Courier Mail. l The “ Dog/Dingo fence” was initiated to contain 55Mha of sheep country in South Australia, New South Wales and Queensland. l Rabbits were estimated to have eaten the equivalent of 70M sheep. Rabbit numbers drop when Myxomatosis was released (1950) bringing large resource recovery. l The Queensland-British Food Corporation - Peak Downs farming scheme (Central Highlands, Queensland) was initiated in 1948 encompassing 200,000 ha; although the scheme was dissolved in 1953, it demonstrated the farming potential of Central Highlands. l Consecutive floods during this period occurred throughout Queensland, from the coast to western regions. 1957 – 1970 (13 Year) This dry period had rainfall 29% below the previous wet period. i l The widespread drought of 1964-1966 severely affected New South Wales and Queensland. l In south-west Queensland the drought contributed to the economic and resource degradation of the mulga lands reported in the Warrego Graziers Association submission (1988) that eventually led to the government-supported South-West Strategy (1994) involving property reconstruction and assessment of 'safe' livestock carrying capacity. l Queensland wool production peaked (1963). Sheep properties diversified into beef and grain with commodity market shifts. l Fitzroy Basin Development Scheme launched (1962) to clear 4.5Mha of brigalow country. l Government established drought scheme for western Queensland (1964); Fairbairn dam (Emerald) development initiated. l In Central Australia wind and water erosion resulted in extensive surveys and re-assessment of carrying capacity. 1970 – 1977 (7 Year) Rainfall was 38% above the previous dry period, with major flooding of Brisbane. i l OPEC oil crisis resulted in overseas market closures; collapse in beef market mid-1970s. l Queensland cattle numbers increased from 6.8 to 11M head (in 1978 – a 60% increase). l Japan closed beef imports from the USA in late 1973, subsequently the USA stopped beef imports from Australia, due to its own cattle oversupply. A backlog of cattle were held on Australian properties because there was no export slaughter market; the price of cattle was not sufficient to meet transport costs to sale. This situation continued until markets to the USA re-opened after 1978. l Australian Wool Corporation set a reserve price for wool in 1970 to regulate the wool supply. l Campaign launched in 1970 for the successful eradication of brucellosis and tuberculosis in cattle (ended 1997). 1977 – 1983 (6 Year) Rainfall was 27% below the previous wet period. i l Severe drought – a survey reported that 60% of Australian primary producers were affected – mostly in the eastern half of the continent. l Economy of Australia suffered its worst recession since the Great Depression (1929 – 1939). l Producers in financial difficulty pre-drought due to high interest rates and high debt within the wool industry. l Mulga feeding and molasses/urea supplementary feeding allowed livestock to remain on-property to consume dry pastures and litter with resulting land degradation. l The south-west Queensland pastoral region came under pressure with the retention of livestock; in north-east Queensland soil erosion and loss of 'desirable' perennial grasses, resulted in extensive government-sponsored surveys and well-documented case studies reported from graziers. 0 0 10 -10 -1 1 20 -20 -2 2 30 -30 -3 3 1983 1984 1985 1986 1987 1988 1989 1990 1991 1992 1993 1994 1995 1996 1997 1998 1999 2000 2001 2002 2003 2004 2005 2006 2007 2008 2009 2010 2011 2012 2013 2014 2015 2016 2017 2018 2019 2020 1983 – 1991 (8 Year) Average to good years; 21% above the previous dry period. i l In this wet period, winter rain occurred (notably 1983) along with a number of poor summer seasons (e.g. 1984/5 and 1987/88). Livestock numbers in some regions were retained beyond sustainable property carrying capacities, contributing to degradation of land condition. Assessments followed to define land capacity, sustainability and degradation levels for vegetation zones of northern Australia pasture lands (e.g. Tothill & Gillies 1992). l Australian wool clip peaked and triggered the collapse of the reserve wool price scheme, which was dissolved in 1991 with 4.7M bales held in storage. l Major flooding occurred in northern New South Wales and southern Queensland (e.g. Charleville, 1990). In February 1991 major flooding developed in the upper parts of the Burdekin River following rainfalls of 200mm, which peaked at Selheim (19.6m), the second highest flood on record. 1991 – 1996 (5 Year) Rainfall was 29% below the previous wet period. i l The 1990s drought was characterised by back-to-back El Niño events over four years (1991, 1992, 1993, 1994). Thousands of stock died; a 70% reduction of livestock in the western Darling Downs and Maranoa were estimated, with reductions of 40% reported elsewhere – productive areas were also affected with reduced crop yields. l The National Drought Policy (1992) was initiated, to encourage primary producers to adopt self-reliant approaches to managing for climate variability. For the first time, support payments for farm families, interest rate subsidies and tax incentives through the Farm Management Bond scheme were created. l Southern Oscillation Index (SOI) extension communication was developed (1991). In January 1994, tropical cyclone Sarah delivered up to 500mm in 12-18 hours at some locations. Western Queensland had high flood inundation in the following February/March. l In 1995 the rabbit calicivirus escaped quarantine and killed 10M rabbits within 8 weeks of its release. 1996 – 2001 (5 Year) Recovery period with rainfall 49% above the previous dry period. i l Floods in many Queensland regions. l Statewide assessment in November 2002 found that many regions had much better ground cover than expected. l High macropod numbers (i.e. kangaroos) became a concern, along with domestic and feral livestock. l Livestock statistics indicated that in June 2001 numbers were approximately equivalent to the high numbers that occurred in the late 1970s, increasing the potential risk of land degradation in drought and drier periods. 2001 – 2007 (6 Year) Rainfall was 32% below the previous wet period. i l The severity of rainfall deficit in the six-year Millennium drought in Queensland (2001 – 2006) was exacerbated by high temperatures and evaporative demand. This resulted in reduced pasture and resource condition in several regions. l Simulated pasture growth (April 2001 – March 2007) averaged across Queensland was 29% below the long term mean. l On a state-wide basis, retention of livestock numbers through the drought period (cattle 10.4 – 11.8M head; sheep 4M head on pasture) increased the risk of land and pasture degradation, however; high beef prices (2001) and reports on a regional basis indicated that livestock were reduced in order to decrease local grazing pressure. l Tropical Cyclone Larry (March 2006) devastated the far north Queensland coast and adjacent tablelands. 2007 – 2012 (5 Year) The rainfall was 72% above the previous dry period. i l Queensland experienced above-average wet years, that were generally beneficial for plant growth, groundcover and land condition. Simulated pasture growth (April 2007 – March 2011), was 65% above the long term mean. l Livestock carrying capacity improved and trends in landscape condition were positive for many Queensland regions that were previously assessed at lower levels. Recovery in many regions appeared to have occurred, however, areas very low in condition failed to respond fully. l Extreme storm events and some flooding events seriously impacted soils, flora and fauna in localised areas, as well as the social and economic circumstances of landholders. Extended water inundation caused the death of pasture grass and the loss of seed reserves over large areas (e.g. northern Gulf); where only partial recovery of the resource was observed. l Widespread grass fire hazards developed due to the general abundance of pasture growth in most regions in Queensland. 2012 – 2020 (8 Year – to date) Rainfall was 38% below the previous wet period. i l Surface and stock water drought (2012/13) was followed by low pasture biomass supply. l The live export hiatus resulted in livestock retention, excess domestic supply and market price failure; with some later market recovery. l Widespread floods and damage were associated with Tropical Cyclones: Oswald (2013); Marcia (2015); and Debbie (2017). l Above-average winter rainfall and unseasonal pasture growth (2016) created stock respite. l Late season rainfall (March 2018) in north Queensland yielded useful a pasture response. l Bushfires (late 2018) affected coastal and hinterland areas (central, northern Queensland). l Extreme rainfall (early 2019) impacted Gulf, central-west and other north Queensland regions; mass deaths (domestic, native animals) ensued from flooding and exposure. Areas adjacent to flooding and channel country benefited with invaluable pasture responses. l Summer rainfall was low for large areas of Australia in 2018/19 and 2019/20; extreme weather (heat, low humidity, wind) caused calamitous fire-sustaining conditions in coastal and inner-regional areas in 2019/20; tragic losses ensued (human, native and domestic animals), with bushland, rural and urban property devastation. A short (late) wet period initiated pasture response in most regions (Jan-March 2020), particularly in the south-west channel country region. l Queensland’s drought-declared area was still 67.4% in May 2020. i Rainfall percentage (%) change from the previous period (wet or dry) are for Queensland’s main pastoral and dryland cropping zone (south of 19° latitude and east of a line approximately from Cloncurry to Hungerford - MLR); it represents approximately 60% (100Mha) of the state, but carries 80% of the state’s livestock. Years on the graphs are classified, according to colour, based on whether they are either ‘El Niño’ years (red text year title), ‘La Niña’ years (blue text) or ‘ENSO Neutral’ years (dark grey text). El Niño Originally referred specifically to a warming of the sea surface off the coast of Peru, now more generally refers to the warming of the central and eastern equatorial Pacific Ocean, strongly associated with persistently negative values of the Southern Oscillation Index (SOI). Generally associated with extended drier periods. La Niña Now used to refer to the opposite of El Niño, or events associated with persistently positive values of the SOI. Generally associated with extended wetter periods. ENSO Neutral ENSO refers to the El Niño–Southern Oscillation which fluctuates between El Niño or La Niña (above). 'ENSO Neutral' refers to neither El Niño or La Niña. Often the equatorial Pacific Ocean temperatures are near the long-term average. It is possible to have wet or dry periods associated with 'ENSO Neutral' years. Graph The graph shows fluctuations in the six-month moving average of the Southern Oscillation Index (SOI). The SOI compares the difference in atmospheric pressure anomalies between Tahiti and Darwin. The graph also shows fluctuations in the Inter-decadal Pacific Oscillation (IPO), a slower moving fluctuation in Pacific Ocean sea surface temperatures which influences climate variability. The IPO values on the graph are the filtered time series using 11-year Chebychev filter provided by Andrew Coleman, UK Met Office (updated to May 2020). Rainfall classification Maps for each period show rainfall ranked against historical records from 1889 to 2020. The ranking is expressed as a percentile. For example, a percentile rank of 0–1 indicates that rainfall over the indicated period ranks within the lowest one per cent of rainfall values recorded for that period length, at that location. Percentile 99–100 Highest on record 90–99 Extremely high rainfall 80–90 Well above average 70–80 Above average 50–70 Higher than average 30–50 Lower than average 20–30 Below average 10–20 Well below average 1–10 Extremely low rainfall 0–1 Lowest on record Produced by Queensland Government, Ecosciences Precinct. GPO Box 2454, Brisbane, Queensland 4001. email: [email protected] web: www.LongPaddock.qld.gov.au

Upload: others

Post on 27-Jan-2022

3 views

Category:

Documents


0 download

TRANSCRIPT

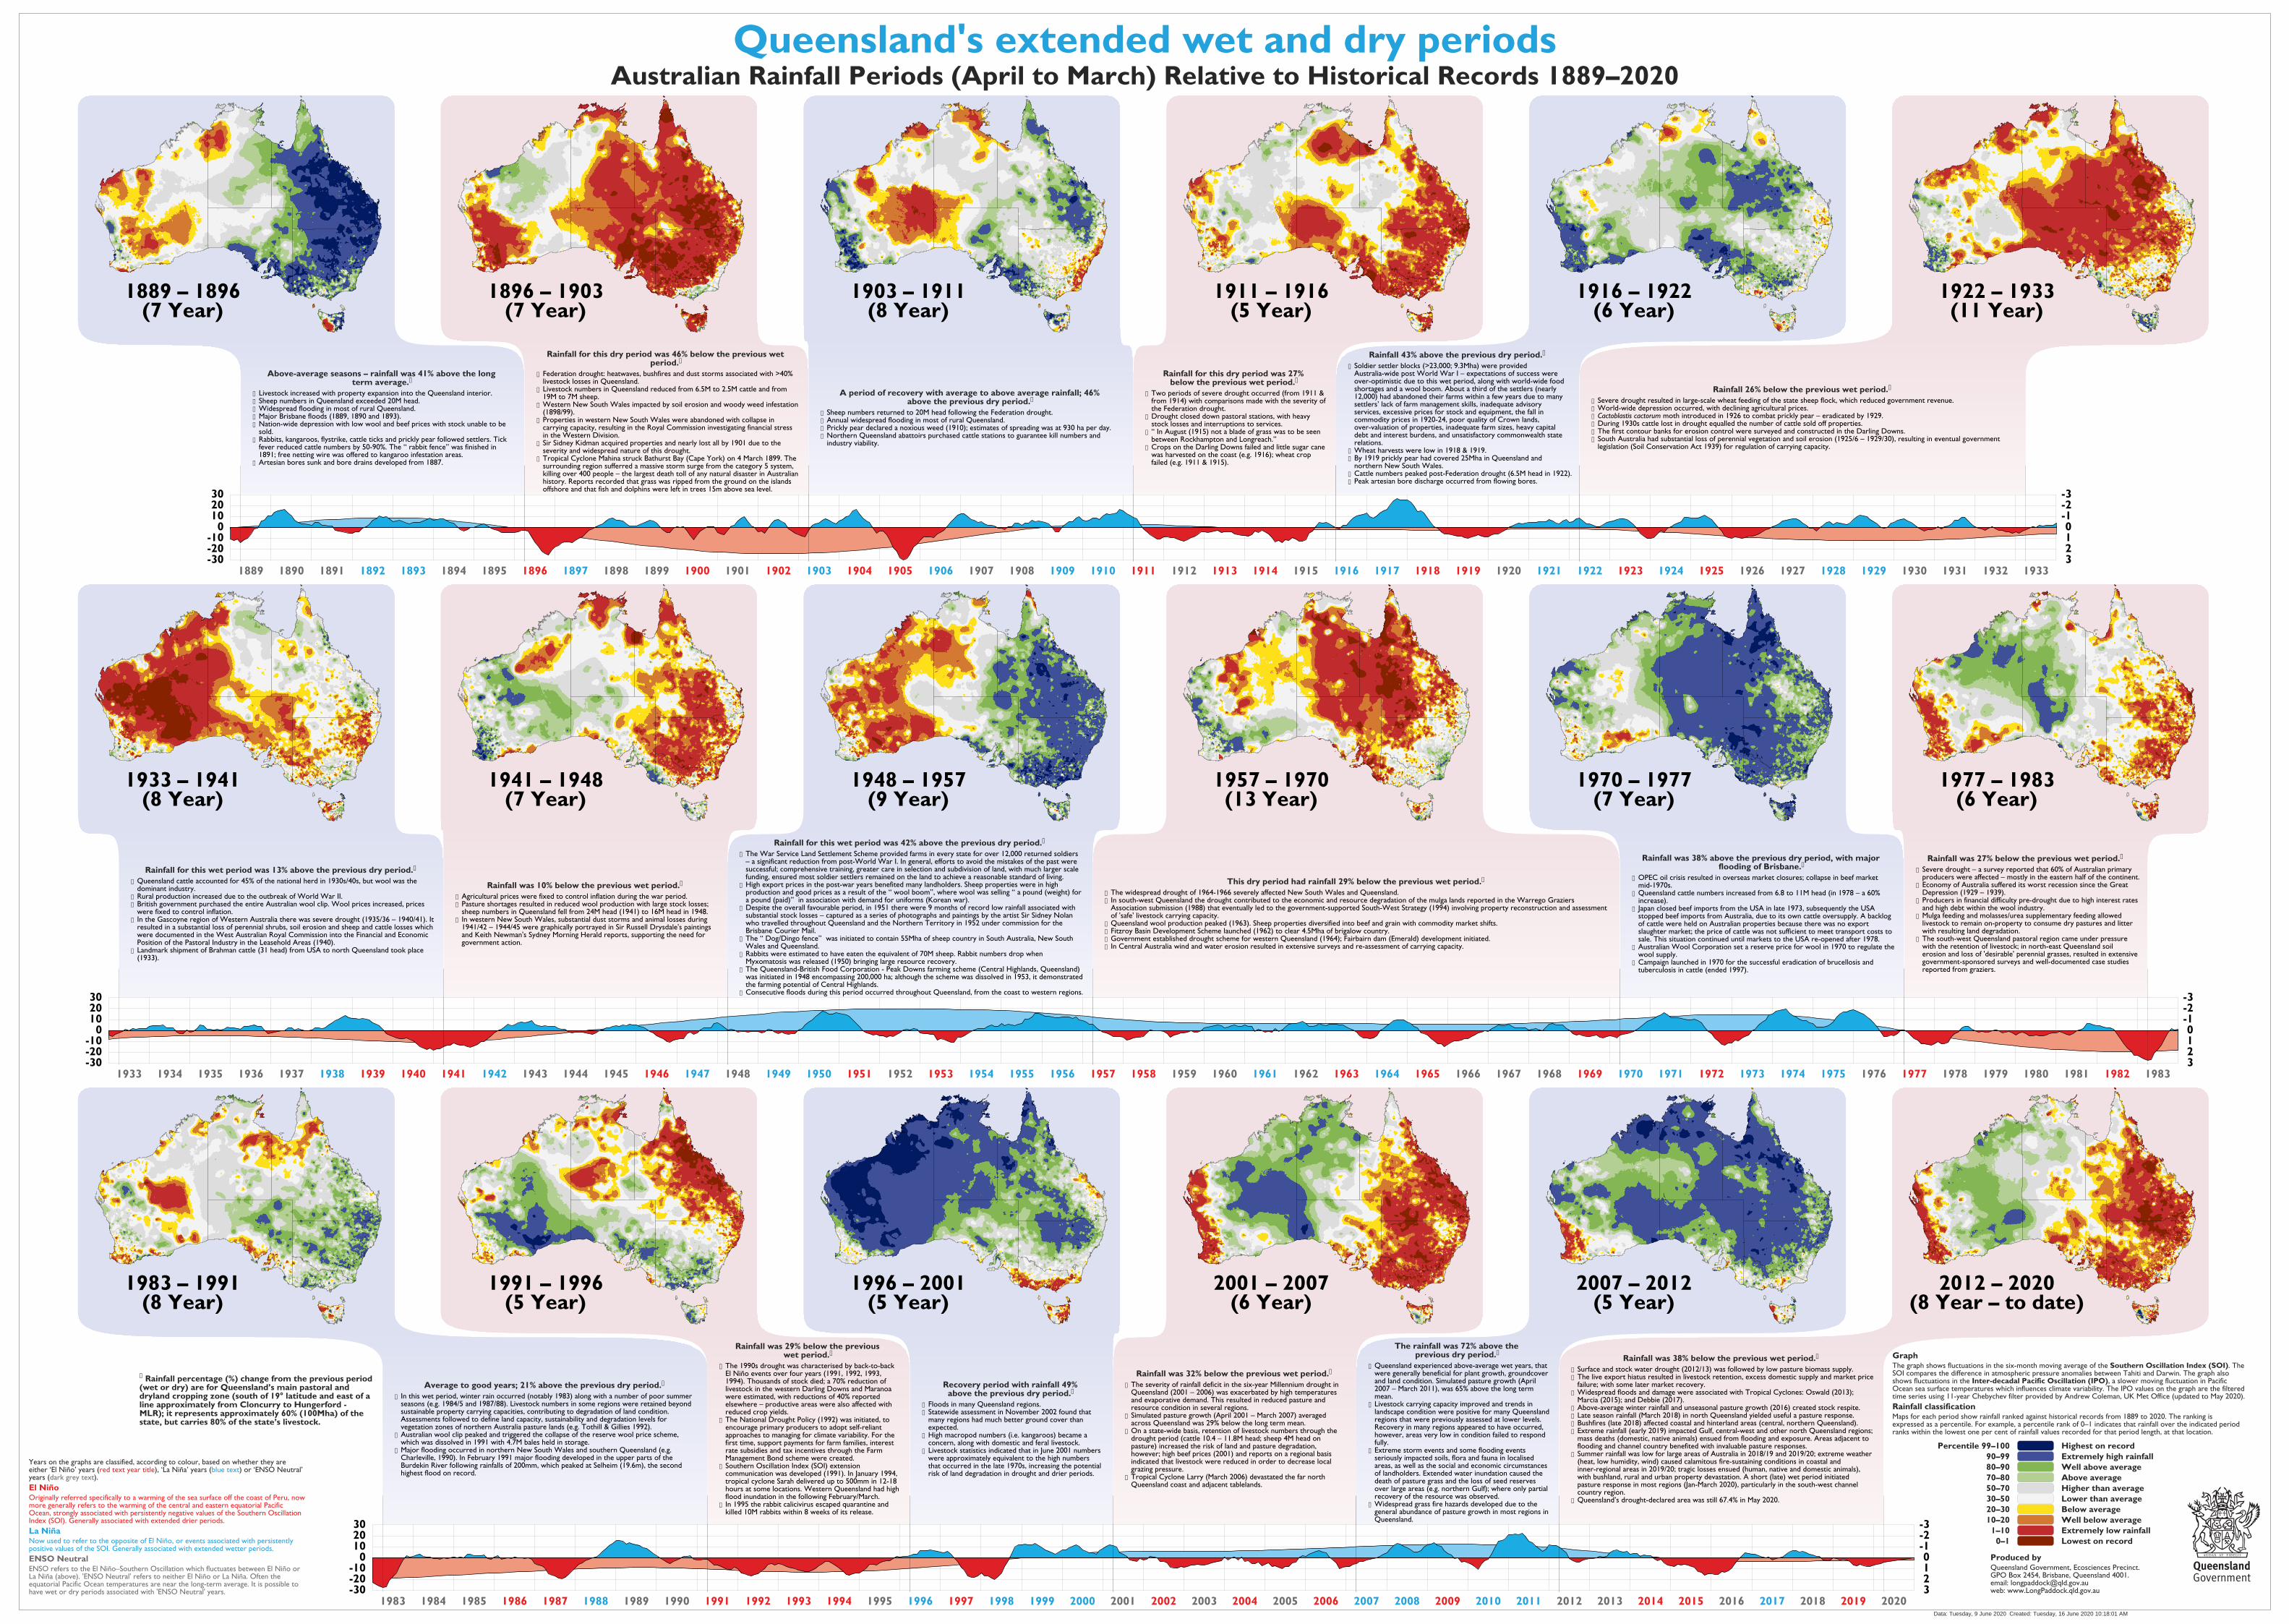
Queensland's extended wet and dry periodsAustralian Rainfall Periods (April to March) Relative to Historical Records 1889–2020

Data: Tuesday, 9 June 2020 Created: Tuesday, 16 June 2020 10:18:01 AM

0 010

-10

-1

1

20

-20

-2

2

30

-30

-3

31889 1890 1891 1892 1893 1894 1895 1896 1897 1898 1899 1900 1901 1902 1903 1904 1905 1906 1907 1908 1909 1910 1911 1912 1913 1914 1915 1916 1917 1918 1919 1920 1921 1922 1923 1924 1925 1926 1927 1928 1929 1930 1931 1932 1933

IPOSOI

1889 – 1896(7 Year)

Above-average seasons – rainfall was 41% above the longterm average.i

l Livestock increased with property expansion into the Queensland interior.l Sheep numbers in Queensland exceeded 20M head.l Widespread flooding in most of rural Queensland.l Major Brisbane floods (1889, 1890 and 1893).l Nation-wide depression with low wool and beef prices with stock unable to be

sold.l Rabbits, kangaroos, flystrike, cattle ticks and prickly pear followed settlers. Tick

fever reduced cattle numbers by 50-90%. The “ rabbit fence” was finished in1891; free netting wire was offered to kangaroo infestation areas.

l Artesian bores sunk and bore drains developed from 1887.

1896 – 1903(7 Year)

Rainfall for this dry period was 46% below the previous wetperiod.i

l Federation drought: heatwaves, bushfires and dust storms associated with >40%livestock losses in Queensland.

l Livestock numbers in Queensland reduced from 6.5M to 2.5M cattle and from19M to 7M sheep.

l Western New South Wales impacted by soil erosion and woody weed infestation(1898/99).

l Properties in western New South Wales were abandoned with collapse incarrying capacity, resulting in the Royal Commission investigating financial stressin the Western Division.

l Sir Sidney Kidman acquired properties and nearly lost all by 1901 due to theseverity and widespread nature of this drought.

l Tropical Cyclone Mahina struck Bathurst Bay (Cape York) on 4 March 1899. Thesurrounding region sufferred a massive storm surge from the category 5 system,killing over 400 people – the largest death toll of any natural disaster in Australianhistory. Reports recorded that grass was ripped from the ground on the islandsoffshore and that fish and dolphins were left in trees 15m above sea level.

1903 – 1911(8 Year)

A period of recovery with average to above average rainfall; 46%above the previous dry period.i

l Sheep numbers returned to 20M head following the Federation drought.l Annual widespread flooding in most of rural Queensland.l Prickly pear declared a noxious weed (1910); estimates of spreading was at 930 ha per day.l Northern Queensland abattoirs purchased cattle stations to guarantee kill numbers and

industry viability.

1911 – 1916(5 Year)

Rainfall for this dry period was 27%below the previous wet period.i

l Two periods of severe drought occurred (from 1911 &from 1914) with comparisons made with the severity ofthe Federation drought.

l Drought closed down pastoral stations, with heavystock losses and interruptions to services.

l “ In August (1915) not a blade of grass was to be seenbetween Rockhampton and Longreach.”

l Crops on the Darling Downs failed and little sugar canewas harvested on the coast (e.g. 1916); wheat cropfailed (e.g. 1911 & 1915).

1916 – 1922(6 Year)

Rainfall 43% above the previous dry period.i

l Soldier settler blocks (>23,000; 9.3Mha) were providedAustralia-wide post World War I – expectations of success wereover-optimistic due to this wet period, along with world-wide foodshortages and a wool boom. About a third of the settlers (nearly12,000) had abandoned their farms within a few years due to manysettlers’ lack of farm management skills, inadequate advisoryservices, excessive prices for stock and equipment, the fall incommodity prices in 1920-24, poor quality of Crown lands,over-valuation of properties, inadequate farm sizes, heavy capitaldebt and interest burdens, and unsatisfactory commonwealth staterelations.

l Wheat harvests were low in 1918 & 1919.l By 1919 prickly pear had covered 25Mha in Queensland and

northern New South Wales.l Cattle numbers peaked post-Federation drought (6.5M head in 1922).l Peak artesian bore discharge occurred from flowing bores.

1922 – 1933(11 Year)

Rainfall 26% below the previous wet period.i

l Severe drought resulted in large-scale wheat feeding of the state sheep flock, which reduced government revenue.l World-wide depression occurred, with declining agricultural prices.l Cactoblastis cactorum moth introduced in 1926 to combat prickly pear – eradicated by 1929.l During 1930s cattle lost in drought equalled the number of cattle sold off properties.l The first contour banks for erosion control were surveyed and constructed in the Darling Downs.l South Australia had substantial loss of perennial vegetation and soil erosion (1925/6 – 1929/30), resulting in eventual government

legislation (Soil Conservation Act 1939) for regulation of carrying capacity.

0 010

-10

-1

1

20

-20

-2

2

30

-30

-3

31933 1934 1935 1936 1937 1938 1939 1940 1941 1942 1943 1944 1945 1946 1947 1948 1949 1950 1951 1952 1953 1954 1955 1956 1957 1958 1959 1960 1961 1962 1963 1964 1965 1966 1967 1968 1969 1970 1971 1972 1973 1974 1975 1976 1977 1978 1979 1980 1981 1982 1983

IPOSOI

1933 – 1941(8 Year)

Rainfall for this wet period was 13% above the previous dry period.i

l Queensland cattle accounted for 45% of the national herd in 1930s/40s, but wool was thedominant industry.

l Rural production increased due to the outbreak of World War II.l British government purchased the entire Australian wool clip. Wool prices increased, prices

were fixed to control inflation.l In the Gascoyne region of Western Australia there was severe drought (1935/36 – 1940/41). It

resulted in a substantial loss of perennial shrubs, soil erosion and sheep and cattle losses whichwere documented in the West Australian Royal Commission into the Financial and EconomicPosition of the Pastoral Industry in the Leasehold Areas (1940).

l Landmark shipment of Brahman cattle (31 head) from USA to north Queensland took place(1933).

1941 – 1948(7 Year)

Rainfall was 10% below the previous wet period.i

l Agricultural prices were fixed to control inflation during the war period.l Pasture shortages resulted in reduced wool production with large stock losses;

sheep numbers in Queensland fell from 24M head (1941) to 16M head in 1948.l In western New South Wales, substantial dust storms and animal losses during

1941/42 – 1944/45 were graphically portrayed in Sir Russell Drysdale's paintingsand Keith Newman's Sydney Morning Herald reports, supporting the need forgovernment action.

1948 – 1957(9 Year)

Rainfall for this wet period was 42% above the previous dry period.i

l The War Service Land Settlement Scheme provided farms in every state for over 12,000 returned soldiers– a significant reduction from post-World War I. In general, efforts to avoid the mistakes of the past weresuccessful; comprehensive training, greater care in selection and subdivision of land, with much larger scalefunding, ensured most soldier settlers remained on the land to achieve a reasonable standard of living.

l High export prices in the post-war years benefited many landholders. Sheep properties were in highproduction and good prices as a result of the “ wool boom”, where wool was selling “ a pound (weight) fora pound (paid)” in association with demand for uniforms (Korean war).

l Despite the overall favourable period, in 1951 there were 9 months of record low rainfall associated withsubstantial stock losses – captured as a series of photographs and paintings by the artist Sir Sidney Nolanwho travelled throughout Queensland and the Northern Territory in 1952 under commission for theBrisbane Courier Mail.

l The “ Dog/Dingo fence” was initiated to contain 55Mha of sheep country in South Australia, New SouthWales and Queensland.

l Rabbits were estimated to have eaten the equivalent of 70M sheep. Rabbit numbers drop whenMyxomatosis was released (1950) bringing large resource recovery.

l The Queensland-British Food Corporation - Peak Downs farming scheme (Central Highlands, Queensland)was initiated in 1948 encompassing 200,000 ha; although the scheme was dissolved in 1953, it demonstratedthe farming potential of Central Highlands.

l Consecutive floods during this period occurred throughout Queensland, from the coast to western regions.

1957 – 1970(13 Year)

This dry period had rainfall 29% below the previous wet period.i

l The widespread drought of 1964-1966 severely affected New South Wales and Queensland.l In south-west Queensland the drought contributed to the economic and resource degradation of the mulga lands reported in the Warrego Graziers

Association submission (1988) that eventually led to the government-supported South-West Strategy (1994) involving property reconstruction and assessmentof 'safe' livestock carrying capacity.

l Queensland wool production peaked (1963). Sheep properties diversified into beef and grain with commodity market shifts.l Fitzroy Basin Development Scheme launched (1962) to clear 4.5Mha of brigalow country.l Government established drought scheme for western Queensland (1964); Fairbairn dam (Emerald) development initiated.l In Central Australia wind and water erosion resulted in extensive surveys and re-assessment of carrying capacity.

1970 – 1977(7 Year)

Rainfall was 38% above the previous dry period, with majorflooding of Brisbane.i

l OPEC oil crisis resulted in overseas market closures; collapse in beef marketmid-1970s.

l Queensland cattle numbers increased from 6.8 to 11M head (in 1978 – a 60%increase).

l Japan closed beef imports from the USA in late 1973, subsequently the USAstopped beef imports from Australia, due to its own cattle oversupply. A backlogof cattle were held on Australian properties because there was no exportslaughter market; the price of cattle was not sufficient to meet transport costs tosale. This situation continued until markets to the USA re-opened after 1978.

l Australian Wool Corporation set a reserve price for wool in 1970 to regulate thewool supply.

l Campaign launched in 1970 for the successful eradication of brucellosis andtuberculosis in cattle (ended 1997).

1977 – 1983(6 Year)

Rainfall was 27% below the previous wet period.i

l Severe drought – a survey reported that 60% of Australian primaryproducers were affected – mostly in the eastern half of the continent.

l Economy of Australia suffered its worst recession since the GreatDepression (1929 – 1939).

l Producers in financial difficulty pre-drought due to high interest ratesand high debt within the wool industry.

l Mulga feeding and molasses/urea supplementary feeding allowedlivestock to remain on-property to consume dry pastures and litterwith resulting land degradation.

l The south-west Queensland pastoral region came under pressurewith the retention of livestock; in north-east Queensland soilerosion and loss of 'desirable' perennial grasses, resulted in extensivegovernment-sponsored surveys and well-documented case studiesreported from graziers.

0 010

-10

-1

1

20

-20

-2

2

30

-30

-3

31983 1984 1985 1986 1987 1988 1989 1990 1991 1992 1993 1994 1995 1996 1997 1998 1999 2000 2001 2002 2003 2004 2005 2006 2007 2008 2009 2010 2011 2012 2013 2014 2015 2016 2017 2018 2019 2020

IPOSOI

1983 – 1991(8 Year)

Average to good years; 21% above the previous dry period.i

l In this wet period, winter rain occurred (notably 1983) along with a number of poor summerseasons (e.g. 1984/5 and 1987/88). Livestock numbers in some regions were retained beyondsustainable property carrying capacities, contributing to degradation of land condition.Assessments followed to define land capacity, sustainability and degradation levels forvegetation zones of northern Australia pasture lands (e.g. Tothill & Gillies 1992).

l Australian wool clip peaked and triggered the collapse of the reserve wool price scheme,which was dissolved in 1991 with 4.7M bales held in storage.

l Major flooding occurred in northern New South Wales and southern Queensland (e.g.Charleville, 1990). In February 1991 major flooding developed in the upper parts of theBurdekin River following rainfalls of 200mm, which peaked at Selheim (19.6m), the secondhighest flood on record.

1991 – 1996(5 Year)

Rainfall was 29% below the previouswet period.i

l The 1990s drought was characterised by back-to-backEl Niño events over four years (1991, 1992, 1993,1994). Thousands of stock died; a 70% reduction oflivestock in the western Darling Downs and Maranoawere estimated, with reductions of 40% reportedelsewhere – productive areas were also affected withreduced crop yields.

l The National Drought Policy (1992) was initiated, toencourage primary producers to adopt self-reliantapproaches to managing for climate variability. For thefirst time, support payments for farm families, interestrate subsidies and tax incentives through the FarmManagement Bond scheme were created.

l Southern Oscillation Index (SOI) extensioncommunication was developed (1991). In January 1994,tropical cyclone Sarah delivered up to 500mm in 12-18hours at some locations. Western Queensland had highflood inundation in the following February/March.

l In 1995 the rabbit calicivirus escaped quarantine andkilled 10M rabbits within 8 weeks of its release.

1996 – 2001(5 Year)

Recovery period with rainfall 49%above the previous dry period.i

l Floods in many Queensland regions.l Statewide assessment in November 2002 found that

many regions had much better ground cover thanexpected.

l High macropod numbers (i.e. kangaroos) became aconcern, along with domestic and feral livestock.

l Livestock statistics indicated that in June 2001 numberswere approximately equivalent to the high numbersthat occurred in the late 1970s, increasing the potentialrisk of land degradation in drought and drier periods.

2001 – 2007(6 Year)

Rainfall was 32% below the previous wet period.i

l The severity of rainfall deficit in the six-year Millennium drought inQueensland (2001 – 2006) was exacerbated by high temperaturesand evaporative demand. This resulted in reduced pasture andresource condition in several regions.

l Simulated pasture growth (April 2001 – March 2007) averagedacross Queensland was 29% below the long term mean.

l On a state-wide basis, retention of livestock numbers through thedrought period (cattle 10.4 – 11.8M head; sheep 4M head onpasture) increased the risk of land and pasture degradation,however; high beef prices (2001) and reports on a regional basisindicated that livestock were reduced in order to decrease localgrazing pressure.

l Tropical Cyclone Larry (March 2006) devastated the far northQueensland coast and adjacent tablelands.

2007 – 2012(5 Year)

The rainfall was 72% above theprevious dry period.i

l Queensland experienced above-average wet years, thatwere generally beneficial for plant growth, groundcoverand land condition. Simulated pasture growth (April2007 – March 2011), was 65% above the long termmean.

l Livestock carrying capacity improved and trends inlandscape condition were positive for many Queenslandregions that were previously assessed at lower levels.Recovery in many regions appeared to have occurred,however, areas very low in condition failed to respondfully.

l Extreme storm events and some flooding eventsseriously impacted soils, flora and fauna in localisedareas, as well as the social and economic circumstancesof landholders. Extended water inundation caused thedeath of pasture grass and the loss of seed reservesover large areas (e.g. northern Gulf); where only partialrecovery of the resource was observed.

l Widespread grass fire hazards developed due to thegeneral abundance of pasture growth in most regions inQueensland.

2012 – 2020(8 Year – to date)

Rainfall was 38% below the previous wet period.i

l Surface and stock water drought (2012/13) was followed by low pasture biomass supply.l The live export hiatus resulted in livestock retention, excess domestic supply and market price

failure; with some later market recovery.l Widespread floods and damage were associated with Tropical Cyclones: Oswald (2013);

Marcia (2015); and Debbie (2017).l Above-average winter rainfall and unseasonal pasture growth (2016) created stock respite.l Late season rainfall (March 2018) in north Queensland yielded useful a pasture response.l Bushfires (late 2018) affected coastal and hinterland areas (central, northern Queensland).l Extreme rainfall (early 2019) impacted Gulf, central-west and other north Queensland regions;

mass deaths (domestic, native animals) ensued from flooding and exposure. Areas adjacent toflooding and channel country benefited with invaluable pasture responses.

l Summer rainfall was low for large areas of Australia in 2018/19 and 2019/20; extreme weather(heat, low humidity, wind) caused calamitous fire-sustaining conditions in coastal andinner-regional areas in 2019/20; tragic losses ensued (human, native and domestic animals),with bushland, rural and urban property devastation. A short (late) wet period initiatedpasture response in most regions (Jan-March 2020), particularly in the south-west channelcountry region.

l Queensland’s drought-declared area was still 67.4% in May 2020.

MajorLivestockRegion

i Rainfall percentage (%) change from the previous period

(wet or dry) are for Queensland’s main pastoral anddryland cropping zone (south of 19° latitude and east of aline approximately from Cloncurry to Hungerford -MLR); it represents approximately 60% (100Mha) of thestate, but carries 80% of the state’s livestock.

Years on the graphs are classified, according to colour, based on whether they areeither ‘El Niño’ years (red text year title), ‘La Niña’ years (blue text) or ‘ENSO Neutral’years (dark grey text).

El NiñoOriginally referred specifically to a warming of the sea surface off the coast of Peru, nowmore generally refers to the warming of the central and eastern equatorial PacificOcean, strongly associated with persistently negative values of the Southern OscillationIndex (SOI). Generally associated with extended drier periods.

La NiñaNow used to refer to the opposite of El Niño, or events associated with persistentlypositive values of the SOI. Generally associated with extended wetter periods.

ENSO NeutralENSO refers to the El Niño–Southern Oscillation which fluctuates between El Niño orLa Niña (above). 'ENSO Neutral' refers to neither El Niño or La Niña. Often theequatorial Pacific Ocean temperatures are near the long-term average. It is possible tohave wet or dry periods associated with 'ENSO Neutral' years.

GraphThe graph shows fluctuations in the six-month moving average of the Southern Oscillation Index (SOI). TheSOI compares the difference in atmospheric pressure anomalies between Tahiti and Darwin. The graph alsoshows fluctuations in the Inter-decadal Pacific Oscillation (IPO), a slower moving fluctuation in PacificOcean sea surface temperatures which influences climate variability. The IPO values on the graph are the filteredtime series using 11-year Chebychev filter provided by Andrew Coleman, UK Met Office (updated to May 2020).

Rainfall classificationMaps for each period show rainfall ranked against historical records from 1889 to 2020. The ranking isexpressed as a percentile. For example, a percentile rank of 0–1 indicates that rainfall over the indicated periodranks within the lowest one per cent of rainfall values recorded for that period length, at that location.

Percentile 99–100 Highest on record

90–99 Extremely high rainfall

80–90 Well above average

70–80 Above average

50–70 Higher than average

30–50 Lower than average

20–30 Below average

10–20 Well below average

1–10 Extremely low rainfall

0–1 Lowest on record

Produced byQueensland Government, Ecosciences Precinct.GPO Box 2454, Brisbane, Queensland 4001.email: [email protected]: www.LongPaddock.qld.gov.au