8 april 2011 international roma day brussels, berlaymont bld
TRANSCRIPT

8 April 2011International Roma Day
Brussels, Berlaymont Bld
Territorial Targeting for Social Inclusion Drawing a European Extreme Poverty Map
Mapping Extreme Poverty Working Group
Center for Regional Research of the Hungarian Academy of SciencesMetropolitan Research Institute, Budapest
Open Society Foundations
April 8, 2011 1Metropolitan Research Institute
Structure of the presentation
Purpose and territorial relevance of the European Extreme Poverty Map
Sample maps: regional, micro‐regional level and sub‐settlement level
Policy impacts
Methodological and data issues to be resolved for Mapping Extreme Poverty
Conclusions
April 8, 2011 Metropolitan Research Institute 2
Purpose of the European Extreme Poverty Map
Combination
of tasks:–
Identify
pockets of poverty based on social and
economic indicators;
–
Measure
spatial concentration of poverty and regional inequalities;
–
Improve targeting
(allocation of funds and methods for programming);
–
Monitor achievements.
April 8, 2011 Metropolitan Research Institute 3
Territorial Relevance
Covering all countries of the European Union
National level
Regional level(NUTS3, 1303 units, 150‐800 thousand persons)
Micro‐regional level (NUTS4 or LAU1, 8,398 units, missing in 7 countries)
Settlement level(NUTS5 or LAU2, 121,601 units, available in all countries)
Sub‐settlement level especially in the urban context
April 8, 2011 Metropolitan Research Institute 4
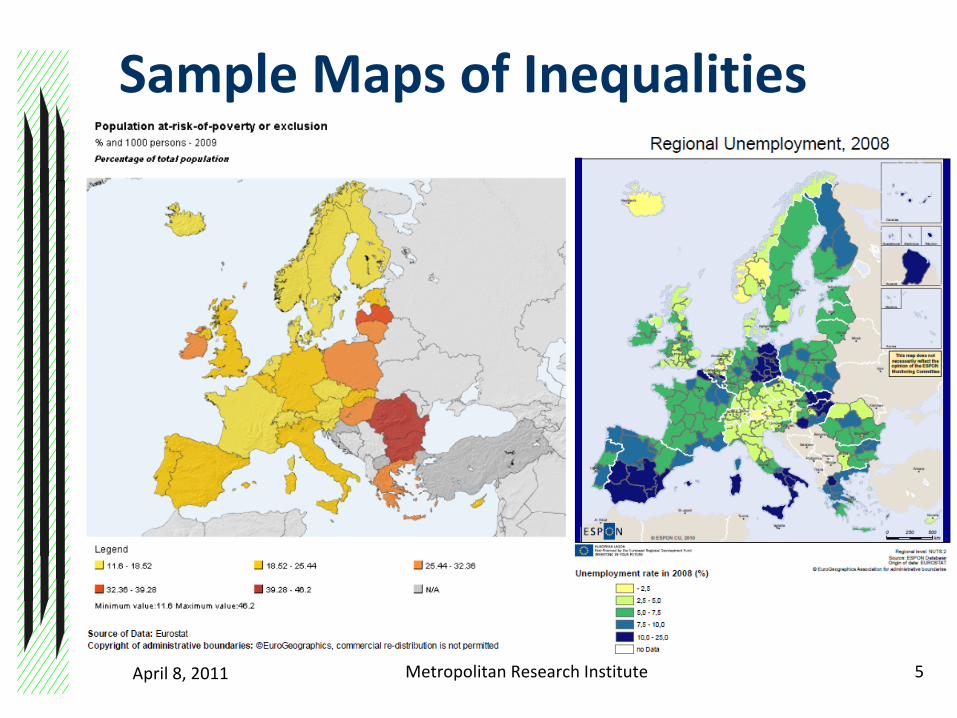
Sample Maps of Inequalities
April 8, 2011 Metropolitan Research Institute 5
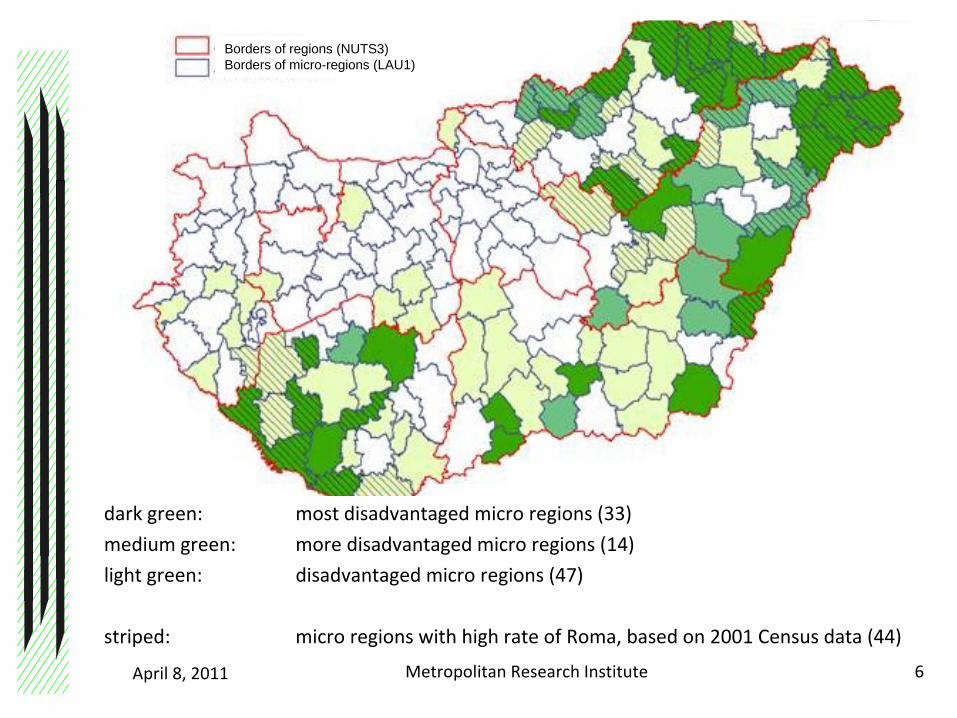
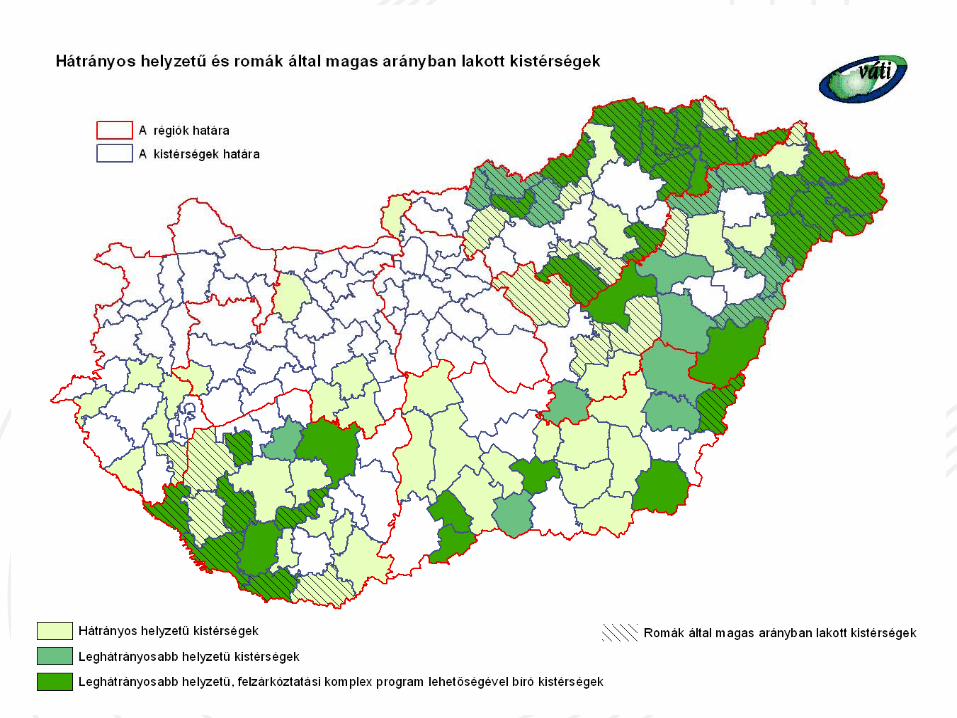
dark green:
most disadvantaged micro regions (33)
medium green:
more disadvantaged micro regions (14)
light green:
disadvantaged micro regions (47)
striped:
micro regions with high rate of Roma, based on 2001 Census data (44)
April 8, 2011 6Metropolitan Research Institute
Borders of regions (NUTS3)Borders of micro-regions (LAU1)
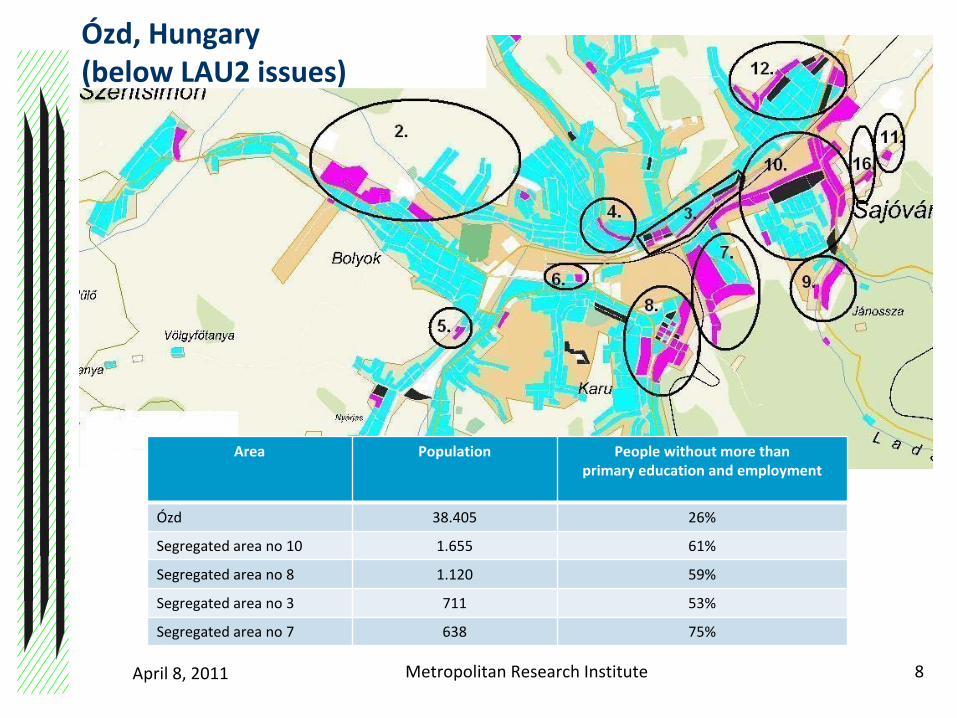
Area Population People without more than primary education and employment
Ózd 38.405 26%
Segregated area no 10 1.655 61%
Segregated area no 8 1.120 59%
Segregated area no 3 711 53%
Segregated area no 7 638 75%
Ózd, Hungary (below LAU2 issues)
April 8, 2011 8Metropolitan Research Institute
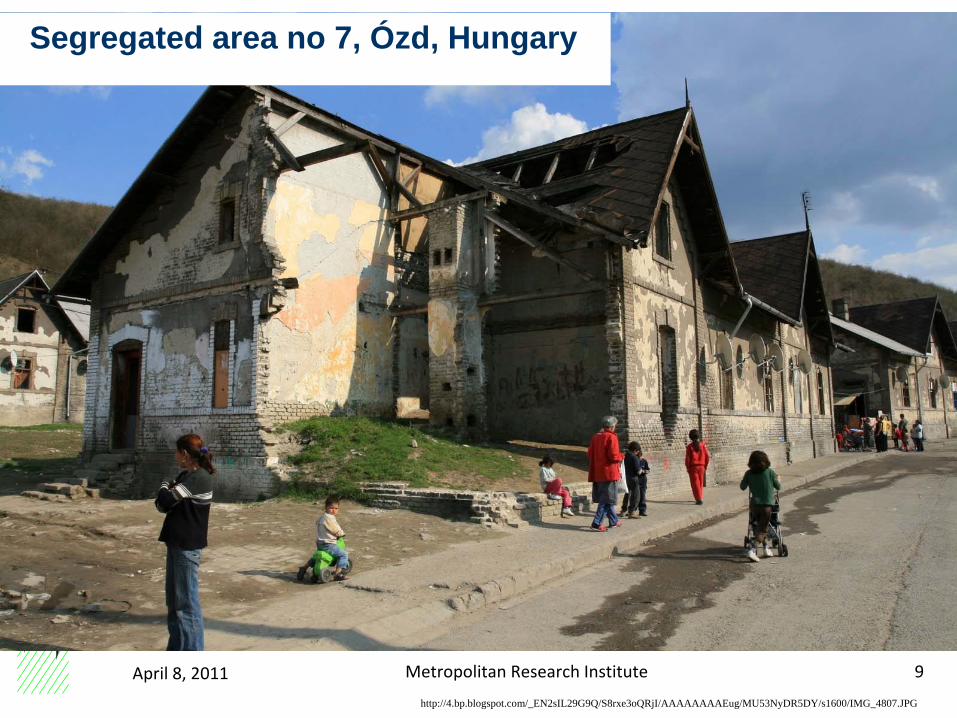
Segregated area no 7, Ózd, Hungary
April 8, 2011 9Metropolitan Research Institute
http://4.bp.blogspot.com/_EN2sIL29G9Q/S8rxe3oQRjI/AAAAAAAAEug/MU53NyDR5DY/s1600/IMG_4807.JPG
Expected policy impacts
Territorial targeting can be effective in use of
funds to areas
with high concentration of marginalised communities, including Roma, without allocating funds on ethnic grounds
In order to reach Roma by policy tools, territorial targeting
should be combined with equal opportunities guarantees, conditionality
In the designated areas, interventions should be of
integrated approach
combining housing, environment, social, employment, education, health, security and
community development measures, and linked to mainstream services
April 8, 2011 10Metropolitan Research Institute
Methodological issues
Trade‐off issues, still, targeting small problematic areas is more
important than breadth and complexity of indicators• Concentration of marginalised communities is at LAU1/NUTS4,
LAU2/NUTS5 or even below this level
LAU1/NUTS4 does not exist in some highly relevant Member
States, e.g. Romania, Spain
A very small number of robust indicators can surprisingly well
identify crisis areas (e.g. demographic, education and employment data show high correlation with further indicators)
Availability of data and ongoing data collections and
harmonisation of data among Member States, including 2011 Censuses, long history of such mapping exercises in the EU and
worldwide
April 8, 2011 11Metropolitan Research Institute
Drawing a European Extreme Poverty Map
Common methodology should be defined by the EU
Territorial level (e.g. LAU1/NUTS4, where it does not exist LAU2/NUTS5)
Main indicators (e.g. demography, education and employment)
Harmonised data for basic indicators collected
Sensible size of all „marked”
target areas
Maps can be drawn either by the EU or by the Member States
Full comparability between Member States is not needed (as maps will not serve for allocation of funds
among Member States)
Different indicators can be used for the same purpose (e.g. primary
education is not standardised across Member States)
Within limits, additional indicators can be usedApril 8, 2011 12Metropolitan Research Institute
April 8, 2011 Metropolitan Research Institute 13
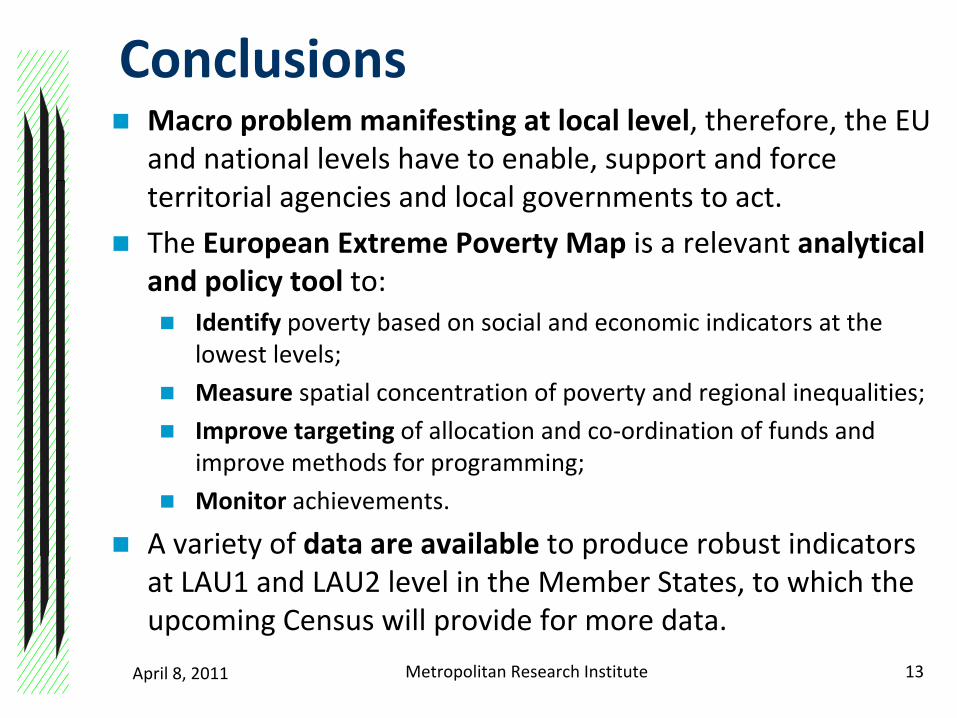
Conclusions
Macro problem manifesting at local level, therefore, the EU
and national levels
have to enable, support and force territorial agencies and
local governments to act.
The European Extreme Poverty Map is a relevant analytical
and policy tool to:
Identify poverty based on social and economic indicators at the lowest levels;
Measure spatial concentration of poverty and regional inequalities;
Improve targeting of allocation and co‐ordination of funds and improve methods for programming;
Monitor
achievements.
A variety of data are available to produce robust indicators
at LAU1 and LAU2 level in the Member States, to which the upcoming Census will provide for more data.
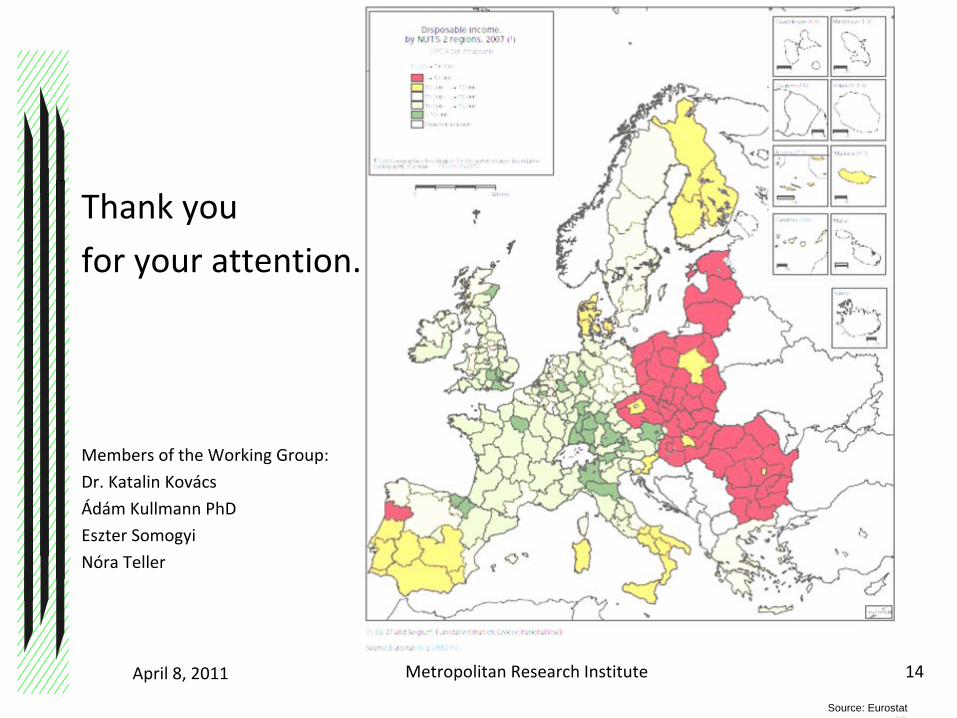
Thank you
for your attention.
Members of the Working Group:
Dr. Katalin
Kovács
Ádám
Kullmann
PhD
Eszter
Somogyi
Nóra
Teller
April
8, 2011 Metropolitan Research Institute 14
Source: Eurostat
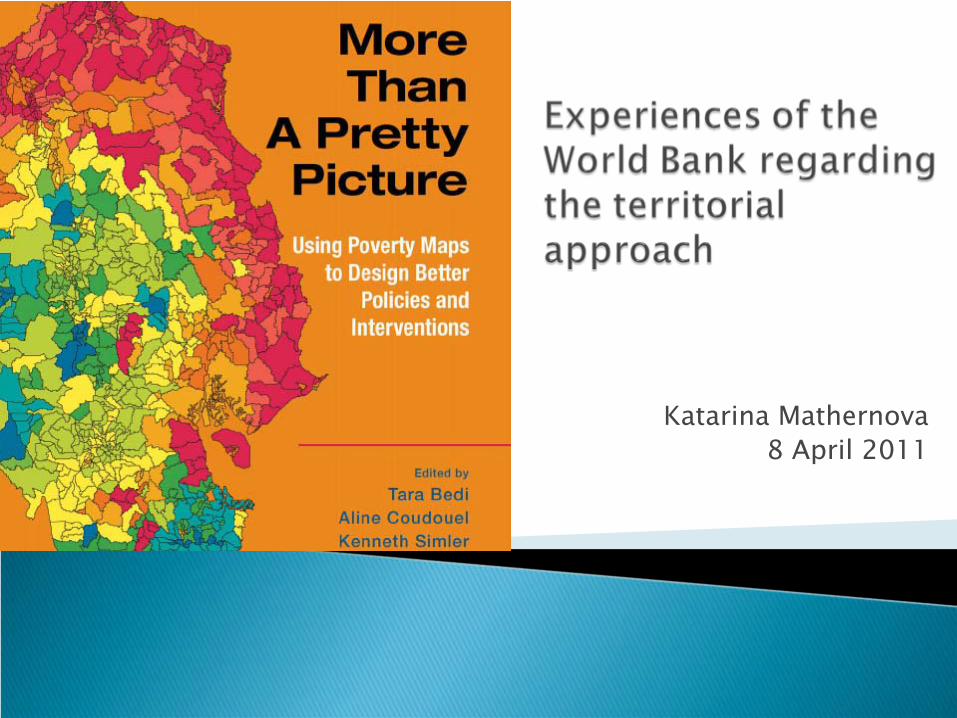
Katarina Mathernova 8 April 2011
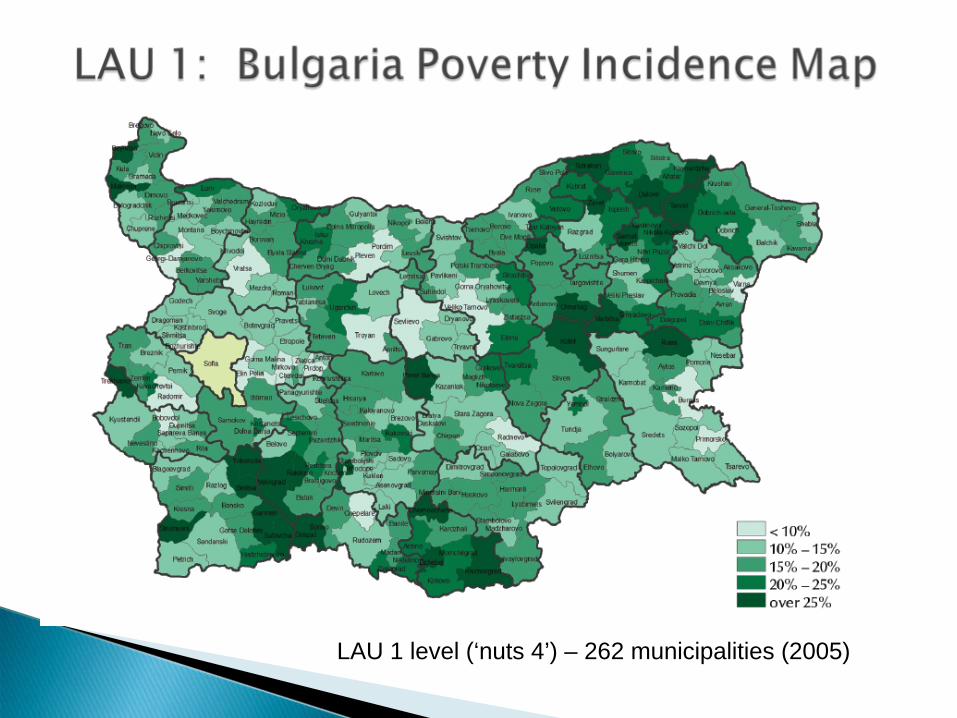
LAU 1 level (‘nuts 4’) – 262 municipalities (2005)
Economic Benefits of Roma Inclusion
Poverty mapping program at the World Bank
What are poverty maps? Going from high level NUTS to small LAU areas
Combining 2011 census information with EU-SILC survey information as a (potential) way to poverty mapping
Bulgaria poverty mapping case study
4 country study: Bulgaria, Czech Republic, Romania and Serbia
Majority populations in these countries are aging. Roma share of new labor market entrants is high and growing
Large employment gap. Biggest driver is the large educational gap, especially at the secondary level
Closing labor market gap can increase national incomes by up to Euro 5.5 billion and tax revenues by Euro 1.5 billion in these 4 countries
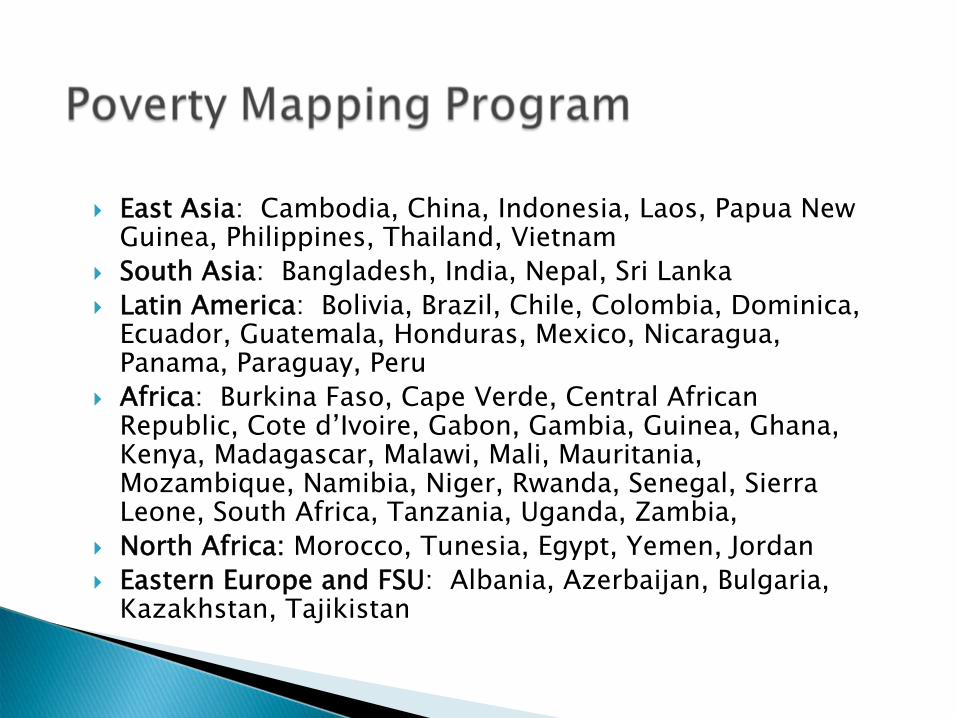
East Asia: Cambodia, China, Indonesia, Laos, Papua New Guinea, Philippines, Thailand, Vietnam
South Asia: Bangladesh, India, Nepal, Sri Lanka
Latin America: Bolivia, Brazil, Chile, Colombia, Dominica, Ecuador, Guatemala, Honduras, Mexico, Nicaragua, Panama, Paraguay, Peru
Africa: Burkina Faso, Cape Verde, Central African Republic, Cote d’Ivoire, Gabon, Gambia, Guinea, Ghana, Kenya, Madagascar, Malawi, Mali, Mauritania, Mozambique, Namibia, Niger, Rwanda, Senegal, Sierra Leone, South Africa, Tanzania, Uganda, Zambia,
North Africa:
Morocco, Tunesia, Egypt, Yemen, Jordan
Eastern Europe and FSU: Albania, Azerbaijan, Bulgaria, Kazakhstan, Tajikistan
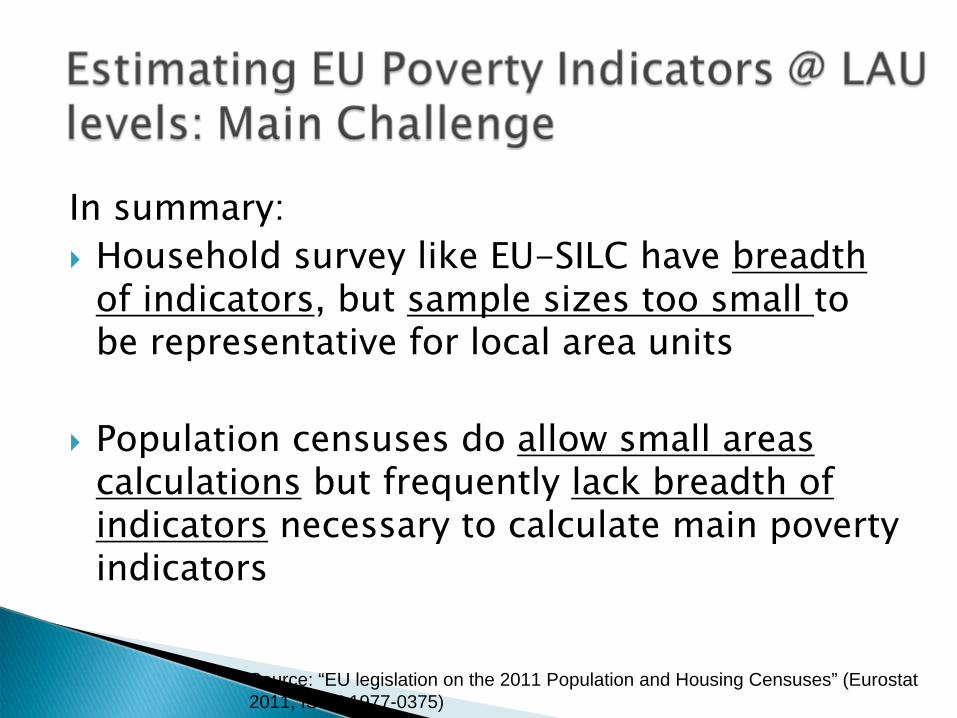
Source: “EU legislation on the 2011 Population and Housing Censuses” (Eurostat 2011, ISSN 1977-0375)
In summary:
Household survey like EU-SILC have breadth
of indicators, but sample sizes too small to be representative for local area units
Population censuses do allow small areas calculations
but frequently lack breadth of
indicators
necessary to calculate main poverty indicators
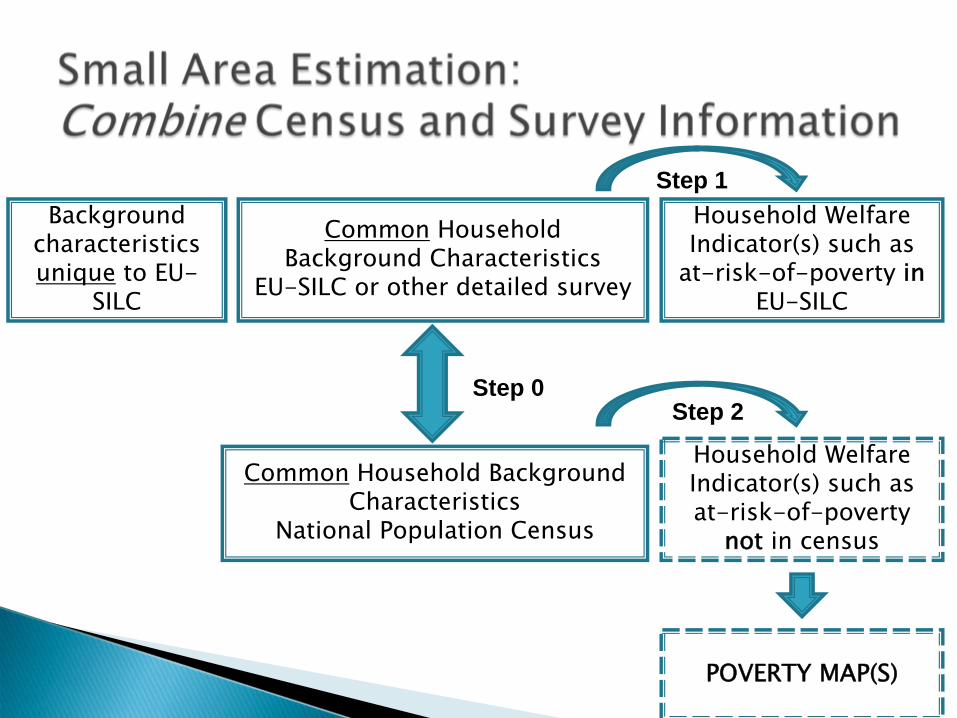
Common
Household Background Characteristics
EU-SILC or other detailed survey
Common
Household Background Characteristics
National Population Census
Background characteristics unique
to EU-
SILC
Household Welfare Indicator(s) such as
at-risk-of-poverty in EU-SILC
Step 0
Step 1
Household Welfare Indicator(s) such as at-risk-of-poverty
not in census
Step 2
POVERTY MAP(S)

LAU 1 level (‘nuts 4’) – 262 municipalities (2005)
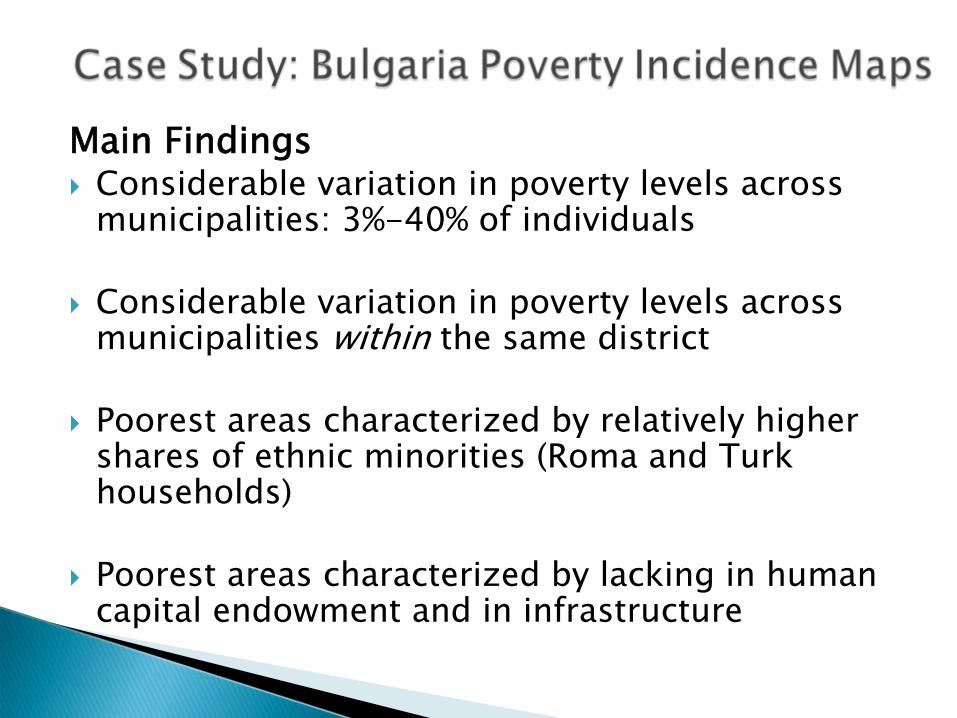
Main Findings
Considerable variation in poverty levels across municipalities: 3%-40% of individuals
Considerable variation in poverty levels across municipalities within the same district
Poorest areas characterized by relatively higher shares of ethnic minorities (Roma and Turk households)
Poorest areas characterized by lacking in human capital endowment and in infrastructure
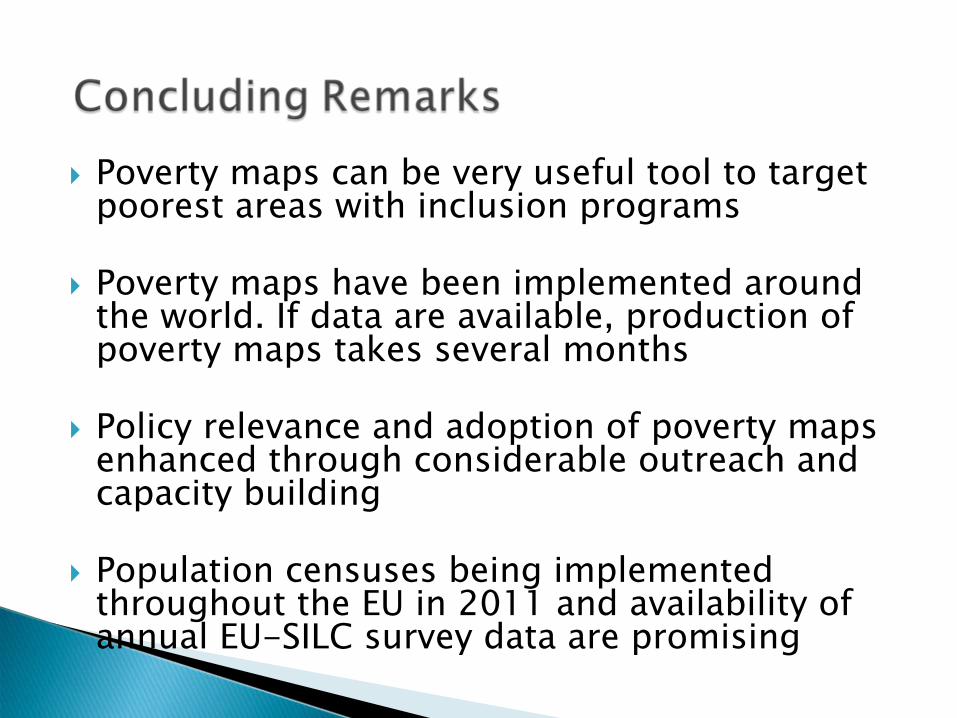
Poverty maps can be very useful tool to target poorest areas with inclusion programs
Poverty maps have been implemented around the world. If data are available, production of poverty maps takes several months
Policy relevance and adoption of poverty maps enhanced through considerable outreach and capacity building
Population censuses being implemented throughout the EU in 2011 and availability of annual EU-SILC survey data are promising
Az LHH program mint a roma integráció
eszköze
2011. április 8.
•
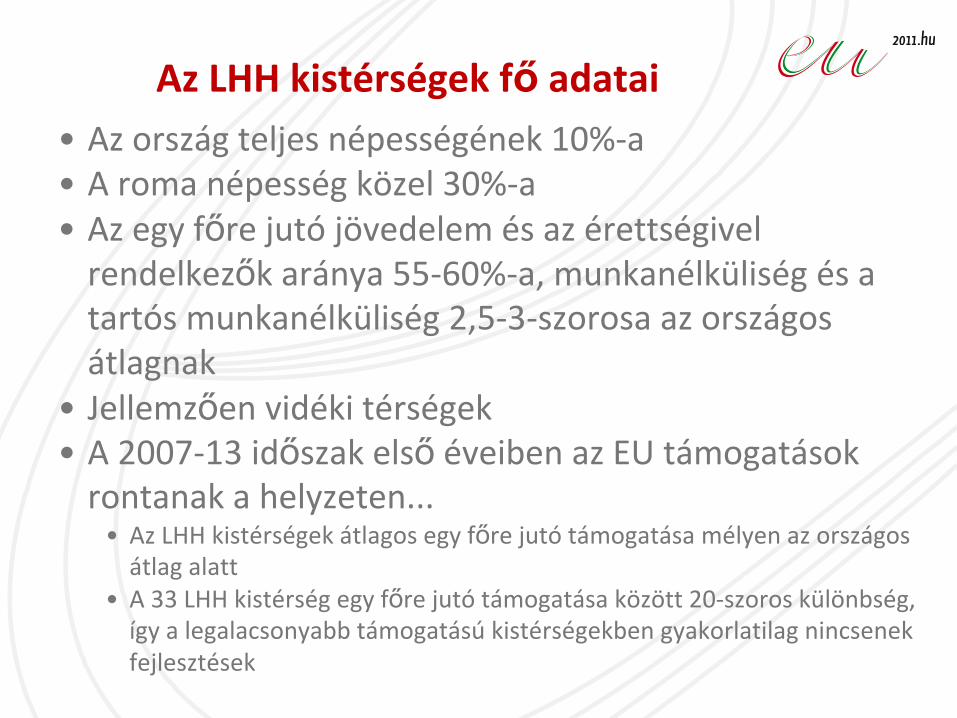
Az ország teljes népességének 10%‐a•
A roma népesség közel 30%‐a
•
Az egy főre jutó
jövedelem és az érettségivel rendelkezők aránya 55‐60%‐a, munkanélküliség és a
tartós munkanélküliség 2,5‐3‐szorosa az országos átlagnak
•
Jellemzően vidéki térségek•
A 2007‐13 időszak első
éveiben az EU támogatások
rontanak a helyzeten...•
Az LHH kistérségek átlagos egy főre jutó
támogatása mélyen az országos
átlag alatt•
A 33 LHH kistérség egy főre jutó
támogatása között 20‐szoros különbség,
így a legalacsonyabb támogatású
kistérségekben gyakorlatilag nincsenek fejlesztések
Az LHH kistérségek fő
adatai
•
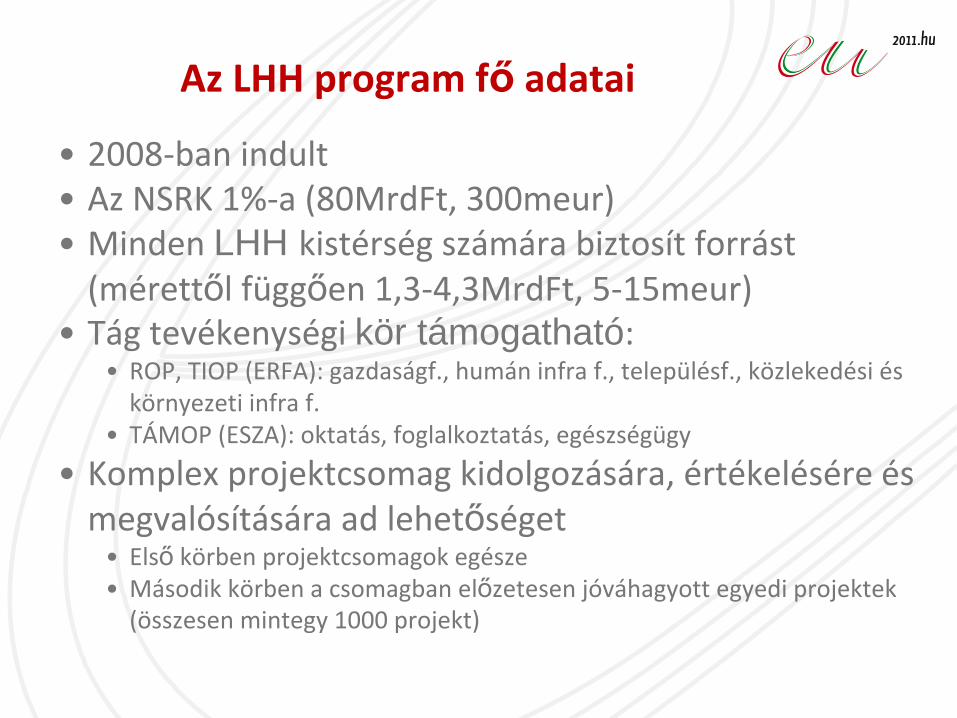
2008‐ban indult•
Az NSRK 1%‐a (80MrdFt, 300meur)
•
Minden LHH kistérség számára biztosít forrást (mérettől függően 1,3‐4,3MrdFt, 5‐15meur)
•
Tág tevékenységi kör támogatható: •
ROP, TIOP (ERFA): gazdaságf., humán infra
f., településf., közlekedési és
környezeti infra
f.•
TÁMOP (ESZA): oktatás, foglalkoztatás, egészségügy
•
Komplex projektcsomag kidolgozására, értékelésére és megvalósítására ad lehetőséget
•
Első
körben projektcsomagok egésze•
Második körben a csomagban előzetesen jóváhagyott egyedi projektek
(összesen mintegy 1000 projekt)
Az LHH program fő
adatai
•
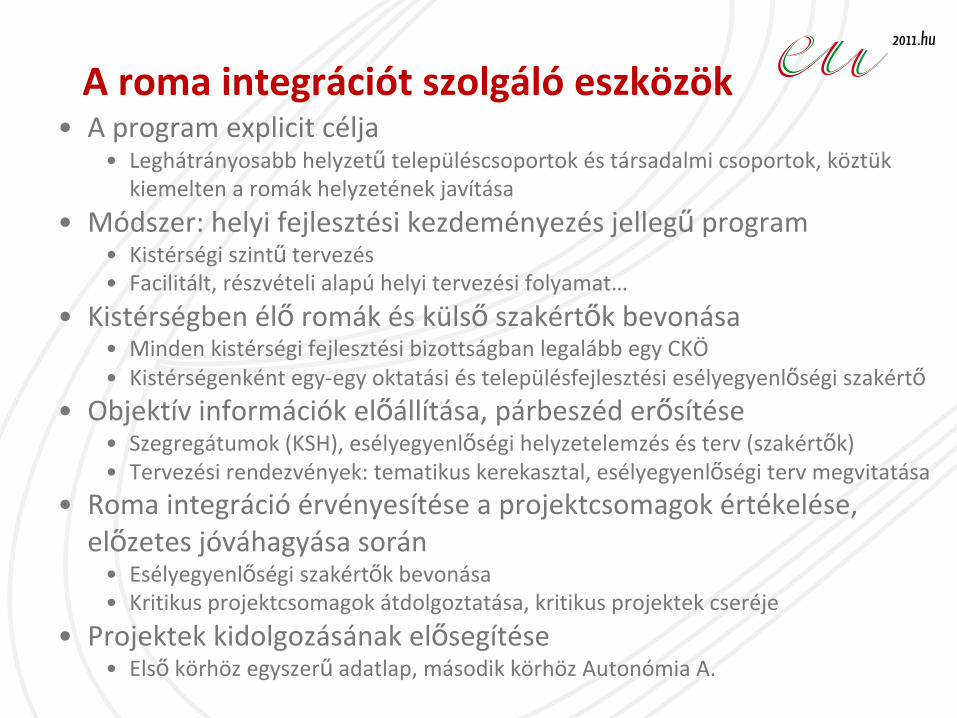
A program explicit célja•
Leghátrányosabb helyzetű
településcsoportok és társadalmi csoportok, köztük
kiemelten a romák helyzetének javítása
•
Módszer: helyi fejlesztési kezdeményezés jellegű
program•
Kistérségi szintű
tervezés
•
Facilitált, részvételi alapú
helyi tervezési folyamat…
•
Kistérségben élő
romák és külső
szakértők bevonása•
Minden kistérségi fejlesztési bizottságban legalább egy CKÖ
•
Kistérségenként egy‐egy oktatási és településfejlesztési esélyegyenlőségi szakértő
•
Objektív információk előállítása, párbeszéd erősítése•
Szegregátumok
(KSH), esélyegyenlőségi helyzetelemzés és terv (szakértők)
•
Tervezési rendezvények: tematikus kerekasztal, esélyegyenlőségi terv megvitatása
•
Roma integráció
érvényesítése a projektcsomagok értékelése, előzetes jóváhagyása során
•
Esélyegyenlőségi szakértők bevonása
•
Kritikus projektcsomagok átdolgoztatása, kritikus projektek cseréje
•
Projektek kidolgozásának elősegítése•
Első
körhöz egyszerű
adatlap, második körhöz Autonómia A.
A roma integrációt szolgáló
eszközök
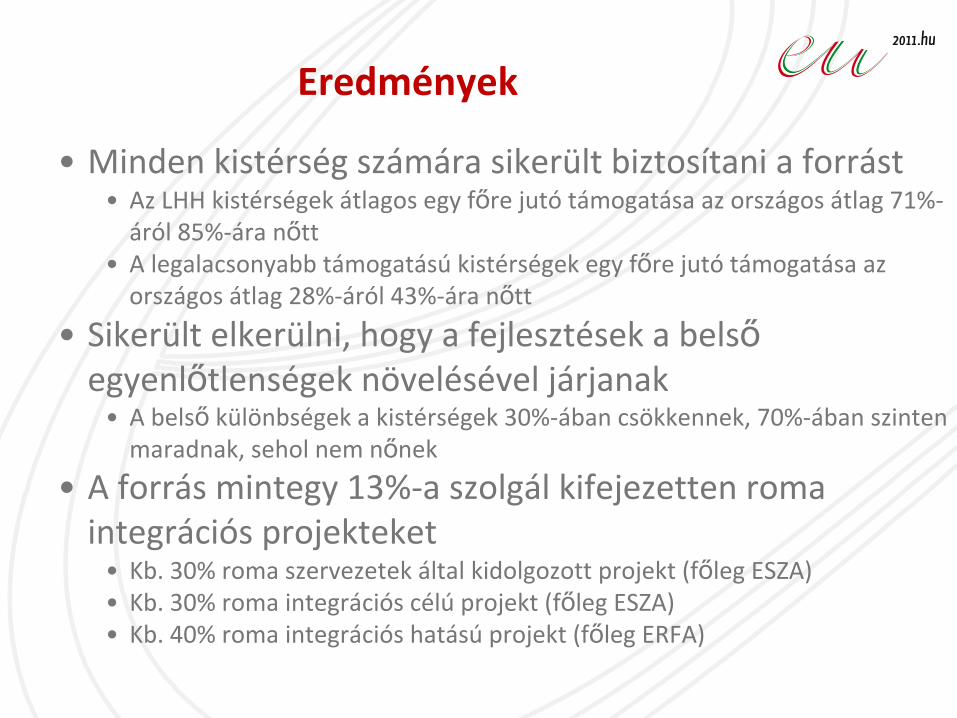
•
Minden kistérség számára sikerült biztosítani a forrást•
Az LHH kistérségek átlagos egy főre jutó
támogatása az országos átlag 71%‐
áról 85%‐ára nőtt•
A legalacsonyabb támogatású
kistérségek egy főre jutó
támogatása az
országos átlag 28%‐áról 43%‐ára nőtt•
Sikerült elkerülni, hogy a fejlesztések a belső
egyenlőtlenségek növelésével járjanak•
A belső
különbségek a kistérségek 30%‐ában csökkennek, 70%‐ában szinten
maradnak, sehol nem nőnek•
A forrás mintegy 13%‐a szolgál kifejezetten roma
integrációs projekteket•
Kb. 30% roma szervezetek által kidolgozott projekt (főleg ESZA)
•
Kb. 30% roma integrációs célú
projekt (főleg ESZA)•
Kb. 40% roma integrációs hatású
projekt (főleg ERFA)
Eredmények
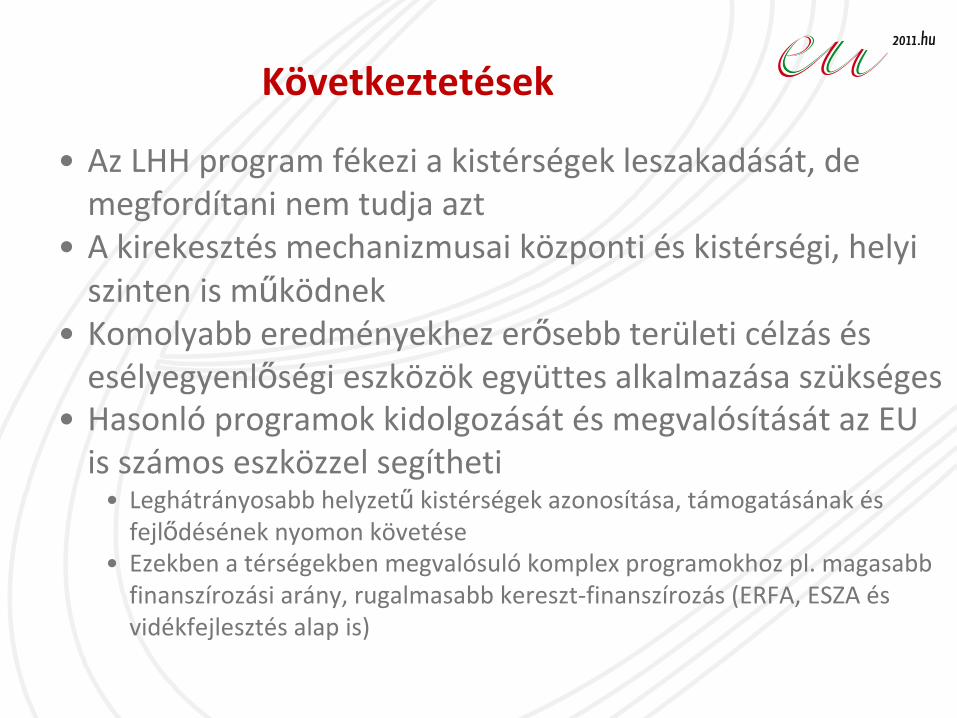
•
Az LHH program fékezi a kistérségek leszakadását, de megfordítani nem tudja azt
•
A kirekesztés mechanizmusai központi és kistérségi, helyi szinten is működnek
•
Komolyabb eredményekhez erősebb területi célzás és esélyegyenlőségi eszközök együttes alkalmazása szükséges
•
Hasonló
programok kidolgozását és megvalósítását az EU is számos eszközzel segítheti
•
Leghátrányosabb helyzetű
kistérségek azonosítása, támogatásának és fejlődésének nyomon követése
•
Ezekben a térségekben megvalósuló
komplex programokhoz pl. magasabb finanszírozási arány, rugalmasabb kereszt‐finanszírozás (ERFA, ESZA és
vidékfejlesztés alap is)
Következtetések
Köszönöm a megtisztelő
figyelmet
José
Manuel Fresno8 April 2011
V European Platform for Roma InclusionPanel 2: Integrated Approach in Practice
Local approach is necessary but functions more effectively within the framework of a national strategy.
Added value of designing simultaneously national and local approaches, which feed into each other:
Allows to work from a holistic perspective adapted to territorial needs.
Creation of synergies.
Allows economies of scale, and scaling up successful experiences.
Quicker transfer of knowledge.
Flexibility in the face of changing circumstances.
Maintain issues on the political agenda at the national level.
Eg: Fight Against Discrimination Operational Programme.
Structural impact is achieved through cross-
cutting policies.
Need policies specifically aimed at Roma to compensate disadvantages in order to:◦
Remove barriers and facilitate access to mainstream services through a process of accompaniment. ◦
Compensate disadvantages and bridge gaps between Roma and the majority population.◦
Adapt general services to Roma needs.◦
Specific services must always lead to normalisation.◦
Achieve Roma involvement in society.
But targeted projects are only effective if they are designed in the framework of universal public policies and inclusive services in health, employment, education, housing.◦
Excessively targeted and uncoordinated approaches in Spain have proven to be inadequate.◦
Targeted policies benefitted primarily from their alignment and synergies with inclusive mainstream policies and services.
Eg: General housing and habitat policies.
EC Communication: 4 axes of intervention (education, employment, health, housing).
Allows for integrated interventions within specific localities or micro-regions.
Often however, resources are insufficient and only allow to approach issues through one of the axes, but it must be done coherently, attempting to find synergies with other areas.
The bedrock must be the development of inclusive social policies
to deal with inequalities and exclusion, of course by taking culture and identity into consideration. A Roma person is first a person (human rights), then a citizen (social rights) and then a Roma (cultural rights), and not the other way round.
Eg: Experience from FSG programmes shows that if services cover adequately all parts of the insertion itinerary, there is a high
probability of success.
Avoid pendulum in policy approach: not targeted then territorial. Need for combination of both, within the framework of universal, nationwide policies.
Territorial approach is indispensable and the most coherent way to tackle people’s needs (that are Roma needs).
But territorial approach cannot be used exclusively, because it must take into account specificities of groups within micro-regions.
Micro-region approach does not always guarantee the inclusion of Roma:◦
Previous European and national initiatives demonstrate that sometimes Roma are even excluded from territorial policies against exclusion.
Take into account different situations in Europe. Easy to identify Roma, concentrated in relatively homogenous micro-regions in some countries, but in the Spanish context they are spread territorially or in different neighbourhoods in urban contexts.
Eg: Key issue is to achieve a win-win situation, whereby everyone wins if Roma win.
Need to differentiate data collection issues at the national and local/project levels.
Statistical studies and surveys at the national level can help to identify fundamental problems, tendencies and needs without a need for a national census disaggregated by ethnicity.
At the local level, it is indispensable to measure the impact and evolution of policies, results in terms of cost-benefit. ◦
Precise information to assess developments and transfer knowledge is required, based on clear, measurable indicators in the four social fields.◦
For this reason, data collection disaggregated by gender, age and ethnicity
is needed.
Barriers are not in the law or the resistance of the Roma to self-identification,
but in the inadequate
interpretation of the law, the lack of proper tools and mechanisms to collect and exploit data.
Eg: Spain does not have a tradition of ethnic data collection, yet Acceder acts as observatory providing detailed, up-to-date information based on data provided by the beneficiaries. Longitudinal studies at the national level and observatories at the local level.