a. case abstract -...
TRANSCRIPT

Copyright © 2017 Pearson Education, Inc.
1
Dunkin’ Brands Group Inc. – 2015
Forest R. David
A. Case Abstract
Headquartered in Canton, Massachusetts, Dunkin’ Brands (Dunkin’) sells hot and cold coffee and baked goods, as well as hard-serve ice cream, using a near-100 percent franchised business model. With 11,000 Dunkin’ Donuts restaurants in 40 states and 32 foreign countries, and 7,300 Baskin-Robbins restaurants in 43 states and 46 foreign countries, Dunkin’ is one of the world’s largest franchisors of quick-service restaurants (QSR). All but 36 Dunkin’ Donuts and Baskin-Robbins are franchisee-owned. In the last few years, more and more customers are coming into Dunkin’ restaurants and spending more and more money when they are there. About 70 percent of all Dunkin’ stores have a drive thru, which caters to consumers in a hurry. Dunkin’ is a speed leader among QSR, even given increased ticket volume and menu complexity.
B. Vision Statement (actual) To be recognized as a company that responsibly serves our guests, franchisees, employees, communities, business partners, and the interests of our planet.
(Proposed) Our vision is to be recognized as having the most responsible brands with unbeatable quality, affordability, and convenience in baked goods, coffee and ice cream specialty products.
C. Mission Statement (proposed) Dunkin’ Brands aspires to be the leading company in the coffee, donut, and ice cream industries (3) by providing baked goods, coffee, and ice cream specialty products (2) to busy consumers (1) worldwide. We pride ourselves on offering superior quality, service, and convenience. (7) We are committed to responsibly serving (6) our customers, franchisees, employees (9), and communities, while focusing on a sustainable and green future. (8) We seek to be the leading quick service restaurant in our industries by keeping up with the latest technologies (4) and insight to grow sales (5).
1. Customers 2. Products or services 3. Markets 4. Technology 5. Concern for survival, growth, and profitability 6. Philosophy 7. Self-concept 8. Concern for public image 9. Concern for employees

Copyright © 2017 Pearson Education, Inc.
2
D. External Audit
Opportunities
1. There is a growing demand for catering services or home and office delivery. 2. Consumers are searching for healthier foods: IBIS expects the healthy eating index to rise 2.6%
from 2015-2019. 3. Increasing demand for products to be sold in retail stores: 29% of coffee drinkers said they use a
single-cup brewer to get their daily caffeine fix. 4. Breakfast sandwiches are the new burgers; breakfast sales at fast-food chains increased by 4.8%
annually from 2007-2012. 5. Gluten free allergies are becoming more prominent in the US. About 20 million Americans have
celiac disease and 30-50% of the population have gluten sensitivity. 6. Although the price of coffee has increased, the consumption will continue to slowly increase at an
annualized rate of 1.3% in the next five years. 7. Lactose intolerant products are a major worldwide need. Two-thirds of the world's adult
population have trouble digesting milk. 8. Due to the health benefits of tea, consumption is projected to rise at an annualized rate of 1.0%
over the next five years. 9. Low interest rates to refinance outstanding debt or expand. 10. Disposable income in the US will grow at a rate of 2.5% over the next five years. Threats
1. Price of coffee is projected to increase by 1.5% each year for the next five years. 2. Starbucks is going to be offering home and office delivery in select markets in late 2015 through
Postmates. 3. Consumers are searching for healthier foods: IBIS expects the healthy eating index to rise 2.6%
from 2015-2019. 4. Tim Hortons has a gluten-free coconut macaroon. 5. About 40 million Americans are lactose intolerant. This also affects different ethnic and racial
groups. Based on research, 90% of the Asian population is lactose intolerant. 6. Starbucks K-Cups sales increased 47% in 2013. 7. Restaurant Brands International purchased Tim Hortons and will most likely expand into the US.
Canada also has a lower tax rate than Dunkin' Brands does in the US. 8. Krispy Kreme launches Hot light android app. 9. Starbucks has acquired Teavana Holdings. 10. Starbucks has a loyalty program where customers receive stars for buying products in stores and at
grocery stores and other retail locations.

Copyright © 2017 Pearson Education, Inc.
3
Competitive Profile Matrix
Dunkin’ Brands enjoys a distinct advantage over Starbucks on pricing but the firm is struggling mightily on its debt load with over $1.8 billion in long-term debt as of fiscal year end 2014. Dunkin’ is difficult to compare to rivals Starbucks and Krispy Kreme since Dunkin’ also offers Baskin-Robbins ice cream and Starbucks does not offer donuts at all. Nevertheless, Dunkin’ Brands clearly competes with Starbucks on the morning coffee business.
EFE Matrix
Weight Rating Score Rating Score Rating Score0.06 2 0.12 4 0.24 1 0.060.11 3 0.33 1 0.11 2 0.220.08 2 0.16 4 0.32 3 0.240.10 4 0.40 3 0.30 2 0.200.09 3 0.27 4 0.36 1 0.090.12 3 0.36 4 0.48 1 0.120.09 3 0.27 4 0.36 2 0.180.05 3 0.15 4 0.20 1 0.050.07 2 0.14 4 0.28 3 0.210.08 2 0.16 4 0.32 3 0.240.11 1 0.11 4 0.44 2 0.220.04 2 0.08 4 0.16 3 0.121.00 2.55 3.57 1.95
Store Locations Customer Service Product QualityDebt Ratio
Critical Success Factors
Dunkin' Brands Starbucks Krispy Kreme
Market ShareProduct Line
AdvertisingPrice CompetitivenessFinancial Position Customer LoyaltyGlobal Expansion
TotalsEmployee Dedication
Opportunities Weight Rating Weighted Score1. There is a growing demand for catering services or home and
office delivery.0.07 1 0.07
2. Consumers are searching for healthier foods: IBIS expects the healthy eating index to rise 2.6% from 2015-2019. 0.06 2 0.12
3. Increasing demand for products to be sold in retail stores: 29% of coffee drinkers said they use a single-cup brewer to get their daily caffeine fix.
0.05 3 0.15
4. Breakfast sandwiches are the new burgers; breakfast sales at fast-food chains increased by 4.8% annually from 2007-2012.
0.05 3 0.15
5. Gluten free allergies are becoming more prominent in the US. About 20 million Americans have celiac disease and 30-50% of the population have gluten sensitivity.
0.05 1 0.05
6. Although the price of coffee has increased, the consumption will continue to slowly increase at an annualized rate of 1.3% in the next five years.
0.05 2 0.10
7. Lactose intolerant products are a major worldwide need. Two-thirds of the world's adult population have trouble digesting milk.
0.05 1 0.05
8. Due to the health benefits of tea, consumption is projected to rise at an annualized rate of 1.0% over the next five years.
0.04 2 0.08
9. Low interest rates to refinance outstanding debt or expand. 0.03 2 0.0610. Disposable income in the US will grow at a rate of 2.5% over the
next five years. 0.02 2 0.04
Copyright © 2017 Pearson Education, Inc.
4
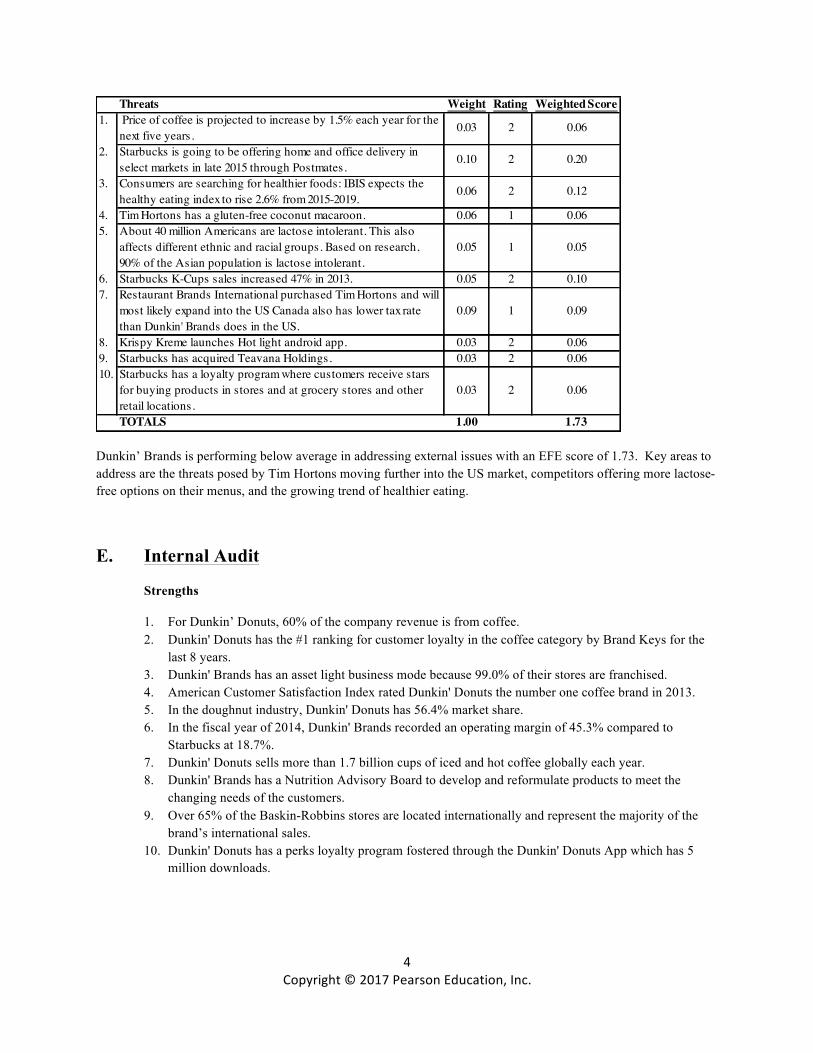
Dunkin’ Brands is performing below average in addressing external issues with an EFE score of 1.73. Key areas to address are the threats posed by Tim Hortons moving further into the US market, competitors offering more lactose-free options on their menus, and the growing trend of healthier eating.
E. Internal Audit
Strengths
1. For Dunkin’ Donuts, 60% of the company revenue is from coffee. 2. Dunkin' Donuts has the #1 ranking for customer loyalty in the coffee category by Brand Keys for the
last 8 years. 3. Dunkin' Brands has an asset light business mode because 99.0% of their stores are franchised. 4. American Customer Satisfaction Index rated Dunkin' Donuts the number one coffee brand in 2013. 5. In the doughnut industry, Dunkin' Donuts has 56.4% market share. 6. In the fiscal year of 2014, Dunkin' Brands recorded an operating margin of 45.3% compared to
Starbucks at 18.7%. 7. Dunkin' Donuts sells more than 1.7 billion cups of iced and hot coffee globally each year. 8. Dunkin' Brands has a Nutrition Advisory Board to develop and reformulate products to meet the
changing needs of the customers. 9. Over 65% of the Baskin-Robbins stores are located internationally and represent the majority of the
brand’s international sales. 10. Dunkin' Donuts has a perks loyalty program fostered through the Dunkin' Donuts App which has 5
million downloads.
Threats Weight Rating Weighted Score1. Price of coffee is projected to increase by 1.5% each year for the
next five years.0.03 2 0.06
2. Starbucks is going to be offering home and office delivery in select markets in late 2015 through Postmates.
0.10 2 0.20
3. Consumers are searching for healthier foods: IBIS expects the healthy eating index to rise 2.6% from 2015-2019.
0.06 2 0.12
4. Tim Hortons has a gluten-free coconut macaroon. 0.06 1 0.065. About 40 million Americans are lactose intolerant. This also
affects different ethnic and racial groups. Based on research, 90% of the Asian population is lactose intolerant.
0.05 1 0.05
6. Starbucks K-Cups sales increased 47% in 2013. 0.05 2 0.107. Restaurant Brands International purchased Tim Hortons and will
most likely expand into the US Canada also has lower tax rate than Dunkin' Brands does in the US.
0.09 1 0.09
8. Krispy Kreme launches Hot light android app. 0.03 2 0.069. Starbucks has acquired Teavana Holdings. 0.03 2 0.0610. Starbucks has a loyalty program where customers receive stars
for buying products in stores and at grocery stores and other retail locations.
0.03 2 0.06
TOTALS 1.00 1.73
Copyright © 2017 Pearson Education, Inc.
5
Weaknesses
1. Only 35% of Dunkin’ Donuts sales come after 11 AM whereas Starbucks is 60%. 2. The assets of Dunkin' Brands are financed with 88.42% debt and 11.58% equity. The company is
approximately $1.8 billion in debt and highly leveraged. 3. In the Coffee and Snack Shops Industry in the US, Dunkin' Donuts has a 25.5% market share behind
Starbucks at 42.4%. 4. Dunkin' Donuts does not have an option for the growing number of people with celiac disease or
gluten intolerance/sensitivity. 5. Despite having 31 flavors, Baskin-Robbins does not have a lactose-free ice cream. 6. Low number of lunch time consumers- 68% of customers are not likely to eat a Dunkin Donut lunch
item such as bakery sandwiches. 7. Customers have complained that the Dunkin’ Donuts baked goods have not been fresh since the
company became a coffee company in 2006. 8. Advertising efforts narrowly focused in Northeast US - $20 million spent in Northeast US franchisees
in 2013 9. Baskin-Robbins has a 17% market share in the ice cream and gelato industry in the US behind Dairy
Queen at 25.5%. 10. In 2014, international sales for Dunkin' Donuts decreased 2% and Baskin-Robbins decreased 1.2%.
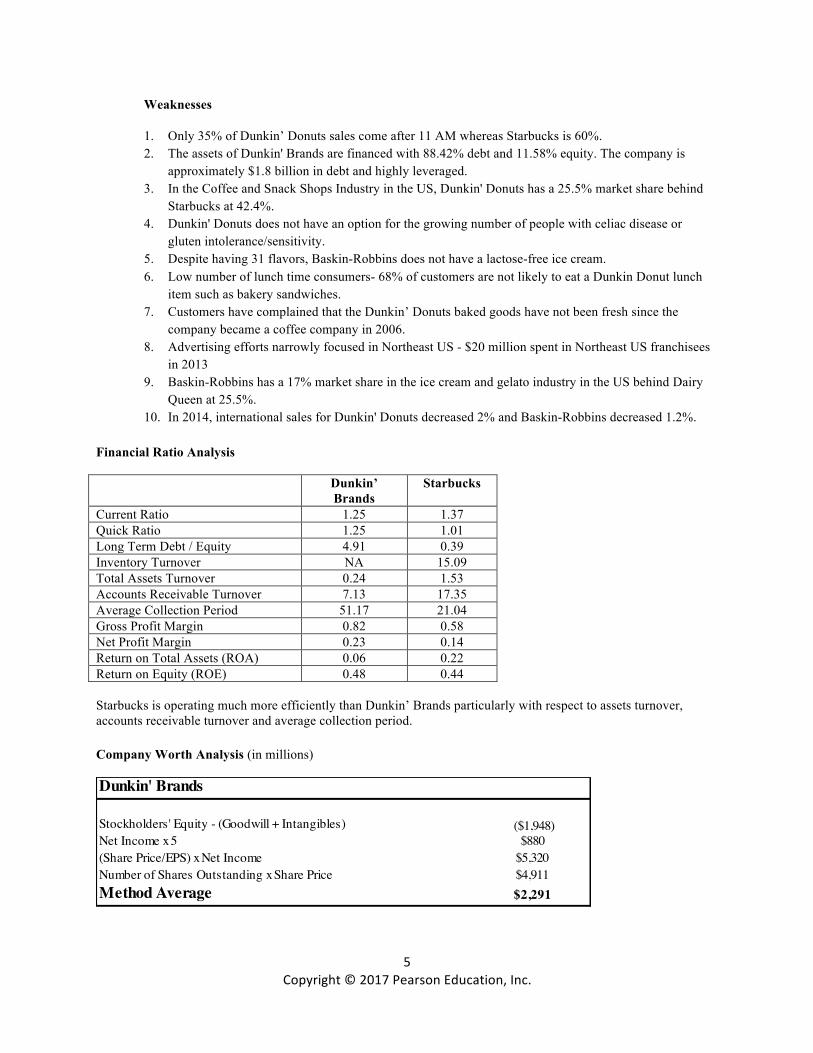
Financial Ratio Analysis
Dunkin’ Brands
Starbucks
Current Ratio 1.25 1.37 Quick Ratio 1.25 1.01 Long Term Debt / Equity 4.91 0.39 Inventory Turnover NA 15.09 Total Assets Turnover 0.24 1.53 Accounts Receivable Turnover 7.13 17.35 Average Collection Period 51.17 21.04 Gross Profit Margin 0.82 0.58 Net Profit Margin 0.23 0.14 Return on Total Assets (ROA) 0.06 0.22 Return on Equity (ROE) 0.48 0.44
Starbucks is operating much more efficiently than Dunkin’ Brands particularly with respect to assets turnover, accounts receivable turnover and average collection period. Company Worth Analysis (in millions)
Dunkin' Brands
Stockholders' Equity - (Goodwill + Intangibles) ($1,948)Net Income x 5 $880(Share Price/EPS) x Net Income $5,320Number of Shares Outstanding x Share Price $4,911Method Average $2,291

Copyright © 2017 Pearson Education, Inc.
6
Starbucks is worth approximately 15 times the company worth of Dunkin’ Brands. IFE Matrix
Starbucks
Stockholders' Equity - (Goodwill + Intangibles) $3,187Net Income x 5 $10,340(Share Price/EPS) x Net Income $64,631Number of Shares Outstanding x Share Price $82,555Method Average $40,178
Strengths Weight Rating Weighted Score1. For Dunkin‘ Donuts, 60% of the company revenue is from
coffee.0.07 4 0.28
2. Dunkin' Donuts has the #1 ranking for customer loyalty in the coffee category by Brand Keys for the last 8 years.
0.06 4 0.24
3. Dunkin' Brands has an asset light business mode because 99.0% of their stores are franchised.
0.06 4 0.24
4. American Customer Satisfaction Index rated Dunkin' Donuts the number one coffee brand in 2013.
0.06 4 0.24
5. In the doughnut industry, Dunkin' Donuts has 56.4% market share.
0.05 4 0.20
6. In the fiscal year of 2014, Dunkin' Brands recorded an operating margin of 45.3% compared to Starbucks at 18.7%. 0.05 3 0.15
7. Dunkin' Donuts sells more than 1.7 billion cups of iced and hot coffee globally each year. 0.04 3 0.12
8. Dunkin' Brands has a Nutrition Advisory Board to develop and reformulate products to meet the changing needs of the customers.
0.04 4 0.16
9. Over 65% of the Baskin-Robbins stores are located internationally and represent the majority of the brands international sales.
0.04 3 0.12
10. Dunkin' Donuts has a perks loyalty program fostered through the Dunkin' Donuts App which has 5 million downloads. 0.03 3 0.09

Copyright © 2017 Pearson Education, Inc.
7
Dunkin’ is performing about average on addressing its internal issues presented in this note. The firm needs to focus on improving its debt to equity ratio and consider offering lactose-free ice cream varieties.
F. SWOT
SO Strategies 1. Develop new lactose intolerant products to capitalize on this niche segment. (S8, O7) 2. Develop new flavors of coffee to keep up with demand. (S2, S7, O3, O6) 3. Develop more options of packaged coffee in retail stores. (S4, O3) 4. Develop new gluten-free products. (S8, O5) WO Strategies 1. Spend $25 million to promote Dunkin’s lunch offerings which many customers are not even aware of
currently (W1, W6, O4, O5). 2. Experiment with home or business deliver of doughnuts for orders over $20 in the Southeast USA
(W1, W2, O1, O10)
ST Strategies 1. Allocate $15 million to develop healthier products for both Dunkin’ Donuts and Baskin-Robbins. (S8,
T3) 2. Invest $70 million into a coffee farm to ensure coffee at fair prices. (S1, T1) 3. Invest $15 million to develop an ice cream for lactose intolerant customers. (S8, T5)
Weaknesses Weight Rating Weighted Score1. Only 35% of Dunkin Donuts sales come after 11 AM whereas
Starbucks is 60%.0.08 2 0.16
2. The assets of Dunkin' Brands are financed with 88.42% debt and 11.58% equity. The company is approximately $1.8 billion in debt and highly leveraged.
0.06 1 0.06
3. In the Coffee and Snack Shops Industry in the US, Dunkin' Donuts has a 25.5% market share behind Starbucks at 42.4%.
0.06 1 0.06
4. Dunkin' Donuts does not have an option for the growing number of people with celiac disease or gluten intolerance/sensitivity. 0.05 2 0.10
5. Despite having 31 flavors, Baskin-Robbins does not have a lactose-free ice cream.
0.05 1 0.05
6. Low number of lunch time consumers- 68% of customers are not likely to eat a Dunkin Donut lunch item such as bakery sandwiches.
0.05 2 0.10
7. Customers have complained that the Dunkin Donuts baked goods have not been fresh since the company became a coffee company in 2006.
0.05 1 0.05
8. Advertising efforts narrowly focused in Northeast U.S. - $20 million spent in Northeast U.S. franchisees in 2013
0.04 2 0.08
9. Baskin-Robbins has a 17% market share in the ice cream and gelato industry in the US behind Dairy Queen at 25.5%.
0.03 1 0.03
10. In 2014, international sales for Dunkin' Donuts decreased 2% and Baskin-Robbins decreased 1.2%.
0.03 2 0.06
TOTALS 1.00 2.59

Copyright © 2017 Pearson Education, Inc.
8
WT Strategies 1. Develop a gluten-free donut or baked good option for Dunkin' Donuts. (W4, T4) 2. Invest $15 million to develop an ice cream for lactose intolerant customers. (W4, W5, T5) 3. Spend $30 million in advertising to promote afternoon coffee and donut sales. (W1, T2, T7, T10)
G. SPACE Matrix
Dunkin’ is located in the competitive quadrant of the SPACE Matrix. A key area to focus on for moving the firm into the aggressive quadrant would be to reduce its debt load. Dunkin’ should consider strategies such as expanding both domestically and internationally through franchisees to help reduce the debt burden and increase revenues.
7
6
5
4
3
2
1
-7 -6 -5 -4 -3 -2 -1 1 2 3 4 5 6 7-1
-2
-3
-4
-5
-6
-7
CP
Defensive
AggressiveConservativeFP
CompetitiveSP
IP
Internal Analysis: External Analysis:Financial Position (FP) Stability Position (SP)
1 -63 -34 -34 -41 -2
Financial Position (FP) Average 2.6 Stability Position (SP) Average -3.6
Debt RatioLiquidity Current RatioEPSROA Inflation
Competitive PressurePrice ComparisonProduct DemandProduct Line Diversity
Internal Analysis: External Analysis:Competitive Position (CP) Industry Position (IP)
-3 4-2 4-2 3-3 6-2 4
Competitive Position (CP) Average -2.4 Industry Position (IP) Average 4.2
Growth PotentialCoffee SupplyEase of Entry into MarketProfit PotentialLeverage
Market ShareCustomer LoyaltyProduct ValueProduct VarityUse of Technology
Copyright © 2017 Pearson Education, Inc.
9
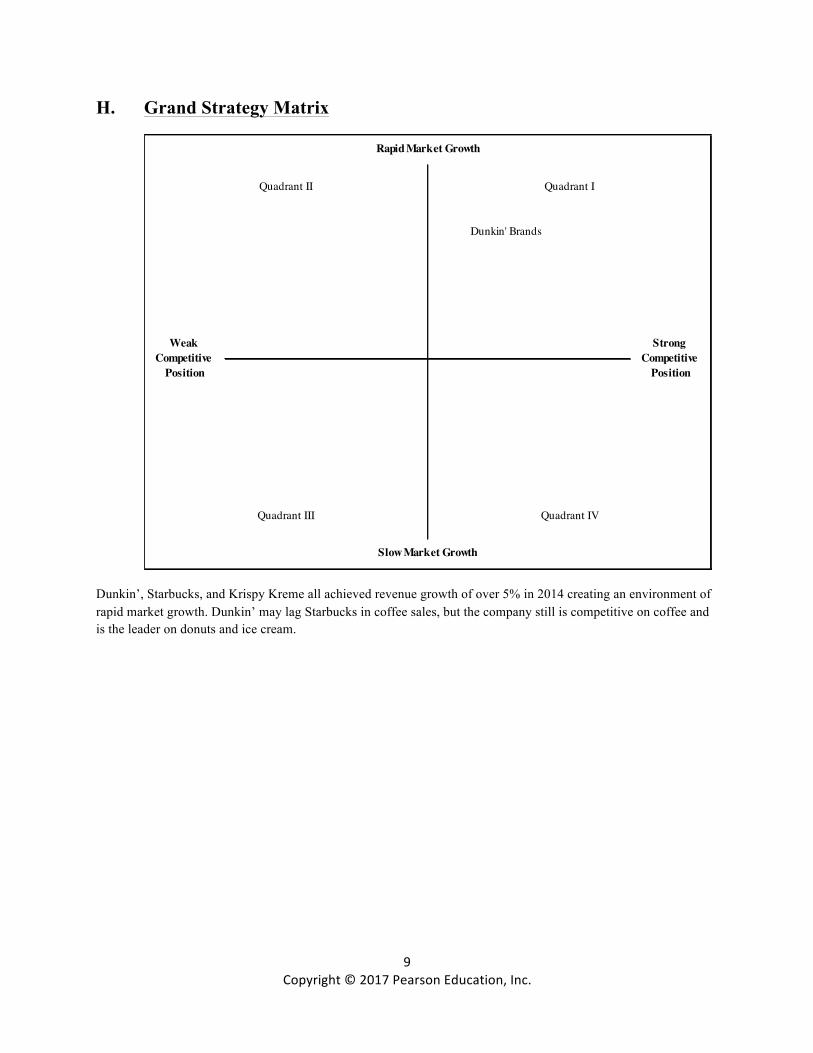
H. Grand Strategy Matrix
Dunkin’, Starbucks, and Krispy Kreme all achieved revenue growth of over 5% in 2014 creating an environment of rapid market growth. Dunkin’ may lag Starbucks in coffee sales, but the company still is competitive on coffee and is the leader on donuts and ice cream.
Dunkin' Brands
Strong Competitive
Position
Slow Market Growth
Weak Competitive
Position
Quadrant III Quadrant IV
Rapid Market Growth
Quadrant II Quadrant I

Copyright © 2017 Pearson Education, Inc.
10
I. The Internal-External (IE) Matrix
Despite Baskin-Robbins being the industry leader, the division competes with many mom and pop ice cream shops. Overall, even though the firm currently lands in the harvest and divest segment of the IE Matrix, staying the course or even obtaining new franchisee agreements is a viable strategy moving forward financed by the large successful Dunkin’ Donuts US division. The IE axes are more comprehensive than the BCG axes, and in this case, the IE analysis provide a quite more negative placement of the Dunkin’ segments than the BCG.
4.0 I II III
High
3.0 IV V VI
TheEFE 1Total MediumWeightedScores
4
2.0 VII VIII IX2
3Dunkin' Brands Average
Low
1.0
The Total IFE Weighted ScoresStrong Average Weak4.0 to 3.0 2.99 to 2.0 1.99 to 1.0
Division 2014 Revenues 2014 Profits 1. Dunkin’ Donuts US $549 $404 2. Dunkin’ Donuts International $20 $12 3. Baskin-Robbins US $43 $27 4. Baskin-Robbins International $122 $43

Copyright © 2017 Pearson Education, Inc.
11
J. BCG
Interestingly the BCG reveals a more positive outlook for Dunkin’ Brands than does the IE Matrix. Baskin-Robbins trails only Dairy Queen on ice cream sales in the US Industry sales are high across the board, but Dunkin’ Donuts International should be considered a question mark since it is dwarfed by Starbucks globally.
K. Recommendations
1. Spend $25 million to promote Dunkin’s lunch offerings which many customers are not even aware
of currently. 2. Experiment with home or business delivery of doughnuts for orders over $20 in the Southeast US. 3. Allocate $15 million to develop healthier products for both Dunkin’ Donuts and Baskin-Robbins. 4. Invest $70 million into a coffee farm to ensure coffee at fair prices. 5. Invest $15 million to develop an ice cream for lactose intolerant customers. 6. Spend $30 million in advertising to promote afternoon coffee and donut sales.
Due to Dunkin’s financial situation and recommendations of the matrices, only $175 million in capital is to be raised.
High+20 Star Question Mark4
2
1IndustrySales 3Growth Medium 0 Cash Cow DogRate(Percentage)
Low -20
High Medium Low1.0 .50 0.0
Relative Market Share Position

Copyright © 2017 Pearson Education, Inc.
12
L. EPS/EBIT Analysis (in millions except for EPS and Share Price)
Amount Needed: $175 Stock Price: $50 Shares Outstanding: 93
Interest Rate: 3% Tax Rate: 31%
Assuming a 3% interest rate, debt financing is most attractive for Dunkin across all economic conditions. However, Dunkin is highly leveraged and it is unclear if the firm could obtain debt, and if they could 3% may be an unrealism interest rate for a firm so leveraged. 100 percent common stock financing would only increase total shares outstanding by 4% so, total equity financing is possibly the best option. It is important to remember though, that Dunkin’ currently has $1.8 billion in debt, so taking on another $175 million is immaterial.
L. Epilogue
Dunkin’ is in a very competitive industry competing with Starbucks, Krispy Kreme, McDonalds, Tim Hortons and others on coffee along with Krispy Kreme, Tim Hortons and many mom and pop shops on donuts. The breakfast space is crowed and generally has lower margins. Firms such as Wendy’s have forgone offering breakfast altogether. Dunkin’ however, remains largely a breakfast establishment competing in this competitive industry with an absorbent amount of long-term debt. The new merger of Tim Hortons and Burger King forming Resturant Brands is expected to make competing even more difficult, and provide a quick outlet for Tim Hortons’ donut shops to enter Dunkin’s home markets more readily.
Recession Normal Boom Recession Normal BoomEBIT $250 $350 $450 $250 $350 $450Interest 0 0 0 5 5 5EBT 250 350 450 245 345 445Taxes 78 109 140 76 107 138EAT 173 242 311 169 238 307# Shares 97 97 97 93 93 93EPS 1.79 2.50 3.22 1.82 2.56 3.30
Common Stock Financing Debt Financing
30 Percent Stock 70 Percent StockRecession Normal Boom Recession Normal Boom
EBIT $250 $350 $450 $250 $350 $450Interest 4 4 4 2 2 2EBT 246 346 446 248 348 448Taxes 76 107 138 77 108 139EAT 170 239 308 171 240 309# Shares 94 94 94 95 95 95EPS 1.81 2.54 3.27 1.80 2.52 3.24