a century of oil and gas exploration in albania
TRANSCRIPT

A century of oil and gas exploration in Albania: assessment of Naturally Occurring
Radioactive Materials (NORMs)
G. Xhixha1,*, M. Baldoncini2, I. Callegari1, T. Colonna3, F. Hasani4, F. Mantovani2, F. Shala5, V.
Strati2, M. Xhixha Kaçeli1
1 Legnaro National Laboratory, Istituto Nazionale di Fisica Nucleare (INFN), Via dell’Università, 2 - 35020
Legnaro, Padova, Italy
2Department of Physics and Earth Sciences, University of Ferrara, Via Saragat, 1 - 44100 Ferrara, Italy
3 Center for GeoTechnologies, University of Siena, Via Vetri Vecchi, 34 - 52027 San Giovanni Valdarno, Arezzo ,
Italy
4 Kosovo Agency for Radiation Protection and Nuclear Safety (KARPNS), Office of the Prime Minister, Ish -
Gërmia - 10000 Prishtinë, Kosovo
5 Faculty of Mechanical Engineering, University of Pristina “Hasan Prishtina”, BreguiDiellit – 10000 Pristina,
Kosovo
* Corresponding author: Tel. +39 329 6965933; E-mail: [email protected] (G. Xhixha).
Abstract
Because potential Naturally Occurring Radioactive Materials (NORMs) generated from oil and gas
extractions in Albania have been disposed without regulatory criteria in many decades, an extensive
survey in one of the most productive regions (Vlora-Elbasan) has been performed. Among 52 gamma-
ray spectrometry measurements of soil, oil-sand, sludge, produced water and crude oil samples, we
discover that relatively low activity concentrations of 226Ra, 228Ra, 228Th and 40K, which are 23 ± 2 Bq/kg,
23 ± 2 Bq/kg, 24 ± 3 Bq/kg and 549 ± 12 Bq/kg, respectively, come from oil-sand produced by hydrocarbon
extraction from molasses formations. The mineralogical characterization together with the 228Ra/40K and
226Ra/40K ratios of these Neogene deposits confirm the geological and geodynamic model that predicts
a dismantling of Mesozoic source rocks. The average activity concentrations (± standard deviations) of
the radium isotopes (226Ra, 228Ra) and of the 228Th and 40K radionuclides in soil samples are determined
to be 20 ± 5 Bq/kg, 25 ± 10 Bq/kg, 25 ± 9 Bq/kg and 326 ± 83 Bq/kg, respectively. Based on these
arguments, the future radiological assessment of other fields in the region can be strategically planned
focusing on the oil-sands from molasses sediments. No disequilibrium in the 228Ra decay segment has
been observed in soil, sludge and oil-sand samples within the standard uncertainties. After a detailed
radiological characterization of the four main oilfields, we can conclude that the outdoor absorbed dose
rate never exceeds the worldwide population weighted average absorbed dose rate in outdoor air from
terrestrial gamma radiation.
Keywords
NORM; Natural radioactivity; Oil and gas extraction; Oil-sand; Gamma-ray spectrometry
1. Introduction
Petroleum exploration and production in Albania began in the second decade of the 20th century in
the Vlora-Elbasan Region, which is characterized by Neogene clastic deposits. The primary oil
extraction technique in Albania uses beam pumps, which exploit the pressure of the gas in the reservoir,
forcing oil out and into the well. Recently, several secondary recovery techniques, such as water and
steam injection, have been employed in pilot wells in the area, leading to an increase in the oil production
rate. In the future, the use of unconventional methods of shale gas extraction such as “fracking” is not
excluded. All these techniques may cause Naturally Occurring Radioactive Materials (NORMs) to rise
to the surface as part of the flow back and production brine. In general in the oil and gas industry, specific
attention is dedicated to the contamination of the oil equipment and of the oilfield area by NORMs (e.g.,
scale, sludge and produced water).
Several environmental studies have shown that the release of produced water into the oil well’s
surroundings, into decantation plants and into oil spillage sites can result in serious soil, water and air
contamination from BTEX (acronym for Benzene, Toluene, Ethylbenzene, and Xylenes), volatile
organic compounds or crude oil (REC 2000; Beqiraj et al. 2010; Guri et al. 2013). However, after a
century of oil exploration in Albania with poor regulatory criteria, especially in the early beginnings,
the risk of soil contamination from NORMs needs to be investigated. According to the CD
2013/59/EURATOM (2014) directive, the identification and monitoring of industrial processes
involving NORMs should be conducted by countries to assess the radioactive exposure to workers or
members of the public.
NORMs produced by the oil and gas industry are residues enriched with radium isotopes that
originate from the uranium and thorium present in reservoir rocks. Indeed, whereas both uranium and
thorium are present in hydrocarbon reservoir rocks and are essentially insoluble under reducing
conditions, their progenies 226Ra and 228Ra concentrate in formation waters. For this reason, 226Ra and
228Ra are unsupported by the long-lived uranium and thorium parent radionuclides, and due to their half-
lives of 1600 yr and 5.75 yr, respectively, they tend to accumulate in formation water. Produced water
(i.e., water brought to the surface) may contain various cations in solution, such as barium, calcium, and
strontium, as well as sulfate and carbonate anions, with which radium can consequently co-precipitate
as radium sulfates or radium carbonates. This effect can lead to the subsequent formation of scales in
oil and gas equipment, for which the 226Ra and 228Ra specific activities can be as high as 1500 × 104
Bq/kg and 280 × 104 Bq/kg, respectively, though highly variable concentrations are typically observed
(Xhixha et al. 2013). Furthermore, sludge wastes (mixture of crude oil, oil-sand and soil) can also be
generated, which show slightly lower activity concentrations with respect to scales, up to 350 × 104

Bq/kg and 205 × 104 Bq/kg, respectively, for 226Ra and 228Ra (Xhixha et al. 2013). However, no study
up to now has been performed on oil-sands wastes produced during heavy oil extraction.
This study is the first investigation of the radioactivity concentration in soils, oil-sands, sludges,
crude oil and produced water from the KUçova (KU), MArinza (MA), BAllsh (BA) and HEkali (HE)
oilfields. This original dataset will provide baseline information concerning possible contaminations due
to oil-sands. The geological framework and mineralogical analysis provide an exhaustive interpretation
of the radiometric data. This analysis will allow the assessment of the environmental and human impact
of the oil industry’s activities on the four areas. Moreover, these results may lead to the implementation
in the Albanian legislation of the European recommendations regarding the “Basic Safety Standards for
the protection against dangers arising from exposure to ionizing radiation (CD 2013/59/EURATOM,
2014)”.
2. Material and Methods
2.1. Geological setting of the study area
Albania is part of the Alpine Mediterranean Mountain belt and can be subdivided into two
groups of tectonic units with NNW - SSE orientation: the Inner Units, characterized by intense
deformation comprising ophiolites and metamorphic rocks, and the Outer Units, which are made up of
regional thrusts involving sedimentary rocks of Triassic to Pliocene age (Prifti and Muska 2013). The
main rocks characterizing the units of the two groups, according to the tectonic scheme, are shown in
Figure 1. The Outer Units are affected by a major transfer zone, i.e., the Vlora-Elbasan lineament, along
which most of the oil and gas fields occur (Roure et al. 2010).
The onshore petroleum extraction in Albania is primarily located in the IONian unit (ION) and
in the Durrës Basin, also referred to as the Peri-Adriatic Depression (PAD). The ION is an unbroken,
elongate tectonic unit (ca. 60-70 km long x 60 km wide) that extends continuously southwards into
Greece. In the ION, two main tectonics phases are recognized (i.e., Middle Miocene and Miocene-
Pliocene), forming large anticlines and synclines cut by major high-angle reverse faults (Robertson and
Shallo 2000).
The exposure in the ION begins with evaporites and then passes upwards into shallow-marine
platform carbonates (limestone and dolomites) of Late Triassic-Early Jurassic age. This succession
culminates in a hardground (ancient lithified seafloor) overlain by pelagic carbonates and cherts
(Middle–Late Jurassic to Eocene age, having a thickness of 2.5–4 km) and by terrigenous turbidites
(Late Eocene-Early Miocene age, with thickness on the order of 4-6.5 km). Paleogene units are
disconformably overlain by Neogenic sediments. The PAD is filled by molasses mega-sequences of
conglomerates, sandstone and clastic limestones, with clays, shale, coal and gypsum at the top. The
thickness of the molasses deposits increases from southeast to northwest, reaching a maximum of 5 km
(Silo et al. 2013).

According to Silo et al. (2013), we can recognize six hydrocarbons potential source rocks in the
Mesozoic limestone stratigraphic column of the ION. The main ones are the Triassic bituminous
dolomite at the bottom, the lower Jurassic schists and other Jurassic source rocks. We also find
Cretaceous shales under thrust synclines, which in the future could be exploited as hydrocarbon
generators.
The migration of crude oil from the Mesozoic limestone towards the Neogene reservoirs results
from successive episodes driven by the aforementioned tectonic structures. The oil currently explored
in the Neogenic molasses sediments is the product of a secondary migration from underlying limestone
(ION). The hydrocarbons are generally accumulated in stratigraphic traps of the PAD’s clastic deposits.
Because these phenomena evolved over geological time with different horizontal and vertical
distributions, each reservoir displays its own characteristics due to the local geochemical conditions.
Figure 1. Simplified geological map of Albania modified from Havancsák et al. (2012).The labels refer to the
geological units. The red squares represent the locations of the sampling areas; the solid black lines show the
sections (not to scale).

2.2. Sample collection
2.2.1. Kuçova oilfield
The Kuçova (KU) oilfield is located in the central eastern part of the Durrës Basin and extends along
a flat surface of approximately 14 km2. The area is covered by alluvial sediments that are investigated
with 21 soil samples (Fig. 2 (KU)), collected at a depth of 0–10 cm, with the aim of characterizing the
terrestrial component of the outdoor absorbed dose rate. According to the classification of USDA Soil
Taxonomy, the textural characteristics of the soil samples are overall sandy (percentage of sand > 50%
for most of the samples) with medium amounts of silt (approximately 30%) and low amounts of clay
(<20%).
The hydrocarbon reservoir is set in the Driza, Gorani, Kuçova and Polovina members of the
Tortonian-Messinian molasses sediments (PAD). In particular, the oil being extracted is accumulated in
sand lenses (Fig. 3 sect. AA’) (extending from 100 to 1500 m) sealed by shales (Sejdini et al. 1994)
with a high amount of clay (Prifti and Muska 2013). The depth of the reservoir has a range variable
from the surface down to 1500 m.
The KU oilfield was discovered in 1928 and Bankers Petroleum Ltd., a Canadian company with the
full rights to develop it, declared in 2013 approximately 297 million barrels of Original Oil in Place
(OOIP). The oil extracted is characterized by API gravity values and sulfur content belonging to the
ranges 14-22° and 4-5%, respectively (Sejdini et al. 1994; Prifti and Muska 2013). During the
periodical pipe cleaning process, we collected 10 samples of oil-sand from three different operative
wells (500 – 1000 m depth) and 3 samples of sludge from the surrounding area. Furthermore, produced
water and crude oil were collected in polyethylene bottles directly from the decantation plants.
2.2.2. Marinza oilfield
The Marinza (MA) oilfield, located in the southeastern part of the Durrës Basin, is the northern part
of the Patos-Marinza oilfield system that extends for 5 km WE and 14 km NS. The wide plain is covered
by alluvial sediments that are investigated for radiological assessment with 3 soil samples (Fig. 2 (MA))
classified according to their texture as clay-loam with sand < 40% (less than Kuçova soil), clay at 35%
and silt at 25%.
The Driza, Gorani, and Marinza members of the Tortonian-Messinian molasses formation (PAD) are
the main hydrocarbon reservoirs. The multiple layers of unconsolidated fine grain sandstone are located
at a depth ranging from 900 to 2000 m. The depositional environment is a marine environment with
fluvial-channel and shore face deposits. In some cases, the underlying fractured carbonates (ION), which
are located below a major unconformity (Fig. 3 sect. BB’), can be oil reservoirs (Weatherill et al. 2005;
Sejdini et al. 1994). The Patos-Marinza oilfield was discovered in 1929 and the amount of OOIP is
approximately 5.4 billion barrels, according to 2013 data reported by Bankers Petroleum Ltd.

The two separate fields (Patos in the south and Marinza in the north) have productive sands at
different depths, i.e., 0 - 1200 m for Patos and 1200 - 1800 m for MA. The oil extracted is characterized
by an API gravity value range of 3 - 33° and a sulfur content range of 2-7% (Weatherill et al. 2005;
Prifti and Muska 2013). We collected 1 sludge sample and 1 oil-sand sample for each of the two
investigated wells (2000 and 2500 m depth) in the MA oilfield.
2.2.3. Ballsh-Hekali oilfield
The Ballsh-Hekali oilfield system is located in a hill area 29 km SE of Fieri. The radiological
assessment of the two distinct fields, Ballsh (BA) and Hekali (HE),was performed by collecting 3 and
5 soil samples, respectively (Fig. 2 (BA) and Fig. 2 (HE)), whose textures are classified as sand or
loamy sand with sand > 80%, clay < 10% and silt at 20%.
The reservoirs are restricted to Paleocene-Eocene carbonate rocks (ION) and have a depth range of
1000 - 3000 m. The geological structure consists of two superposed faulted anticlines (Fig. 3 sect. C-
C’), and the oil stratigraphic column has a thickness greater than 550 m (Sejdini et al. 1994). The BA
and the HE oilfields were discovered in 1966 and the OOIP is approximately 440 million barrels (Sejdini
et al. 1994). The oil extracted is characterized by an API gravity value of 2-30°, with a sulfur content
of 3-7.5% (Prifti and Muska 2013). For the radiological characterization, 2 samples of sludge have
been collected in an operative well of the BA oilfield.

Figure 2. Approximate locations of the oils wells (red stars) and of the soil samples collected in the study area
(yellow triangles).
Figure 3. Cross sections a) A-A’ in the KU oilfield, b) B-B’ in the MA oilfield and c) C-C’ in BA-HE oilfield
(horizontal dimensions are not to scale), modified from Silo et al. (2013), obtained from the seismic lines shown
in Fig. 1. The colors of the sections are consistent with that of Fig. 1 and correspond to the PAD (yellow) and ION
(green) zones.
2.3. Sample preparation and measurements
2.3.1. HPGe gamma-ray spectrometry measurements
The samples were homogenized to a grain size of less than 2 mm and dried for at least 24 h at a
temperature of 105°C until a constant weight was achieved. Produced water and crude oil were collected
in polyethylene bottles directly from the decantation plants at the KU oilfield. The samples were then
transferred in cylindrical polycarbonate boxes of 180 cm3 volume, sealed hermetically and left
undisturbed for at least four weeks prior to being measured with a HPGe gamma spectrometer to
establish radioactive equilibrium in the 226Ra decay chain segment.
The samples were measured using the MCA_Rad system described in Xhixha et al. (2013). The
fully automated spectrometer consists of two 60% relative efficiency coaxial p-type HPGe gamma-ray
detectors with an energy resolution of ~1.9 keV at 1332.5 keV (60Co). The absolute full energy peak
efficiency of the MCA_Rad is calibrated using certified standard point sources (152Eu and 56Co). The
overall uncertainty in the efficiency calibration is estimated to be less than 5%. A certified reference
material containing contaminated bulk soil from a Syrian oilfield (IAEA-448) was used for quality
control. In general, the226Ra, 228Ac, 212Pb, 208Tl and 40K activity concentrations agreed within 3–10%
with respect to the reference values.
The radionuclides studied in this work are 226Ra, 228Ra, 228Th and 40K by analyzing different gamma
lines (Santawamaitre et al. 2014). The presence of 137Cs in soils was also investigated as a proxy of
Chernobyl fallout. The 226Ra activity concentration was determined by analyzing the two main gamma
emissions of the radon progenies, 214Pb (at 352 keV) and 214Bi (at 609 keV), and calculating the weighted
average. 228Ra was determined through its direct progeny228Ac, giving rise to gamma emissions at 338
keV and 911 keV. The 228Th activity concentration was determined by analyzing the two main gamma
emissions of radon progenies, 212Pb (at 239 keV) and 208Tl (at 583 keV). The activity concentrations of
40K and 137Cs were determined from their respective gamma emissions at 1460 keV and 662 keV. The
acquisition time was set to 4 hours for soil, oil-sand and sludge samples and 24 hours for produced water
and crude oil samples.
2.3.2. X-ray diffractometry measurements
Before undergoing mineralogical analysis, the samples were dried at 50°C for a few hours and
gradually grounding on agate mortar to preserve the crystalline structure of the minerals. The XRD
patterns of oriented and random samples were recorded using a GNR APD2000PRO diffractometer,
with Cu Kα radiation and a graphite monochromator, operating at 40 mA and 40 kV. X-ray
diffractometry of 5 samples was carried out with the divergence and scatter slits set at 1° and the
receiving slit at 0.2 mm. The step size and the counting time were 0.03° (2 and 3s/step, respectively.
A quasi-random orientation of powder samples was obtained by filling a side-entry aluminium holder.
The XRD patterns were processed by the SAX Analysis software and the identification of minerals was
based on the comparison with PDF-2 reference data supplied from the International Centre for
Diffraction Data (ICCD 2013). A semi-quantitative analysis of the minerals identified by XRD was
calculated based onchemical analysis, thermogravimetric data related to volatile components and the
Reference Intensity Ratio method.

3. Results and Discussion
3.1. Activity concentrations in soil samples
The results for the 40K, 226Ra and 228Ra and 228Th activity concentrations with ±1σ uncertainty (in
Bq/kg) in soil, oil-sand and sludge samples are shown in Appendix A. Table 1 shows the average
activity concentrations at ±1σ standard deviation and the range for soil, sludge and oil-sand samples
from different oilfields. The overall averages of the activity concentrations (± standard deviations) of
40K, 226Ra, 228Ra and 228Th in soil samples are found to be 326 ± 83 Bq/kg, 20 ± 5 Bq/kg, 25 ± 10 Bq/kg
and 25 ± 9 Bq/kg, respectively. The results for soil samples are found to be lower or comparable to the
global median activity concentrations of 40K, 238U and 232Th, which are 400 Bq/kg, 35 Bq/kg and 30
Bq/kg (UNSCEAR 2000), respectively. Moreover, we compared our results with data reported in
several studies on the activity concentrations in soil samples from oilfields (Table 1). These data show
a great variability, which can be attributed to natural features, such as geological and geochemical
characteristics of different areas, and to human activities, such as the presence of contamination due to
scales and sludges. Another case of study on natural radioactivity in Qatar (Al-Sulaiti et al. 2012) relate
the high concentration of 226Ra in soil samples to the NORM associated to oil and gas extraction
processes. In our study, although most soil samples were found to be contaminated by crude oil and
probably produced water, we do not observe any clear contamination from a radiological point of view.
This is probably due to the fact that measured samples of produced water and crude oil show minimum
detectable activities (MDA) for all radionuclides, corresponding to 0.4, 1.1, 0.4 and 1.4 Bq/kg,
respectively, for 26Ra, 228Ra, 228Th and 40K.
Table 1. Average activity concentrations (±1σ) for 40K, 226Ra, 228Ra and 228Th in soil, oil-sand and sludge samples
for different oilfields studied in Albania are reported together with the average (±1σ), absorbed dose rates (DR)
and annual effective dose rates (AEDR). Average activity concentrations (±1σ) and ranges for 40K, 226Ra, 228Ra
and 228Th in soil samples compared with those from oilfields reported in different studies.
Sample
type Country (Author) No.
40K
(Bq/kg)
226Ra
(Bq/kg)
228Ra
(Bq/kg)
228Th
(Bq/kg)
DR
(nGy/h)
AEDR
(mSv/yr)
Soil
Albania
KU 21 297 ± 48 17 ± 2 19 ± 5 20 ± 5 32 ± 5 0.04 ± 0.01
MA 3 360 ± 42 19 ± 3 33 ± 6 29 ± 5 44 ± 5 0.05 ± 0.01
BA 3 253 ±75 21 ± 7 29 ± 8 29 ± 9 38 ± 11 0.05 ± 0.01
HE 5 472 ± 41 30 ± 1 42 ± 6 40 ± 4 58 ± 4 0.07 ± 0.01
Albania
(this study) 32
326 ± 83
(204 – 535)
20 ± 5
(12 – 32)
25 ± 10
(11 – 51)
25 ± 9
(11 – 44)
38 ± 11
(32 – 58)
0.05 ± 0.01
(0.04 – 0.07)
Tunisia
(Hrichi et al. 2013) 1 176 ± 1 9 ± 0.1 11 ± 0.1
a 18 ± 0.2 0.022
Kuwait
(Abdullah et al. 2008) 47 (191 – 296) (12 – 25) (9 – 16)
a - -
Nigeria
(Avwiri and Ononugbo 2012) 12
263 ± 10
(134 – 395)
30 ± 1
(16 – 52)
17 ± 1 a
(10 – 34)
35
(23 – 47)
0.04
(0.03 – 0.06)

Nigeria
(Jibiri and Amakom 2010) 9
129 ± 70
(MDA – 248)
76 ± 34
(30 – 122)
21 ± 6 a
(12 – 29)
53 ± 18
(25 – 73)
0.06 ± 0.02
(0.03 – 0.09)
Canada
(Saint-Fort et al. 2007) 21 - (10 - 10×10
3) (7 – 260) (MDA – 10) - -
Egypt
(Shawky et al. 2001) 4
(MDA -
45×103)
(18×103 -
438×103)
(35×103 -
987×103)
(MDA –
9×10³)
- -
Sludge Albania
- 3 348 ±115 19 ± 4 22 ± 4 23 ± 6 36 ± 8 0.04 ± 0.01
MA 1 314 ± 18 18 ± 3 22 ± 6 25 ± 3 35 ± 6 0.04 ± 0.01
BA 2 175 ± 89 20 ± 11 21 ± 7 13 ± 1 29 ± 3 0.04 ± 0.01
Oil-sand Albania KU 10 549 ± 12 23 ± 2 23 ± 2 24 ± 3 47 ± 2 0.06 ± 0.01
MA 2 366 ± 49 12 ± 2 14 ± 4 12 ± 4 29 ± 2 0.04 ± 0.01
a Reported as 232Th.
Radium isotopes are generally unsupported in formation water, and because a fraction of them can
precipitate with oil-sands during oil extraction, an increase in concentration and disequilibrium in the
decay chain can occur. The disequilibrium in the 228Ra decay segment was studied in terms of the ratio
between the activity concentrations of 228Th and 228Ra (Appendix B). We observed ratio values
systematically greater than unity; however, this cannot be considered a strong evidence of
disequilibrium within the standard uncertainties. The ratios between the activity concentrations of
228Ra/228Th for soil, sludge and oil-sand samples (the last will be discussed below) and the corresponding
goodness of the fit, expressed in terms of reduced χ2 reported in parentheses, are 1.02 ± 0.07 (χ2 = 0.5),
0.99 ± 0.20 (χ2 = 3.9) and 1.05 ± 0.09 (χ2 = 1.6), respectively. We also observe in this case ratio values
close to unity for both sludge and oil-sand samples. However, in the context of the environmental legacy
issue, only 226Ra is of long-term concern because after 25 years only approximately 5% of 228Ra remains,
but the evaluation of secular equilibrium conditions is beyond the capacity of the MCA_Rad system.
The highest concentrations of 40K, 226Ra, 228Ra and 228Th are systematically observed in the HE
oilfield, while the lowest ones in the KU oilfield. The KU and MA oilfields belong to the same
hydrographic basin, located in the upstream and downstream sectors of the basin, respectively. This is
confirmed by the presence of round pebbles with dimensions on the order of centimeters in the KU
oilfield which are not present in fine grain soils of the MA oilfield. The higher concentration of 228Ra
and 228Th observed in the sediments of the MA oilfield with respect to that of the KU oilfield may be
correlated to a selective mechanical deposition, which could be observed in placer deposits. Indeed, as
reported by Ostrosi et al. (1998), heavy mineral placers are exploited along the Adriatic Sea’s shore.
However, the higher activity concentrations observed in the HE oilfield can be a consequence of either
different host rocks or differences in the geomorphological structure (slope debris) with respect to the
KU and MA oilfields. Indeed, the genetic processes of soils originated on carbonate substrates tend to
enrich the sediments, in particular with uranium and thorium; this may be the case for the soils from the
HE oilfield (Greeman et al. 1999).

137Cs was observed only in the soil samples and with highly variable concentrations: the average
concentration is 6 ± 4 Bq/kg in the KU oilfield, 14 ± 6 Bq/kg in the BA oilfield, 9 ± 9 Bq/kg in the HE
oilfield and 15 ± 7 Bq/kg in the MA oilfield. Indeed, for undisturbed soils with a high presence of
minerals, the vertical migration of 137Cs is rather slow, and a greater fraction of activity concentration is
expected in the topsoil (0–10 cm) (UNSCEAR, 2008). The non-presence of 137Cs in oil-sands can be
used as a tracer to discriminate them from soil samples.
The activity concentration ratios (±1σ uncertainty) for 228Ra/226Ra, 226Ra/40K and 228Ra/40K (Fig. 4)
(hereafter, assuming secular equilibrium, reported as Th/U, U/K and Th/K, respectively) are
summarized in Appendix B and studied to understand the hidden geochemical patterns of the analyzed
samples. We observe in general that the activity concentration ratios in the soil samples show a specific
signature (confirmed at ±1σ) over the oilfield reservoirs, which allows us to attribute a clastic
sedimentary origin to them (main constituents of the PAD unit, see Figure 1). Indeed, the measured
activity concentration ratios Th/U, U/K and Th/K are comparable with the average activity concentration
ratios in sandstone, which are 1.06, 0.062 and 0.068, respectively, and in shale, which are 1.07, 0.055
and 0.058, respectively (Van Schmus et al., 1995). This is reasonable as the soils originated in alluvial
deposits overlaying the PAD unit.
The oil-sand samples (discussed later) also have similar ratios (Fig. 4); collectively interpreting the
results from the oil-sands is relatively complex due to their different lithological origins. In the case of
the MA oilfield, the activity concentration ratios (Appendix B) indicate an increase in Th and K with
respect to an average carbonate rock, characterized by Th/U, U/K and Th/K values equal to 0.25, 0.32
and 0.082, respectively (Van Schmus et al., 1995). This can be possibly ascribed to the lithological
characteristics of the MA reservoir rock, which has a significant amount of terrigenous minerals (ION
unit described in Figure 1). In the case of the KU oilfield, the activity concentration ratios are
particularly similar to sandstone rocks (Van Schmus et al., 1995); the slight difference can be attributed
to the highly heterogeneous composition of the sandstone rocks.


Figure 4. (A) 228Ra/226Ra, (B) 226Ra/40K and (C) 228Ra/40K activity concentration ratios for soil (blue), oil-sand
(red) and sludge (green) samples.
3.2. Activity concentrations in the sludge samples
The averages of the activity concentrations of 40K, 226Ra, 228Ra and 228Th in the sludges are found to
be comparable, within the uncertainty, for all the oilfields investigated (Table 1). As the sludges are a
mixture of crude oil, oil-sand and soil, the variability observed in their activity concentrations is difficult
to understand as it depends on the mixing fractions. However, we can state that a significant fraction of
crude oil will result in a decreasing radioactivity level because the concentrations of radionuclides are
very low. In the case of sludge samples from the KU oilfield, we observe a slight increase in the activity
concentrations of 40K, 226Ra, 228Ra and 228Th with respect to the soil samples; this is probably due to the
relatively high concentrations of oil-sand in the sludge samples. This assumption is confirmed in the
case of the MA oilfield, where we observe a slight decrease in the activity concentrations of 40K, 226Ra,
228Ra and 228Th with respect to the soil samples due to the relatively low concentrations of oil-sand in
the sludge samples.
3.3. Activity concentration in the oil-sand samples
The activity concentrations of 40K, 226Ra, 228Ra and 228Th in the oil-sand samples from the KU and
MA oilfields differ significantly (within 2σ uncertainty) (Table 1). The two oilfields can be easily
recognized using the patterns of the 226Ra/40K and 228Ra/40K ratios (Figure 4b and 4c). The
discrimination between the two oilfields has also been achieved via a mineralogical analysis (Table 2)
performed for oil-sand samples collected in different wells from the KU and MA oilfields. These results
confirm that the KU oilfield reservoir is located in sandy lenses belonging to the PAD (absence of
dolomite and very low calcite, along with the presence of muscovite and chlorite and an increase in K-
feldspar), while the MA oilfield reservoir is located in the fractured limestones of the ION (presence of
calcite and dolomite) (see Figure 1). This interpretation is also supported by the observation of a higher
radioactivity content in the KU oilfield samples (more radioactive sandy lenses) with respect to to that
of the MA oilfield (less radioactive limestones) (Figure 4).
Table 2. Mineral percentage content measured by X-ray diffractometry and activity concentration measured by
the MCA_Rad system for oil-sand samples collected in the KU and MA oilfield. The uncertainty associated to the
mineralogical analysis is approximately 10-15% for Quartz and 20-30% for the other minerals (minerals estimated
with an uncertainty greater than 30% are reported as <5). The Limit of Detection (LD) for XRD measurements is
1%.
Sample ID Qtz Pl Kfs Cal Dol Ms Chl 40K
(Bq/kg)
226Ra
(Bq/kg)
228Ra
(Bq/kg)
228Th
(Bq/kg)
KU_OS1 40 20 6 <5 <LD 15 7 534 ± 8 22 ± 1 22 ± 2 25 ± 2
KU_OS5 44 20 13 <5 <LD 8 8 547 ± 8 25 ± 1 26 ± 1 29 ± 2

KU_OS6 43 20 8 <5 <LD 10 6 560 ± 9 21 ± 1 19 ± 2 21 ± 1
MA_OS1 60 12 8 12 <5 <LD <5 331 ± 15 13 ± 2 16 ± 4 9 ± 2
MA_OS2 55 11 8 20 <5 <5 <LD 400 ± 18 10 ± 2 10 ± 5 14 ± 2
Qtz. Quartz, Pl. Plagioclase, Kfs.K-Feldspar, Cal.Calcite, Dol. Dolomite, Ms. Muscovite, Chl.Chlorite
The KU oil-sand samples are characterized by a significant terrigenous content (deep-sea sediments
transported to the oceans by rivers from land sources) made up of quartz, feldspars, mica, chlorite and
a very low amount of calcite. The presence of chlorite and muscovite minerals confirms the geodynamic
model that predicts a dismantling of the magmatic rocks belonging to the Inner Units. In particular, the
chlorite could be formed by the alteration of other silicate minerals that contain Mg and Fe (e.g., olivine,
augite (pyroxene), hornblende, and biotite), which is typical of ophiolitic suites (deep-sea marine
sediments overlying, from top to bottom, pillow basalts, sheeted dikes, gabbro, dunite, and peridotite).
The percentages of Quartz, Feldspar and Lithics (QFL) (plotted in the ternary diagram of Figure 5)
measured in 3 samples of KU oil-sand are comparable with those reported in Dickinson (1985), which
correspond to mineralogical signatures typical of terrigenous Cenozoic sandstones deposited in different
sites. Referring to the QFL triangle of Dickinson (1985), we can affirm that the oil-sand samples can be
related to a source rock environment, such as a "dissected arc", which is connected to the exposure of
volcanic and basement rocks (in this case the ophiolitic rocks of the Inner unit). Because the reservoir
is formed by sands containing many minerals of magmatic derivation (muscovite, chlorite and
feldspars), this may confirm the higher amount of radionuclides with respect to MA.
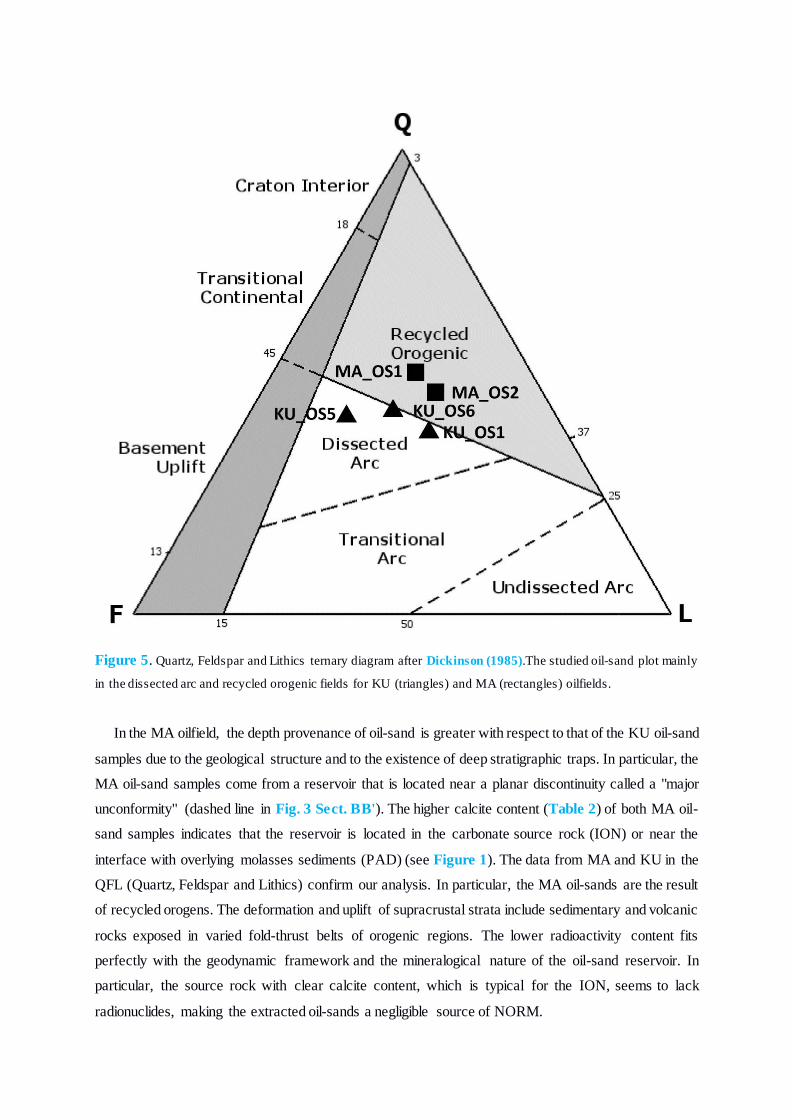
Figure 5. Quartz, Feldspar and Lithics ternary diagram after Dickinson (1985).The studied oil-sand plot mainly
in the dissected arc and recycled orogenic fields for KU (triangles) and MA (rectangles) oilfields.
In the MA oilfield, the depth provenance of oil-sand is greater with respect to that of the KU oil-sand
samples due to the geological structure and to the existence of deep stratigraphic traps. In particular, the
MA oil-sand samples come from a reservoir that is located near a planar discontinuity called a "major
unconformity" (dashed line in Fig. 3 Sect. BB'). The higher calcite content (Table 2) of both MA oil-
sand samples indicates that the reservoir is located in the carbonate source rock (ION) or near the
interface with overlying molasses sediments (PAD) (see Figure 1). The data from MA and KU in the
QFL (Quartz, Feldspar and Lithics) confirm our analysis. In particular, the MA oil-sands are the result
of recycled orogens. The deformation and uplift of supracrustal strata include sedimentary and volcanic
rocks exposed in varied fold-thrust belts of orogenic regions. The lower radioactivity content fits
perfectly with the geodynamic framework and the mineralogical nature of the oil-sand reservoir. In
particular, the source rock with clear calcite content, which is typical for the ION, seems to lack
radionuclides, making the extracted oil-sands a negligible source of NORM.

4. Radiological Assessment
The absorbed dose rate (DR) in air from external gamma radiation at 1 m above ground level due to
the presence of uniformly distributed natural radionuclides in measured soils is calculated according to
UNSCEAR (2000):
DR (nGy/h) = 0.0417AK + 0.462AU + 0.604ATh (1)
where AK, AU, and ATh are the activity concentrations (in Bq/kg) for 40K, 238U (as 226Ra) and 232Th (as
228Ra), respectively. Secular equilibrium was assumed for the dose calculation. The average outdoor
absorbed dose rate (at ±1σ uncertainty) in the KU oilfield area is 32 ± 5 nGy/h; in MA 44 ± 5 nGy/h; in
BA 38 ± 11 nGy/h; and in HE 58 ± 4 nGy/h (Table 1). The calculated outdoor absorbed dose rates range
from 21 (KU) to 64 nGy/h (HE). This dose rate is lower than or comparable to the population weighted
average absorbed dose rate in outdoor air from terrestrial gamma radiation (60 nGy/h) (UNSCEAR
2000).
The average outdoor absorbed dose rates (at ±1σ uncertainty) from the sludge and oil-sand samples
are reported in Table 1, which range between 27 and 50 nGy/h. Assuming the worst case scenario in
the KU oilfield, which corresponds to oil-sands uniformly distributed over the topsoil, the absorbed dose
rate was estimated to increase on average 50%, i.e., to a maximum value of 47 ± 2 nGy/h. In the same
hypothesis, we observe a decrease in the absorbed dose rate for the other oilfields. Therefore, negligible
radiation exposure to workers in the oil and gas industry can occur from increased gamma dose rates
due to the relatively higher radioactivity content in the oil-sand residues in the KU oilfield.
The radiological hazard for workers and populations living in the oilfield areas is evaluated in terms
of the Annual Effective Dose Rate (AEDR). The evaluation of the AEDR was performed by adopting an
outdoor time occupancy factor equal to 20% and a conversion factor of 0.7 (Sv/Gy), which accounts for
the dose rate’s biological effectiveness in causing damage to human tissues.
AEDR (mSv/yr) = DR × 10-6 (mGy/h) × 8760 (h/yr) × 0.7 (Sv/Gy) × 0.2 (2)
The results concerning the radiological assessment are summarized in Table 1. The annual outdoor
effective dose rate of 0.05 ± 0.01 mSv/y associated to the radioactive content in soils is lower than the
worldwide annual effective dose value of 0.07 mSv/y, as reported by UNSCEAR (2000). Considering
the worst-case scenario described above, we predict an increase in the AEDR of approximately 0.02 ±
0.01 mSv/y for the KU oilfield. This value is negligible considering the recommended excess limit of
an effective dose for the local population (1 mSv/y). Therefore, in the KU, MA, BA and HE oilfields,
there is no concern from a radiological point of view.

5. Conclusions
This study is the first screening campaign on the identification and monitoring of oil and gas industry
processes involving NORMs. Accordingly, the KU, MA and BA-HE oilfields are chosen as pilot study
areas, where secondary recovery techniques for oil extraction have recently been introduced. In
particular, soil (N = 32), sludge (N = 6), oil-sand (N = 12), produced water (N =1) and crude oil (N = 1)
samples are measured using the gamma-ray spectrometry method. The results reveal baseline
information for local environmental legacy policies and the implementation of EU legislations.
The average activity concentrations (± standard deviations) of 40K, 226Ra, 228Ra and 228Th in the soil
samples collected in the main oilfields in Albania are 326 ± 83 Bq/kg, 20 ± 5 Bq/kg, 25 ± 10 Bq/kg, 25
± 9 Bq/kg and 6 ± 4 Bq/kg, respectively. The results for the soil samples are found to be comparable
with data reported in several studies on activity concentrations in soil samples from oilfields. The
activity concentrations in the soil samples show great variability, which can be attributed mainly to the
geological and geochemical characteristics of the different areas and in a lower grade probably to human
activities, such as the release of oil-sands and sludges. The impact caused by the contamination of the
investigated soils collected in the surroundings of Albanian oilfields by crude oil and produced water is
negligible from a radiological point of view, as the activity concentrations measured in the produced
water and crude oil samples are found to be very low (below MDA). Geological and geochemical
arguments are used to describe the observed activity concentrations in different oilfields. The higher
radioactivity content observed in the soils from the HE oilfield with respect to that from the KU oilfield
was attributed to both the carbonate origin of the host rocks and to different geomorphological structure.
Indeed, bibliographic studies confirm that soils that originate on carbonate substrates tend to enrich the
sediments in uranium and thorium. In the case of the KU and MA oilfields, which are part of the same
hydrographic basin, the increasing trend for the activity concentrations of thorium progenies gives an
indication on the selective deposition and, as supported by bibliographic studies, on the occurrence of
heavy placer deposits along the Adriatic Sea’s shore. According to the Th/U, U/K and Th/K ratios, the
origin of the soil samples can be reasonably connected to alluvial deposits overlaying the PAD unit.
The activity concentrations in the sludge samples are reasonably understood when considering
sludges as a mixture of soil, crude oil, and oil-sand. This study is the first one reporting results on the
activity concentrations in oil-sand samples generated during heavy oil extraction. The average activity
concentrations of the oil-sand samples measured in the KU and MA oilfields differ at 2σ level, and are
equal to 549 ± 12 Bq/kg (40K), 23 ± 2 Bq/kg (226Ra), 23 ± 2 Bq/kg (228Ra) and 24 ± 3 Bq/kg (228Th) in
the KU oilfield and 366 ± 49 Bq/kg (40K), 12 ± 2 Bq/kg (226Ra), 14 ± 4 Bq/kg (228Ra) and 12 ± 4 Bq/kg
(228Th) in the MA oilfield. Based on the mineralogical analysis of the oil-sand samples, we confirm
bibliographic geophysical evidence regarding the origin of the oilfield reservoirs: sandy lenses located
in the PAD unit for the KU oilfield and fractured limestone located in the ION unit for the MA oilfield.
Indeed, the KU oil-sand samples are characterized by terrigenous contents with very low amounts of
calcite, and the presence of chlorite and muscovite minerals confirms the geodynamic model that
predicts a dismantling of magmatic rocks in the Inner Unit. On the other side, the MA oil-sands confirm
their connection to the geological structure due to the higher amount of calcite. This different origin is
also confirmed from the activity concentration results, as the KU samples containing many minerals
from magmatic deviation show higher activity concentrations of 40K, 226Ra, 228Ra and 228Th with respect
to the MA samples, which originate from carbonate rocks known to have a lower radioactive content.
Based on this geological framework, the future radiological assessment of other fields in the region can
be strategically planned to focus on the investigation of the oil-sands from Neogene molasses deposits.
The absorbed dose rate and annual effective dose rate were calculated to assess the radioactive
exposure of workers or members of the public due to NORMs produced in the oil and gas industry, in
compliance with EU recommendation. Assuming the worst case scenario, i.e., that sludge and oil-sands
are uniformly distributed over the topsoil, the absorbed dose rate and the AEDR of the KU oilfield were
estimated to increase on average by a maximum of 50%, i.e., to a maximum value of 47 ± 2 nGy/h or
the corresponding 0.06 ± 0.01 mSv/y. In the other investigated oilfields, the impact of industrial
processes has been estimated to be negligible. Considering the worldwide annual effective dose value
of 0.07 mSv/y associated to the radioactive content in soils and the recommended excess limit of an
effective dose for the local population of 1 mSv/y, we conclude that there is no concern from a
radiological point of view in the KU, MA, BA and HE oilfields.
Acknowledgements
This work is partly supported by the Fondazione Cassa di Risparmio di Padova e Rovigo, by the
Istituto Nazionale di Fisica Nucleare (INFN) by the MIUR (ITALRAD Project) and by
NORM4BUILDING COST TU1301 project. The authors are grateful to Giampietro Bezzon, Giampaolo
Buso, Giovanni Fiorentini, Gazmira Gjeta, Mariola Goga, Liliana Mou, Carlos Rossi Alvarez,
Alessandro Zanon and Enrico Guastaldi for the valuable discussion on the manuscript and Francesco
Dellisanti (ANALITICA S.a.s) for the valuable comments on the mineralogical analysis and
interpretation and to Fredi Gjika, Gjergji Hatellari and Nuri Hatellari for the technical support during
sample collection.
References
Abdullah, F.H., Saad, H.R., Farhan, A.R., Sharma, M.M., 2008. Investigation of Naturally Occurring Radioactive
Materials (NORM) in Oil Fields and Oil Lakes in Kuwait.Society of Petroleum Engineers. SPE International
Conference on Health, Safety, and Environment in Oil and Gas Exploration and Production, 1-6. Doi:
10.2118/111562-MS
Al-Sulaiti, H., Nasir, T., Al Mugren, K.S., Alkhomashi, N., Al-Dahan, N., Al-Dosari, M., Bradley, D.A., Bukhari,
S., Matthews, M., Regan, P.H., Santawamaitre, T., Malain, D., Habib, A., 2012. Determination of the natural
radioactivity levels in north west of Dukhan, Qatar using high-resolution gamma-ray spectrometry. Applied
Radiation and Isotopes, 70, 1344-1350. Doi: 10.1016/j.apradiso.2011.11.015

Avwiri, G.O., Ononugbo, C.P., 2012. Natural Radioactivity Levels in Surface Soil of Ogba/Egbema/Ndoni Oil
and Gas Fields.Energy Science and Technology. 4(2), 92-101. Doi: 10.3968/j.est.1923847920120402.427
Beqiraj, I., Drushku, S., Seiti, B., Topi, D., Muçaj, A., 2010. Environmental Problems in Albanian Fields of
Production and Processing of the Petroleum.NaturaMontenegrina. 9(3), 673-685.
CD (Council Directive) 2013/59/Euratom of 5 Dec. 2013 laying down basic safety standards for protection against
the dangers arising from exposure to ionising radiation, and repealing Directives 89/618/Euratom,
90/641/Euratom, 96/29/Euratom, 97/43/Euratom and 2003/122/Euratom. L13, Vol. 57, ISSN 1977-0677.
Doi:10.3000/19770677.L_2014.013.eng
Dickinson, W.R., 1985. Interpreting provenance relations from detrital modes of sandstones.In Zuffa, G.G. (Ed.),
Provenance of Arenites. NATO ASI Series C: Mathematical and Physical Sciences Vol. 148, Springer Science –
Bussiness Media, B.V., Dordrecht, Holland, pp. 333-361. Doi: 10.1007/978-94-017-2809-6
Greeman, D.J., Rose, A.W., Washington, J.W., Dobos, R.R., Ciolkosz, E.J., 1999. Geochemistry of radium in soils
of the Eastern United States.Applied Geochemistry. 14, 365-385. Doi: 10.1016/S0883-2927(98)00059-6
Guri, A., Guri, S., Aliu, A., Lubonja, O., 2013. The Impact of Oil Development Activities on Environment and
Sustainable Development in Fier Area.Academic Journal of Interdisciplinary Studies. 2(9), 626-634. Doi:
10.5901/ajis.2013.v2n9p626
Havancsák, I., Koller, F., Kodolányi, J., Szabó, C., Hoeck, V., Onuzi, K., 2012. Chromite-hosted Silicate Melt
Inclusions from Basalts in the Stravaj Complex, Southern MirditaOphiolite Belt (Albania). Turkish J. Earth Sci.
21, 79–96. Doi: 10.3906/yer-1010-40
Hrichi, H., Baccouche, S., Belgaied, J-E., 2013. Evaluation of radiological impacts of tenorm in the Tunisian
petroleum industry.Journal of Environmental Radioactivity. 115, 107-113. Doi: 10.1016/j.jenvrad.2012.07.012
IAEA (International Atomic Energy Agency), 2013.Certified Reference Material, IAEA-448Radium-226 in soil
from oil field, RS_IAEA-448_Rev.2, Vienna, Austria.
International Centre for Diffraction Data (ICDD), 2013. Powder Diffraction File (PDF), PDF-2 Release.
Jibiri, N.N., Amakom, C.M., 2011. Radiological Assessment of Radionuclide Contents in Soil Waste Streams
from an Oil Production Well of a Petroleum Development Company in Warri, Niger Delta, Nigeria. Indoor and
Built Environment. 20(2), 246-252. Doi: 10.1177/1420326X10378806

Ostrosi, B., Qirici, V., Grazhdani, A., 1998. The heavy minerals shore placers of Adriatic Sea in Albania. Bulletin
of the Geological Society of Greece. XXXII(3), 173-177.
Prifti, I., Muska, K., 2013. Hydrocarbon occurrences and petroleum geochemistry of Albanian oils. Ital. J. Geosci.
(Boll. Soc. Geol. It.). 132(2), 228-235. Doi: 10.3301/IJG.2012.29
REC (The Regional Environmental Center), 2000.Country Report Albania: In Strategic Environmental Analysis
of Albania, Bosnia & Herzegovina, Kosovo and Macedonia , Albania.
Robertson, A., Shallo, M., 2000.Mesozoic–Tertiary tectonic evolution of Albania in its regional Eastern
Mediterranean context.Tectonophysics. 316, 197–254. Doi: 10.1016/S0040-1951(99)00262-0
Roure, F., Andriessen, P., Callot, J.P., Faure, J.L., Ferket, H., Gonzales, E., Guilhaumou, N., Lacombe, O.,
Malandain, J., Sassi, W., Schneider, F., Swennen, R., Vilasi, N., 2010. The use of palaeo-thermo-barometers and
coupled thermal, fluid flow and pore-fluid pressure modelling for hydrocarbon and reservoir prediction in fold and
thrust belts. Geological Society, London, Special Publications, 348(1), 87-114. Doi: 10.1144/SP348.6
Saint-Fort, R., Alboiu, M., Hettiaratchi, P., 2007. Evaluation of TENORMs field measurement with actual activity
concentration in contaminated soil matrices.Journal of Environmental Science and Health Part A. 42, 1649-1654.
Doi: 10.1080/10934520701518158
Santawamaitre, T., Malain, D., Al-Sulaiti, H.A., Bradley, D.A., Matthews, M.C., Regan, P.H., 2014.
Determination of 238U, 232Th and 40K activity concentrations in riverbank soil along the Chao Phraya river basin in
Thailand. Journal of Environmental Radioactivity, 138, 8086. Doi: 10.1016/j.jenvrad.2014.07.017
Sejdini, B., Costantinescu, P., Piperi, T., 1994. Petroleum Exploration in Albania. In. Popescu, B.M. (Ed.),
Hydrocarbons of Eastern Central Europe: Habitat, Exploration and Production History. Springer-Verlag Berlin
Heidelberg, pp. 1-27.
Shawky, S., Amer, H., Nada, A.A., Abd El-Maksoud, T.M., Ibrahiem, N.M., 2001.Characteristics of NORM in
the oil industryfrom Eastern and Western deserts of Egypt.Applied Radiation and Isotopes. 55, 135-139. Doi:
10.1016/S0969-8043(00)00364-X
Silo, V., Muska, K., Silo, E., 2013. Hydrocarbon evaluation aspects in Neogene clastic reservoirs, Vlora -Elbas an
Region, Albania. Ital. J. Geosci. (Boll. Soc. Geol. It.). 132(2), 220-227. Doi: 10.3301/IJG.2013.04
UNSCEAR (United Nations Scientific Committee on the Effects of Atomic Radiation), 2000.Exposures from
Natural Radiation Sources. UN, New York.

UNSCEAR (United Nations Scientific Committee on the Effects of Atomic Radiation), 2008.Health effects due to
radiation from the Chernobyl accident . UN, New York.
Van Schmus, W. R. (1995). Natural Radioactivity of the crust and mantle. In Ahrens, T.J. (Ed.) Global Earth
Physics, A Handbook of Physical Constants AGU Ref. Shelf, 1 AGU, Washington, D.C., pp. 283–291.
Weatherill, B., Seto, A.C., Gupta, S.K., Çobo, L., 2005. Cold Heavy Oil Production at Patos -Marinza, Albania.
SPE International Thermal Operations and Heavy Oil Symposium, 1-18. Doi: 10.2118/97992-MS
Xhixha, G., Bezzon, G.P., Broggini, C., Buso, G.P., Caciolli, A., Callegari, I., De Bianchi, S., Fiorentini, G.,
Guastaldi, E., Kaçeli Xhixha, M., Mantovani, F., Massa, G., Menegazzo, R., Mou, L., Pasquini, A., Rossi Alvarez,
C., Shyti, M., 2013. The worldwide NORM production and a fully automated gamma-ray spectrometer for their
characterization.Journal of Radioanalytical and Nuclear Chemistry . 295, 445–457. Doi: 10.1007/s10967-012-
1791-1