a comparative approach to understanding tissue-specific
TRANSCRIPT

ORIGINAL RESEARCH ARTICLEpublished: 03 January 2013
doi: 10.3389/fgene.2012.00304
A comparative approach to understanding tissue-specificexpression of uncoupling protein 1 expression in adiposetissueAndrew Shore1, Richard D. Emes2, Frank Wessely 2, Paul Kemp3, Clemente Cillo4, Maria D’Armiento5,Nigel Hoggard 6 and Michael A. Lomax 7*1 School of Biosciences, Cardiff University, Cardiff, UK2 School of Veterinary Medicine and Science, University of Nottingham, Sutton Bonington Campus, Leicestershire, UK3 Faculty of Medicine, National Heart and Lung Institute, Imperial College London, London, UK4 Department of Clinical and Experimental Medicine, Federico II University Medical School, Naples, Italy5 Department of Biomorphological and Functional Sciences, Federico II University Medical School, Naples, Italy6 Rowett Institute of Nutrition and Health, Aberdeen Centre for Energy Regulation and Obesity, University of Aberdeen, Aberdeen, UK7 School of Biosciences, University of Nottingham, Sutton Bonington Campus, Leicestershire, UK
Edited by:Elvira Larqué, University of Murcia,Spain
Reviewed by:Michael C. Satterfield, Texas A&MUniversity, USAQiao LI, University of Ottawa, Canada
*Correspondence:Michael A. Lomax, University ofNottingham, School of Biosciences,Sutton Bonington Campus,Loughborough, LeicestershireLE125RD, UK.e-mail: [email protected]
The thermoregulatory function of brown adipose tissue (BAT) is due to the tissue-specificexpression of uncoupling protein 1 (UCP1) which is thought to have evolved in early mam-mals. We report that a CpG island close to the UCP1 transcription start site is highlyconserved in all 29 vertebrates examined apart from the mouse and xenopus. Using methy-lation sensitive restriction digest and bisulfite mapping we show that the CpG island in boththe bovine and human is largely un-methylated and is not related to differences in UCP1expression between white and BAT.Tissue-specific expression of UCP1 has been proposedto be regulated by a conserved 5′ distal enhancer which has been reported to be absentin marsupials. We demonstrate that the enhancer, is also absent in five eutherians as wellas marsupials, monotremes, amphibians, and fish, is present in pigs despite UCP1 hav-ing become a pseudogene, and that absence of the enhancer element does not relate toBAT-specific UCP1 expression. We identify an additional putative 5′ regulatory unit whichis conserved in 14 eutherian species but absent in other eutherians and vertebrates, butagain unrelated to UCP1 expression. We conclude that despite clear evidence of conser-vation of regulatory elements in the UCP1 5′ untranslated region, this does not appear tobe related to species or tissues-specific expression of UCP1.
Keywords: CpG islands, methylation, uncoupling protein 1, phylogenic analysis
INTRODUCTIONIn eutherians, non-shivering thermogenesis (NST) occurs inbrown adipose tissue (BAT) which expresses a tissue-specific gene,uncoupling protein 1 (UCP1; Cannon and Nedergaard, 2004).This gene codes for a mitochondrial protein with the ability touncouple oxidative phosphorylation and generate heat. RecentlyBAT has been identified in adult humans and has been suggestedto offer a potential target to increase energy expenditure and treatobesity(Nedergaard et al., 2007).
The expression of UCP1 is cell-specific to brown adipocytesand has been identified in all mammalian neonates so far exam-ined except the pig, in which exons 3–5 were deleted about 20million years ago (Berg et al., 2006). BAT-specific UCP1 expres-sion is a feature of small mammals, hibernators, and newborns andis thought to have originated prior to the Eutherian mammal radi-ation as it has been found in the rock elephant shrew, a member ofthe Afrotherian mammalian lineage (Mzilikazi et al., 2007). Recentdiscoveries of UCP1 in non-eutherian marsupials, and of UCP1orthologs in the non-mammalian vertebrates, frogs, and fish,expressed in liver and muscle, respectively, have questioned thisview (Klingenspor et al., 2008; Hughes et al., 2009). Phylogenetic
analysis has demonstrated rapid evolution of UCP1 on the Euther-ian lineage and suggested that a model of relaxed constraints aspredicted from the coevolution of genes which have taken oversome of UCP1 function, rather than directional selection, seemsto be involved (Hughes et al., 2009). Evidence to support a role ofthe UCP2 and 3 in oxidative stress suggests that subfunctionaliza-tion of these paralogs allowed the divergence of the BAT-specificexpression of UCP1 and its role in NST (Klingenspor et al., 2008).
Most newborn mammals are particularly vulnerable tohypothermia, and NST in BAT plays an important role depend-ing on the thermoregulatory behavior of different mammals(Symonds and Lomax, 1992). In altricious newborn such asrodents, pups are born blind and naked, and require the protectionof a nest environment to prevent hypothermia until BAT becomesactive a few days after birth (Cannon and Nedergaard, 2004).Immature newborns (e.g., hamster) only recruit NST in BAT aweek or more after birth with marsupials being an extreme groupof immature mammals who do not develop independent NSTuntil the young need to leave the pouch. In contrast to altriciousand immature newborns, in precocious mammals (e.g., cows andsheep), BAT develops during fetal life with maximal thermogenic
www.frontiersin.org January 2013 | Volume 3 | Article 304 | 1

Shore et al. Tissue-specific expression of uncoupling protein 1
activity occurring immediately after birth to allow the newbornto quickly achieve independent thermoregulation (Symonds andLomax, 1992). Human fetuses and neonates also possess BAT andfit best into the precocial group (Cannon and Nedergaard, 2004)although BAT has been identified in adult humans (McKinnonand Docherty, 2001).
The exact mechanism which confers BAT-specific expression ofUCP1 is not known. Studies on the rodent promoter have revealeda highly conserved 221 bp enhancer element located approxi-mately –2.5 kb from the transcriptional start that confers bothhormonal and tissue-specific responses (Cassard-Doulcier et al.,1998). The enhancer unit is also highly conserved across a 5 kbgenomic sequence upstream of the UCP1 transcription start sitein eutherians, including the Afrotherian species but could not befound in marsupials, despite cold-induced UCP1 expression inBAT (Hughes et al., 2009). In a recent study we have proposedthat tissue-specific expression may be dictated by the methylationof CpGs in cyclic AMP response elements in the enhancer unit(Shore et al., 2010). Methylation of CpGs in CpG islands (CGI) inthe promoter may also confer tissue-specific expression of UCP1(Kiskinis et al., 2007). Alternatively, tissue-specific expression ofUCP1 during development may be governed by the expressionof transcriptional regulators as reported in our previous studies(Lomax et al., 2007).
CpGs are generally methylated in the genome except where theyoccur in CGI around the start of transcription of genes (Sakuraiet al., 2006). These CGI, are a feature of TATA-less promoters,and can act as strong promoters of transcription, this effect beingmodulated by the degree of CpG methylation. Identification ofregions of genomic DNA that have been conserved across diver-gent species is a commonly used method of indicating importantregulatory elements.
Here we employ bioinformatic and molecular approaches todemonstrate that despite evidence of conservation of a CpG island,as well as regulatory elements, in the UCP1 promoter in mam-mals and vertebrates, these are insufficient to explain expressiondifferences between mammalian species and tissues.
MATERIALS AND METHODSTISSUESBovine perirenal brown fat was obtained from a 1-day-old malecalf. Human fetal samples were obtained from legally approvedtherapeutic terminations at the Department of Pathology Univer-sity of Naples Federico II under the control of the University’sGuidelines for Human Experimentation. Informed consent wasobtained from all the subjects involved in the experiments andthe study protocols were reviewed and approved by the Univer-sity Ethical Committee. The age of the fetuses was calculated fromanamnesis and ultrasonographic data, to be in the range from 22to 34 gestational weeks. Tissues were dissected, typically within 2 hafter death. The biopsies of perirenal fetal BAT were immediatelyfrozen in liquid nitrogen and then stored in a freezer at−80˚C untilDNA/RNA extraction. Human subcutaneous and omental adiposetissue was taken from the abdominal subcutaneous wall, duringan operation for vertical banded gastroplasty, from obese femalepatients. Adipose tissue samples were obtained within 5 min of thetissue being extracted from the patients and frozen immediately
in liquid nitrogen. Subjects had fasted overnight prior to surgery.All patients provided informed written consent before inclusionin the study. The study was approved by the Grampian ResearchEthics committee.
CpG ISLAND PREDICTIONFor each UCP1 ortholog, 5 kb of genomic DNA upstream of theopen reading frame start was screened for CGI using a modifiedversion of the CpGLH program (kindly provided by Angie Hin-richs UCSC). Briefly, each sequence is screened for the presenceof CG rich regions which fulfill the CGI criteria of at least 200 bpwith a minimum of 50% C+G and where the observed num-ber of CpGs divided by the expected number is greater than 0.6(Gardiner-Garden and Frommer, 1987). The sensitivity of initialscreening parameters was modified to identify all possible CGIwhilst maintaining the criteria of Gardiner-Garden and Frommer.
ALIGNMENT OF HOMOLOGOUS PROMOTERSRegions of conservation between cow-human and cow-mouseDNA upstream of UCP1 were determined using rVISTA (Lootset al., 2002) using the AVID alignment algorithm (Bray et al., 2003).For details see Table A2 in Appendix.
METHYLATION SENSITIVE RESTRICTION DIGESTIONRestriction enzyme digests were performed on 1 µg of genomicDNA extracted from tissues. Primers (Table A3 in Appendix) weredesigned to cover short and long fragments of the bovine andhuman CGI in the UCP1 promoter. In the bovine, two restrictionenzymes were chosen recognizing the sequence CCGG, HpaII inwhich digestion is prevented by methylation, and MspI which isnot methylation sensitive and acts to correct for incomplete diges-tion. Two sets of PCR primers were employed, the first with aproduct size of 288 bp and containing only one CCGG site anda second with product of 407 bp containing five CCGG sites. Inthe human, two sets of primers amplifying a short (173 bp; oneCCGG) and long (426 bp; eight CCGG) region covering part ofthe human CpG island, were employed. For these digests 1 µg ofgenomic DNA was incubated with 10 units of HpaII (Fermentas)in the buffer provided (33 mM Tris-acetate, 10 mM Mg-acetate,66 mM K-acetate, 0.1 mg/ml BSA) in a reaction volume of 50 µlfor 4 h at 37˚C before the enzyme was heat inactivated at 65˚Cfor 20 min. One microgram aliquots of genomic DNA were alsomock-digested under the same conditions but with nuclease freewater added instead of HpaII. A final aliquot was digested using 1unit of MspI (Fermentas) according to the manufacturer’s instruc-tions. The resulting digests were analyzed by quantitative real-timePCR (qRTPCR) using primers for the long and short fragmentsmentioned above. About 18S mRNA was used as a reference genewith primers (Table A3 in Appendix) which amplify a fragmentthat does not contain a CCGG motif. The human UCP1 enhancerregion does not possess the sequence CCGG so TaiI was usedwhich cuts ACGT but is blocked by CpG methylation. Completedigestion was gauged using MnlI which cuts CCTC(N)7.
METHYLATED CYTOSINE MAPPINGBisulfite conversion of genomic DNA prepared from tissues wascarried out essentially as described by Clark et al. (1994). The mod-ified DNA was purified using a desalting column (Promega Wizard
Frontiers in Genetics | Epigenomics and Epigenetics January 2013 | Volume 3 | Article 304 | 2

Shore et al. Tissue-specific expression of uncoupling protein 1
DNA Clean-Up system; Promega, Madison, WI, USA) Methyla-tion was quantified by pyrosequencing using Pyro Q-CpG software(Biotage, Charlottesvile,VA, USA) and performed by The GenomeCentre, Queen Mary, University of London, Charterhouse Square,London EC1M 6BQ. Primer sequences and descriptions are pro-vided (Table A3 in Appendix), products destined to be pyrose-quenced were amplified with 5′-biotin-labeled primers to allowpurification before sequencing.
REAL-TIME PCRTotal RNA was extracted from cultured cells and tissue by use ofTRI reagent (Sigma, Poole, UK). Before qRTPCR, samples weretreated with RNA-free DNase to remove contaminating genomicor plasmid DNA. Complementary DNA was generated using thecDNA synthesis kit from Qiagen. qRTPCR was performed usingSybr green (Qiagen) according to the manufacturer’s instructionsin Rotor Gene 3000 (Corbett Research, Cambridge, UK). Thesequences of the primers used for qRTPCR are given in Table A3in Appendix. Expression levels for all genes were normalized tothe internal control 18s rRNA using the ∆∆Ct method (Livak andSchmittgen, 2001).
RESULTSIDENTIFICATION OF CpG ISLANDSUCP1 homologs from vertebrate species with sufficient genomicdata were determined using BLAT at the UCSC genome browser.To ensure that the upstream region of true UCP1 orthologs werecompared, the conserved synteny of the UCP1 locus in vertebrateswas employed to unequivocally identify the upstream untrans-lated region of UCP1 in vertebrates. In all species examinedthe coding region for UCP1 is flanked by TBC1D9 upstreamand ELMOD2 downstream (Figure A1 in Appendix). Onlythose annotated UCP1 genes which were located in the con-served gene triplet TBC1D9-UCP1-ELMOD2 were considered.This resulted in 29 vertebrate UCP1 genes analyzed (see Table A1in Appendix). A approximately 500 bp sequence with sequencesimilarity to the human UCP1 enhancer was identified in 20eutherian mammals but was absent in Marmoset, Pika, GroundSquirrel, Shrew, and Hedgehog (Table 1). The enhancer wasalso absent from the marsupial Opossum, monotreme Platy-pus, Xenopus, and Zebrafish. A previous study was similarlyunable to identify the enhancer in 10 Kb upstream UTR of themarsupial M. domestica (Jastroch et al., 2008). The enhancersequence was within the −5 kb of the UTR except for Tenrec inwhich the enhancer sequence started at −5.486 Kb (Table A2 inAppendix).
Using a bioinformatic approach, we identified CGI in theUCP1 promoter of different species, fulfilling the criteria originallydescribed by Gardiner-Garden and Frommer (1987). The resultsclearly demonstrate the existence of a positionally conserved CpGisland in the UCP1 5′ UTR in 20 mammalian species (Table 1). Byreducing the stringency of the algorithm, an additional five species(rat, shrew, opossum, pika, platypus, and Zebrafish) have identi-fiable CGI which still fulfill the criteria of Gardiner-Garden andFrommer. From this analysis only two species, Mouse and Xeno-pus do not have a detectable CGI. The positions of the CGI werewithin 1 kb upstream of the UCP1 translational start site (TSS)
except for the European Hedgehog in which the CpG island waslocated downstream of the TSS.
CpG METHYLATION OF THE BOVINE AND HUMAN UCP1 CpG ISLANDThe high conservation of the CpG island in the proximal UCP1promoter across evolutionary time in vertebrates suggests that thisregion may be of regulatory importance. We therefore next exam-ined the methylation state of the proximal promoter in humanand the bovine tissues, in order to establish whether BAT-specificexpression of UCP1 is dictated by CpG methylation state of theUCP1 promoter. UCP1 mRNA expression in bovine white adi-pose tissue (WAT, subcutaneous), BAT (perirenal), and liver weredetermined by qRTPCR. BAT had significantly greater (200-fold)UCP1 expression than WAT or liver (Figure 1A; p < 0.001). Thehigh expression of UCP1 in BAT was not unexpected since thesesamples were taken shortly after birth (8 h) and previous studies,including our own in ruminants, have shown that UCP1 expres-sion is at its highest around parturition in response to the coldextrauterine environment (Symonds and Lomax, 1992). Previousstudies have demonstrated that UCP1 expression is high in humanfetal BAT (Gavrilova et al., 1988).
Methylation sensitive restriction digests were carried out ongenomic DNA extracted from neonatal bovine BAT, subcutaneousWAT, and liver, fetal human BAT, and adult human WAT, (omentaland subcutaneous) to determine differences in methylation statebetween the tissues. Methylation of the bovine proximal promoterCpG island was low in all tissues with a 407 bp product beingless than 2% methylated and a 288 bp product less than 12%.(Figure 1B). There was no significant difference in methylationstate of the CpG island between bovine tissues. It was expectedthat the 407 bp fragment would be more susceptible to methy-lation sensitive digestion as this contained more restriction sites,increasing the probability that a methylated site would be encoun-tered by the enzyme. In the human proximal promoter CpG island,methylation state of fetal BAT was also low (<14%) but was signif-icantly (p < 0.05) higher (173 bp product, 14%: 426 bp product,4% methylated) than WAT from both depots which were un-methylated (Figure 1C). A similar methylation sensitive restrictiondigestion approach (see Materials and Methods) demonstratedthat the methylation state of a region of the human enhancer wasmuch higher (55–60%) than the proximal promoter CpG island(Figure 1D). The primers amplified a region that contains thissequence which also lies at the consensus CRE homologous toCRE3 in the mouse.
We next employed bisulfite mapping in order to confirm theapparent low levels of methylation in the bovine CpG island, inthe bovine tissues. CGI are difficult to analyze using PCR bisulfitemapping due to the problem of designing primers and althoughwe attempted to amplify 44 CpGs in and around the bovine CpGisland we were only able to produce reliable results for 12 CpGs. Inagreement with the methylation sensitive restriction digests, all ofthese CpGs had methylation levels less than 20% with the major-ity below 10% with no significant differences between the tissuetypes (Figure 1E). For comparison, the values for CpG methyla-tion of the mouse enhancer around CRE3 determined by bisulfitemapping in our previous studies (Shore et al., 2010) have beenincluded in Figure 1E to emphasize the relatively low methylation
www.frontiersin.org January 2013 | Volume 3 | Article 304 | 3

Shore et al. Tissue-specific expression of uncoupling protein 1
Bovine UCP1 expression
0
1
2
3
4
5
UC
P1
mR
NA
BAT WAT Liver
***
Mean 4.130 0.071 0.013
+/- s.e.m 0.322 0.044 0.013
0
20
40
60
80
100
% M
eth
yla
tio
n
BAT WAT Liver
288bp 407bp 288bp 407bp 288bp 407bp
Mean 4.99 1.24 2.76 0.10 10.66 0.46
+/- s.e.m 1.62 0.23 0.12 0.01 2.98 0.15
Bovine CpG IslandA B
C D
E
0
20
40
60
80
100
% M
eth
yla
tio
n
BAT WAT Sc WAT Om
137bp 462bp 137bp 462bp 137bp 462bp
Mean 13.81 4.40 0.43 0.57 0.53 0.06
+/- s.e.m 3.30 0.22 0.10 0.02 0.13 0.01
Human CpG Island
***
0
20
40
60
80
100
% M
eth
yla
tio
n
BAT WAT
Mean 56.87 60.72
+/- s.e.m 18.89 1.19
Human Enhancer
0
20
40
60
80
100
1 2 3 4 5 6 7 8 9 10 11 12 13
% M
eth
yla
tio
n
CpGIsland Position Enh
Bovine CpG island
FIGURE 1 | Expression and UCP1 promoter percentage CpG methylation.(A) bovine UCP1 mRNA expression by qRTPCR. Methylation sensitiverestriction digest determination of (B) bovine, (C) human CpG islands, (D)human enhancer, and (E) bisulfite mapping determination of the percentagemethylation of 12 CpGs within the bovine CpG island, in adipose tissues andliver. UCP1 mRNA (A) is expressed relative to ribosomal 18S mRNA. The dataare presented as a percentage methylation compared to each respectivemock methylated sample for the (B) bovine 288 bp (�) and the 407 bp (�)products and (C) human 173 bp (�) and the 426 bp (�) products and (D)human enhancer (see Materials and Methods). The amount of UCP1
promoter DNA was quantified by qPCR relative to ribosomal 18S DNA. (E)CpG dinucleotide methylation in the Ucp1 proximal promoter in newbornbovine brown (�) and subcutaneous white adipose tissue (�), and liver ( ).For comparison, values for the mouse enhancer (ENH) BAT, WAT, and liver arepresented. DNA was extracted, bisulfite modified, amplified by PCR, andpyrosequenced to determine CpG methylation over positions 1–12 of theUcp1 promoter (see Materials and Methods). Missing liver values are due tofailed analyses. Values are means±SEM from at least three replicates exceptfor (D) which represents the average of duplicates±SD *** BAT significantlygreater than other tissues (p < 0.001).
Frontiers in Genetics | Epigenomics and Epigenetics January 2013 | Volume 3 | Article 304 | 4

Shore et al. Tissue-specific expression of uncoupling protein 1
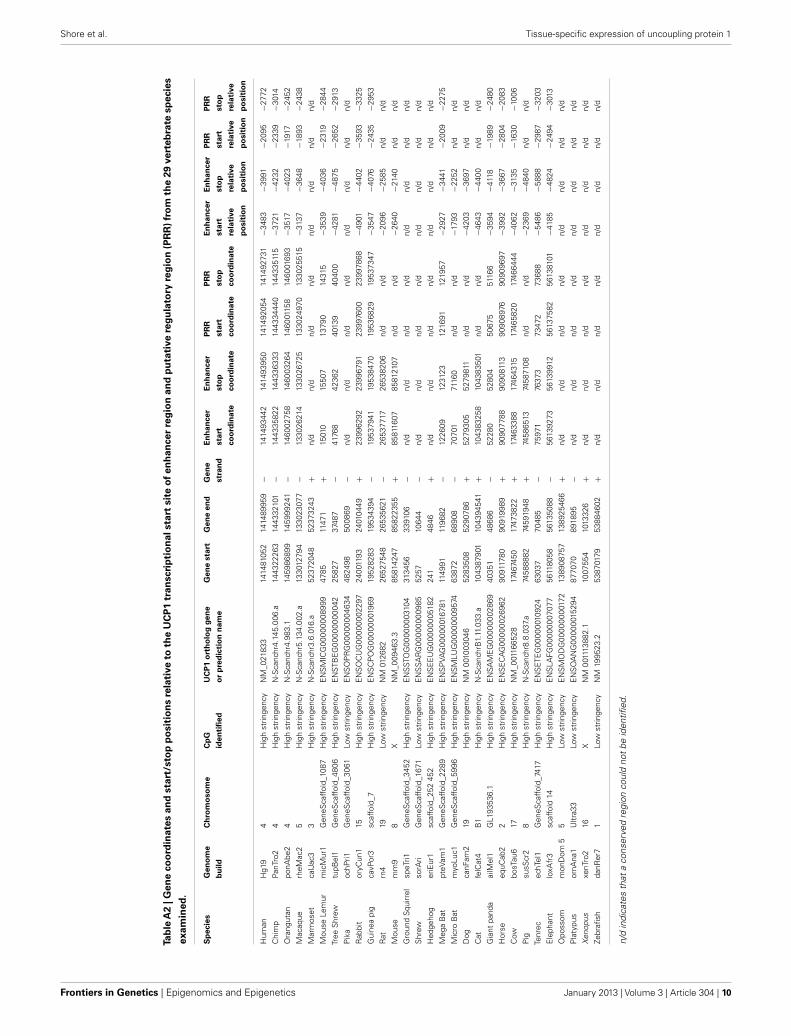
Table 1 | Occurrence and position of CpG island, enhancer and putative regulatory region in relation to the start of UCP1 transcription in 27
vertebrate species.
CpG Enhancer (human position −3488) as described in
del Mar Gonzalez-Barroso et al. (2000),
Jastroch et al. (2008), Shore et al. (2010)
Putative regulatory region
(human position −2095)
Human High stringency Yes Yes
Chimp High stringency Yes Yes
Orangutan High stringency Yes Yes
Macaque High stringency Yes Yes
Marmoset High stringency X X
Mouse Lemur High stringency Yes Yes
Tree Shrew High stringency Yes Yes
Pika Low stringency X X
Rabbit High stringency Yes Yes
Guinea pig High stringency Yes Yes
Rat Low stringency Yes X
Mouse X Yes X
Ground Squirrel High stringency X X
Shrew Low stringency X X
Hedgehog High stringency X X
Mega Bat High stringency Yes Yes
Micro Bat High stringency Yes X
Dog High stringency Yes X
Cat High stringency Yes X
Giant Panda High stringency Yes Yes
Horse High stringency Yes Yes
Cow High stringency Yes Yes
Pig High stringency yes X
Tenrec High stringency Yes Yes
Elephant High stringency Yes Yes
Opossom Low stringency X X
Platypus Low stringency X X
Xenopus X X X
Zebrafish Low stringency X X
High stringency regions represent CpG islands identified by the CpGLH algorithm with default settings, low stringency regions represent CpG islands identified by the
CpGLH algorithm with relaxed settings (see Materials and Methods). Putative Regulatory Region represents a 500 bp region conserved in some species containing
multiple consensus response elements.
state of the bovine CpG island. There was insufficient human BATto carry out a similar bisulfite mapping analysis.
THE POSITION OF A CONSERVED 5′ UPSTREAM ENHANCER REGIONAND A PUTATIVE REGULATORY REGION IN THE PROMOTER OF UCP1 INVERTEBRATESSince methylation CpG state of the UCP1 promoter was unableto explain brown adipose-specific expression, we next turned ourattention to the bioinformatics analysis of the promoter region.Conservation of a 320 bp enhancer in a 10 Kb region upstreamof the UCP1 TSS has been previously reported in eutherians,including the Afrotherian species but not in the marsupial M.domestica, (Jastroch et al., 2008). We extended this study to includenon-mammalian vertebrates (Table 1). Surprisingly, although wecould detect the enhancer box in the 10 kb sequence upstreamof the TSS in 20 eutherian species, it was not present in fiveeutherians (Marmoset, Pika, Ground Squirrel, Shrew, Hedgehog)
despite BAT-specific UCP1 expression in these species. The lowcoverage (approximately 2×) of four of these (Pika, GroundSquirrel, Shrew and Hedgehog) is likely to be insufficient to con-fidently conclude the lack of this enhancer. However Marmosethas increased coverage (6×) and provides greater confidence ofthe loss of enhancer in mammalian species. Within the marmosetgenome the nearest gap upstream of the UCP1 gene is estimatedto be 54,083 bp upstream, suggesting that the lack of predictedenhancer is not due to missing sequence data. As expected theenhancer box was not detected in the marsupial Opossum, themonotreme, Platypus, or non-mammalian vertebrates (Xenopus,Zebrafish). Within the mammalian species possessing a 5′ distalenhancer there was remarkable conservation of response elementsequences that have been shown to regulate UCP1 transcriptionin rodent studies, as previously noted by Jastroch et al. (2008;Figures A3–A5 in Appendix). The enhancer sequence was withinthe −5 kb of the UTR except for Tenrec in which the enhancer
www.frontiersin.org January 2013 | Volume 3 | Article 304 | 5

Shore et al. Tissue-specific expression of uncoupling protein 1
sequence started at−5.486 Kb (Table A2 in Appendix). The pres-ence of a conserved enhancer sequence upstream of pig UCP1is possibly unexpected. The UCP1 gene was predicted to havebecome a pseudogene approximately 20 million years ago (Berget al., 2006). If the sole role of the enhancer is associated withUCP1 expression, it would be predicted that following pseudo-genization that purifying selection of UCP1 enhancer would berelaxed, resulting in degeneration of conservation by accumulationof mutations. However, the pig enhancer remains well conserved.Pairwise percent identify of Human-cow enhancer is 78.5% and isonly slightly lower in Human-pig (75.9%). This suggests a possibleadditional role for the enhancer in pig or that the expression of atruncated form of UCP1 is transcribed in pig.
A second conserved putative regulatory region of approxi-mately 500 bp was noted (Human −2095; usually placed 2200–2700 bp upstream of the TSS in most species) which althoughpresent in 14 of the eutherian species, was absent in the ninevertebrate species that we could not find the enhancer, with theexception of rodents (Table 1; Table A2 in Appendix; Figures A3and A4 in Appendix).
Pairwise comparison of bovine-mouse, or bovine-human pro-moters using Rvista (Loots et al., 2002) highlighted this conserved
putative regulatory region between the human and bovineapproximately 2.5 Kb upstream, but not between bovine andmouse (Figure 2). As expected, a highly conserved peak is visible atapproximately−3.6 Kb within the conserved enhancer region andcontained the conserved transcription factor binding sites previ-ously mentioned above. A second conserved region approximately−1.1 to −1.6 kb is conserved between bovine and human but ismissing in mouse and rat genomes. The putative regulatory regionalso contained a number of conserved transcription factor bind-ing sites (CEBP, CREB, DR1, DR3, DR4, PPAR) suggesting thepresence of control elements that may be important in regulatingspecies-specific UCP1 expression.
DISCUSSIONThe recent discovery of BAT in adult humans has excited interestin combating obesity by stimulating the expression and activ-ity of UCP1 in brown adipocytes in order to increase energyexpenditure. In order to manipulate energy expenditure it is nec-essary to understand the precise transcriptional regulation ofUCP1 and although there have been recent advances in the tran-scriptional factors and co-regulators required for activating thebrown adipogenic gene expression, the mechanisms responsible
FIGURE 2 | Map of the relative positions of the conservedenhancer, putative regulatory region and predicted CpG island inthe UCP1 promoter of 29 species. All genes are shown in 5′–3′
orientation. Arrow represent the region of the UCP1 coding sequence.Differences in arrow length are likely to reflect relative differences inintron sizes.
Frontiers in Genetics | Epigenomics and Epigenetics January 2013 | Volume 3 | Article 304 | 6

Shore et al. Tissue-specific expression of uncoupling protein 1
for the species-specific and tissue-specific expression of UCP1 areunknown. The vast majority of studies have been carried out inrodents which retain neonatal brown depots into adulthood. Inhumans neonates, significant amounts of BAT are found in theperirenal and axillary depots, disappearing in adults but beingreplaced by the recently discovered supraclavicular depots. We andothers have reported a similar developmental disappearance ofBAT from the perirenal depot in ruminants (Lomax et al., 2007).We have proposed that tissue-specific expression may be dic-tated by the methylation of specific CpGs in cyclic AMP responseelements in the UCP1 enhancer unit (Shore et al., 2010). Analternative suggestion is that methylation of CpGs in CGI in thepromoter may confer tissue-specific expression of UCP1 (Kiskiniset al., 2007).
Using a bioinformatic approach we were able to identify a CpGisland conserved across 26 of 28 mammalian including marsupi-als and monotremes (Figure 2). Additionally a CpG island can beidentified upstream of the Zebrafish UCP1 transcription start sitesuggesting a more ancient origin and that this CpG island predatesthe divergence of mammals. In the context of the evolution of theCGI in the UCP1 promoter, it is therefore unlikely that the reten-tion of the CpG island is related to the acquisition of BAT-specificexpression since this is a feature only of mammals. This conclu-sion was supported by our study using methyl sensitive restrictiondigestion and qPCR which demonstrates that the methylation stateof the bovine CpG island does not appear to account for the differ-ential expression of UCP1 shown by qPCR between BAT and WATand that the CpG island remains essentially demethylated in BAT,WAT, and liver tissues regardless of the level UCP1 expression.These low methylation states were confirmed by pyrosequencinganalysis of the region. Though it is possible that some of the unse-quenced CpGs show differential methylation levels, we show thatthere is not a wide ranging difference in methylation state com-pared with differences in UCP1 expression. These findings wereconfirmed in the human tissues where there were also low levelsof methylation and no apparent difference between fetal BAT andadult WAT promoter methylation despite well documented differ-ence in UCP1 expression between these tissues (Lean and James,1986).
We have previously observed in mice that CpG dinucleotidemethylation of the Ucp1 distal enhancer exhibits tissue-specificpatterns in murine tissue and cell lines and suggested that adiposetissue-specific Ucp1 expression involves demethylation of CpGdinucleotides found in regulatory CREs in the Ucp1 enhancer, aswell as modification of histone tails (Shore et al., 2010). The con-trol of UCP1 expression by a complex series of response elementsin the 5′ distal enhancer has been studied in the rodent and humanpromoter (del Mar Gonzalez-Barroso et al., 2000; Rim and Kozak,2002) where this enhancer is necessary for both response to drugsand tissue-specific expression. However the observation that mar-supial M. domestica expresses UCP1 in response to beta adrenergicstimulation despite there being no identifiable enhancer suggeststhat other regulatory mechanisms exist (Jastroch et al., 2008).We confirmed this observation and have demonstrated that theenhancer is also absent from the other species Marmoset, Pika,Ground Squirrel, Shrew, and Hedgehog despite evidence that of
BAT-specific expression of UCP1 in these species (Rothwell andStock, 1985; Loncar, 1990; Liu et al., 1998; Suzuki et al., 2006; Kitaoet al., 2007). All of the nine species lacking an identifiable enhanceralso lacked the putative regulatory region but further studies arenecessary to characterize this region (Figure 2). Taken together theresults do not support a role for either CpG island methylation orthe presence of an enhancer unit, in tissue-specific regulation ofUCP1 expression.
Our previous study suggested that the loss of adrenergic stim-ulation of UCP1 expression in perirenal adipose tissue from new-born ruminants is associated with a decrease in the expression ofthe PPARγ coactivator PGC1α (Lomax et al., 2007) suggesting thatthe transcriptional machinery in ruminants may fail to activatethe enhancer after birth. In rodents cAMP response elements arepresent in both the enhancer and the proximal promoter (Rim andKozak, 2002). We have previously demonstrated using mouse celllines, that the exact combination of transcription factors bindingto cAMP response elements, governs the brown adipocyte-specificexpression of PGC1α and UCP1, in response to cAMP stimulation(Karamanlidis et al., 2007; Karamitri et al., 2009). Further studiesin rodents have also suggested synergistic relationships betweenthe transcriptional factors, PPARγ, PPARα, and PGC1α in brownadipogenesis (Rim et al., 2004; Xue et al., 2005). Therefore, thespecies differences in the presence of an enhancer and the patternsof brown fat thermogenesis may depend on the specific combi-nations and trans-activational prowess of transcription factors,rather than the exact structure of 5′ upstream elements. Furtherstudies are required to identify the role of transcription factorsactivating the CREB and PPAR response elements identified in thebovine PRR (Figure 2; Figure A2 in Appendix) in the regulationof thermogenesis in different species.
CONCLUSIONThe results presented here demonstrate that mammals possess ahighly conserved CpG island close to the transcription start site onthe UCP1 promoter but that methylation of the CpG island doesnot appear to account for tissue-specific expression of UCP1 inthese species. The evolution of the enhancer element appears to beseparate from the thermoregulatory function of BAT with specieslacking an enhancer being able to increase UCP1 expression inresponse to cold stimulus, or as in the pig, retain the enhancerdespite UCP1 becoming a pseudogene. Therefore, although pre-vious studies in rodents have proposed that regulation of UCP1expression is mainly targeted at response elements in a complexenhancer, a comparative approach suggests that despite clear evi-dence of conservation of regulatory elements in the UCP1 5′
untranslated region, this does not appear to be related to species-or tissues-specific expression of UCP1. This suggests that the con-trol of mammalian thermogenesis in BAT is not simply due to theevolution of UCP1 promoter elements but the result of a com-plex interplay between transcriptional regulators and responseelements on the UCP1 promoter.
ACKNOWLEDGMENTSThe work was supported by the BBSRC and the University ofNottingham.
www.frontiersin.org January 2013 | Volume 3 | Article 304 | 7

Shore et al. Tissue-specific expression of uncoupling protein 1
REFERENCESBerg, F., Gustafson, U., and Ander-
sson, L. (2006). The uncouplingprotein 1 gene (UCP1) is dis-rupted in the pig lineage: a geneticexplanation for poor thermoregula-tion in piglets. PLoS Genet. 2:e129.doi:10.1371/journal.pgen.0020129
Bray, N., Dubchak, I., and Pachter, L.(2003). AVID: a global alignmentprogram. Genome Res. 13, 97–102.
Cannon, B., and Nedergaard, J. (2004).Brown adipose tissue: function andphysiological significance. Physiol.Rev. 84, 277–359.
Cassard-Doulcier, A. M., Gelly, C.,Bouillaud, F., and Ricquier, D.(1998). A 211-bp enhancer of therat uncoupling protein-1 (UCP-1)gene controls specific and regulatedexpression in brown adipose tissue.Biochem. J. 333(Pt 2), 243–246.
Clark, S. J., Harrison, J., Paul, C. L., andFrommer, M. (1994). High sensitiv-ity mapping of methylated cytosines.Nucleic Acids Res. 22, 2990–2997.
del Mar Gonzalez-Barroso, M., Pec-queur, C., Gelly, C., Sanchis, D.,Alves-Guerra, M. C., Bouillaud, F.,et al. (2000). Transcriptional acti-vation of the human ucp1 genein a rodent cell line. Synergism ofretinoids, isoproterenol, and thiazo-lidinedione is mediated by a mul-tipartite response element. J. Biol.Chem. 275, 31722–31732.
Gardiner-Garden, M., and Frommer, M.(1987). CpG islands in vertebrategenomes. J. Mol. Biol. 196, 261–282.
Gavrilova, O. F., Mironov, A. S., Niko-laevskaia, E. E., Rodionov, O. A., andKhurges, E. M. (1988). Genetic map-ping of the ilv7434 mutation pro-viding threonine deaminase resis-tance to isoleucine inhibition inEscherichia coli. Genetika 24, 13–22.
Hughes, D. A., Jastroch, M., Stonek-ing, M., and Klingenspor, M.(2009). Molecular evolution ofUCP1 and the evolutionary his-tory of mammalian non-shiveringthermogenesis. BMC Evol. Biol. 9:4.doi:10.1186/1471-2148-9-4
Jastroch, M., Withers, K. W., Tau-dien, S., Frappell, P. B., Helwig, M.,Fromme, T., et al. (2008). Mar-supial uncoupling protein 1 shedslight on the evolution of mammaliannon-shivering thermogenesis. Phys-iol. Genomics 32, 161–169.
Karamanlidis, G., Karamitri, A.,Docherty, K., Hazlerigg, D.G., and Lomax, M. A. (2007).C/EBPbeta reprograms white3T3-L1 preadipocytes to aBrown adipocyte pattern ofgene expression. J. Biol. Chem. 282,24660–24669.
Karamitri, A., Shore, A. M., Docherty,K., Speakman, J. R., and Lomax, M.A. (2009). Combinatorial transcrip-tion factor regulation of the cyclicAMP-response element on the Pgc-1alpha promoter in white 3T3-L1and brown HIB-1B preadipocytes. J.Biol. Chem. 284, 20738–20752.
Kiskinis, E., Hallberg, M., Christian,M., Olofsson, M., Dilworth, S. M.,White, R., et al. (2007). RIP140directs histone and DNA methy-lation to silence Ucp1 expressionin white adipocytes. EMBO J. 26,4831–4840.
Kitao, N., Yahata, T., Matsumoto, T.,Okamatsu-Ogura, Y., Omachi, A.,Kimura, K., et al. (2007). Molecu-lar cloning and tissue distributionof uncoupling protein 1 (UCP1) inplateau pika (Ochotona dauurica). J.Vet. Med. Sci. 69, 1065–1068.
Klingenspor, M., Fromme, T., Hughes,D. A. Jr., Manzke, L., Polymeropou-los, E., Riemann, T., et al., (2008).An ancient look at UCP1. Biochim.Biophys. Acta 1777, 637–641.
Lean, M. E. J., and James,W. P. T. (1986).“Brown adipose tissue in man,” inBrown Adipose Tissue, eds P. Tray-hurn and D. G. Nicholls (London:Edward Arnold), 339–365.
Liu, X. T., Lin, Q. S., Li, Q. F., Huang,C. X., and Sun, R. Y. (1998). Uncou-pling protein mRNA, mitochondrialGTP-binding, and T4 5′-deiodinaseactivity of brown adipose tissuein Daurian ground squirrel dur-ing hibernation and arousal. Comp.Biochem. Physiol. Part A Mol. Integr.Physiol. 120, 745–752.
Livak, K. J., and Schmittgen, T. D.(2001). Analysis of relative geneexpression data using real-timequantitative PCR and the 2(-DeltaDelta C(T)) method. Methods 25,402–408.
Lomax, M. A., Sadiq, F., Karaman-lidis, G., Karamitri, A., Trayhurn,P., and Hazlerigg, D. G. (2007).Ontogenic loss of brown adiposetissue sensitivity to beta-adrenergic
stimulation in the ovine. Endocrinol-ogy 148, 461–468.
Loncar, D. (1990). Immunoelectronmicroscopical studies on synthe-sis and localization of uncouplingprotein in brown adipocytes: evi-dence for cotranslational trans-port of uncoupling protein intomitochondria. J. Struct. Biol. 105,133–145.
Loots, G. G., Ovcharenko, I., Pachter,L., Dubchak, I., and Rubin, E.M. (2002). rVista for compara-tive sequence-based discovery offunctional transcription factor bind-ing sites. Genome Res. 12, 832–839.
McKinnon, C. M., and Docherty,K. (2001). Pancreatic duodenalhomeobox-1, PDX-1, a majorregulator of beta cell identityand function. Diabetologia 44,1203–1214.
Mzilikazi, N., Jastroch, M., Meyer, C.W., and Klingenspor, M. (2007). Themolecular and biochemical basis ofnon-shivering thermogenesis in anAfrican endemic mammal, Elephan-tulus myurus. Am. J. Physiol. Regul.Integr. Comp. Physiol. 293, R2120–R2127.
Nedergaard, J., Bengtsson, T., and Can-non, B. (2007). Unexpected evi-dence for active brown adipose tis-sue in adult humans. Am. J. Physiol.Endocrinol. Metab. 293, E444–E452.
Rim, J. S., and Kozak, L. P. (2002). Regu-latory motifs for CREB-binding pro-tein and Nfe2l2 transcription fac-tors in the upstream enhancer ofthe mitochondrial uncoupling pro-tein 1 gene. J. Biol. Chem. 277,34589–34600.
Rim, J. S., Xue, B., Gawronska-Kozak,B., and Kozak, L. P. (2004). Seques-tration of thermogenic transcrip-tion factors in the cytoplasm duringdevelopment of brown adipose tis-sue. J. Biol. Chem. 279, 25916–25926.
Rothwell, N. J., and Stock, M. J.(1985). Thermogenic capacity andbrown adipose tissue activity inthe common marmoset. Comp.Biochem. Physiol. A Comp. Physiol.81, 683–686.
Sakurai, H., Era, T., Jakt, L. M., Okada,M., Nakai, S., and Nishikawa, S.(2006). In vitro modeling of parax-ial and lateral mesoderm differenti-ation reveals early reversibility. StemCells 24, 575–586.
Shore, A., Karamitri, A., Kemp, P.,Speakman, J. R., and Lomax,M. A. (2010). Role of Ucp1enhancer methylation and chro-matin remodelling in the con-trol of Ucp1 expression in murineadipose tissue. Diabetologia 53,1164–1173.
Suzuki, D., Murata, Y., and Oda, S.(2006). Cloning of putative uncou-pling protein 1 cDNA in a cold-intolerant mammal, the house muskshrew (Suncus murinus). Zool. Sci.23, 1009–1015.
Symonds, M. E., and Lomax, M. A.(1992). Maternal and environmen-tal influences on thermoregulationin the neonate. Proc. Nutr. Soc. 51,165–172.
Xue, B., Coulter, A., Rim, J. S.,Koza, R. A., and Kozak, L. P.(2005). Transcriptional synergy andthe regulation of Ucp1 duringbrown adipocyte induction in whitefat depots. Mol. Cell. Biol. 25,8311–8322.
Conflict of Interest Statement: Theauthors declare that the research wasconducted in the absence of any com-mercial or financial relationships thatcould be construed as a potential con-flict of interest.
Received: 03 October 2012; paper pendingpublished: 02 November 2012; accepted:10 December 2012; published online: 03January 2013.Citation: Shore A, Emes RD, WesselyF, Kemp P, Cillo C, D’Armiento M,Hoggard N and Lomax MA (2013) Acomparative approach to understand-ing tissue-specific expression of uncou-pling protein 1 expression in adi-pose tissue. Front. Gene. 3:304. doi:10.3389/fgene.2012.00304This article was submitted to Frontiers inEpigenomics and Epigenetics, a specialtyof Frontiers in Genetics.Copyright © 2013 Shore, Emes, Wessely,Kemp, Cillo, D’Armiento, Hoggard andLomax. This is an open-access article dis-tributed under the terms of the CreativeCommons Attribution License, whichpermits use, distribution and reproduc-tion in other forums, provided the originalauthors and source are credited and sub-ject to any copyright notices concerningany third-party graphics etc.
Frontiers in Genetics | Epigenomics and Epigenetics January 2013 | Volume 3 | Article 304 | 8

Shore et al. Tissue-specific expression of uncoupling protein 1
APPENDIX
Table A1 | Genome builds of species investigate.
Common name Latin name Genome build
Human Homo sapiens March 2006 hg18
Chimp Pan troglodytes March 2006 panTro2
Orangutan Pongo pygmaeus abelii July 2007 ponAbe2
Rhesus Macaca mulatta January 2006 rheMac2
Marmoset Callithrix jacchus June 2007 calJac1
Mouse lemur Microcebus murinus June 2003 micMur1
TreeShrew Tupaia belangeri December 2006 tupBel1
Pika Ochotona princeps July 2008 ochPri2
Rabbit Oryctolagus cuniculus May 2005 oryCun1
Guinea pig Cavia porcellus February 2008 cavPor3
Rat Rattus norvegicus November 2004 rn4
Mouse Mus musculus July 2007 mm9
Ground squirrel Spermophilus tridecemlineatus February 2008 speTri1
Shrew Sorex araneus June 2006 sorAra1
Hedgehog Erinaceus europaeus June 2006 eriEur1
Megabat Pteropus vampyrus July 2008 pteVam1
Microbat Myotis lucifugus March 2006 myoLuc1
Dog Canis lupus familiaris May 2005 canFam2
Cat Felis catus March 2006 felCat3
Giant panda Ailuropoda melanoleuca AilMel 1.0 December 2009
horse Equus caballus September 2007 equCab2
Cow Bos taurus November 2009 bosTau6
Pig Sus scrofa SGSC Sscrofa9.2
Tenrec Echinops telfairi July 2005 echTel1
Elephant Loxodonta africana July 2008 loxAfr2
Opossum Monodelphis domestica January 2006 monDom4
Platypus Ornithorhynchus anatinus March 2007 ornAna1
Xenopus tropicalis Xenopus tropicalis August 2005 xenTro2
Zebrafish Danio rerio July 2007 danRer5
www.frontiersin.org January 2013 | Volume 3 | Article 304 | 9
Shore et al. Tissue-specific expression of uncoupling protein 1
Tab
leA
2|G
ene
coo
rdin
ates
and
star
t/st
op
po
siti
on
sre
lati
veto
the
UC
P1
tran
scri
pti
on
alst
art
site
ofe
nh
ance
rre
gio
nan
dp
uta
tive
reg
ula
tory
reg
ion
(PR
R)f
rom
the
29ve
rteb
rate
spec
ies
exam
ined
.
Sp
ecie
sG
eno
me
bu
ild
Ch
rom
oso
me
Cp
G
iden
tifi
ed
UC
P1
ort
ho
log
gen
e
or
pre
dic
tio
nn
ame
Gen
est
art
Gen
een
dG
ene
stra
nd
En
han
cer
star
t
coo
rdin
ate
En
han
cer
sto
p
coo
rdin
ate
PR
R
star
t
coo
rdin
ate
PR
R
sto
p
coo
rdin
ate
En
han
cer
star
t
rela
tive
po
siti
on
En
han
cer
sto
p
rela
tive
po
siti
on
PR
R
star
t
rela
tive
po
siti
on
PR
R
sto
p
rela
tive
po
siti
on
Hum
anH
g19
4H
igh
strin
genc
yN
M_0
2183
314
1481
052
1414
8995
9−
1414
9344
214
1493
950
1414
9205
414
1492
731−
3483
−39
91−
2095
−27
72C
him
pPa
nTro
24
Hig
hst
ringe
ncy
N-S
canc
hr4.
145.
006.
a14
4322
263
1443
3210
1−
1443
3582
214
4336
333
1443
3444
014
4335
115−
3721
−42
32−
2339
−30
14O
rang
utan
ponA
be2
4H
igh
strin
genc
yN
-Sca
nchr
4.98
3.1
1459
8689
914
5999
241−
1460
0275
814
6003
264
1460
0115
814
6001
693−
3517
−40
23−
1917
−24
52M
acaq
uerh
eMac
25
Hig
hst
ringe
ncy
N-S
canc
hr5.
134.
002.
a13
3012
794
1330
2307
7−
1330
2621
413
3026
725
1330
2497
013
3025
515−
3137
−36
48−
1893
−24
38M
arm
oset
calJ
ac3
3H
igh
strin
genc
yN
-Sca
nchr
3.6.
016.
a52
3720
4852
3732
43+
n/d
n/d
n/d
n/d
n/d
n/d
n/d
n/d
Mou
seLe
mur
mic
Mur
1G
eneS
caffo
ld_1
087
Hig
hst
ringe
ncy
EN
SM
ICG
0000
0008
999
4785
1147
1+
1501
015
507
1379
014
315
−35
39−
4036
−23
19−
2844
Tree
Shr
ewtu
pBel
1G
eneS
caffo
ld_4
806
Hig
hst
ringe
ncy
EN
STB
EG
0000
0000
042
2582
737
487
−41
768
4236
240
139
4040
0−
4281
−48
75−
2652
−29
13P
ika
ochP
ri1G
eneS
caffo
ld_3
061
Low
strin
genc
yE
NS
OP
RG
0000
0004
634
4824
9850
0869
−n/
dn/
dn/
dn/
dn/
dn/
dn/
dn/
dR
abbi
tor
yCun
115
Hig
hst
ringe
ncy
EN
SO
CU
G00
0000
0229
724
0011
9324
0104
49+
2399
6292
2399
6791
2399
7600
2399
7868
−49
01−
4402
−35
93−
3325
Gui
nea
pig
cavP
or3
scaf
fold
_7H
igh
strin
genc
yE
NS
CP
OG
0000
0001
969
1952
8283
1953
4394
−19
5379
4119
5384
7019
5368
2919
5373
47−
3547
−40
76−
2435
−29
53R
atrn
419
Low
strin
genc
yN
M01
2682
2652
7548
2653
5621
−26
5377
1726
5382
06n/
dn/
d−
2096
−25
85n/
dn/
dM
ouse
mm
98
XN
M_0
0946
3.3
8581
4247
8582
2355
+85
8116
0785
8121
07n/
dn/
d−
2640
−21
40n/
dn/
dG
roun
dS
quirr
elsp
eTri1
Gen
eSca
ffold
_345
2H
igh
strin
genc
yE
NS
STO
G00
0000
0310
431
3456
3391
06−
n/d
n/d
n/d
n/d
n/d
n/d
n/d
n/d
Shr
ewso
rAri
Gen
eSca
ffold
_167
1Lo
wst
ringe
ncy
EN
SSA
RG
0000
0000
985
5257
1064
4−
n/d
n/d
n/d
n/d
n/d
n/d
n/d
n/d
Hed
geho
ger
iEur
1sc
affo
ld_2
5245
2H
igh
strin
genc
yE
NS
EE
UG
0000
0005
182
241
4846
+n/
dn/
dn/
dn/
dn/
dn/
dn/
dn/
dM
ega
Bat
pteV
am1
Gen
eSca
ffold
_228
9H
igh
strin
genc
yE
NS
PVA
G00
0000
1678
111
4991
1196
82−
1226
0912
3123
1216
9112
1957
−29
27−
3441
−20
09−
2275
Mic
roB
atm
yoLu
c1G
eneS
caffo
ld_5
996
Hig
hst
ringe
ncy
EN
SM
LUG
0000
0009
574
6387
268
908
−70
701
7116
0n/
dn/
d−
1793
−22
52n/
dn/
dD
ogca
nFam
219
Hig
hst
ringe
ncy
NM
0010
0304
652
8350
852
9078
6+
5279
305
5279
811
n/d
n/d
−42
03−
3697
n/d
n/d
Cat
felC
at4
B1
Hig
hst
ringe
ncy
N-S
canc
hrB
1.11
.033
.a10
4387
901
1043
9454
1+
1043
8325
810
4383
501
n/d
n/d
−46
43−
4400
n/d
n/d
Gia
ntpa
nda
ailM
el1
GL1
9353
6.1
Hig
hst
ringe
ncy
EN
SAM
EG
0000
0002
869
4035
148
686
−52
280
5280
450
675
5116
6−
3594
−41
18−
1989
−24
80H
orse
equC
ab2
2H
igh
strin
genc
yE
NS
EC
AG
0000
0026
962
9091
1780
9091
9989
+90
9077
8890
9081
1390
9089
7690
9096
97−
3992
−36
67−
2804
−20
83C
owbo
sTau
617
Hig
hst
ringe
ncy
NM
_001
1665
2817
4674
5017
4738
22+
1746
3388
1746
4315
1746
5820
1746
6444
−40
62−
3135
−16
30−
1006
Pig
susS
cr2
8H
igh
strin
genc
yN
-Sca
nchr
8.8.
037.
a74
5888
8274
5919
48+
7458
6513
7458
7108
n/d
n/d
−23
69−
4840
n/d
n/d
Tenr
ecec
hTel
1G
eneS
caffo
ld_7
417
Hig
hst
ringe
ncy
EN
SET
EG
0000
0010
924
6303
770
485
−75
971
7637
373
472
7368
8−
5486
−58
88−
2987
−32
03E
leph
ant
loxA
fr3
scaf
fold
14H
igh
strin
genc
yE
NS
LAFG
0000
0007
077
5611
8058
5613
5088
−56
1392
7356
1399
1256
1375
8256
1381
01−
4185
−48
24−
2494
−30
13O
poss
omm
onD
om5
5Lo
wst
ringe
ncy
EN
SM
OD
G00
0000
0017
213
8908
757
1389
2546
6+
n/d
n/d
n/d
n/d
n/d
n/d
n/d
n/d
Pla
typu
sor
nAna
1U
ltra3
3Lo
wst
ringe
ncy
EN
SO
AN
G00
0000
1529
487
7070
8918
95−
n/d
n/d
n/d
n/d
n/d
n/d
n/d
n/d
Xen
opus
xenT
ro2
16X
NM
0011
1388
2.1
1007
554
1013
326
+n/
dn/
dn/
dn/
dn/
dn/
dn/
dn/
dZe
brafi
shda
nRer
71
Low
strin
genc
yN
M19
9523
.253
8701
7953
8846
02+
n/d
n/d
n/d
n/d
n/d
n/d
n/d
n/d
n/d
indi
cate
sth
ata
cons
erve
dre
gion
coul
dno
tbe
iden
tified
.
Frontiers in Genetics | Epigenomics and Epigenetics January 2013 | Volume 3 | Article 304 | 10

Shore et al. Tissue-specific expression of uncoupling protein 1
Table A3 | Primer sequences for QPCR quantification of mRNA and methylation sensitive restriction digests, bisulfite specific PCR, and
pyrosequencing.
Primer name Primer sequence (5′–3′) PCR annealing temp (˚C) CpG positions
QPCR QUANTIFICATION OF mRNA
Bov UCP1F CACTAGGGAAGGACCGTCAG 55
Bov UCP1 R TTCCCGAGGAGGACTAGGTT 55
Hom UCP1 F TGCCCAACTGTGCAATGAA 56
Hom UCP1 R TCGCAAGAAGGAAGGTACCAA
18S F GTAACCCGTTGAACCCCATT 56
18S R CCATCCAATCGGTAGTAGCG 56
QPCR QUANTIFICATION OF METHYLATION SENSITIVE RESTRICTION DIGESTS
Bov Long F GCATCGAGGGTAGAGCGTAG 56
Bov Long R GTGTCCCACCATCCTGACTC 56
Bov Short F TCCGGCGATATAAGTCATCC 56
Bov Short R CTCTCCGACTTCTGCCCAGT 56
Hom L and S F CCAAAGGGTGACAGAAGGTG 56
Hom Long R CAGCAAACCCGATTTCTGTT 56
Hom Short R GTCCCTCCCATTCCCATTC 56
BISULFITE SPECIFIC PCR (PRIORTO PYROSEQUENCING)
Bov Pyro F GGAGGTAGGTAGGGGGTTGT 56 1,2,3,4,5,6
Bov Pyro R BIO-AAAACCTACCCCCCAAAACAC 56 1,2,3,4,5,6
Bov Pyro F GGGGATTAGGGTTTTAGTTTTAAAGGT 52 7,8,9,10
Bov Pyro R BIO-CCCCCACCTACCACCTAAA 52 7,8,9,10
Bov Pyro F GTGGTGTTTAGTGGGAAGGTGATTATG 52 11 and 12
Bov Pyro R BIO-ACCTTTAAAACTAAAACCCTAATCCC 52 11 and 12
Mouse Pyro F GATGTTTTTGTGGTTTGAGTGTA 58 1,2,3,4
Mouse Pyro R BIO-TCCCCAAAAAATCTAATTTCTAC 58 1,2,3,4
Mouse Pyro F TTTTGGGGGTAGTAAGGTTAAT 53.3 5 and 6
Mouse Pyro R BIO-TATTACCCAACAAAAACTTTCC 53.3 5 and 6
PYROSEQUENCING PRIMERS
Bov Pyro S1 TTTAGAGTTAGGGTTGGTTA 1,2,3,4,5,6
Bov Pyro S2 TGTTTTGTTTGGTTTTTTAT 7,8,9,10
Bov Pyro S3 GGTTGTTATTTTAGTTGAGA 11 and 12
Mouse Pyro S1 TTGTGAAATGAGTGAGTAA 1
Mouse Pyro S2 TGGTGTTTTATATTTTAAG 2
Mouse Pyro S3 TAGGTAAGTGAAGTTTGTTG 3
Mouse Pyro S4 ATTTTTGATTATATTGAATT 4
Mouse Pyro 5–6 TTTTTTGTTTTGAGTTGATA 5 and 6
BIO indicates biotinylation and CpG position represents CpG dinucleotides successfully pyrosequenced in the bovine (Bov) and human (Hom) proximal promoters.
www.frontiersin.org January 2013 | Volume 3 | Article 304 | 11

Shore et al. Tissue-specific expression of uncoupling protein 1
FIGURE A1 | Gene synteny around the UCP1 locus. Relative positions of UCP1 orthologs in four representative species showing conservation of synteny.Positions of conserved upstream regions and predicted CpG islands are shown. Gaps in current genome build are shown as hashed boxes. For details seeTable A2.
FIGURE A2 | Evolutionary conservation of the regions of the UCP15′ UTR enhancer and putative regulatory region. Pairwisecomparison of cow-mouse (A) and cow-human (B) genomic DNA 5 Kbupstream of UCP1 gene rVISTA (Loots et al., 2002) using the AVIDalignment algorithm (Bray et al., 2003). Conserved regions (>70%conserved in 100 bp window are shaded). A highly conserved peak is
visible at approximately −3.6 Kb within the conserved enhancer region.A second conserved region approximately −1.1 to −1.6 kb is conservedbetween cattle and human but is missing in the mouse genome. Withinpeaks of sequence similarity are a number of conserved transcriptionfactor binding sites of interest (CEBP, CREB, DR1, DR3, DR4, PPAR)marked with the bars.
Frontiers in Genetics | Epigenomics and Epigenetics January 2013 | Volume 3 | Article 304 | 12

Shore et al. Tissue-specific expression of uncoupling protein 1
CRE PPRE CRE
Human CACTCCTTTGCTACGTCATAAAGGG-TCAGTTGCCCTTGCTCATACTGACCTATTCTTTACCTCTCTGCTTCTTCTTTGT
Chimp CACTCCTTTGCTACGTCATAAAGGG-TCAGTTGCCCTTGCTCATACTGACCTATTCTTTACCTCTCTGCTTCTTCTTTGT
Orangutan CACTCCTTTGCTACGTCATAAAGGG-TCAGTTGCCCTTGCTCACACTGACCTATTCTTTACCTCTCTGCTTCTTCTTTGT
Rhesus Macaque CATTCCTTTGCTACGTCATAAAGGG-TCAGTTGCCCTTGCTCACACTGACCTATTCTTTACCTCTCTGCTTCTTCTTTGT
Mouse Lemur CACTCCTTAGCTACGTCATAAAAGG-TCAGGTGCCCTTGCTCACACTGACCTATTCTTTACCCCTC--------CTTTGT
Tree Shrew CCTTGCTTCGCTACGTCACACGAGG-TCAGTTACCCCTGCCCACGCTGACCTATTCTTTGCCTCTCCACTTCTTCCTTGT
Rabbit CTCTTCCCTGCTACGTCATGAAAGA-CAGGCCACCTTTGCTCACACTGACCTAGTCTTTACCCCTCGCCCCTTGCTCTGA
Guinea Pig TGCTGCTTCGCTCTATCCCAGG----TCAGTGACCTCTGCTCACGCTGCACTGTTCTCAGCCTCTCCACTT---CTTAGT
Rat CGCTCCTTTGCGACGTCACAGTGGG-TCAGTCACCCTTGATCACACTGCACCAGTCTTCACCTTTCCACG----CTTCCT
Mouse CACTCCTCTACAGCGTCACAGAGGG-TCAGTCACCCTTGACCACACTGAACTAGTCGTCACCTTTCCACT----CTTCCT
Macro Bat CGCCCCTTAGCTACATCTCAGAGG--TCCGTTCCCCTTGCTCACACTGACCTCTTCTTTACCTCCCCACGT---CTTTGT
Micro Bat CCTTCCTTAGCTACGTCATGGAAGA-CCCGCTACCCTTTCCCACACTGACCTATTCTTTACCTCCTCCCTT---CTTTGT
Dog CACTCCTTACCTACGTCATGGAAGG-TCTGTTACCCCTGCTCCTA-TGACCTCTCCTTTACCT--TGGCTT---CCCTGG
Cat CATTCCTTATCCACGTCATAAAAGG-GCTGTTACCCTTGGTCACACTGACCTATTCTTCACCTCTTCGT-----CTTTGT
Giant Panda CACTCCTGAGTTACATCATAAAAAG-TCTGTTACCCTTGCTCACATTGACCTATTCTTCACCTCTT--------CTTTGT
Horse CACGCCTTAGCTACGTCGTAAAATG-TCCGTTACTCTTGCTCACACTGACCTGTCCTTTACTTCTTATCTTCTTCTTTGT
Cow CATCCCGTAGCTACGTCACGAAAGC-TCTGCTGCCCTTGCTCACACTGCCCTGTTCTTTACCTCTCTACTT---CTTTGT
Pig CACCCCTTAGCTATGTCCTAAAAGT-CCAGCTGCCCTTGCTCCCATTCACCTGTTCTTCACCTCTTTACTT---CTTTGT
Elephant AACTCCTTTGCTATGTTATAAAAGGTTCAGTTACCCTTGCTCACACTGACCTACTCTTTACCTCTTCACTTCTACTT---
Tenrec AACTGCTTTGCTACGTCACAGATGG-CCAATCACCCTTGCTCACCCTGACCTACTCTTTGCCTCTTCGCTT---CTACGT
consensus cactcCtt gctacgTcataaaagg tcagttaCcctTgctCacacTgacCtattCtttaCctctc gctt Ctttgt
FIGURE A3 | Partial alignment of conserved enhancer region in 20 vertebrate species, approximately −3800 bp of human UCP1. For genomecoordinates and full alignment, see Appendix.
www.frontiersin.org January 2013 | Volume 3 | Article 304 | 13

Shore et al. Tissue-specific expression of uncoupling protein 1
CRE PPRE CRE
Human AACTTGCTGCCACTCCTTTGCTACGTCATAAAGGGTCAGTTGCCCTTGCTCATACTGACCTATTCTTTACCTCTCTGCTTCTTCTTTGTGCCAGAAGAGTAGAAATCTGA
Cow AACTCGCCACCATCCCGTAGCTACGTCACGAAAGCTCTGCTGCCCTTGCTCACACTGCCCTGTTCTTTACCTCTCTACTTC---TTTGTGCCAGAGGAGCAGACGGCTGA
Mouse AGCTTGCTGTCACTCCTCTACAGCGTCACAGAGGGTCAGTCACCCTTGACCACACTGAACTAGTCGTCACCTTTCCACTC----TTCCTGCCAGAAGAGCAGAAATCAGA
Rat ACCTTGCTGCCGCTCCTTTGCGACGTCACAGTGGGTCAGTCACCCTTGATCACACTGCACCAGTCTTCACCTTTCCACGC----TTCCTGCCAGA---GCATGAATCAGG
consensus AaCTtGCtgcCactCCtttgCtaCGTCAcaaagGgTCaGt gCCCTTG tCAcACTG Cta TCtT ACCT TC aCt c TT TGCCAGAagaGcAgaaatC Ga
TRE PPRE NBRE BRE-2
Human CCCTTTGGGGATACCACCCTCTCCCCTACTGCTCTCTCCAACCTGAGGCAAACTTTCTCCTACTTCCCAGAGCCTGTCAGAAGTGGTGAAGCCAGCCTGCTCCTTGGAAT
Cow GCCTCTGGGGACACCGCCCTCTCCCCTACTGTTCTCTCCAACCTGAGGCAAACTTTCCCCTACTTCCCAGAGCCTCCC-GAAGGGGTAAAG-GAGCCTGGTCCTTGGAAT
Mouse CTCTCTGGGGATATCAGCCTCACCCCTACTGCTCTCTCCATTATGAGGCAAACTTTCTTTCACTTCCCAGAGGCTCT-GGGGGCAGCAAGGTCAACCCTTTCCTCAGACT
Rat CTCTCTGGGGATACCGGCCTCACCCCTACT--------------GAGGCAAACTTTCTCCCACTTCTCAGAGGCTCTGAG-GGCAGCAAGGTCAGCCCTTTCTTTGGAAT
consensus c CTcTGGGGAtAcCa CCTC CCCCTACTgctctctccaacctGAGGCAAACTTTCtcc ACTTCcCAGAG CTctcaGaaGcgG aAaGtcAgCC tTCcTtgGAaT
Enhancer region
Putative Regulatory Region
Human GCAAGGGGAAGGCATATGTACCCTCATC-TTTTGATGGGAGGAATGTGATGGATTTGCAATTATGTTTTAAAACTACTACAGACAGAACCACTGAGAAAGA-----TTCA
Cow GCAAGGGGAAGAGATATGCCCCTTTGTC-TTTTGATGAAAGCA---------ATTTGCGATTATGCTTTAAAACCACGTCAGATGGAACCACTGTGAAAGACAATGCATA
Horse ACAAGGAGGAAGGACATGGACTCTCACT-CTTTCATGGGAGGA---------ATTTGAGATTATGCTGTAAAACCACTACAGCTGGAACCGCTGTGAAGGA-----TTCA
Guinea Pig GGAAAAGGAGAGGACAGGAGCCCTTACTGCTCTCACAGGATAAATGGCTTGAAAGTGCCATTTTA-TTTAAAGTCGCT-CAGAGAGAAGCACTGTGGAAGA-----CTCA
consensus gcAAgggGaagggA AtGgaCccT a TtT AtgggAggAatg tggAttTGcgATTaTgcTtTAAAaccaCtaCAGataGAAcCaCTGtGaAaGA tcA
Human TGGGTA--GCTTTGGGGTGAGGACTGGGAATTAACCTGTTGATAGCAGAGGTTCACTAGAGTCAACAAGGAATAAGG-TCTCCTCTTGTACACTTTAGTCATACTATACC
Cow GGGTCGGTGGGTTGGGTTGTGGGTTGGGGATTATCCAGTTGA---CAGCGGTTCA--------------------------CCTTTTATGCAT-----------TATAAC
Horse GGGCTA--GGGTTTGGTTGTGGGTTGGTGATTAACCTTTCGATGGCAGAGGTTCACTAGAGTTAGCAAGGAAAAATGCTCCCCTTTTATACAT-TTAGTCATAGTATGCC
Guinea Pig GGGGTA--GGAT--GGGTGGGAGCTGGGGATTAACCATAGGACA-CAGAGGCTCTCTGGAGTTATCAAGGGCTGATG---CCTTTGCTCACATTTTTAACTTA-TACATG
consensus gGGgta GggTtgGG TGtGgg TGGggATTAaCC ttGAtagCAGaGGtTCactagagttaacaaggaataatg tccCcTtttataCAttttagtcata TAtacc
Human -AACATTCTTAACCACTGCTTAGCCATCAGCCTCACAACATAACAACTCCATCATAGTTGTACTCCCTAAGATCACCAACAATGTTAG
Cow AAACATTCCCAAT--CTGCTTAGCCATCATCCTCACAACCTAATAACTCTACCACAGCTGCACTCCCTAAGGTGATCAATTATGTTAG
Horse AAACATTCTCAATCTCTGCTTAGCCATAAGCCTCACAACCTAATAACTCCGCCACAGCGGCCCTCCCTAAGATGACCAATACTGTTAG
Guinea Pig AAACATTCTCAGT------------------CTCACACTCTCATAACTCCAACAAAGCTATGTTCCCTTGGATCTCCAAGAACATTAG
consensus aAACATTCtcAatc ctgcttagccatcagcCTCACAaccTaAtAACTCcacCAcAGctg acTCCCTaaGaT acCAAtaatgTTAG
A
B
FIGURE A4 | (A) Alignment of conserved enhancer region in human, bovine,rat, and mouse, approximately −3800 bp of human UCP1. Positions of knowntranscription factor binding sites taken from Jastroch et al. (2008) (B) Partial
alignment of conserved putative regulatory region (PRR) approximately−2200 to −2700 bp of human UCP1. For genome coordinates and fullalignment, see Appendix.
Frontiers in Genetics | Epigenomics and Epigenetics January 2013 | Volume 3 | Article 304 | 14

Shore et al. Tissue-specific expression of uncoupling protein 1
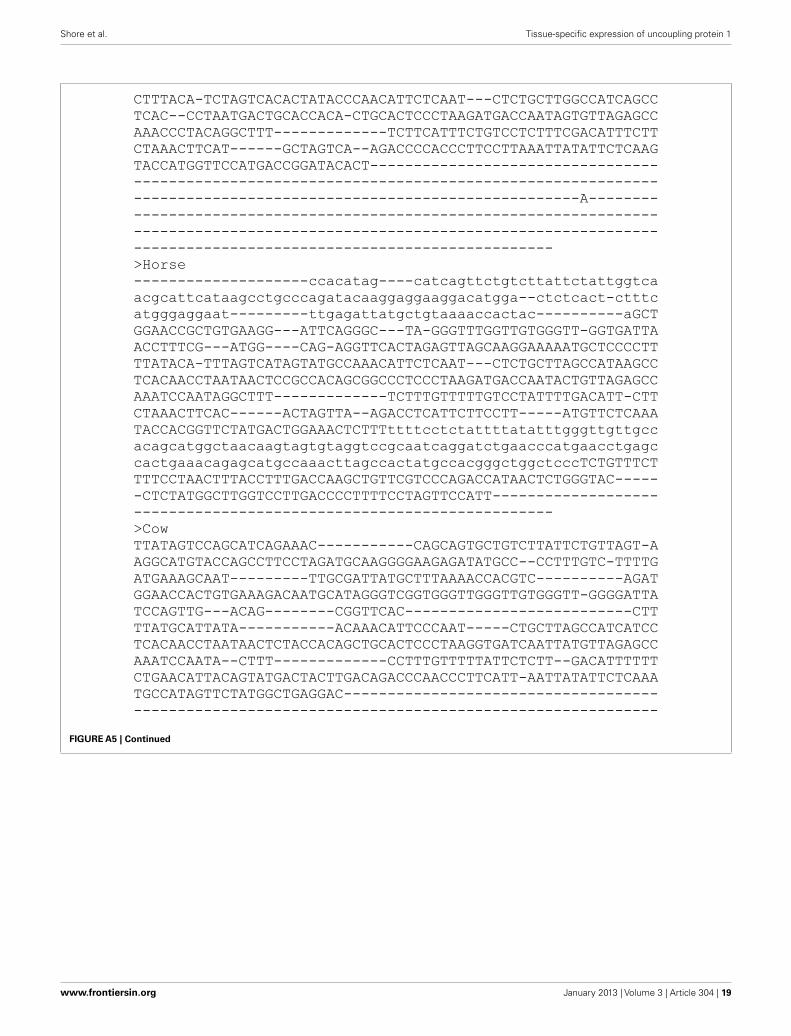
>Human
ttataatctggtctcagaagccacatgg----catcagttctgtattattctattggtca
aaacattcataagcctg-ccagatgcaaggggaaggcatatgta--ccctcatc-ttttg
atgggaggaatgtgatggatttgcaattatgttttaaaactactac----------aGAC
AGAACCACTGAGAAAG---ATTCATGGG---TA-GCTTTGGGGTGAGGACT-GGGAATTA
ACCTGTTG---ATAG----CAG-AGGTTCACTAGAGTCAACAAGGAATAAGGT-CTCCTC
TTGTACACTTTAGTCATACTA-TACCAACATTCTTAAC---CACTGCTTAGCCATCAGCC
TCACAACATAACAACTCCATCATAGTTGTACTCCCTAAGATCACCAACAATGTTAGAGTC
AAATCCGGTAGGTTTT-------------TCTTTGTTTTTGTCCTCCT--GACATTTTTT
CTAAACTTGAC------ACTGGTC---AGACCCAATCTTTCTTT-AATCATATTCTTAAA
TACCA--GTTCTATCACTGGATATGTT---------------------------------
------------------------------------------------------------
---------------------------------------------------ACTGTTTCT
TGTTCTCACTCTACCTTTGACAAAGCCATTCTTTCCAGACTATAACTCTGGGTCTGGGTC
CCCCTATGGTTTGGCCCTTGAATTCTTTTCCTAGTCCTATTTGACTAGCCCCATTTTCCC
GTGAAAAGCATGCCCCTTTCATTGCATCCATATCATGACTACCAAATA
>Chimp
ttataatctggtctcagaagccacatgg----catcagttctgtattattctattggtca
aagcattcataagcctg-ccagatgcaaggggaaggcatatgta--ccctcatc-ttttg
atgggaggaatgtgatggatttgcaattatgttttaaaGCTACTAC----------AGAC
AGAACCACTGAGAAAG---ATTCATGGG---TA-GCTTTGGGGTGAGGACT-GGGAATTA
ACCTGTTG---ATAG----CAG-AGGTTCACTAGAGTCAACAAGGAATAAGGT-CTCCTC
TTGTACACTTTAGTCATACTA-TACCAACATTCTTAAC---CACTGCTTAGCCATCAGCC
TCACAACATAACAACTCCATCATAGTTGTACTCCCTAAGATCACCAACAATGTTAGAGTC
AAATCCGGTAGGTTTT-------------TCTTTGTTTTTGTCCTCCT--GACATTTTTT
CTAAACTTGAC------ACTTC-----AGACCCAATCTTTCTTT-AATCATATTCTTAAA
TACCA--GTTCTATCACTGGATATGTT---------------------------------
------------------------------------------------------------
---------------------------------------------------ACTGTTTCT
TGTTCTCACTCTACCTTTGACAAAGCCATTCTTTCCAGACTATAACTCTGGGTCTGGGTC
CCCCTATGGTTTGGCCCTTGAACTCTTTTCCTAGTCCTATTTGACTAGCCCCATTTTCCC
GTGAAAAGCATGCCCCTTTCATTGCATCCATATCATGACTACCAAATA
>Orangutan
ttataatctggtctcagaagccacatgg----catcagttctgtattattctattggtca
aagcattcataagcctg-ccagat---------------atgga--tcctcatc-ttttg
atgggaggaatgtgatggatttgcaattatgttttaaaaccactac----------aGAT
FIGURE A5 | Continued
www.frontiersin.org January 2013 | Volume 3 | Article 304 | 15

Shore et al. Tissue-specific expression of uncoupling protein 1
AGAACCACTGAGAAAG---ATTCATGAG---TA-GCTTTGGGGTGAGGACT-GGGAATTA
ACCTGTTG---ATAG----CAG-AGGTTCACTTGAGTCAGCAAGAAATAAGGT-CTCGTC
TTGTACACTTTAGTGATACTA-TACCAACATTCTTAAC---CACTGCTTAGCCATCAGCC
TCACAATCTAACAACTCCATGATAGTTGTACTCCCTAAGATCACCAACAATGTTAGAGTC
AAATCCGGTAGGTTTT-------------TCTTTGTTTTTGTCCTCTT--GACATTTTTT
CTAAACTTGAC------ACTGGTC---ACACCCAGTCTTTCTTT-AATCATATTCTTAAA
TACCA--GTTCTATCACTGGATATGTT---------------------------------
------------------------------------------------------------
---------------------------------------------------ACTGTTTCT
TGTTCTCACTCTACCTTTGACAAAGCCATTCTTTCCAGACT-------------------
------------------------------------------------------------
------------------------------------------------
>Rhesus_Macaque
ttataatctggtctcagaagccacatggcatccatcagttctgtattattctattggtca
aagcattcataagcctg-ccagatgcaaggggaaggcacatgga--ccctcatc-ttttg
atggga-gaatgtgatggatttgcaattatgttttaaaaCTACTAC----------AGAT
AGAACCACTGAGAAAG---ATTCATGGG---TA-GCTTTGGGGTGAGGATT-GGGAATGA
ATCCGTTG---AT-G----CAG-AGTTTCACTAGAGTCAGCAAGGAATAAGGC-CTCCTC
ACGGACATTTTAGTCATACTC-TACCAACATTCTTAGC---CACTGCTTAGCCatcagcc
gcacaacctaacaactccatcatagttgtactccctaagatcaccaacaatcttagagtc
aaatccagtaggtttt-------------tcttggtttttgtcctctt--gacatttttt
ctaaacttgac------actggtca--agacccaatctttattt-aatcatgttcttaaa
tacta--gctctatcactggata-------------------------------------
------------------------------------------------------------
-------------------------------------------------------tcact
tgttctcactctacctttgacaaggccattctttccagact-------------------
------------------------------------------------------------
------------------------------------------------
>Mouse_Lemur
TTATGATCCAGTCTCAGAAGCCACATAG----CATCAGTTC----TTATTCTATTGGTCC
AAGCATTCACAAGCCTG-CCCGATGCAAGGGGAAGGCACATGGA--CCCTCA-C-TTTTG
ATAAGAGTAATGTCATGTACTTGCAATTATGTTTTAAAACCACTAC----------AGAT
AGAATCATGGAGAGAG---ATTCATGAG---TG-GAGCT-GAGTGAGGGTT-GGGGATTG
ACCAGTTG---CTAG----CGG-AGGTTCACTAGAGTTAGCAAGGAATAATGC-CCCCTC
TTATGCATTTTAGTCATCCTACTTTGGGCACGCTCAAC---CTCTGCTTGGCCGTCAGCC
TCACAACTTAATAACTCCACCATAGCTGCACTGTCTAAGATCACCAATACTATCAGAGCC
AAATTCAATAGGCTTT-------------TC------TTTGTCCTCTT--GACATTTCTT
CTAAACTTGAC------ACTGGTTA--AGACTCAACATTTCTTT-AATCATATTCTTAAA
FIGURE A5 | Continued
Frontiers in Genetics | Epigenomics and Epigenetics January 2013 | Volume 3 | Article 304 | 16

Shore et al. Tissue-specific expression of uncoupling protein 1
TGCCA-GGCTCTATGACTG--CGTGCT---------------------------------
------------------------------------------------------------
---------------------------------------------------ACTGTTTCT
TGTCCTAAATCTACCTTTGGCAAGGCC---------------------------------
------------------------------------------------------------
------------------------------------------------
>Tree_Shrew
------------------------------------------------------------
----------------------------------------------------CT-TTTAG
ATAGGAAGAATGTTATGGTTTTCC-------TTTTGAAGCTACTAT----------GCAT
AGAACCACTGAGAAAA---TTTTGTGGA---TA-GGATTGGGGTGAAGTTT-GAGGAGTA
ACAAATTG---ATAG----AAG-AGGTTCCCTAGAGATAACACAGGATGATCC-CTCCTC
TTATACATGTTCATCATACCATGCCCAACATTCTCAAC---CTCTGCTTAGCCATCAG-C
TTACAACCTAATAACTCTACCATAATTTTATTCCCTAAAATCACCAGTAATGT-------
------------------------------------------------------------
------------------------------------------------------------
------------------------------------------------------------
------------------------------------------------------------
------------------------------------------------------------
------------------------------------------------------------
------------------------------------------------------------
------------------------------------------------
>Rabbit
------------------------------------------------------------
------------------------------------------------------------
-----AGGAAT-------------------------------------------------
----------------------------------------------------GAGGATTA
ACC-GTTG---ACAG----CAG-AGGTACAATGGAGTTAG-AAAGAGCAGTG--CCCCTC
CTATTTATTTTAGTCATTTTACACTAGGCATTC----------CTGCTTAGCCATCAGCC
TCACAACCTAATGATTCCATCACAGTTGTGCTTCCTAACATCACCAATAATGC-AAAGGC
AAACCTATTCAGCTTT-----------------AGTTTTTGTCCTCTT--GACATTCATT
CTACACTTGAC------ATTGGTAA--AGACTTGCATCTTCTTC-ACTCATATTCTCAAA
TACCAG------------------------------------------------------
------------------------------------------------------------
------------------------------------------------------------
------------------------------------------------------------
------------------------------------------------------------
------------------------------------------------
FIGURE A5 | Continued
www.frontiersin.org January 2013 | Volume 3 | Article 304 | 17

Shore et al. Tissue-specific expression of uncoupling protein 1
>Guinea_Pig ---------------------cacatag----catccgctctgtcttacacaggcagcca
cagcatcctcaggcctg-tcaggtggaaaaggagaggacaggag--cccttactgctctc acaggataaatgGCTTGAAAGTGCCATTTTA-TTTAAAGTCGCTC-----------AGAG
AGAAGCACTGTGGAAG---ACTCAGGGG---TA-GGAT--GGGTGGGAGCT-GGGGATTA ACC--------ATAGGACACAG-AGGCTCTCTGGAGTTATCAAGGGCTGATGC-CTTTGC TCACATTTTTAACTTATAC---ATGAAACATTCTCAGT---------------------C
TCACACTCTCATAACTCCAACAAAGCTATGTTCCCTTGGATCTCCAAGAACATTAGACCC AAATCCAGTAGCCTGTGTCTGTCTGTCGGTCTATCTCTTTGTCACCTCCTGACATTTATT
GCAAACTTGAC------ACTGA-----AGCCCCAGCCCTTCTTT-CAATATAGTCTCAAA TACCA-AGTTCTAAGACCCTACATGCT--------------------------------- ------------------------------------------------------------
---------------------------------------------------ACTGTTTCT TGTCCTAACTCTACCTGTGGCCA-GTCATTCTTTCCAGACC-------------------
------------------------------------------------------------ ------------------------------------------------ >Macro_Bat
TTATGATCCAGCCTCGGAAACTACATAG----CATCAGCTCCGTCTTATCCTATTGGTCA
AAGCGTTTACAAGCCGGCCCAGAAGTGAGGGGGAGGAACATGGA--CCCTCACC-TTTTG
ATGGGAGAGACT---------TGGAATTATGCTTTAAAACTACTAC----------AGAT GGAAGCACCCATGAAGG-GGTTCAGGGG---TAGGGGTTGGGTTGTGAGTTGGGGGATTA GCCAGCCAGCCATAG----CAGAAAGCTCACTAGCGTTGGCAAGAAATGAT---------
------------------------------------------------------------ ------------------------------------------------------------
--------------------------------------------------GACCCTTCTT ------------------------------------------------------------ ------------------------------------------------------------
------------------------------------------------------------
------------------------------------------------------------
------------------------------------------------------------ ------------------------------------------------------------ ------------------------------------------------
>Giant_Panda tcatgatctagcctcagaaaccacatag----catcagttctgtcttaatctgttggtta
aagcattcacaagcctgcccagatgcaaggggaagggacatgga--ccctcacc-cttta acagga-gaat---------gtgtGATTATGCTTTAAAACAACTAC----------AGGT GGAA-CATTGTGAACG---ATTCAGG-T---TA-GGGTCGGGTTGTGGGTT-GAGGACTA
ACCAGTTG---ATAG----C---TAACTCTCTAGAGTTAGCTAGGAAAAATGC-CCCCCC
FIGURE A5 | Continued
Frontiers in Genetics | Epigenomics and Epigenetics January 2013 | Volume 3 | Article 304 | 18
Shore et al. Tissue-specific expression of uncoupling protein 1
CTTTACA-TCTAGTCACACTATACCCAACATTCTCAAT---CTCTGCTTGGCCATCAGCC TCAC--CCTAATGACTGCACCACA-CTGCACTCCCTAAGATGACCAATAGTGTTAGAGCC
AAACCCTACAGGCTTT-------------TCTTCATTTCTGTCCTCTTTCGACATTTCTT CTAAACTTCAT------GCTAGTCA--AGACCCCACCCTTCCTTAAATTATATTCTCAAG
TACCATGGTTCCATGACCGGATACACT--------------------------------- ------------------------------------------------------------ ---------------------------------------------------A--------
------------------------------------------------------------ ------------------------------------------------------------
------------------------------------------------ >Horse --------------------ccacatag----catcagttctgtcttattctattggtca
acgcattcataagcctgcccagatacaaggaggaaggacatgga--ctctcact-ctttc atgggaggaat---------ttgagattatgctgtaaaaccactac----------aGCT
GGAACCGCTGTGAAGG---ATTCAGGGC---TA-GGGTTTGGTTGTGGGTT-GGTGATTA ACCTTTCG---ATGG----CAG-AGGTTCACTAGAGTTAGCAAGGAAAAATGCTCCCCTT TTATACA-TTTAGTCATAGTATGCCAAACATTCTCAAT---CTCTGCTTAGCCATAAGCC
TCACAACCTAATAACTCCGCCACAGCGGCCCTCCCTAAGATGACCAATACTGTTAGAGCC
AAATCCAATAGGCTTT-------------TCTTTGTTTTTGTCCTATTTTGACATT-CTT
CTAAACTTCAC------ACTAGTTA--AGACCTCATTCTTCCTT-----ATGTTCTCAAA TACCACGGTTCTATGACTGGAAACTCTTTttttcctctattttatatttgggttgttgcc acagcatggctaacaagtagtgtaggtccgcaatcaggatctgaacccatgaacctgagc
cactgaaacagagcatgccaaacttagccactatgccacgggctggctcccTCTGTTTCT TTTCCTAACTTTACCTTTGACCAAGCTGTTCGTCCCAGACCATAACTCTGGGTAC-----
-CTCTATGGCTTGGTCCTTGACCCCTTTTCCTAGTTCCATT------------------- ------------------------------------------------ >Cow
TTATAGTCCAGCATCAGAAAC-----------CAGCAGTGCTGTCTTATTCTGTTAGT-A
AGGCATGTACCAGCCTTCCTAGATGCAAGGGGAAGAGATATGCC--CCTTTGTC-TTTTG
ATGAAAGCAAT---------TTGCGATTATGCTTTAAAACCACGTC----------AGAT GGAACCACTGTGAAAGACAATGCATAGGGTCGGTGGGTTGGGTTGTGGGTT-GGGGATTA TCCAGTTG---ACAG--------CGGTTCAC--------------------------CTT
TTATGCATTATA-----------ACAAACATTCCCAAT-----CTGCTTAGCCATCATCC TCACAACCTAATAACTCTACCACAGCTGCACTCCCTAAGGTGATCAATTATGTTAGAGCC
AAATCCAATA--CTTT-------------CCTTTGTTTTTATTCTCTT--GACATTTTTT CTGAACATTACAGTATGACTACTTGACAGACCCAACCCTTCATT-AATTATATTCTCAAA TGCCATAGTTCTATGGCTGAGGAC------------------------------------
------------------------------------------------------------
FIGURE A5 | Continued
www.frontiersin.org January 2013 | Volume 3 | Article 304 | 19

Shore et al. Tissue-specific expression of uncoupling protein 1
---------------------------------------------------ACTGTTTCT
T-TCCTAATTTGACCTTTGATAAGGTCATTTTTCCTAGACTATAACTTTGGGGAT-----
-CCCTATAGCTTGACCCTTGACCCCTTTTCCTAGTCCCATTATACTCATTCCCATGTAAA
GTGTGGACCTTCTTTTCTTGCATTCATAT---TGCTGACTCTCAAATA
>Tenrec
------------------------------------------------------TGGTCC
GAGCATCCACAAGCCTGTCCGCGTGCAAGAC-AAGGGACGTGGATTCCCACACC-TATTG
AATGGAAGAGCGGAAAACTGTTGGGATTATGCTTCAAAGCCACGGCCTGTGGGTAGATAC
AGAACCACGGTGATGA---ATCCAGAGA---GA-GGTTTGGGGGGGAGGGTCAAGGATCA
AGC-ATTG---GTAG----CAA-AGGTTCACTAGAGCTGGCAAGGAACA-----------
------------------------------------------------------------
------------------------------------------------------------
------------------------------------------------------------
------------------------------------------------------------
------------------------------------------------------------
------------------------------------------------------------
------------------------------------------------------------
------------------------------------------------------------
------------------------------------------------------------
------------------------------------------------
>Elephant
------------ctcaaaagccacata-----catcagctcttttatattctattggtta
tatcattcatgagcctgcccagatgcaaggggaggggacgtgtc----------------
----aaagaat---------ttgagattatgttttaaaactactacaTGTGGGTAGATAA
AGAACAACTGGTAAGG---ATCCAGGGA---TA-GGGTTTGGGTGAGGGTC-AAGGATTA
AAC-ATTG---GTAG----CAG-AGCTTCACTAGAGCTGGCAAGGAATAATAT-CCACCC
CCATACATTTTA----TACTACACTTAATGTTCTTCACTGTCTCTTCTTAGCTACCAGCT
TTGAACCCTAAAAATGCCACCGTAGTTGTTCTCCATAACATCACCAGTAATGTTACATCC
AAACCCAACAGATTTT--------------CTTTATTTGGGTCCTCTT--AACATCTCTT
CTGAACTTGAC------GCTGGTTTAAGGGCCAACCTCTTCTTC-------ATCTTCAAA
TACCGTTGTTCTATGGCTGGATACACT---------------------------------
------------------------------------------------------------
---------------------------------------------------GCTGTTTCT
TCTCCTACCTCCACCTTTGACAAACCCATTCCTCCCAGTCT-------------------
------------------------------------------------------------
------------------------------------------------
FIGURE A5 | Sequence of the conserved enhancer region in 20 vertebrate species.
Frontiers in Genetics | Epigenomics and Epigenetics January 2013 | Volume 3 | Article 304 | 20