a continuous and sustainable internal process improvement
TRANSCRIPT

Department of Industrial Engineering University of Stellenbosch
Theory of Perspective: A continuous and sustainable internal process
improvement roadmap for small business managers
Francois Winterbach
Thesis presented in partial fulfilment of the requirements for the degree of
Master of Industrial Engineering in the Faculty of Engineering at Stellenbosch University
Supervisor: Mr KH von Leipzig
March 2015

Page i
Declaration
By submitting this thesis electronically, I declare that the entirety of the work
contained therein is my own, original work, that I am the sole author thereof (save to
the extent explicitly otherwise stated), that reproduction and publication thereof by
Stellenbosch University will not infringe any third party rights and that I have not
previously in its entirety or in part submitted it for obtaining any qualification.
Date: December 2014
Copyright © 2015 Stellenbosch University
All rights reserved
Stellenbosch University https://scholar.sun.ac.za

Page ii
Acknowledgement
I would like to acknowledge and express my sincere gratitude for the following people:
Mr von Leipzig for his acceptance and appreciation of my research proposal
and his encouragement to pursue some ambitious ideas.
Mom and dad, Elize and Francois, for their continuous and unconditional
financial and emotional support.
Jana Thirion for her love, support, encouragement, and most of all, patience.
I would also like to thank God because he blessed me with the intellectual strength,
drive, and endurance that made it possible for me to complete this research report.
Stellenbosch University https://scholar.sun.ac.za
Page iii
Abstract
Small, medium and micro enterprises are important contributors to the economic and
socioeconomic development of South Africa. However, most enterprises struggle to
become established. The high rate of failure is due to a lack of access to finance,
poor managerial and technical skills, and also the competitive business environment.
The focus of this research report is on the development of a continuous and sustainable
internal process improvement roadmap that provides skill constrained small business
managers with strategic and technical support, in order to make their organisations
more competitive in the current business environment, without expensive consultation.
The first step toward the development of the roadmap is discussed as a ten step basic
process improvement cycle, based on an interpretation of the PDCA cycle. These ten
steps provide most of the methods that are needed for practical implementation of
improvement activities. However, this approach needs strategic support in order to
ensure that improvement activities focus on the critical improvement opportunities.
The second step regards the identification of strategic support, and additional
improvement methods, to align improvement activities toward the critical improvement
opportunities, which represent a common goal. Three methodologies are discussed
as individual roadmaps to determine the crucial aspects that can be integrated into a
holistic management roadmap, which accommodates practical improvement. These
methodologies are lean thinking, theory of constraints, and the six sigma philosophy.
The final roadmap is then developed, based on the principle that perspectives can be
used to develop the perception of people toward improvement. Different perspectives
are identified from the studied improvement methodologies, and the execution of
improvement activities is then supported with the basic process improvement cycle.
The perspectives are categorised into three main perspectives. First, the organisational
perspective provides an overview of the philosophy, people, and process. Second,
the primary process perspective provides an overview of the critical process aspects;
value, throughput, and quality. Third, the secondary process perspective connects
these critical process aspects in terms of effectiveness, agility, and efficiency. The
roadmap is then completed when management can transcend above perspective.
Stellenbosch University https://scholar.sun.ac.za
Page iv
Opsomming
Klein, medium en mikro ondernemings is belangrike bydraers tot die ekonomiese en
sosio-ekonomiese ontwikkeling van Suid-Afrika. Meeste ondernemings sukkel egter
om gevestig te raak. Die hoë koers van mislukking is weens ‘n gebrek aan finansiële
toegang, swak bestuurs en tegniese vaardighede, en die mededingende sake-omgewing.
Die fokus van hierdie navorsingsverslag is op die onwikkeling van ‘n deurlopende en
volhoubare interne proses verbeterings padkaart wat klein besigheid bestuurders
verskaf met strategiese en tegniese ondersteuning, sonder duur konsultasie, ten
einde hul organisasies meer mededingend the maak in die huidige sake-omgewing.
Die eerste stap vir die onwikkeling van die padkaart word bespreek as ‘n tien stap
basiese verbetering siklus, gebaseer op ‘n intrepretasie van die PDCA siklus. Hierdie
stappe voorsien meeste van die metodes wat nodig is vir praktiese implementering
van verbetering aktiwiteite. Die benadering moet egter strategies ondersteun word om
te verseker dat verbetering aktiwiteite op die kritieke verbeterings geleenthede fokus.
Die tweede stap word bespreek vir die identifisering van strategiese ondersteuning,
asook addisionele verbetering metodes, om verbetering aktiwiteite in lyn te bring met
kritiese verbeterings geleenthede, wat ‘n gemeenskaplike doel verteenwoordig. Drie
metodieke word bespreek as individuele padkaarte om die deurslaggewende aspekte
te bepaal wat geïntegreer kan word in ‘n bestuurs padkaart, wat praktiese verbetering
akkomodeer. Die metodieke is “lean thinking”, “theory of constraints”, en “six sigma”.
Die finale padkaart word dan ontwikkel, gebasseer op die beginsel dat perspektiewe
gebruik kan word om mense se persepsie van verbetering te ontwikkel. Verskillende
perspektiewe is geïndentifiseer vanuit die verbetering metodieke, en die uitvoering
van verbeterings aktiwiteite word dan ondersteun met die basiese verbeterings siklus.
Die perspektiewe is ingedeel in drie hoof perspektiewe. Eerste, die organisatoriese
perspektief verskaf ‘n hoë vlak oorsig van die filosofie, mense, en proses. Tweede,
die primêre proses perspektief verskaf ‘n oorsig van die kritiese proses aspekte;
waarde, deurset, en kwaliteit. Derde, die sekondêre proses perspektief verbind die
proses aspekte in terme van effektiwiteit, aanpasbaarheid, en doeltreffendheid. Die
padkaart word dan eindelik voltooi wanneer die bestuur perspektief te bowe kan kom.
Stellenbosch University https://scholar.sun.ac.za
Page v
Table of Contents
Declaration ..................................................................................................... 1
Acknowledgement ......................................................................................... 2
Abstract .......................................................................................................... 3
Opsomming .................................................................................................... 4
List of Figures ................................................................................................ 9
List of Tables ................................................................................................ 11
1. Introduction ............................................................................................. 1
1.1 The enterprise life cycle methodology ......................................................... 2
1.2 Problem statement ...................................................................................... 4
1.3 Goal and objectives ..................................................................................... 5
1.4 Research approach ..................................................................................... 6
2. Basic Process Improvement .................................................................. 8
2.1 Select the focus area .................................................................................. 9
2.2 Select the team ......................................................................................... 12
2.3 Problem identification ................................................................................ 12
2.3.1 Flowchart ......................................................................................................... 13
2.3.2 Cause-and-effect diagram ............................................................................... 15
2.3.3 Five whys ......................................................................................................... 16
2.4 Define objectives ....................................................................................... 17
2.5 Plan improvement ..................................................................................... 18
2.5.1 Idea generation ................................................................................................ 18
2.5.2 Idea prioritisation ............................................................................................. 21
2.5.3 Force field analysis .......................................................................................... 24
2.6 Data collection .......................................................................................... 26
2.6.1 Operational definitions ..................................................................................... 26
2.6.2 Data collection plan ......................................................................................... 27
2.6.3 Data collection forms ....................................................................................... 28
2.7 Pilot improvement ..................................................................................... 30
2.8 Data analysis ............................................................................................ 31
2.8.1 Numerical analysis ........................................................................................... 31
2.8.2 Histogram......................................................................................................... 33
2.8.3 Run chart ......................................................................................................... 34
2.9 Review improvement ................................................................................. 36
2.10 Adopt or adapt .......................................................................................... 37
Stellenbosch University https://scholar.sun.ac.za
Page vi
3. Lean Thinking ........................................................................................ 38
3.1 Principles .................................................................................................. 40
3.1.1 Philosophy ....................................................................................................... 41
3.1.2 People and partners ........................................................................................ 41
3.1.3 Problem solving ............................................................................................... 44
3.1.4 Process focus .................................................................................................. 45
3.2 Identify value ............................................................................................. 47
3.3 Map the value stream ................................................................................ 48
3.4 Create flow ................................................................................................ 51
3.4.1 Waste elimination ............................................................................................ 51
3.4.2 Standardised work ........................................................................................... 55
3.4.3 5-S movement ................................................................................................. 57
3.4.4 Visual control ................................................................................................... 58
3.4.5 Load levelling ................................................................................................... 59
3.4.6 Single minute exchange of die......................................................................... 63
3.4.7 Total productive maintenance.......................................................................... 64
3.4.8 Built-in-quality .................................................................................................. 66
3.5 Establish pull ............................................................................................. 68
3.6 Pursue perfection ...................................................................................... 69
4. Theory of Constraints ........................................................................... 70
4.1 Five focusing steps ................................................................................... 71
4.1.1 Identify constraint ............................................................................................. 72
4.1.2 Exploit constraint ............................................................................................. 73
4.1.3 Subordinate operations .................................................................................... 73
4.1.4 Elevate constraint ............................................................................................ 75
4.1.5 Avoid inertia ..................................................................................................... 75
4.2 The thinking process ................................................................................. 76
4.2.1 Current reality tree ........................................................................................... 76
4.2.2 Evaporating cloud ............................................................................................ 79
4.2.3 Future reality tree ............................................................................................. 81
4.2.4 Prerequisite tree .............................................................................................. 85
4.2.5 Transition tree .................................................................................................. 87
4.3 Throughput accounting.............................................................................. 90
4.3.1 Basic measures ............................................................................................... 90
4.3.2 Performance measures ................................................................................... 92
4.3.3 Throughput accounting reconciliation .............................................................. 93
Stellenbosch University https://scholar.sun.ac.za

Page vii
5. Six Sigma Thinking ............................................................................... 97
5.1 Define ....................................................................................................... 99
5.1.1 Project charter ............................................................................................... 100
5.1.2 SIPOC ............................................................................................................ 102
5.1.3 VOC to CTQ analysis .................................................................................... 103
5.2 Measure ...................................................................................................106
5.2.1 Cause and effect matrix ................................................................................. 106
5.2.2 Measurement system analysis ...................................................................... 107
5.2.3 Performance baseline .................................................................................... 109
5.3 Analyse ....................................................................................................111
5.3.1 Pareto analysis .............................................................................................. 111
5.3.2 Scatter plot ..................................................................................................... 113
5.4 Improve ....................................................................................................115
5.4.1 Six thinking hats ............................................................................................. 115
5.4.2 Failure mode and effect analysis ................................................................... 117
5.5 Control .....................................................................................................119
5.5.1 Control charts introduction ............................................................................. 120
5.5.2 Attribute control charts ................................................................................... 121
5.5.3 Variable control charts ................................................................................... 123
5.5.4 Control chart structure ................................................................................... 124
5.5.5 Analysis and revision ..................................................................................... 126
5.6 Theory of management ............................................................................127
5.6.1 Paradigms ...................................................................................................... 128
5.6.2 Components .................................................................................................. 129
5.6.3 Points for management .................................................................................. 130
6. Theory of Perspective: A roadmap for continuous improvement .. 138
6.1 Organisational perspective .......................................................................141
6.1.1 Philosophy perspective .................................................................................. 142
6.1.2 People perspective ........................................................................................ 144
6.1.3 Process perspective ...................................................................................... 146
6.2 First intermission: Reflect and prepare .....................................................148
6.2.1 Reflect on the organisational perspective ...................................................... 148
6.2.2 Prepare the PDCA cycle ................................................................................ 148
6.3 Primary process perspective ....................................................................150
6.3.1 Value perspective .......................................................................................... 151
6.3.2 Throughput perspective ................................................................................. 153
6.3.3 Quality perspective ........................................................................................ 155
Stellenbosch University https://scholar.sun.ac.za
Page viii
6.4 Second intermission: Reflect and prepare ................................................157
6.4.1 Reflect on the primary process perspective .................................................. 157
6.4.2 Prepare the tactic trees .................................................................................. 157
6.5 Secondary process perspective ...............................................................159
6.5.1 Effectiveness perspective .............................................................................. 160
6.5.2 Agility perspective .......................................................................................... 162
6.5.3 Efficiency perspective .................................................................................... 164
6.6 Resolution: Transcend above perspective ................................................166
7. Validation ............................................................................................. 168
8. Conclusion ........................................................................................... 170
References.................................................................................................. 171
Stellenbosch University https://scholar.sun.ac.za

Page ix
List of Figures
FIGURE 1.1: THE ENTERPRISE LIFE CYCLE ..................................................................... 3
FIGURE 1.2: IMPROVEMENT METHODOLOGIES VS. PROJECT PERFORMANCE TRIANGLE ...... 6
FIGURE 2.1: BASIC PROCESS IMPROVEMENT STEPS BASED ON THE PDCA CYCLE ............ 9
FIGURE 2.2: PROCESS SELECTION MODEL ................................................................... 10
FIGURE 2.3: IMPACT ANALYSIS MATRIX ........................................................................ 11
FIGURE 2.4: BASIC FLOWCHART WITH SWIM LANES ....................................................... 14
FIGURE 2.5: CAUSE-AND-EFFECT DIAGRAM (FISHBONE DIAGRAM) ................................. 15
FIGURE 2.6: FIVE WHYS .............................................................................................. 16
FIGURE 2.7: CRITERIA FOR A SMART OBJECTIVE ........................................................ 17
FIGURE 2.8: PAIRWISE RANKING MATRIX FOR FIVE IDEAS .............................................. 24
FIGURE 2.9: FORCE FIELD ANALYSES .......................................................................... 25
FIGURE 2.10: OPERATIONAL DEFINITION ...................................................................... 26
FIGURE 2.11: DIFFERENT TYPES OF CHECK SHEETS ..................................................... 28
FIGURE 2.12: NUMERICAL ANALYSIS ............................................................................ 32
FIGURE 2.13: HISTOGRAM .......................................................................................... 34
FIGURE 2.14: RUN CHART........................................................................................... 36
FIGURE 3.1: TOYOTA PRODUCTION SYSTEM FRAMEWORK ............................................ 39
FIGURE 3.2: SUPPLIER PARTNERING HIERARCHY .......................................................... 43
FIGURE 3.3: DIFFERENCE BETWEEN PROCESS VIEW AND FUNCTIONAL VIEW ................... 46
FIGURE 3.4: THE FIVE LEAN IMPROVEMENT STEPS ........................................................ 46
FIGURE 3.5: TAKT TIME CALCULATION ......................................................................... 49
FIGURE 3.6: VALUE STREAM MAP ................................................................................ 50
FIGURE 3.7: SDSA STANDARDISATION CYCLE .............................................................. 56
FIGURE 3.8: LOAD LEVELLING (OPERATOR SCHEDULE) ................................................. 61
FIGURE 3.9: LOAD LEVELLING (PRODUCTION SCHEDULE) .............................................. 62
FIGURE 3.10: OVERALL EQUIPMENT EFFECTIVENESS .................................................... 65
FIGURE 3.11: KANBAN CALCULATION ........................................................................... 69
FIGURE 4.1: FIVE FOCUSING STEPS OF THEORY OF CONSTRAINTS ................................. 71
FIGURE 4.2: DRUM-BUFFER-ROPE METHOD WITH A KANBAN BUFFER .............................. 74
FIGURE 4.3: TYPES OF TACTIC TREE CONNECTIONS ..................................................... 77
FIGURE 4.4: CURRENT REALITY TREE .......................................................................... 78
FIGURE 4.5: EVAPORATING CLOUD .............................................................................. 79
FIGURE 4.6: FUTURE REALITY TREE WITHOUT NEGATIVE BRANCHES .............................. 82
Stellenbosch University https://scholar.sun.ac.za

Page x
FIGURE 4.7: FUTURE REALITY TREE WITH NEGATIVE BRANCHES .................................... 83
FIGURE 4.8: MITIGATION AND AVOIDANCE OF NEGATIVE BRANCHES ............................... 83
FIGURE 4.9: FUTURE REALITY TREE WITH A POSITIVE REINFORCEMENT LOOP ................. 84
FIGURE 4.10: PREREQUISITE TREE .............................................................................. 86
FIGURE 4.11: TRANSITION TREE WITHOUT NEGATIVE BRANCHES ................................... 88
FIGURE 4.12: MITIGATION AND AVOIDANCE OF NEGATIVE BRANCHES (TRANSITION TREE) 89
FIGURE 4.13: THROUGHPUT ACCOUNTING: BASIC MEASURES ....................................... 91
FIGURE 4.14: THROUGHPUT ACCOUNTING: PERFORMANCE MEASURES ......................... 92
FIGURE 5.1: THE SIX SIGMA DMAIC CYCLE .................................................................. 98
FIGURE 5.2: GANTT CHART ....................................................................................... 101
FIGURE 5.3: SIPOC ANALYSIS .................................................................................. 102
FIGURE 5.4: VOC ANALYSIS ..................................................................................... 104
FIGURE 5.5: KANO MODEL ........................................................................................ 105
FIGURE 5.6: CTQ ANALYSIS ...................................................................................... 106
FIGURE 5.7: CAUSE AND EFFECT MATRIX ................................................................... 107
FIGURE 5.8: PROCESS DEFECT RATE MEASURES ........................................................ 109
FIGURE 5.9: PROCESS YIELD MEASURES ................................................................... 110
FIGURE 5.10: PARETO ANALYSIS ............................................................................... 112
FIGURE 5.11: SCATTER PLOTS AND CORRELATION INTERPRETATION ........................... 114
FIGURE 5.12: SIX THINKING HATS .............................................................................. 116
FIGURE 5.13: FAILURE MODE AND EFFECT ANALYSIS .................................................. 118
FIGURE 5.14: QUALITY CONSCIOUSNESS VERSUS QUALITY STRATEGY ......................... 121
FIGURE 5.15: ATTRIBUTE CONTROL CHART SELECTION ............................................... 122
FIGURE 5.16: VARIABLE CONTROL CHART SELECTION ................................................. 124
FIGURE 5.17: CONTROL CHART STRUCTURE .............................................................. 125
FIGURE 5.18: PARADIGMS OF MANAGEMENT .............................................................. 128
FIGURE 5.19: THE KP RULE FOR INSPECTION ............................................................. 132
FIGURE 5.20: SLOGANS THAT MUST BE AVOIDED ........................................................ 136
FIGURE 6.1: ORGANISATIONAL PERSPECTIVE ............................................................. 141
FIGURE 6.2: PRIMARY PROCESS PERSPECTIVE .......................................................... 150
FIGURE 6.3: SECONDARY PROCESS PERSPECTIVE ..................................................... 159
Stellenbosch University https://scholar.sun.ac.za

Page xi
List of Tables
TABLE 1.1: SMME DEFINITIONS AS SPECIFIED IN THE NATIONAL SMALL BUSINESS ACT .... 1
TABLE 1.2: INTEGRATED ENTERPRISE REGISTER FIGURES FOR 2004 AND 2007 .................. 2
TABLE 2.1: NUMBER OF IDEAS TO ELIMINATE WITH REFERENCE TO TEAM SIZE ................ 22
TABLE 2.2: RATING SCALE .......................................................................................... 29
TABLE 3.1: SUMMARY OF THE 14 LEAN PRINCIPLES ...................................................... 40
TABLE 3.2: DIFFERENCE BETWEEN VALUE ADDED AND NON-VALUE ADDED ACTIVITIES .... 48
TABLE 3.3: VISUAL CONTROLS .................................................................................... 59
TABLE 3.4: TOTAL PRODUCTIVE MAINTENANCE STRATEGIES ......................................... 64
TABLE 4.1: CLASSIFICATION OF THE FIVE TACTIC TREES ............................................... 76
TABLE 4.2: CURRENT REALITY TREE EVALUATION ......................................................... 79
TABLE 4.3: THROUGHPUT ACCOUNTING INVENTORY ADJUSTMENT ................................. 95
TABLE 4.4: THROUGHPUT ACCOUNTING FORMAT ADJUSTMENT ...................................... 96
TABLE 5.1: PROJECT CHARTER SECTIONS.................................................................. 100
TABLE 5.2: CAUSES OF VARIATION ............................................................................ 119
TABLE 5.3: THE THREE PROCUREMENT SCENARIOS .................................................... 133
TABLE 5.4: EMPOWERMENT: ASSOCIATED RESPONSIBILITIES ...................................... 134
TABLE 5.5: TYPICAL BARRIERS THAT DEPRIVE EMPLOYEES FROM JOY IN WORK ............ 137
TABLE 6.1: IMPROVEMENT METHODOLOGIES SUMMARY .............................................. 138
TABLE 6.2: SUMMARISED ORGANISATIONAL PERSPECTIVE .......................................... 148
TABLE 6.3: SUMMARISED PDCA CYCLE ..................................................................... 149
TABLE 6.4: SUMMARISED PRIMARY PROCESS PERSPECTIVE ........................................ 157
TABLE 6.5: SUMMARISED THEORY OF PERSPECTIVE ................................................... 166
TABLE 7.1: MAIN SOURCE OF EACH IMPROVEMENT PHASE .......................................... 169
Stellenbosch University https://scholar.sun.ac.za

Chapter 1 Introduction Industrial Engineering
Page 1
1. Introduction
Small, medium and micro enterprises (SMMEs) in South Africa contribute positively
to economic growth. They account for more than 95% of the formal business entities
in the country and contribute between 52 to 57% to GDP [1]. These enterprises also
play a significant role in socioeconomic growth with efficient and prolific job creation
that provides around 61% to employment [1]. This is a crucial factor because South
Africa is characterised by high unemployment levels, which are estimated at 25% [2].
Classification of the different SMMEs sizes must be understood because of their
important role in economic and socioeconomic development. Enterprises in South
Africa are classified according to Schedule 1 to the South African National Small
Business Act of 1996, as revised by the National Small Business Act as amended in
2003 and 2004. This schedule classifies enterprises in the specific sector in which
they operate based on the number of employees per enterprise in combination with
their annual turnover and gross assets. A summary is provided in Table 1.1 below.
.
Table 1.1: SMME definitions as specified in the National Small Business Act
Enterprise size
Number of employees
Annual turnover
(Less than)
Goss assets; Fixed property excluded
(Less than)
Medium
Fewer than 100 or
200 dependent
upon sector
R5 million to R64 million
dependent upon sector
R3 million to R23 million
dependent upon sector
Small Fewer than 50 R3 million to R32 million
dependent upon sector
R1 million to R6 million
dependent upon sector
Very small Fewer than 10 or
20 dependent
upon sector
R500 000 to R6 million
dependent upon sector
R500 000 to R2 million
dependent upon sector
Micro Fewer than 5 Less than R200 000
Less than R100 000
Source: Schedule 1 to the National Small Business Act of 1996, as revised by the
National Small Business Act as amended in 2003 and 2004
Stellenbosch University https://scholar.sun.ac.za
Chapter 1 Introduction Industrial Engineering
Page 2
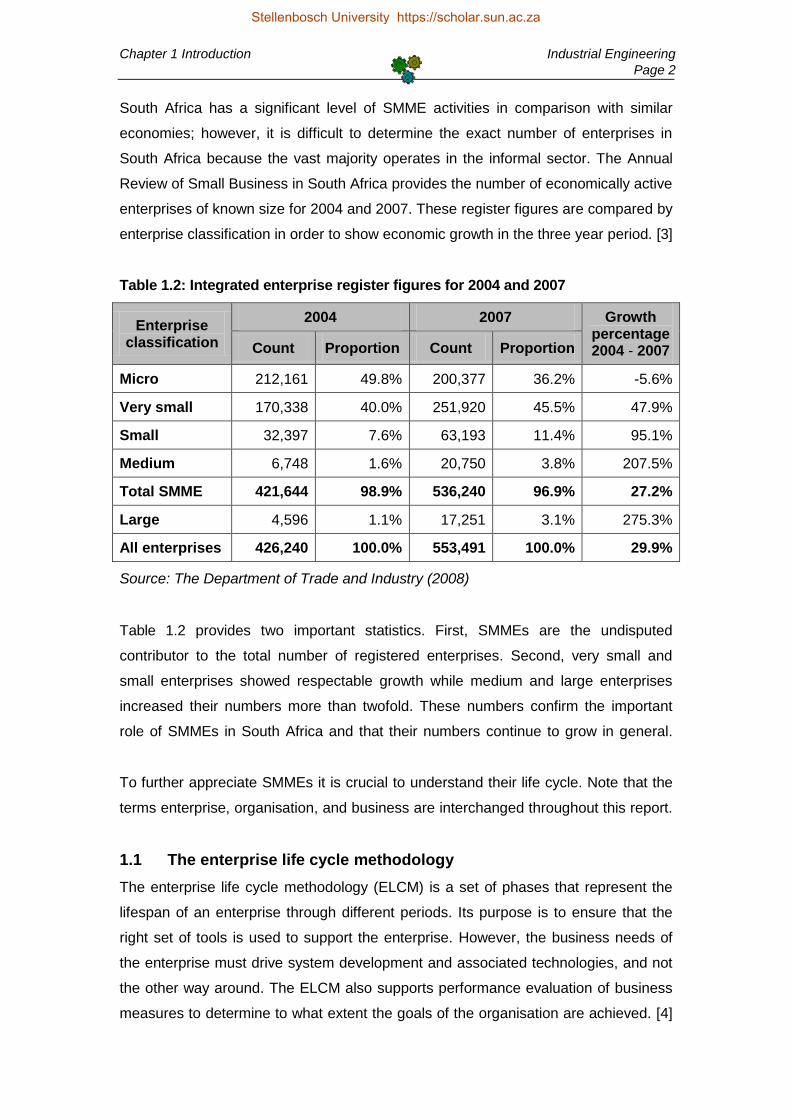
South Africa has a significant level of SMME activities in comparison with similar
economies; however, it is difficult to determine the exact number of enterprises in
South Africa because the vast majority operates in the informal sector. The Annual
Review of Small Business in South Africa provides the number of economically active
enterprises of known size for 2004 and 2007. These register figures are compared by
enterprise classification in order to show economic growth in the three year period. [3]
.
Table 1.2: Integrated enterprise register figures for 2004 and 2007
Enterprise classification
2004 2007 Growth percentage 2004 - 2007 Count Proportion Count Proportion
Micro 212,161 49.8% 200,377 36.2% -5.6%
Very small 170,338 40.0% 251,920 45.5% 47.9%
Small 32,397 7.6% 63,193 11.4% 95.1%
Medium 6,748 1.6% 20,750 3.8% 207.5%
Total SMME 421,644 98.9% 536,240 96.9% 27.2%
Large 4,596 1.1% 17,251 3.1% 275.3%
All enterprises 426,240 100.0% 553,491 100.0% 29.9%
Source: The Department of Trade and Industry (2008)
Table 1.2 provides two important statistics. First, SMMEs are the undisputed
contributor to the total number of registered enterprises. Second, very small and
small enterprises showed respectable growth while medium and large enterprises
increased their numbers more than twofold. These numbers confirm the important
role of SMMEs in South Africa and that their numbers continue to grow in general.
To further appreciate SMMEs it is crucial to understand their life cycle. Note that the
terms enterprise, organisation, and business are interchanged throughout this report.
1.1 The enterprise life cycle methodology
The enterprise life cycle methodology (ELCM) is a set of phases that represent the
lifespan of an enterprise through different periods. Its purpose is to ensure that the
right set of tools is used to support the enterprise. However, the business needs of
the enterprise must drive system development and associated technologies, and not
the other way around. The ELCM also supports performance evaluation of business
measures to determine to what extent the goals of the organisation are achieved. [4]
Stellenbosch University https://scholar.sun.ac.za

Chapter 1 Introduction Industrial Engineering
Page 3
The ELCM is represented through six sequential phases: (1) analysis and strategy,
(2) concurrent enterprise planning and enterprise engineering, (3) project execution,
(4) operations, (5) evaluation, and (6) decommission. Continuous improvement is
recurrent and supports operations based on the evaluation. The enterprise advances
through these phases in accordance with specific criteria defined by each phase. [4]
.
Figure 1.1: The enterprise life cycle
The first phase, analysis and strategy, is initiated by one or more of three external
drivers: (1) technology, (2) legislation, and (3) the market. These drivers initiate the
business idea and are analysed together with other external forces to further develop
the idea into viable enterprise opportunities. Furthermore, the vision and mission
statements of the enterprise are defined to determine the strategic business goals.
.
The second phase, enterprise engineering and enterprise planning, is characterised
by innovation to determine optimum business functions and processes that must be
in place to ensure value creation. It also includes the specification of products and
services that will be delivered, the potential market, and ownership of the enterprise.
.
The third phase, project execution, involves the initiation of business functions and
processes. A schedule is developed to transform the business plan into an enterprise
that can start with business and perform operations that are aligned with the goals
and strategies. This relies on synchronised implementation to integrate procedures.
Stellenbosch University https://scholar.sun.ac.za

Chapter 1 Introduction Industrial Engineering
Page 4
The fourth phase, operations, includes all the processes that are required to fulfil the
business objectives. These can be divided into three categories: (1) core processes,
(2) supporting processes, and (3) management processes. The profitability of the
enterprise relies on the successful implementation and execution of these processes.
The fifth phase, evaluation, involves measurement activities for performance analysis
to determine if processes are still aligned with the enterprise strategies. Evaluation is
therefore crucial for survival because it is used to identify problems and improvement
opportunities that can be exploited in the continuous improvement phase. However,
evaluation can also determine that the enterprise should rather be decommissioned.
The recurrent phase, continuous improvement, strives to perfect current processes
through implementation of improvement solutions in the operations phase. These
solutions are based on the data that was analysed in the evaluation phase. Various
improvement methodologies can be used in order to increase the competitive strategy
of the enterprise; these improvement methodologies inspired the focus of this report.
.
The final phase, decommission, is the point where the enterprise is retired because
of one or more factors. Internal factors include a lack of direction because of a drift in
focus, conflict between management priorities, or political infighting. External factors
include new and aggressive competitors that are more successful in the same market
space, customer satisfaction which has declined to such a level that rectification will
be nearly impossible, as well as changes in the same drivers that initiated the ELCM.
The strategic and technical oversights provide guidance and support for successful
business operations. These oversights include various improvement principles and
strategies, as well as statistical analysis and process optimisation tools. The execution
of these oversights requires integration of operations with a problem solving culture
that strives to ensure compliance, integration and cohesion of operational activities.
1.2 Problem statement
Small enterprises often struggle to survive and achieve financial success in South
Africa. This statement is supported by the fact that 75% of new enterprises do not
become established firms. The high rate of enterprise failure is due to various internal
and external factors that can be grouped into three categories: (1) access to finance,
(2) managerial and technical skills, and (3) the competitive business environment. [5]
Stellenbosch University https://scholar.sun.ac.za
Chapter 1 Introduction Industrial Engineering
Page 5
The lack of access to finance is of critical importance because it restricts SMMEs to
achieve their full potential. Finance is required to hire external consultants and also
for the acquisition of new and advanced business technologies. This is a fundamental
constraint for entrepreneurs who want to expand their businesses in South Africa. [6]
.
Poor managerial and technical skills render management incapable to recognise
poor work methods, and thus oblivious to the need for improvement. A large segment
of SMMEs in South Africa also suffers from shortages of tools and methods required
to proactively adapt to business changes [7]. These shortages are due to a lack of
adequate training and education, as well as insufficient management experience. [8]
The current competitive environment increases pressure to improve quality and also
to reduce cost while processes remain flexible and objectives are achieved; in South
Africa the economy is governed by large enterprises that have first-hand information
on market movements and business opportunities. These enterprises can afford the
latest technologies that give them full knowledge sharing capabilities. SMMEs do not
have the same infrastructure and struggle to survive because they have to compete
with established large international enterprises in the same business environment. [5]
1.3 Goal and objectives
The goal of this research report is to develop a systematic and proactive roadmap
that provides skill constrained small business managers with basic directions toward
sustainable and internal process improvement, without expensive external consultation.
Two objectives have been identified that must be accomplished in order to achieve
the goal: strategic support and technical support. These objectives were derived from
the oversights that provide guidance within the ELCM, to support the roadmap in
terms of skill requirements. The achievement of these objectives is crucial to ensure
compliance, integration and cohesion of the roadmap for holistic improvement.
Strategic support provides a framework of principles and strategies for management,
in order to drive and promote improvement initiatives. This includes the development
of an improvement culture that solves problems, exploits opportunities, and strives to
achieve process perfection. The affected stakeholder must therefore recognise why,
how, and when improvement opportunities should be implemented and maintained.
Stellenbosch University https://scholar.sun.ac.za
Chapter 1 Introduction Industrial Engineering
Page 6
Technical support provides the statistical analysis and process optimisation tools
required to execute the strategic support. These tools must be relatively easy to
understand in order to enable people with no or little previous process improvement
experience to successfully use them. Furthermore, technical support should not
replace strategic and tactical thinking, but rather support it where applicable.
1.4 Research approach
This research report starts with a discussion of a ten step basic improvement cycle,
based on an interpretation of the PDCA cycle, which provides the technical support
for the roadmap. Then the roadmap is aligned toward continuous improvement with
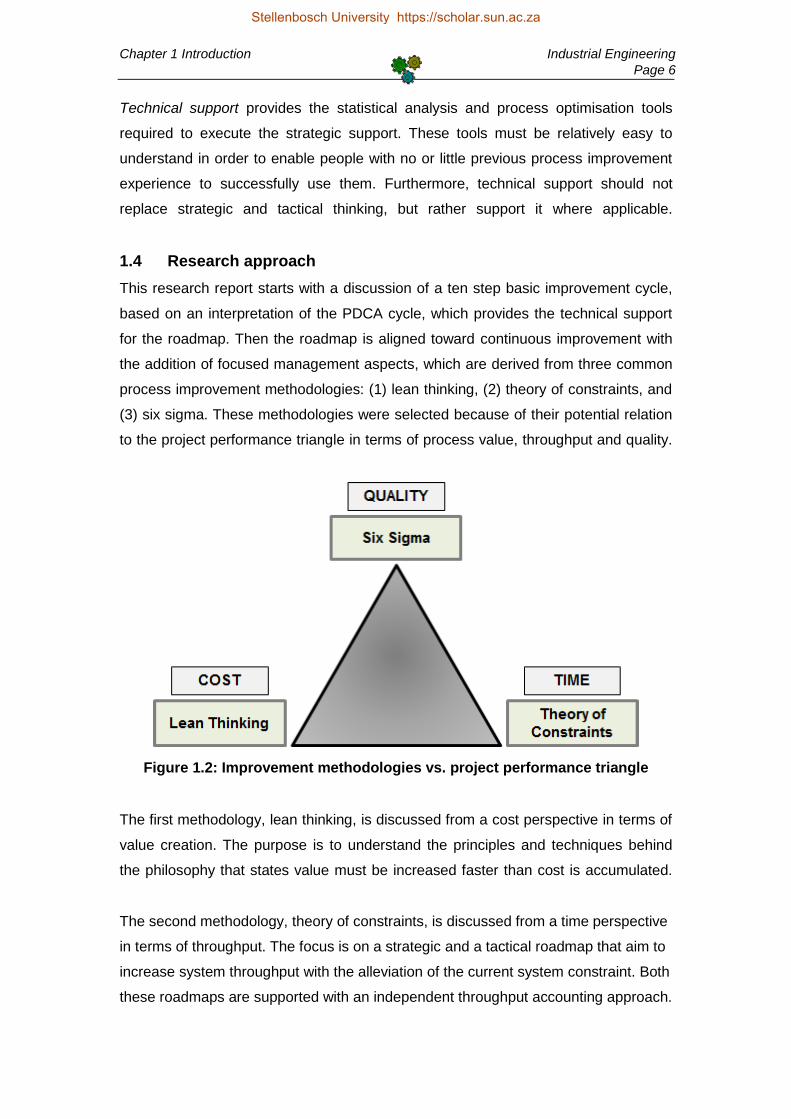
the addition of focused management aspects, which are derived from three common
process improvement methodologies: (1) lean thinking, (2) theory of constraints, and
(3) six sigma. These methodologies were selected because of their potential relation
to the project performance triangle in terms of process value, throughput and quality.
Figure 1.2: Improvement methodologies vs. project performance triangle
The first methodology, lean thinking, is discussed from a cost perspective in terms of
value creation. The purpose is to understand the principles and techniques behind
the philosophy that states value must be increased faster than cost is accumulated.
The second methodology, theory of constraints, is discussed from a time perspective
in terms of throughput. The focus is on a strategic and a tactical roadmap that aim to
increase system throughput with the alleviation of the current system constraint. Both
these roadmaps are supported with an independent throughput accounting approach.
Stellenbosch University https://scholar.sun.ac.za

Chapter 1 Introduction Industrial Engineering
Page 7
The third methodology, six sigma, is discussed from a quality perspective. Various
process optimisation and basic statistical analysis tools are explored in context of the
DMAIC cycle. The purpose is to understand the development of a quality conscious
culture and systematically deal with the elimination of variation and process defects.
These methodologies form the core of the literature study. They consist of various
tools, which are discussed where most appropriate and in the context of the specific
philosophy on which each methodology is based. These tools are discussed in short,
even though some of them seem rather straightforward, in order to ensure that the
technical aspects are understood, implemented and aligned with the strategic aspects.
The systematic approach followed to complete the literature study resulted in a set of
independent roadmaps. The next step was the integration of these roadmaps into a
single combined roadmap that makes the improvement philosophies accessible to
skill constrained small business managers, without expensive consultation. A strategic
framework was developed to guide a continuous improvement culture toward process
perfection with the support of basic statistical analysis and process optimisation tools.
Stellenbosch University https://scholar.sun.ac.za

Chapter 2 Basic process improvement Industrial Engineering
Page 8
2. Basic Process Improvement
Modern process improvement concepts can be traced back to initiatives undertaken
in companies in the 1800s when management implemented incentive programs to
promote employee driven improvement activities. Then Frederic W. Taylor published
“The Principles of Scientific Management” in 1911. This introduced time studies that
analyse process steps to determine the best way to do them, design specialised
equipment, educate expert workers, and set production standards. Two years later
Henry Ford implemented these principles to create flow and increase throughput. [9]
.
Walter Shewart first introduced the idea of cyclical improvement in 1939; before than
improvement was implemented as a sequential approach. This concept evolved into
what became known as the Shewart cycle. W. Edwards Deming modified this
concept in order to develop the Deming wheel, which he presented in 1950 during an
eight-day seminar in Japan sponsored by the Japanese Union of Scientist and
Engineers. The Japanese adopted this approach and recast it as the PDCA cycle. [10]
The PDCA cycle is a four phase approach used to solve problems with the careful
planning and small scale implementation of solutions, which is then analysed with
feedback measures to identify and standardise the most successful solutions. This
approach combines various resources in a concerted effort to achieve improvement.
Plan phase: This initiation phase determines what should be done, who should do it,
when should it be done, and where it should be done. This includes the identification
of a focus area and the selection of a team, which is required to identify opportunities
and problems, generate and evaluate solutions, and develop the improvement plan.
Do phase: The purpose of this phase is to implement a pilot improvement process on
small scale basis and support it with data collection. Data is first collected to create a
baseline that enables the team to track improvement efforts. The data is then used to
evaluate predicted results and also to identify and analyse unexpected occurrences.
Check phase: This phase is also called the study phase to emphasise the extensive
analysis of the data collected in the previous phase. The goal is to extract and derive
new knowledge with basic data analysis tools and improvement reviews. Data is also
evaluated to ensure that results are in line with organisational objectives and policies.
Stellenbosch University https://scholar.sun.ac.za

Chapter 2 Basic process improvement Industrial Engineering
Page 9
Act phase: This phase reflects on the information from the check phase to determine
what improvement solutions to adapt when needed or to adopt as the standard mode
of operation. Otherwise, the changes are rejected and new alternatives are evaluated
for implementation. Nevertheless, the cycle is repeated for continuous improvement.
These four phases are simplified into ten steps to create a management framework
that guides a problem solving culture with incremental directions toward improvement
without the support of external consultation. This cycle also provides the practical
implementation roadmap to align activities with various improvement methodologies.
Figure 2.1: Basic process improvement steps based on the PDCA cycle
2.1 Select the focus area
The first step is to identify potential focus areas appropriate for improvement. Noriaki
Kano [11] suggested that a focus area can be identified from two main sources that also
initiate the need for transformation; either a problem exists (crisis), or an opportunity
exists (vision). Whatever the source for improvement, three steps guide the selection
process: (1) process selection model, (2) impact analysis matrix, and (3) boundaries.
Step 1: Process selection model
The selection of the focus area is crucial when several opportunities for improvement
are available; higher consideration in improvement selection leads to better results in
a shorter time. The process selection model provides a basic approach to optimise
the selection process through the categorisation of potential focus areas in terms of
how complex the focus area is and also the impact that improvement will have on the
performance of the entire organisation. This model is represented in Figure 2.2. [12]
Stellenbosch University https://scholar.sun.ac.za

Chapter 2 Basic process improvement Industrial Engineering
Page 10
Figure 2.2: Process selection model
1. Focus area. This is the recommended area to start with improvement because
it provides the largest gain with the least amount of effort, which means that
improvement opportunities must be easy to exploit, yet have a large impact
on process performance. These opportunities often include observable and
physical waste in the process, and only need basic tools to capture measures.
2. Project. These improvement opportunities are important because of their high
impact on process performance. However, these are difficult to implement
and often need a project-orientated approach to ensure success. This means
that improvement activities need a large investment in people and resources.
3. Re-evaluate. The improvement opportunities that fall into this quadrant should
be reconsidered to determine if the effort is worth the gain. This area includes
complex problems with a low impact on the performance of the organisation.
4. Empowerment. These daily management opportunities provide employees
with the responsibility to use personal judgment to make decisions within the
context of best practice methods. This approach requires an environment of
complete cooperation where employees are thoroughly trained and educated
to deal with these easy to implement, low impact improvement opportunities.
Stellenbosch University https://scholar.sun.ac.za

Chapter 2 Basic process improvement Industrial Engineering
Page 11
Step 2: Impact analysis matrix
The impact analysis matrix follows an analytical approach to prioritise tasks. This is a
valued tool when it is difficult to select the most suitable focus area with intuition from
a list with several potential opportunities. The matrix is used to rank the impact of all
the improvement opportunities with reference to specified evaluation criteria. [13]
Evaluation can be based on various criterion such as compliance to business goals,
customer satisfaction, data availability, and financial prospective. A weight is then
assigned to each criterion, which represents their relative importance to achieve the
objectives. Sum the product of the impact weights and importance weights for each
opportunity. The opportunity with the highest total is considered the most important.
Figure 2.3: Impact analysis matrix
Step 3: Boundaries
Boundaries are used to establish process ownership and determine how the process
interacts with other processes. This is important to determine who are included in the
studied process on a functional and cross-functional level. Boundaries also support
team selection to ensure that the relevant people participate in improvement activities.
When the most important improvement opportunity is identified it should be selected
as the focus area. Then the boundaries can be identified and describe in the required
detail; first define the start and end points, and then define the rest of the process
boundaries. Boundaries that are too wide can suffocate available resources, but if
they are too narrow the process is suboptimised and problems can arise elsewhere.
Stellenbosch University https://scholar.sun.ac.za

Chapter 2 Basic process improvement Industrial Engineering
Page 12
2.2 Select the team
The improvement team is a group of people that work toward a common goal. Their
purpose is to plan, implement, monitor, analyse, and evaluate process improvement
activities. The team should combine their knowledge, experience and expertise in
order to execute and manage improvement activities throughout the organisation. [14]
To initiate a team, members from top management select a leader based on personal
characteristics, behavioural skills and technical skills. This person must be respected
by both management and workers. Enough resources must then be allocated to train
and educate the leader in terms of how to lead, coordinate, and organise a team. [15]
Team members are selected on the recommendation of the leader. Resources must
also be allocated to educate them in appropriate theory and practice. A diversity of
knowledge is helpful, but it is not necessary to have all affected areas represented on
the team. However, the members must transcend above the boundaries of their own
functional areas to create a cross-functional team. They should understand that they
represent the welfare of the organisation, and not just their own interest groups. [15]
.
A typical team would consist of between five and nine people, but it depends on the
focus area. The team should include the supervisor or shop floor leader, people that
are affected by the process, and relevant support from people in human resources,
administration, finance, logistics, maintenance, engineering, and quality control. [14]
.
2.3 Problem identification
The first team activity is the identification of problems related to the focus area. Many
logical and visual problem identification tools can be utilised to document the process
and identify root causes, in order to help the team understand the process so that
improvement is focused on the significant opportunities. Note that this chapter does
not distinguish between problems and opportunities because both are approached
with the same improvement steps, and the terms are therefore often interchanged.
Three problem identification tools are discussed in this section. All of them require
only observational information and systematic thinking to predict what changes can
cause improvement. Their respective uses are to document the process, organise
possible causes that can lead to a specific outcome, and question the rationale behind
assumptions. These tools are flowcharts, cause-and-effect diagrams, and five whys.
Stellenbosch University https://scholar.sun.ac.za
Chapter 2 Basic process improvement Industrial Engineering
Page 13
2.3.1 Flowchart
The flowchart is a basic mapping tool that provides a visual summary of the flow and
decisions that compose the current state of the studied process. This helps people to
understand, define, document, study, improve, or innovate material and information
flow within a process. Flowcharts also provide effective communication between
process participants, clarify roles and responsibilities, and describe interactions. [15]
.
The objective of a specific flowchart determines the level of detail required. This can
be one of three levels: (1) macro, (2) mini, and (3) micro. Macro level maps are used
in the initial cycle to depict the process in fewer than six steps and it also provides a
basis for further refinement. Mini level maps document one step as identified in the
macro level flowchart, but the finer detail is omitted. Micro level maps document each
action and decision to show detailed information on how operations are executed. [16]
.
Before the team starts to develop the flowchart they must review three important
elements. First, ensure the boundaries are defined to determine the start and end
points of the flowchart. Second, determine the level of detail needed to understand
the process. Third, consult the process owner for input; this person should already be
part of the improvement team. Once this is done the flowchart can be developed. [17]
Step 1: Observe the current process and choose an object to follow. The object will
depend on the process and the purpose of analysis, but it can be a person, piece of
material, or paper form. Information can also be mapped but it is often tough to track;
the easiest approach is therefore to follow a physical object throughout the process.
Step 2: Record the observed process steps. These steps must be recorded in the
actual sequence as observed, and not prescribe how the work should rather be
performed. Write these steps on individual index cards and paste them on a chart
with swim lanes; swim lanes are used for the visual representation of functional
responsibilities and also to visualise the cross-functional complexity of the process.
Step 3: Write a brief, yet detailed description of what has happened. Add measures
such as cycle time and travel distance if it provides information relevant for possible
improvement. Furthermore, interview the people that do the work, and also examine
desk procedures, work flow diagrams, and other documents that describe the process.
Stellenbosch University https://scholar.sun.ac.za

Chapter 2 Basic process improvement Industrial Engineering
Page 14
Step 4: Summarise and evaluate the data. Create a summary block that provides the
total number of operations, transportations, delays, storages, and inspections. Also
determine the cycle time, travel distance, and other relevant measures. Then consult
the process owner and process standards to determine if the flowchart is accurate.
Step 5: Analyse the flowchart; the important process information is now available to
be queried. Evaluate each process step and decide if it can be eliminated, reduced,
combined, rearranged, or simplified. When the flowchart display a clear picture with
good process flow, a lower level flowchart can be created that provide more detail.
Figure 2.4: Basic flowchart with swim lanes
Stellenbosch University https://scholar.sun.ac.za

Chapter 2 Basic process improvement Industrial Engineering
Page 15
2.3.2 Cause-and-effect diagram
The cause-and-effect diagram was developed in 1943 by Dr. Kaoru Ishikawa, when
he realised that people are often overwhelmed by the large number of factors that
can influence a process. He therefore developed this simple tool to represent the
assumed relations between potential causes and a desired outcome of the process.
People often refer to this diagram as the fishbone diagram because it resembles the
head and bones of a fish. The fishbone structure provides a systematic approach that
encourages team based analysis to discover, organise, and summarise knowledge
about potential causes. The steps to construct this diagram are discussed below. [12]
Step 1: Identify and define the outcome, known as the effect, then write it in the box
on the right side of the diagram. The effect can either be positive (desired outcome),
or negative (problem). Select a positive effect to encourage pride and ownership of
the process; negative effects should be avoided to prevent “finger pointing”. Positive
effects also encourage a positive approach to generate more creative solutions. [15]
Step 2: List the main causes that can influence the effect. These provide the general
structure of the diagram. Sometimes various potential causes are identified before
the main causes can be isolated. Therefore, it is common to use the 6M causes to
create the general structure. These are management (policies), manpower (people),
methods (procedures), materials, machines, and milieu (general environment). [18]
.
Figure 2.5: Cause-and-effect diagram (fishbone diagram)
Stellenbosch University https://scholar.sun.ac.za

Chapter 2 Basic process improvement Industrial Engineering
Page 16
Step 3: Continue to search for more potential causes and categorise them under the
appropriate main causes. Various basic idea generation techniques can be used to
identify these sub-causes. An effective approach is to brainstorm for causes, prepare
cards for each identified sub-cause, and then categorise these cards in consensus.
Step 4: Isolate the sub-causes that can be considered the root causes of the studied
effect. First, look for sub-causes that appear more than once and list them. Second,
evaluate the rest of the sub-causes and add those with high potential to influence the
effect. Third, use an idea prioritisation technique to rank them in order of significance.
Step 5: Evaluate the list of significant causes identified in the previous step. Collect
more data to determine if the most significant cause has a notable impact on the
studied effect. If this is not the case the team should continue to evaluate the next
most significant cause to determine if it has a notable impact. Note that each cause
can be used as the subject (effect) in a lower level diagram for further analysis. [15]
.
2.3.3 Five whys
Five whys is a simple but effective technique that is used to question and evaluate
assumptions. Often, potential causes suggested by people are actual symptoms and
not root causes. Five whys is then used to question the suggested causes up until the
root cause is identified or the questions do not yield any more useful information. [19]
Figure 2.6: Five whys
Stellenbosch University https://scholar.sun.ac.za

Chapter 2 Basic process improvement Industrial Engineering
Page 17
Five whys is often used in conjunction with the cause-and-effect diagram. The idea is
to question the identified causes for further analysis. Although this approach provide
logical evidence that a cause is significant it is still necessary to verify this statement
with analytical tools that uses actual data to support the hypothesised influences. [15]
Often people attempt to force the five whys into exactly five steps, but five is only a
proposed number used to avoid a premature conclusion. Therefore, continue to follow
what appears to be obvious links in the process to avoid preconceived ideas. Also,
when a problem has many possible causes it is crucial to isolate and pursue the most
significant cause, or else five whys will become tedious and consume too much time.
2.4 Define objectives
At this point in the improvement cycle each team member must fully understand the
critical aspects of the studied process. Members must therefore be able to develop
realistic goals and objectives for the focus area. Furthermore, the cause-and-effect
diagram and flowchart should show a clear representation of the studied process.
Process owners are responsible to achieve objectives that have a direct influence on
their processes. The affected people must also understand the objectives and devote
their efforts toward the achievement the objectives. This means that participants must
share the same purpose, which drives pride and ownership of individual operations.
Clear formulation of objectives is crucial to communicate the improvement purpose;
many initiatives fail due to vague descriptions of expectations. Ambiguous objectives
can be avoided with a pragmatic view of success and the use of SMART, which
represents specific, measurable, achievable, relevant, and time bound objectives. [20]
Figure 2.7: Criteria for a SMART objective
Stellenbosch University https://scholar.sun.ac.za

Chapter 2 Basic process improvement Industrial Engineering
Page 18
2.5 Plan improvement
The entire improvement team should be included in the improvement plan to exploit
their knowledge and experience. This requires a structured approach to generate and
prioritise ideas in order of significance. The most significant idea is then evaluated for
further refinement. Note that the term “idea” is used because the same approach that
is discussed here to generate solutions can also be used in the problem identification
phase for the identification and prioritisation of root causes to process problems. [15]
.
2.5.1 Idea generation
The purpose of idea generation is to come up with as many as possible ideas that
can be implemented to eliminate problems or to exploit opportunities. This approach
also encourages team participation to increase the knowledge base that contributes
to the idea generation process. The first step is to brainstorm and identify potential
ideas, and then use an affinity diagram to organise mutual ideas into categories. [12]
Step 1: Brainstorming
Brainstorming is a systematic, team based approach used by teams to generate a
large number of ideas in a quick session with maximum team input. This requires
participation from each team member to foster a sense of ownership in the studied
topic as well as the accompanied activities. Also, team members that make direct
contributions to the course of a decision are more likely to ensure that it is sustained.
There are several rules that contribute to successful brainstorming. First, provide an
environment free of discussion, including criticism and compliments, for unrestricted
exploration of ideas. Second, do not hesitate to suggest absurd ideas, because they
may lead to creative thinking. Third, do not allow one or two people to dominate the
brainstorming session. Fourth, remove all interruptions that might interfere with the
session or cause distractions. Fifth, arrange team members in a circle or U-shape to
promote the free flow of ideas. Once these are understood the session can start. [21]
Step 1: Start with a clear definition of the problem statement and the objectives. State
the topic to be discussed in the form of a question and ensure that each participant
understand the process and improvement expectations. Then post the topic on a flip
chart or similar device; ensure that the topic is posted where everyone can see it and
refer to it throughout the session. This helps to maintain the focus on the right ideas.
Stellenbosch University https://scholar.sun.ac.za

Chapter 2 Basic process improvement Industrial Engineering
Page 19
Step 2: Decide what format will be used to perform the session. Select one or more
of these three idea generation formats: (1) structured, (2) unstructured, and (3) silent.
Structured, one-at-a-time, brainstorming is established by rotation and offers each
person an equal opportunity to contribute one idea per turn, regardless of status or
personality. Any individual who is not ready with an idea when his or her turn comes
can pass until the next round. A complete round of passes ends the session. This
type of brainstorming lacks spontaneity and can sometimes feel rigid and restrictive.
Unstructured brainstorming requires team members to call out ideas as they come to
mind. The advantage of free-form brainstorming is that participants can build off each
other’s ideas in a relaxed environment, but less assertive or lower status participant
may not contribute. It is therefore crucial that the facilitator enforces ground rules and
monitors the session to ensure that participants have equal opportunity to contribute.
Silent, write-it-down, brainstorming requires participants to individually write ideas in
private on paper to be collected and posted for other members to see. This prevents
a team from being influenced by a single participant or common flow of ideas; but
then again, the group loses the synergy and spontaneity that comes from an open
session. Silent brainstorming is therefore best used in conjunction with other formats.
Step 3: Set a time limit for the session. A good start is 10 minutes, which can later be
extended by five minute intervals if ideas are still being generated; remember that
brainstorming is the rapid generation of ideas, so less time can be better. Assign a
timekeeper and data recorder. Then review the rules even if the team already knows
them because participant often violate the rules and start to judge each other’s ideas.
Step 4: Record ideas on a chart as they are called out, or collect ideas written by
team members. Write down the ideas exactly as presented by the team member to
avoid judgment and misinterpretation. Try to generate as long a list as possible and
encourage people to think “outside the box”. Display the ideas where everyone can
see them so that participants can build on each other’s ideas and avoid duplication.
Step 5: Clarify each idea with the help of the contributor to ensure that all participants
understand it in the same way. The session ends after each participant is given a final
opportunity to add ideas. Then proceed to organise the ideas with an affinity diagram.
Stellenbosch University https://scholar.sun.ac.za
Chapter 2 Basic process improvement Industrial Engineering
Page 20
Step 2: Affinity diagram
The affinity diagram, develop by Japanese anthropologist Kawakita Jiro, is used to
organise and consolidate large amounts of qualitative data into groups based on their
natural affiliation. This data can consist of ideas, opinions, issues, and facts, which
are frequently the result of a brainstorming session. Additional data sources include
customer and employee surveys, complaints, suggestions, and benchmark data. [22]
Affinity diagrams encourage a new pattern of thinking that gets people to work on a
creative level while they address difficult issues. This is particularly effective when
problems or objectives have not responded to traditional or well established thinking
patterns. It is also useful when the team have incomplete knowledge of the studied
process, or when individuals with diverse experience and expertise form a new team.
As a rule of thumb, it is not necessary to use an affinity diagram if less than 15 ideas
have been identified; instead, the team can begin with one of the idea prioritisation
techniques to isolate the most significant solutions for implementation. Otherwise, the
steps below can be followed to create an affinity diagram that organise the collected
data into clusters, which represent the latent structure of the opportunity under study.
Step 1: Present the ideas generated through brainstorming and other means. Write
down the ideas on cards and post them on a table in a random manner within reach
of each member. Make sure that members have the same interpretation of the ideas.
Step 2: Let the team members physically move the cards that seem related together
in a group off to the side without talking. Then look for ideas that are related to those
that have been already set aside and add them to that group. Thereafter, look for
other ideas that are related to each other and establish new groups. Team members
are allowed to move the cards at will. This means that one member may move a card
to one group, and another member may move the card back to its former group.
.
The process is repeated until the team has moved all the cards into groups. Cards
that don’t fit into any group shouldn’t be forced into a group. Let them stand alone or
create a miscellaneous group. Furthermore, if consensus cannot be reached, make a
duplicate of the card and place one copy in each group. Don’t continue with this for
too long, if too few piles remain it may hide the latent structure of the opportunity. [15]
Stellenbosch University https://scholar.sun.ac.za
Chapter 2 Basic process improvement Industrial Engineering
Page 21
Step 3: Create header cards that capture the fundamental theme between the ideas
contained in a group of cards; the group facilitator prepares the header cards. Each
card must consist of a phrase or sentence that clearly conveys the meaning. Try to
use action sentences to describe a practical theme. Do this step together, out loud.
Try to find cards that already exist within each group to serve as potential headers
and place them at the top of the group of related cards. Alternatively, discuss and
agree on the wording of cards created specifically to be headers. Then try to group
the header cards under even broader groups (super headers). Continue to group the
cards until the definition of a group becomes too broad to have a clear connotation. It
is recommended to limit the total number of groups to between three and fifteen. [15]
.
Step 4: Document the completed affinity diagram. Start with a problem statement or
opportunity at the top of the diagram. Then place header and super header cards
above the groups of ideas. Draw circles around the groups for distinction between
themes. Also, draw lines that connect the super headers and sub headers to end up
with a hierarchical, graphical structure that represents the relations between groups.
Step 5: Determine which of the identified areas should be considered for more detailed
analysis; the headers present the critical areas, while the categorised ideas represent
the potential improvement opportunities within the critical areas. The next step is the
identification of the most significant idea with the use of idea prioritisation techniques.
Note that affinity diagrams follow an inverse approach from the one used to create a
cause-and-effect diagram. The latter start with major causes as headers and then
identify various lower level causes to categorise under these headers; however,
affinity diagrams begin with lower level ideas and then organise them under headers.
2.5.2 Idea prioritisation
When a range of alternative ideas has been created the trouble is to select the most
feasible one for implementation. Choices can be made by guesswork, by intuition, by
experience or by arbitrary decision. However, it is better if an idea can be selected
through means of some rational procedure [23]. Any one of the following three tools
can be used for a systematic approach to support team based idea evaluation and
prioritisation: (1) multi-voting, (2) nominal group technique, and (3) pairwise ranking.
Stellenbosch University https://scholar.sun.ac.za

Chapter 2 Basic process improvement Industrial Engineering
Page 22
Option 1: Multi-voting
Multi-voting provides a quick and easy way to reduce an extensive list of ideas to a
manageable smaller number of ideas. It relies on group decision making to identify
what is important to the team, with limited discussion. This tool is best suited for large
teams and long lists. The execution of multi-voting is discussed in the following steps.
Step 1: Work from a large list of ideas developed by means of brainstorming or from
groups organised by an affinity diagram. Ensure that each idea is clearly understood
by all participants. Then assign a letter to each idea to speed up the voting process.
Step 2: The voting starts with each team member selecting the most important one-
third (or no more than one-half) of the ideas, which they believe have high priority, by
listing the letters that appear next to those ideas. Voting may be done either by the
show of hands or by paper ballot when the team chooses to preserve confidentiality.
Step 3: Compile the votes and place a checkmark next to each item for each vote it
received. Retain the ideas with the most votes and continue with the next round of
voting. A rule of thumb to determine which ideas should be eliminated after each
round depends on the size of the group. This simple rule is displayed in Table 2.1. [24]
Table 2.1: Number of ideas to eliminate with reference to team size
Number of team members Number of votes for elimination
Five or fewer Two or fewer
Six to fifteen Three or fewer
Fifteen or more Four or fewer
Step 4: Repeat the process and continue to eliminate ideas until the top four to six
ideas are established. The ideas that were not identified as current priorities should
be retained as backup for potential future use by the team in improvement activities.
Step 5: The process is finalised when the team has selected a potential idea for pilot
implementation. However, if one idea cannot be isolated for selection, the process
can be repeated with fewer votes allowed for each person. Nonetheless, use force
field analysis on one or more of the top ideas to further refine the selection process.
Stellenbosch University https://scholar.sun.ac.za
Chapter 2 Basic process improvement Industrial Engineering
Page 23
Option 2: Nominal group technique
Nominal group technique is a weighted ranking method that is utilised to prioritise a
large number of ideas. This approach provides a structure that gives everyone an
equal voice with limited interaction between team members, which helps to avoid
individual domination. The execution of this selection technique is discussed next. [25]
Step 1: Work from a large list of ideas developed by means of brainstorming or from
groups organised by an affinity diagram. Ensure that each idea is clearly understood
by all participants. Then assign a letter to each idea to speed up the voting process.
Step 2: Each team member writes down the letters designated for each idea. Then
they assign each idea a numerical value based on their own judgment of what they
consider priority. The highest number is assigned to the most important idea and the
lowest to the least important idea. For instance, if there are five ideas lettered A to E,
the highest priority idea is assigned a 5 and the lowest priority idea is assigned a 1.
Step 3: Rankings are collected and the facilitator transcribes each number next to the
corresponding idea on a chart pack. The idea with the highest point total is the one of
most importance to the whole team. Then the facilitator rewrites the list of ideas in
order of their importance. In the end, the team performs a quick check to ensure that
prioritisation makes sense and isolate the highest priority idea for force field analysis.
Option 3: Pairwise Ranking
Pairwise ranking is a team based method used to prioritise a list of ideas. This tool is
most effective when used to rank a short list in a rational manner. It requires the team
to compare items by ranking each of them against the other. The combined results of
these paired rankings are used to prioritise ideas. This method is discussed below.
Step 1: Work from a short list of ideas developed by means of brainstorming or from
groups organised by an affinity diagram. Ensure that every idea on the list is clearly
understood. Assign a letter to each idea and construct a matrix with the ideas shown
at the top and to the left so that each cell represents an intersection of two ideas. [26]
Step 2: Determine which idea is preferred for each intersection by show of hands or
by paper ballot when the team chooses to preserve confidentiality. Write the letter of
the preferred idea in the appropriate cell. Repeat this process until the matrix is filled.
Stellenbosch University https://scholar.sun.ac.za

Chapter 2 Basic process improvement Industrial Engineering
Page 24
Figure 2.8: Pairwise ranking matrix for five ideas
Step 3: Rank the ideas by the number of times they appear in the matrix. The idea
with the highest overall ranking is considered for implementation after a force field
analysis. However, if two ideas appear the same number of times, look at the cell in
which these two ideas were compared to determine which idea received preference.
2.5.3 Force field analysis
Force field analysis was created by social psychologist Kurt Lewin in 1943 [27]. This
tool is used to analyse the forces for and against the change. Its purpose is to decide
whether to go ahead with an idea, and to respectively strengthen forces that drive an
idea and weaken forces that restrict an idea. This helps the team to understand the
requirements for successful execution so that their focus is on the critical elements.
A force field analysis session should be supplemented with a fair amount of debate
and discussion that deal with concerns, problems, and solutions. These can include
various forces such as people, resources, behaviours, regulations, values, needs and
desires. The five steps below help to manage improvement with the identification of
forces that must be addressed and monitored for successful idea implementation. [28]
Step 1: Ensure that the team understands the nature of the current situation and why
improvement is needed. Furthermore, explain the desired future state that is expected
from the implementation of the analysed idea. Define this state as clearly as possible.
Step 2: First, brainstorm the main forces that would support change in the desired
direction. Second, brainstorm forces that would resist the proposed change. Place
these respective forces on the left and right side of the force field analysis diagram,
visualised as labelled arrows. Third, discuss the relationships between these drivers.
Stellenbosch University https://scholar.sun.ac.za

Chapter 2 Basic process improvement Industrial Engineering
Page 25
Step 3: Assign a number from 1 (weak) to 5 (strong) to represent the relative strength
of each force. Then rank the respective forces from strongest to weakest and add the
scores to compare the total value of forces for change versus forces against change.
Step 4: The team can use the current results to decide whether or not to continue
with an improvement idea. They can also think about how to strengthen the forces
that support the idea and weaken the forces that restrict the idea. These changes
can swing the balance in favour of an improvement idea if it was previously opposed.
Step 5: Verify the forces and use the balance ratio as a guideline to determine if an
idea is viable for implementation. If the idea is viable continue to manage the forces
to ensure successful implementation. However, if the idea is not viable because of
some uncontrollable forces, repeat the force field analysis with the next priority idea.
.
Figure 2.9: Force field analyses
Stellenbosch University https://scholar.sun.ac.za

Chapter 2 Basic process improvement Industrial Engineering
Page 26
2.6 Data collection
Data collection is crucial for all the process improvement activities. First, it creates a
baseline so that improvement activities can be monitored and tracked to ensure that
it doesn’t create new problems. Second, the data collected is reviewed and analysed
to determine if the process is stable and reliable enough to support future decisions.
Even when some of the required data is already available, emphasis should be put
on new data to ensure that the data is applicable to the current situation. However,
new data can sometimes be difficult to collect; the team should therefore create a
data collection plan with operational definitions. They may also need to create data
collection forms to standardised methods that support continuous data collection. [29]
2.6.1 Operational definitions
An operational definition is a clear and concise definition of a measure. The definition
is used to ensure that everyone in the system understands and collects data in the
same manner. This also supports clear communication to avoid misinterpretations that
can add variation to measurements. Therefore, it is important to develop operational
definitions at the start of improvement activities to ensure consistent data collection.
An effective operational definition has three elements: (1) a criterion that provides a
standard against which to evaluate the measure, (2) a procedure to test the measure,
and (3) a decision as to whether test results show the measure meets the criterion. [15]
Figure 2.10: Operational definition
Stellenbosch University https://scholar.sun.ac.za

Chapter 2 Basic process improvement Industrial Engineering
Page 27
2.6.2 Data collection plan
Data collection is a common weakness of process improvement teams [12]. A data
collection plan is therefore needed to ensure meaningful and valid data is collected
right the first time. The steps below are used to develop a plan that communicates
the requirements for appropriate data collection. However, the level of thoroughness
and plan formalisation is determined by the complexity of the process measures.
.
Step 1: Determine the data to be collected with specified operational definitions. Data
can be categorised into two groups: Attribute data and variable data. Attribute data is
based on the occurrence of discrete events such as number of defects; and variable
data are based on continuous characteristics such as time, length, temperature, and
weight. The team should always try to collect variable data because it requires fewer
data points for statistical analysis and also enables the quantification of variation. [15]
Step 2: Determine the data source and location where the data will be collected. The
team must focus on the location of the activities that produce the significant process
characteristics. These characteristics can be derived from the problem and objectives.
Step 3: Determine who will collect the data. Process workers have the best chance to
collect data because they are closest to the required data. They also know the process
best and can easily detect when problems occur. However, data collectors must be
trained in data collection procedures. The team should also be involved to ensure
efficient procedures and that anomalies or problems are recorded and corrected. [12]
Step 4: Determine when the data will be collected and the number of data points
required. Enough data must be collected to make a statistical determination, but the
team must also consider what amount is practical. They should therefore attempt to
collect enough data in a specific time when the data is available. It is preferred that
each characteristic is measured on a continuous basis, but this isn’t always practical.
Step 5: Determine how the data will be recorded. First think how the data will be
analysed and displayed. This helps the team to plan data collection in a format that
supports analysis and display. The team can then design and test data collection
forms to create standardised methods for defect free and efficient collection methods.
Stellenbosch University https://scholar.sun.ac.za
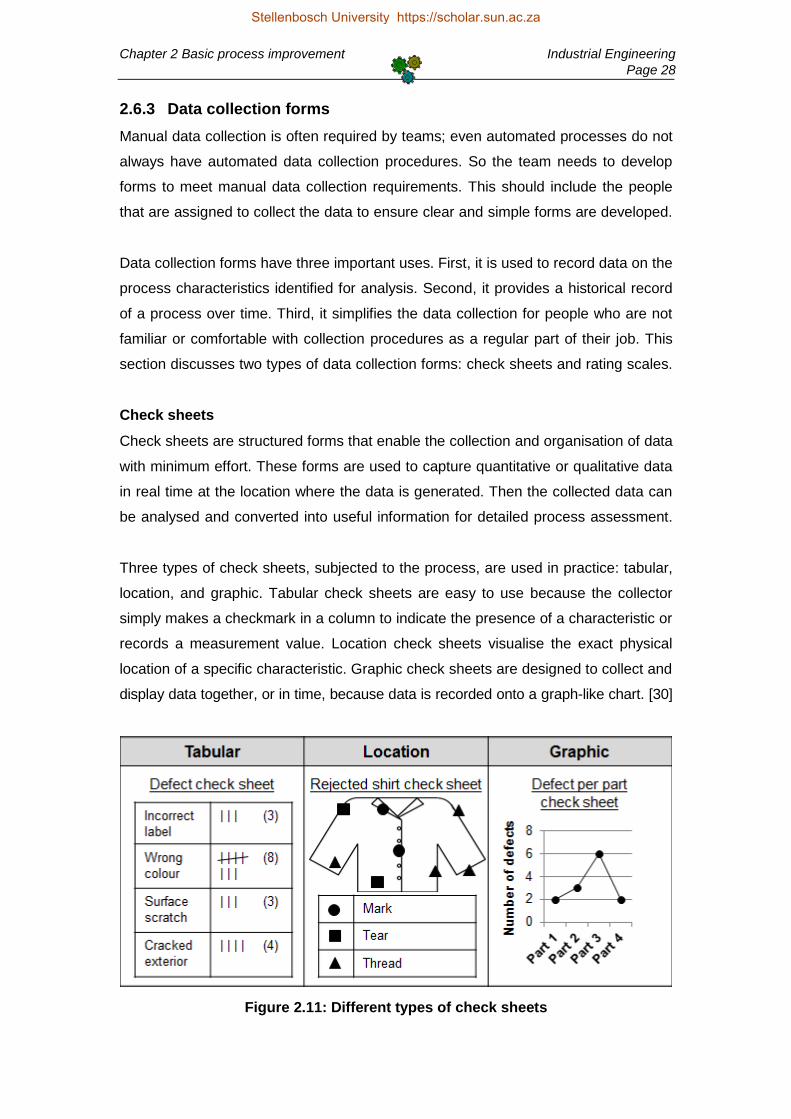
Chapter 2 Basic process improvement Industrial Engineering
Page 28
2.6.3 Data collection forms
Manual data collection is often required by teams; even automated processes do not
always have automated data collection procedures. So the team needs to develop
forms to meet manual data collection requirements. This should include the people
that are assigned to collect the data to ensure clear and simple forms are developed.
Data collection forms have three important uses. First, it is used to record data on the
process characteristics identified for analysis. Second, it provides a historical record
of a process over time. Third, it simplifies the data collection for people who are not
familiar or comfortable with collection procedures as a regular part of their job. This
section discusses two types of data collection forms: check sheets and rating scales.
Check sheets
Check sheets are structured forms that enable the collection and organisation of data
with minimum effort. These forms are used to capture quantitative or qualitative data
in real time at the location where the data is generated. Then the collected data can
be analysed and converted into useful information for detailed process assessment.
Three types of check sheets, subjected to the process, are used in practice: tabular,
location, and graphic. Tabular check sheets are easy to use because the collector
simply makes a checkmark in a column to indicate the presence of a characteristic or
records a measurement value. Location check sheets visualise the exact physical
location of a specific characteristic. Graphic check sheets are designed to collect and
display data together, or in time, because data is recorded onto a graph-like chart. [30]
Figure 2.11: Different types of check sheets
Stellenbosch University https://scholar.sun.ac.za

Chapter 2 Basic process improvement Industrial Engineering
Page 29
Note that the examples in Figure 2.11 are for illustrative purpose only and that they
still lack a lot of detail. An effective check sheet should provide information about the
circumstances that can influence the collected data. Furthermore, it should include
the name of the data collector, the date and time, and space to write comments in
case of unusual events. It can also include brief instructions on the back of the form.
Rating scales
Rating scales are useful when quantitative data is not available or when it is difficult
to acquire; for example, it can be used for surveys where attitudes or satisfaction are
measured. However, rating scales treat qualitative data as quantitative data to enable
statistical analysis. Various types of rating scales can be used for data collection, but
this report focuses on qualitative description rating scales for process improvement.
Qualitative description rating scales are particularly useful to analyse a process when
numerical data are not available or sufficient. The typical format consists out of five or
ten levels that are arranged in hierarchical order with operations definitions. A scale
is used by an observer to rate a process with reference to one of the available levels.
Table 2.2: Rating scale
A clean and
organised
workstation Description
Level 1 Cigarette butts, scraps of paper, and tools are scattered
around the floor
Level 2 Clutter is found by the walls
The passageways are not clear
Level 3 Tools are disorganised in the storage areas
Level 4 Machinery and equipment are clean
Items are clearly labelled
Necessary items are aligned to a grid
Level 5 There is constant and continual cleaning from wall to wall
The area is clean, and the tools are laid out separately
Stellenbosch University https://scholar.sun.ac.za
Chapter 2 Basic process improvement Industrial Engineering
Page 30
2.7 Pilot improvement
The improvement plan that was developed should be explored and refined through
pilot improvement. A common mistake is to skip initial improvement and go straight to
full scale implementation. This can cause improvement activities to fail and can
create problems. Therefore, pilot improvement is vital to avoid premature conclusions.
Pilot improvement provides various insights into the process. First, dependencies in
the components of the system are identified. Second, the temporal effect of change
becomes transparent. Third, the relationship between prediction and actual system
performance is determined. Fourth, appropriate actions to deal with variation are
identified. Fifth, changes in social behaviour of employees are better understood. [31]
Pilot improvement should be designed so that as few resources as possible are
invested, while at the same time enough is learned to move towards full scale
implementation. Remember that the practical consequence is that some tests are
expected to fail, but this is not a problem if the team learn from those failures. The
next three principles help to minimise risks associated with pilot improvement. [32]
Principle 1: Keep pilot improvement as small as possible at first and then increase
the scale based on the amount and type of knowledge acquired. Solutions developed
in a conference room do not always perform as predicted. Small scale change is
therefore required to provide an evaluation of the impact and side effects. However,
small scale does not mean small change; rather, the test is tried with one person, for
a short time period, or with one component (such as a new tool) of the process.
.
Principle 2: Introduce different conditions as the scope is expanded. Even if changes
were successful it may not work when implemented because some circumstances
have changed. Therefore all circumstances that could affect the process should be
discussed and plans to evaluate their impact should be included in initial tests. These
include season change, new employees, demand variation, and new technology.
Principle 3: Use data collection to monitor implementation. The team must define and
document the objectives of pilot improvement, and assign roles and responsibilities
to each participant. This must include a data collection plan to monitor execution and
ensure that the activities are carried out as planned. The collected data also sets the
foundation for future evaluation and statistical analysis to assess improvement results.
Stellenbosch University https://scholar.sun.ac.za

Chapter 2 Basic process improvement Industrial Engineering
Page 31
2.8 Data analysis
The main purpose of data analysis is to convert raw data into useful information. The
information is then used to decide if the improvement objectives have been achieved
within specification limits. Data analysis is also used to learn more about the process
and the new information can be used to recognise further improvement opportunities.
Histograms and run charts are common data analysis tools. A histogram analyses
the process at a specific moment, while a run chart displays process performance
over time. Simply put, a histogram is like a snapshot of the process, while a run chart
is like a movie of process performance. These tools are developed from a statistical
foundation. The team should therefore understand the basics of numerical analysis.
2.8.1 Numerical analysis
Each of the statistical analysis tools discussed in this report is developed from basic
numerical analysis. There are three important data characteristics that the team must
understand for the utilisation of statistical tools: (1) the location or centre of the data,
(2) the spread or variability of the data, and (3) the shape of the data distribution. [33]
The location or centre of the data provides information about the behaviour of the
typical value of a characteristic of the data. Measures that are used to summarise
central tendency of the data include the process mean, the median, and the mode.
.
The arithmetic mean, or average, is the most common numerical representation of
the typical value of the data; it is calculated as the sum of the data divided by the
count of data items examined. The median is given by the middle value, or arithmetic
mean of two middle values, when the data is arranged in order from small to large; it
is not influenced by the magnitude of outliers as is the mean. The mode is the value
that occurs most frequently; it is also not influenced by the magnitude of outliers.
The spread or variability of the data refers to how the data is dispersed around the
mean. Variation is inherent to processes and this should be quantified to establish a
predictable process. Variability is calculated as the range or the standard deviation.
The range is the most basic measure of process variability. It is simply calculated as
the difference between the largest data point and the smallest data point. The larger
the range, the more dispersed the data; a smaller ranges means less dispersed data.
Stellenbosch University https://scholar.sun.ac.za

Chapter 2 Basic process improvement Industrial Engineering
Page 32
The standard deviation considers each data point and their distances from the mean
to measure variability in a dataset. Notice the population and the sample standard
deviations are calculated slightly different, this is shown in Figure 2.12 below. Also note
that a larger standard deviation translates into higher variation in a distribution. [15]
The shape of a data distribution can be measured by skewness, or lack of symmetry,
and kurtosis. These calculations are not discussed in this report because data that is
represented in graphical form provides the shape of the distribution at a glance; so
rather focus on graphical analysis because it is easier to interpret for non-specialists.
Figure 2.12: Numerical analysis
Stellenbosch University https://scholar.sun.ac.za

Chapter 2 Basic process improvement Industrial Engineering
Page 33
2.8.2 Histogram
A histogram is a data analysis tool that is used to summarise a large set of variable
data in a graphical format for ease of interpretation. This tool summarises information
in terms of location, spread, and shape of the distribution. The first step is to develop
a relative frequency distribution and then organised the information in a column chart.
A single histogram does not evaluate the process through time nor does it determine
if the process was stable when the data was collected. It is therefore crucial to use
the most recent data available for analysis. Once at least 50 to 100 data points have
been collected, as suggested by mathematicians, a histogram can be developed. [15]
Step 1: Define the intervals for the frequency distribution. The number of intervals is
calculated as the square root of the number of data points. Then divide the range of
the dataset by the number of intervals to calculate the width of each interval. Finally,
determine the starting point for each interval. Use the smallest value in the dataset as
the starting point of the first interval. The starting point for the second interval is the
sum of the smallest data point and the interval width. Continue this for each interval.
Step 2: Determine the frequency distribution of the dataset. Start to arrange the data
points from smallest to largest. Then count the number of data points that fall within
each interval to determine the data frequencies; count the data points that are equal
to or greater than the starting value and less than the ending value of each interval.
Step 3: Prepare the histogram. First, label the horizontal axis with the intervals that
were used to create the frequency distribution. Second, label the left axis with the
relevant frequencies. Then finish preparation of the chart with a descriptive header,
the name of the process and data collector, and the time and date of data collection.
Step 4: Plot the data on the prepared graph to show a clear picture of the frequency
distribution. Draw a column for each interval to visualise the distribution of data. The
columns have two important characteristics: height and width. The height represents
the number of times a data point is counted in an interval (the frequency); the width
represents the size of each interval, this is the same for all intervals. Check that the
plotted histogram represents a reasonable and logical picture of the process within
specified limits. Remember that this analysis is only valid for a specific point in time.
Stellenbosch University https://scholar.sun.ac.za
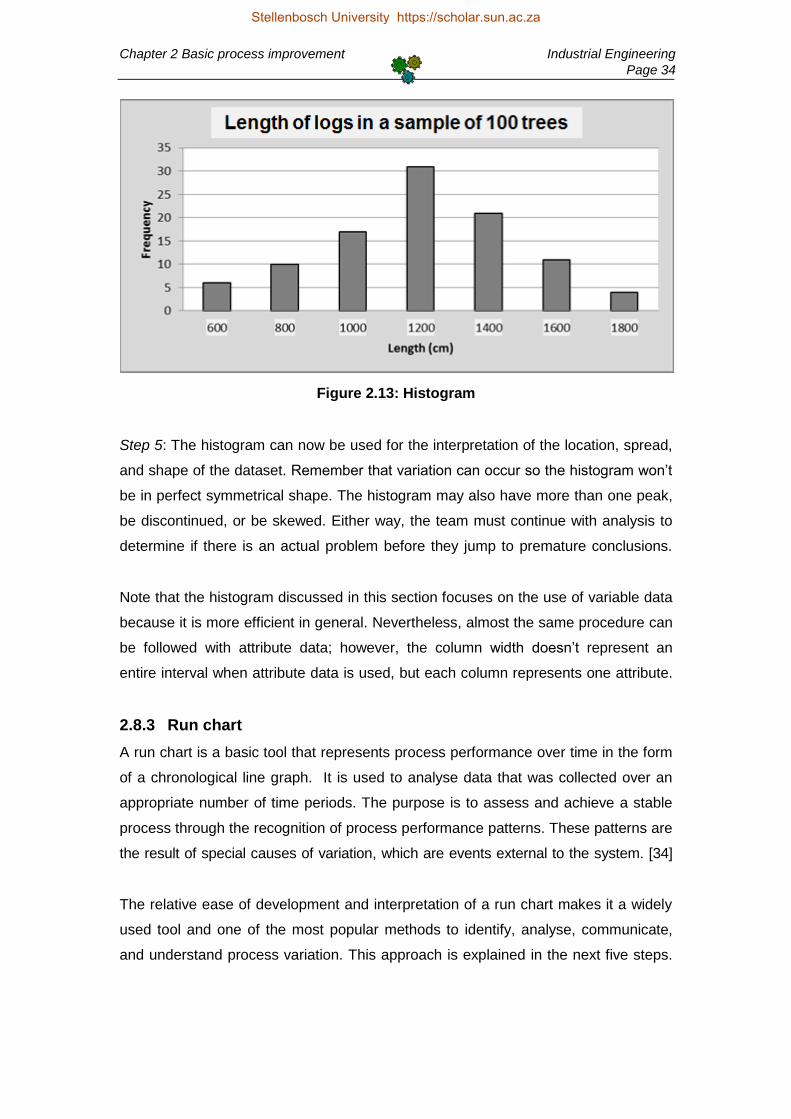
Chapter 2 Basic process improvement Industrial Engineering
Page 34
Figure 2.13: Histogram
Step 5: The histogram can now be used for the interpretation of the location, spread,
and shape of the dataset. Remember that variation can occur so the histogram won’t
be in perfect symmetrical shape. The histogram may also have more than one peak,
be discontinued, or be skewed. Either way, the team must continue with analysis to
determine if there is an actual problem before they jump to premature conclusions.
Note that the histogram discussed in this section focuses on the use of variable data
because it is more efficient in general. Nevertheless, almost the same procedure can
be followed with attribute data; however, the column width doesn’t represent an
entire interval when attribute data is used, but each column represents one attribute.
.
2.8.3 Run chart
A run chart is a basic tool that represents process performance over time in the form
of a chronological line graph. It is used to analyse data that was collected over an
appropriate number of time periods. The purpose is to assess and achieve a stable
process through the recognition of process performance patterns. These patterns are
the result of special causes of variation, which are events external to the system. [34]
The relative ease of development and interpretation of a run chart makes it a widely
used tool and one of the most popular methods to identify, analyse, communicate,
and understand process variation. This approach is explained in the next five steps.
.
Stellenbosch University https://scholar.sun.ac.za

Chapter 2 Basic process improvement Industrial Engineering
Page 35
Step 1: Prepare the data. Ensure that a suitable amount of sequential data points are
available for analysis. Then arrange the data from smallest to largest and calculate
the range. This already provides some insight into the variation within the process.
Step 2: Determine the median of the dataset. The median as used as the centreline,
instead of the mean, to neutralise the effect of very large or very small values. Note
that the difference between the mean and median becomes smaller as the process
stabilise, therefore, the mean can also be used as an critical performance indicator.
Step 3: Prepare the chart. First, construct the vertical axis 1.5 to 2 times the range
with the median at the centre; this axis shows the magnitude of the data. Second,
construct the horizontal axis 2 to 3 times as long as the vertical axis is tall; this axis
represents the sequence in which the events of the process occurred. Third, finish
preparation of the chart with a descriptive title and legend to ensure clarity of data.
Step 4: Plot the data points in the sequence that they occurred in. Look for outliers to
identify the first signs of special cause variation; outliers are points that occur beyond
the expected process limits. Once all the data points are plotted, connect them with
straight lines in order to make further analysis easier and to complete the run chart.
Step 5: Interpret the run chart. Identifiable patterns can occur as a consequence of
the presence of special cause variation. Three main types of patterns indicate the
existence of this unwanted process variation: (1) trends, (2) runs, and (3) cycles. [15]
A trend is the gradual increase or decrease in the level of performance. It is depicted
by five or more consecutive data point all going up or all going down. If two or more
consecutive points are the same, one point can be ignored. The causes of trends are
factors that change progressively, such as temperature, tool wear, maintenance,
costs, and fatigue. Even though trends are often easy to detect, novice practitioners
sometimes see trends that do not exist; thus, take care to avoid premature decisions.
.
A run signals a special cause of variation when eight or more consecutive points are
on one side of the centreline. Points that touch the centreline are ignored but when a
point crosses the line the run is stopped and a new one starts. Runs can be caused
by broken equipment, calibration issues, setup errors, and other cumulative factors.
Stellenbosch University https://scholar.sun.ac.za

Chapter 2 Basic process improvement Industrial Engineering
Page 36
Figure 2.14: Run chart
A cycle is a wave of periodic low and high points that tends to appear and disappear
with some degree of consistency. Cycles can therefore provide somewhat accurate
performance predictions when identified and understood. Several factors can cause
cycles: these include morning start-ups, periodic shift of workers, and operator fatigue.
Dr. Walter Shewart suggested that a minimum of 100 data points without special
cause of variation is needed before one can assume that a process is in statistical
control. However, the absence of process patterns does not necessarily mean that a
process is stable. On the other hand, the presence of some process patterns can be
the result of improvement activities, which are expected to produce positive results.
.
2.9 Review improvement
There will always be obstacles with the implementation of new ideas, strategies and
tactics within an organisation. Results of pilot improvement might even turn out to be
opposite of what was predicted. Unfortunately, many see people these results and
obstacles as failures. However, the success of improvement relies on the experience
and knowledge gathered thought the review and reflection of these so called failures.
Pilot improvement should be reviewed to identify and learn from obstacles such as
rigid policies, inherent behaviours, and absence of resources. When obstacles are
thoroughly understood it will be easier to develop effective and sustainable solutions.
0
50
100
150
200
250
0 1 2 3 4 5 6 7 8 9 10 11 12 13 14 15 16 17 18 19 20
Wait
ing
Tim
e (
seco
nd
s)
Day
Average waiting time at ATM
Median
WaitingTime
Stellenbosch University https://scholar.sun.ac.za

Chapter 2 Basic process improvement Industrial Engineering
Page 37
Review should not only address obstacles and failures, it should also focus on the
success factors. Typical factors include a well-defined project plan, clear vision and
objectives, top management support, employee involvement, training and education,
and effective communication. This is important because managers often neglect to
identify the success factors that will lead to successful and sustainable improvement.
2.10 Adopt or adapt
The final step of the basic improvement cycle is to decide how to continue with future
improvement efforts. This decision is based on the information generated through
data analysis and improvement reviews. The three options are to abandon, adapt, or
adopt ideas that were developed and implemented throughout the improvement cycle.
Abandon: This means that the basic process improvement cycle is restarted with a
new focus area in mind. The result of this decision is a major loss of many resources
that were included in the cycle up to now. One should therefore never decide on idea
abandonment after one failed improvement attempt; rather consider adapting ideas.
.
Adapt: Many situations only require that ideas are somewhat adjusted to deal with
policies, behaviours, and physical limitations. The magnitude of the needed adjustment
depends on the success of pilot improvement. In serious cases it may be necessary
for the team to repeat some steps of the improvement cycle or even the entire cycle.
.
Adopt: The team may decide to adopt some or all of the improvement ideas after the
successful completion of pilot improvement. This decision must be supported with an
appropriate infrastructure to move towards organisational wide implementation. This
includes investment in training, education and the relevant resources to increase the
chance of successful and sustainable application. The people that were responsible
for the pilot improvement should also mentor and support the rest of the organisation.
The nature of continuous improvement means that the successful completion of one
improvement activity should lead to the start of another; in other words, successful
exploitation of ideas leads to new opportunities to be identified. However, the team
should first celebrate the successful completion of the basic process improvement
cycle and each participant is to be congratulated on their contribution to success. [15]
Stellenbosch University https://scholar.sun.ac.za

Chapter 3 Lean thinking Industrial Engineering
Page 38
3. Lean Thinking
Lean thinking is a common continuous improvement methodology that focuses on
the identification of value added operations and elimination of waste. The goal of this
focus is to improve process efficiency, quality and responsiveness. This is achieved
with the creation of flow, in reaction to customer pull, and in pursuit of perfection. [35]
Lean thinking can be applied to resolve various organisational issues such as high
inventories, long internal lead times, high defect rates, low customer satisfaction,
high process costs, and frequent bottlenecks. This requires a cooperative culture that
strives to learn and solve problems for the successful generation and implementation
of solutions through a wide range of tools and techniques. However, the methodology
lacks the statistical tools often required to achieve true lean process capabilities. [36]
.
History of lean thinking
The origin of lean thinking can be traced back to 1913 when Henry Ford started the
flow production line for the Ford Model T. Ford implemented several of the principles
of Frederic W. Taylor, which focused on extensive time studies and projects to create
standard work in order to increase process efficiency and throughput. This approach
was the first case of real process integration, which introduced the idea of flow. [37]
.
The problem with Ford’s method was its lack of flexible. It relied on a push system,
where Ford set the level of production for a specific product, and the process didn’t
allow for any modifications or changes to the final product. This mass production
approach led to large inventories of unsold automobiles, and therefore huge amounts
of wasted money. So even though this process was efficient, it was not effective. [9]
.
The major change came in the 1950s when Toyota adopted and improved the Ford
production system under the guidance of Taiichi Ohno and Shigeo Shingo. They
recognised the limitations of Ford’s system and customised the production process to
suit the needs of the Japanese market, which called for lower volumes and larger
variety of cars. Ohno then developed the renowned Toyota Production System (TPS) to
maintain continuous flow and create flexible processes that can manage changes in
demand; the goal of the TPS is highest quality at lowest cost and shortest lead time.
Stellenbosch University https://scholar.sun.ac.za

Chapter 3 Lean thinking Industrial Engineering
Page 39
Figure 3.1: Toyota Production System framework
Toyota recognised the potential of process workers to solve problems and improve
processes, which culminated into a culture that always strives to solve problems and
learn from experiences. This recognition of workers was opposite to the harsh attitude at
Ford and its undignified job structure. For that reason, when other manufacturers
became aware of Toyota’s success, the common agreement was that TPS would not
work outside Japan because of the different mindset of the Japanese employers. [37]
.
In 1982 Toyota started a joint venture plant called New United Motor Manufacturing
Inc. (NMMI), which was their first plant in the United States, together with General
Motors Company (GM). They joined forces with GM to benefit from their established
supplier network, but the plant itself was run solely by Toyota with their TPS. The
success of the plant made it clear that the TPS did work in the United States as well,
because a plant that had been run by GM since 1962 started to win multiple awards
and ranked among one of the most productive manufacturers in North America. [37]
.
Jim Womack, Daniel Jones, Daniel Roos and their research team coined the term
lean manufacturing in 1990 when they wrote the book entitled “The Machine That
Changed the World”, which they based on their study of the TPS. They also made
the argument that lean ideas can be applied in any organisational sector or business
environment, which even made it relevant to companies in the service industry. [36]
.
Stellenbosch University https://scholar.sun.ac.za

Chapter 3 Lean thinking Industrial Engineering
Page 40
Table 3.1: Summary of the 14 lean principles
Categories Principles
Philosophy 1. Base management decisions on a long-term strategy
Process
2. Create continuous process flow
3. Use pull systems to avoid overproduction
4. Level out the workload
5. Build a culture that stops to fix problems
6. Standardise tasks and processes
7. Use visual control so no problems are hidden
8. Use only reliable, tested technology that serves your people
People
and Partners
9. Grow leaders who live the lean philosophy and teach it to other
10. Develop exceptional people and teams
11. Respect your network of partners and suppliers
Problem Solving
12. Go and see for yourself to thoroughly understand the situation
13. Make decisions slowly by consensus and consider all options
14. Learn through relentless reflection and continuous improvement
Dr. Jeffrey Liker, an industrial engineering professor at the University of Michigan,
published "The Toyota Way” in 2004. In his book he shared years of research and
experience with the TPS. He summarised the strategic and technical aspects of this
system in 14 principles, grouped into four categories, as shown in Table 3.1. The book
also recognised that lean is not just a set of tools, but rather a way of thinking. [38]
.
Focus of this chapter
The principles identified by Dr. Liker provide a clear representation of the aspect that
drives lean to be a successful improvement methodology. This report discusses the
four main categories separately to distinguish between these otherwise integrated
principles for easier interpretation. However, the process principles are not discussed
in sequence, because it is discussed in terms of the five step lean improvement cycle
that was developed by Womack and Jones to provide a practical lean approach. [38]
.
3.1 Principles
Dr. Liker determined that a central part of lean is the management of a cooperative
culture that strives to solve problems and learn through reflection and continuous
improvement. He then identified 14 strategic and technical principles that drive this
lean approach and organised them into four improvement categories, as follows:
(1) philosophy, (2) people and partners, (3) problems solving, and (4) process focus.
Stellenbosch University https://scholar.sun.ac.za

Chapter 3 Lean thinking Industrial Engineering
Page 41
3.1.1 Philosophy
At the most fundamental level, top management must drive the long-term strategy
that strives to add value to customers, society, the community, and its associates
through an organisation that can adapt to changes in the environment. This principle
provides the foundation to rationalise investment in organisational improvement. [39]
Principle 1: Base your management decisions on a long-term philosophy, even
at the expense of short-term financial goals
Decisions made by top management must provide the opportunity to grow and align
the organisation towards a common vision and mission that is more important than
short-term financial goals. The basis for management focus must therefore be on the
evaluation of business functions to ensure that they generate value for the customer.
The absence of top management support is one of the main reasons that lean efforts
end in failure. This is because top management is responsible to set an example and
demonstrate lean ideas in order to create a culture of change. Toyota showed how
success can be encouraged when people are aligned towards a common purpose
that supersedes any short-term strategy. Managers should therefore be educated in
lean principles to promote the philosophy and implement the long-term strategy. [37]
.
3.1.2 People and partners
Toyota states that they don’t just build cars, they build people. This is based on their
belief that people are the greatest asset of the organisation, and if you make little
investment in this resource, it will prove little return. Any organisation can use lean
tools and techniques but that does not make them successful. It is the people that
apply these tools and techniques that are most crucial to ensure future success. [40]
.
Several of the lean thinking tools and techniques make problems more transparent to
create an environment that challenges people and forces them to think. This may not
always be enjoyable but it helps to develop better and more confident workers. The
two critical factors to succeed in this environment are respect for each other to build
mutual trust, and teamwork to stimulate individual growth and share knowledge. [38]
.
Dr. Liker identified three principles that refer to people and partners: (1) grow leaders
who fully understand the work, live the philosophy, and teach it to others, (2) develop
exceptional people, and (3) respect your extended network of partners and suppliers.
Stellenbosch University https://scholar.sun.ac.za

Chapter 3 Lean thinking Industrial Engineering
Page 42
Principle 9: Grow leaders who thoroughly understand the work, live the
philosophy, and teach it to others
Effective leadership is important to successful improvement efforts. Leaders serve as
exemplars of the organisational philosophy and best practices. They also promote
the lean thinking culture by showing their daily commitment to lean operations. This
approach is the basis for leaders to lead people forward towards the ideal state, while
a management approach would only focus on the functions of the current state. [41]
.
Lean practitioners pride themselves in the development of leaders from within the
organisation. This ensures the people in leadership positions thoroughly understand
the principles of the organisation and the actual situation at operational level. It also
increases employee loyalty and give them the opportunity to grow and develop skills.
.
Although leadership is a crucial success factor, it is not necessary to have a large
leadership hierarchy because leaders develop and mentor others to do many of the
tasks often done by leaders within other companies. This is due to both a top down
and bottom up management approach, which means that even though management
initiate and drives the lean philosophy, employees are still responsible to use their
own judgment and make decision within the context of best practice methods. [40]
.
Principle 10: Develop exceptional people and teams who follow your
company’s philosophy
The development of exceptional individuals to achieve excellent results within the
organisational strategy is important for the integration of social systems together with
technical systems. Continuous efforts are therefore made to teach individuals how to
work together as teams within a strong, stable culture that shares the same values
and beliefs. This is both an enabler and result of successful improvement efforts. [42]
A study done by IBM in 2012 shows CEOs consider collaboration as the number-one
trait in employees, with 75% of CEOs that call it critical. Collaboration in the form of
cross-functional teams is used to coordinate work, share knowledge, and motivate
people, while individuals do the value added work. It is therefore crucial to cross-train
people with job rotation to create flexible teams. People must also be cross-trained to
increase their knowledge and make them feel focused, involved and motivated. [40]
.
Stellenbosch University https://scholar.sun.ac.za

Chapter 3 Lean thinking Industrial Engineering
Page 43
The IBM study also shows more organisations encourage openness because CEOs
believe their organisations will be impacted more by the pressure to be open than the
need to control their employees. Open organisations empower employees to act on
their own ideas and use organisational resources. They also encourage the free flow
of ideas, creativeness and innovation to create responsible and loyal employees. [43]
.
Principle 11: Respect your extended network of partners and suppliers by
challenging them and helping them improve
Lean thinking stretches further than internal development. Business partners should
be respected and treated as an extension of the organisation. It is also important to
value their contribution and assist them to reach goals that challenge them to grow
and develop. Therefore, current suppliers with good reputation have job security,
even when cheaper alternatives become available; on the other hand, new suppliers
must first pass rigorous tests to earn their place as part of the business network. [44]
.
Toyota developed a supplier partnering hierarchy to describe the needs of suppliers
in order to make them good partners. This consists of seven levels that build on each
other to promote a long-term relationship. The main success factors are trust, care,
and mutual welfare. Furthermore, discipline and joint improvements are also crucial,
and organisation can challenge each other as motivation to improve even more. [16]
.\
Figure 3.2: Supplier partnering hierarchy
Stellenbosch University https://scholar.sun.ac.za

Chapter 3 Lean thinking Industrial Engineering
Page 44
3.1.3 Problem solving
Continuous problem solving forms part of a lean culture and it is both a result and
enabler of sustainable and successful lean operations. The aim of the culture is to
guide employees through change processes towards lean values and best practices
that provide the organisation with a competitive advantage. This leads to high quality,
low cost, short lead time, high employee morale, and a safe work environment. [36]
.
Dr. Liker identified three principles that refer to repeated problem solving: (1) go and
see for yourself to thoroughly understand the situation, (2) make decisions slowly by
consensus and consider all options; implement decisions rapidly, and (3) become a
learning organisation through relentless reflection and continuous improvement. [16]
.
Principle 12: Go and see for yourself to thoroughly understand the situation
Lean emphasises direct observation of the actual process to understand the actual
situation. Even top management should apply direct observation as much as possible
because lean does not tolerate remote data analysis on the basis of reported data or
theoretical process standards. Therefore, people that are responsible to analyse data
and make decisions must spend time at process level to understand the process. [38]
This principle is supported by the “standing in the circle” technique that was used by
Taiichi Ohno to train new employees. It requires the employee to stand and observe
an operation carefully for 8 hours or more, to identify conditions within the operation
that cause waste. After the first few minutes to an hour, the mind has observed the
larger issues and might conclude that everything has been seen, but it may take four
to eight hours to transcend to a higher level of awareness. Once this is mastered, a
shorter observation will provide a detailed comprehension of a studied operation. [45]
Principle 13: Make decisions slowly by consensus, thoroughly considering all
options; implement decisions rapidly
A lack of employee involvement is one of the main reasons for lean implementation
failures. The problem is that ideas are not communicated throughout the organisation
because management often solves problems and forces ideas onto workers without
their input in the development and selection of these ideas. However, lean believes
the development and selection of ideas are just as important as the quality of ideas.
.
Stellenbosch University https://scholar.sun.ac.za

Chapter 3 Lean thinking Industrial Engineering
Page 45
Complete comprehension of the studied process is crucial to make decisions through
consensus. The affected people must then reach agreement on the appropriate idea
for implementation through problem identification and idea generation. Although this
consumes some time, it broadens the solution base and gives participants ownership
of the idea. The selected idea should then be implemented as fast as possible. [46]
.
Principle 14: Become a learning organisation through relentless reflection and
continuous improvement
The act of reflection is an attitude and philosophy, and also the basis of continuous
improvement. Lean considers it a sign of strength when individuals can acknowledge
their mistakes and act on them. People should therefore always learn from mistakes
to identify the cause of the problem and then develop effective countermeasures. [47]
Continuous improvement is an important driver that encourages people to learn from
stable processes. This requires organisational wide reflection after each milestone so
that people can gather knowledge from experience instead of blaming each other for
mistakes. The gathered knowledge can be protected by a stable base of personnel
and an active knowledge distribution structure. This means the organisation should
have the capacity to build on past experience and execute incremental improvements
to move towards a culture that continues to learn and develop through reflection. [38]
3.1.4 Process focus
Lean thinking organisations have a process orientated management view that relies
on knowledge of operational interdependencies to align customer requirements with
process specifications. A process view focuses on what needs to be done and how to
do it within organisational values and beliefs. This view also breaks down barriers to
encourage communication between functional units, create flexible processes, and
enable cross-functional analysis to determine organisational wide performance. [48]
The process view is opposite to the functional orientated management view that aims
to optimise functions or operations in isolation. A functional view relies on a formal
hierarchical structure that can result in the optimisation of individual functions and
this may harm the system as a whole. On the other hand, people are allowed to
specialise in their field of expertise and a smaller number of specialists are required
because functions are centralised. The different views are represented in Figure 3.3.
.
Stellenbosch University https://scholar.sun.ac.za

Chapter 3 Lean thinking Industrial Engineering
Page 46
Figure 3.3: Difference between process view and functional view
The process view is supported by means of a process-based layout, which is also
referred to as a cellular layout. This is an ideal situation where workstations and
equipment are arranged in a sequence that supports continuous process flow with
minimal transport, delay, and inventory. Employees must therefore be trained across
operations so that they can easily shift between different workstations. This is a key
enabler for faster throughput, as well as the reduction of resource requirements. [35]
.
Process focus implementation is expanded into five detailed process improvement
steps, specified by Womack and Jones. These steps, together with the relevant tools,
are accepted with key importance to successful lean execution. However, they serve
only as guideposts, because the current situation of every organisation is unique. [36]
Figure 3.4: The five lean improvement steps
Stellenbosch University https://scholar.sun.ac.za

Chapter 3 Lean thinking Industrial Engineering
Page 47
This report discusses the five lean improvement steps in detail to act as a process
focused improvement roadmap. Several lean tools and techniques are discussed
within these steps where appropriate. This is important to support the roadmap, but it
is more important to understand how these tools and techniques should be applied.
..
Principle 8: Use only reliable, thoroughly tested technology that serves your
people and processes
The foundation for improvement is stable, reliable, and predictable processes. It is
therefore crucial to be cautious about implementation of new or untested technology
in the system. Processes should first be improved with available techniques, tools,
and people, before current technology can be considered for implementation. Only
after this can the improvement team determine if additional improvements can be
made by the acquisition of new technology that fit in with organisational policies. [49]
.
Note that lean is not against the use of technology, it just perceives technology in a
different manner, one driven by a practical purpose. Technology must be used to
support value-added processes and not to replace people, while it functions within
the boundaries of organisational values and beliefs. In other words, technology must
be used to support process thinking, and not be used as a substitute for thinking. [16]
Organisations should be interested in technology and encourage workers to consider
new, creative approaches to work, which can include technology. Once the manual
process is stabilised it can be automated on condition that it does not distract people
from the value added work. Technology is best used by process workers, right where
the work is performed, so that additional people are not required for data entry. [38]
.
3.2 Identify value
The challenge in lean organisations is to add value faster than costs and still deliver
competitive products and services. Many of these costs are hidden in processes that
are inefficient, produce too much or not enough products, produce defects, produce
the wrong product or the right product at the wrong time, and rely on inspection. The
source of these unnecessary costs can be traced back to non-value added activities.
.
Value, and therefore non-value, is defined by either internal or external customers in
terms of product or service requirements. Furthermore, value is only significant when
it satisfies customer needs at the right time, at the right price, and in the right amount.
Stellenbosch University https://scholar.sun.ac.za

Chapter 3 Lean thinking Industrial Engineering
Page 48
Table 3.2: Difference between value added and non-value added activities
Lean focuses on the optimisation of value added activities and also the reduction or
elimination of non-value added activities. This requires that people understand the
definition of value, otherwise a lot of non-value added activities could be performed
that result in waste; continuous waste elimination is therefore a main lean principles
that organisations implement to reduce non-value added activities. However, some
activities are non-value added but required, such as administration and maintenance.
.
3.3 Map the value stream
.Womack and Jones define the value stream as “the set of all the specific actions
required to bring a specific product through the three critical management tasks of a
business: problem solving, information management, physical transformation”. [36]
.
Once a theoretical distinction between value and waste has been made from the
view of the customer, the process can be analysed with a value stream map. This
map is used to document and analyse the flow of material and information to find
non-value added activities. Mike Rother and John Shook adapted this lean approach
from the successful material and information flow diagrams created by Toyota. [50]
.
Value stream maps were first introduced to document tangible processes. Womack
and Jones then expanded this concept to the entire business environment. This is
because they realised that intangible flow can also be documented with a strong
timeline focus. The map also shows the interdependencies between functional areas.
Value Added
Process Activities
Non-Value Added
• Necessary to meet customer
requirements
• Assist in the production of the
product or service
• Represent an output that the
customer will pay for
• Crucial to ensure that the process
functions in the right manner
• Improve quality or resolves
problems that affect satisfaction
• Do not impact customer
requirements
• Add redundant steps that create
waste or rework
• Represent an output that the
customer does not care about
• Performed because of
inefficiencies in the process
• Done because the original output
failed to meet requirements
• Represents a duplicated effort
Stellenbosch University https://scholar.sun.ac.za

Chapter 3 Lean thinking Industrial Engineering
Page 49
The most important part of a value stream map is to document and understand how
the actual process is performed. Therefore, start with a simple flowchart to create a
basis. Then use the steps below to transform the flowchart into a value stream map.
.
Step 1: Calculate takt time. Takt is a German word for metronome. This is the rate at
which a process should run to meet customer demand, expressed in maximum time
allowed per unit of output. It is used to balance capacity with customer demand. [38]
.
Function Description Calculation
"#" Number of shifts per day 1
"x" Number of hours per shift 8
"x" 60 minutes per hour 60
"=" Number of minutes per day 480
"-" Less: Break (minutes) 60
"-" Less: Setup Time (minutes) 45
"=" Total minutes available per day 375
"/" Average demand per day (units) 750
"=" Takt time (minutes per unit) 0.5
"x" 60 seconds per minute 60
"=" Takt time (seconds per unit) 30
Figure 3.5: Takt time calculation
.
Display this information in the top right hand corner of the paper that the map will be
created on. Also draw in a saw top box that represents the customer. Note that it is
better to draw a rough paper draft before a detailed map is shared with management.
.
Step 2: Construct the material flow in the bottom centre of the page. This includes the
operations boxes and data boxes. The operations boxes represent single operations
in the process. The data boxes provide information about the cycle time and number
of operators. Additional information can include changeover time, defect rate, uptime,
and capacity. This data should be validated before further analysis is performed.
.
Step 3: Add the inventory. Count the number of pieces between two operations to
determine the inventory, or work-in-process (WIP). This is represented with triangles
between the two relevant operations. Then divide the number of pieces by the daily
demand, which was used to calculate takt time, to convert inventory into supply days.
Stellenbosch University https://scholar.sun.ac.za

Chapter 3 Lean thinking Industrial Engineering
Page 50
Step 4: Construct the information flow. Start with the communication channels from
production control, such as MRP, to each operation. Use straight arrowed lines for
manual handover of information, otherwise use lightning bolt arrowed lines. Also
construct information flow from customers and flow to suppliers. Furthermore, specify
the frequency of these information handovers; such as daily, weekly, or monthly.
.
Step 5: Add in the timeline. Draw a saw tooth line on the bottom of the material flow
to separate the value added time (bottom of line) taken from the data boxes, from the
non-value added time (top of the line) taken from the supply days info. Sum the value
added cycle times and the non-value added supply days. Then multiply the supply
days with the total available minutes per day to determine lead time minutes. Lastly,
divide the cycle time by lead time minutes to determine process cycle efficiency. [50]
..
Figure 3.6: Value stream map
Stellenbosch University https://scholar.sun.ac.za
Chapter 3 Lean thinking Industrial Engineering
Page 51
3.4 Create flow
Continuous process flow, also called one-piece flow, is the rapid, uninterrupted, step
by step movement of material or information through a system. Improvement efforts
are directed towards flow once value added and non-value added activities have
been identified. The importance of flow is to ensure stable operations, which is the
foundation for the TPS. Flow is therefore recognised as a crucial lean principle. [38]
.
Principle 2: Create continuous process flow to bring problems to the surface
Continuous flow means that material and information moves through efficient process
steps with minimal delays and the shortest travel distance. Even though flow focuses
on value added activities to increase value and reduces throughput time, it is a fragile
approach that forces problems to the surface. However, this is a positive and desired
effect that is crucial to continuous improvement and the development of people. [17]
.
The opposite of continuous process flow is batch production. Various lean tools and
techniques are available to move away from this traditional method that pushes large
quantities of material and information through the system at the same time. Most of
these tools focus on the establishment of stable operations that produce one unit at a
time. Although flow is not always practical, it provides many opportunities to improve.
.
There are several advantages to continuous flow. First, workers can detect and fix
defects easier in smaller batches. Second, processes are more flexible because of
short lead times and quick changeovers that accommodate changes in customer
demand. Third, value added work is easier to identify because operations are more
transparent. Fourth, operations are pushed together to better utilise floor space and
eliminate excess inventory. Fifth, employee morale increases because of transparent
processes and visible improvement. Sixth, standard procedures and an organised
environment can reduce the likelihood and severity of hazardous occurrences. [38]
3.4.1 Waste elimination
The identification and elimination of waste is a primary lean principle. Taiichi Ohno
once said: “All we are doing is looking at the time line from the moment the customer
gives us an order to the point when we collect the cash. And we are reducing that
time line removing the non-value added wastes.” Waste elimination is therefore the
first step towards the creation of process flow, once the value stream is mapped. [51]
Stellenbosch University https://scholar.sun.ac.za

Chapter 3 Lean thinking Industrial Engineering
Page 52
Waste elimination is also important to demonstrate the essential strategy of process
flow. Many people implement continuous flow only as the step by step movement of
material or information through a system, but the main purpose of flow is to create a
connected value stream in which process workers are being forced to think and solve
problems. It is therefore important to understand that waste elimination supports the
philosophy behind process flow, and not only the physical interpretation of flow. [38]
.
The key to waste elimination lies in this paradox: In order to improve, the condition
must be made worse. This is because operations become more dependent as they
are linked together to create waste free work cells; so when one operation shuts
down, the next also shuts down. Therefore, waste elimination often sounds easy, but
it cannot be implemented to create flow without a certain amount of discomfort. [16]
Taiichi Ohno identified seven types of waste that should be eliminated to achieve a
waste free manufacturing process. However, these have since been adapted to be
relevant to any business environment. This section focuses on the definition of these
wastes, as well as an additional eight waste. Although many of these wastes can be
eliminated straightaway, the tools and techniques that are discussed throughout this
chapter can be applied to deal with more complex waste in a systematic manner. [52]
..
1. Overproduction
Overproduction is the production of outcomes when they are not needed, at a faster
rate than is required, and in greater quantities than desired by the customer. Ohno
considered this to be the fundamental waste, because it enables most of the other
wastes. This can also lead to an increase in process cost and resources requirements.
.
The cause of overproduction can be traced back to ineffective communication, a poor
production schedule, inaccurate forecasts, inadequate production management, and
excess production to make provision for demand variation. Batch flow, which pushes
extra material and information into the system, can also lead to overproduction. [53]
.
Overproduction can be countered by a schedule that enforces production at the rate
of customer demand. People that are kept busy with pointless work just to increase
workforce utilisation are also a form of overproduction, which can lead to extra labour
requirements. It is therefore critical to pace the production rate to match demand. [37]
Stellenbosch University https://scholar.sun.ac.za

Chapter 3 Lean thinking Industrial Engineering
Page 53
2. Inventory
Inventory waste can be physical or a queue of information. This includes excess raw
material, WIP, safety stock, and products that are not needed at the moment. These
are considered to have a significant impact on process performance because it hides
potential problems such as longer lead times, obsolescence, damage goods, delays,
equipment downtime, late deliveries, uneven production, and long setup times. [16]
.
High inventory is often the result of overproduction. Therefore, overproduction should
be addressed together with high inventory to determine if there exists any correlation
between them. These wastes provide the initial focus to execute waste reduction and
elimination activities because both of them can aggravate other types of wastes. [38]
.
Although considered a waste, the careful use of inventory may be advantageous until
processes are stable. Inventory is therefore frequently used to provide a safety buffer
against variation and compensate for a lack of flexible processes. This is considered
a weakness and should serve as a constant reminder of the need to strengthen the
process. The ideal process should have no inventory, but this is not always practical
because of variation, and some processes also need some inventory to function. [53]
.
3. Transportation
Transportation waste is the pointless movement of inventory within the process, even
when it is only a short distance. This includes product deterioration and damage from
extended transport times, in which no value is created for the customer. Additional,
indirect waste includes excessive moving equipment and several storage areas. [54]
.
Poor transportation practices can be caused by high levels of inventory and changes
of priorities. Ineffective communication can also lead to work that is transported to the
wrong person or department. Furthermore, a functional organisation perspective can
increase transportation waste as work needs to travel between specialised functions.
4. Waiting
Waiting waste is defined as the time machines, work pieces, or people are idle and
no value is added to the product or service. This includes employees that monitor
automated machines and employees that stand around while they wait for supplies,
tools, information, the next process step, capacity constraints, machine maintenance,
and required resources. Another problem is the lack of immediate work opportunities.
Stellenbosch University https://scholar.sun.ac.za

Chapter 3 Lean thinking Industrial Engineering
Page 54
The reduction of waiting time is crucial to create continuous process flow. Production
must therefore be planned around the operation with the least amount of capacity so
that idle time for downstream operations is minimised. Furthermore, implement total
productive maintenance so that equipment and machine downtime is also minimised.
.
5. Defects
A defect is a nonconformance on one of many possible quality characteristics of an
output that causes customer dissatisfaction. This includes defective work that must
be corrected, reworked, inspected, or scrapped. These actions result in duplication of
effort and are a significant waste of resources such as time, labour and material. [54]
Defects and defective outcomes can be the result of various quality issues such as
unreliable processes, equipment issues, poor maintenance, lack of process control,
and the absence of standard work. Also, poor communication may lead to incorrect
information, inconsistent information, and insufficient information or instructions. [53]
.
Defects can be avoided or reduced with the presence of standard work procedures
that provides instructions for consistent work performance. Also, processes can be
designed to decrease the likelihood of defect occurrence and also for the proactive
detection of abnormalities so that issues can be corrected as soon as possible. [38].
.
6. Over processing
Over processing is the execution of work activities that are not required to complete a
process. A rule of thumb is to determine if the work will be visible to the customer in
terms of value added to a product, service, or information. Furthermore, it is also a
waste when a higher quality outcome is produced than is required by the customer.
..
Over processing is often one of the more difficult wastes to detect and eliminate, but
it can be prevented by continuous comparison of customer requirements and process
specifications to identify improvement opportunities. Process workers should also be
on the lookout for opportunities to improve their usual standard work procedures. [53]
7. Motion
Motion waste is any pointless movement that requires a person to bend, reach, look
for equipment, or walk when they perform a process and it does not add value for the
customer. In other words, it is any form of motion that does not add value to the work.
Stellenbosch University https://scholar.sun.ac.za
Chapter 3 Lean thinking Industrial Engineering
Page 55
Motion waste can be caused by poor workplace design and inefficient arrangement
of resources. This include the time spent to learn how to function effectively in an
inefficient environment and the time wasted when people search for tools, material
and information that are not available where they are required. Other causes include
the use of wrong or inefficient tools, which may lead to health and safety issues. [53]
.
It can be difficult to detect subtle movements, but there are many proactive tools and
techniques that can be used to avoid unnecessary motion. The first step is to enforce
standard methods for efficient work procedures with minimum movement. Then the
workplace should be cleaned and organised to sustain a practical layout for tools and
equipment so that they are always available when and where they are required. [38]
.
8. Talents
Talent waste, the additional “eighth” waste, is the underutilisation of employee skill
and intellect. This waste includes people that do work without the required expertise
and knowledge, and a lack of education opportunities. Employees that have partial
responsibilities in terms of the process that affect them are also considered a waste.
.
The cause of talent waste can be traced back to a poor organisational culture, low to
no investment in training and education, and poor employment practices. Employee
skill and intellect that are ignored can also lead to wasted improvement opportunities.
.
Talent waste can be avoided when employees are empowered to make decisions
with their own judgment, within the context of best practice methods. Encourage
employees to utilise their talents and be innovative. Furthermore, implement job
rotation to increase their area of expertise and their appreciation of the process. [40]
.
3.4.2 Standardised work
There can be no improvement without standardisation, because operations would
most likely be performed in different ways by different people. This would lead to
variation and unpredictable outcomes, which restricts process flow. Standardised
work is therefore one of the first lean principles that should be implemented as a
baseline for improvement activities. Also, when work is performed in a structured
manner, successful implementation of lean improvement activities is more likely. [37]
.
Stellenbosch University https://scholar.sun.ac.za

Chapter 3 Lean thinking Industrial Engineering
Page 56
Principle 6: Standardised tasks and processes are the foundation for
continuous improvement and employee empowerment
Standardised work enforces stable, repeatable procedures in operations to maintain
constant, predictable process output. This is based on the definition, clarification, and
utilisation of methods that will ensure best possible results. However, it is a proactive
approach that is used to identify problems and establish effective solutions. This is
driven by people, not done to people, to ensure continuous improvement efforts. [16]
.
People closest to the work should be exploited to contribute towards standardization
because of their direct experience and knowledge of the process; management must
encourage employees to share their knowledge and experience. Standardisation is
then used to capture this knowledge and improve the process, while people continue
to learn and develop. However, best practice methods must guide this procedure to
ensure that organisational values and beliefs are respected by every participant. [55]
Standardised work should not be confused with work standards. The latter evokes
images of a rigid procedure where people use stopwatches to squeeze out every
second of productivity; employees are also monitored and trained to ensure that they
follow a specified, predefined method to perform work. This creates a bureaucracy
where human will and creativity are wiped out and people become automatons. [35]
.
Standardised work is used to establish the appropriate method to perform work. The
SDSA cycle is then used to evaluate this method; people must continue to analyse
and improve standardised work through the development of better work methods. [15]
Figure 3.7: SDSA standardisation cycle
Stellenbosch University https://scholar.sun.ac.za

Chapter 3 Lean thinking Industrial Engineering
Page 57
3.4.3 5-S movement
A clean and organised work environment is considered vital to support standardised
work and should therefore be applied throughout the organisation. However, it is also
the lean aspect that is most often demeaned because it is so simple. Nevertheless,
the Japanese realised its importance and developed a basic technique that is used to
promote good housekeeping actions. This technique is called the 5-S movement. [56]
The 5-S movement is a simple, yet powerful, technique that drives organisation wide
improvement efforts because it is practical and low cost. The purpose is to create a
cleaner and better organised environment to improve safety and performance. This
technique rarely uncovers major opportunities to save resources, but its benefits are
realised over time as it is used by more people. Employees should therefore be given
ownership of their respective work areas to participate in this improvement approach.
.
The name “5-S” is derived from five Japanese words that begin with the letter S: seiri,
seiton, seiso, seiketsu, and shitsuke. The English translations that match these are:
sort, set in order, shine, standardise, and sustain. These are used to create a clean
and organised workplace that encourages waste elimination and standardisation. [15]
Sort: Clear out every item that are broken, not usable, rarely used, or insufficient for a
specific operation to only have what is needed, when it is needed. However, even the
required items must be kept to an absolute minimum. Always continue to mark rarely
used items, or items not used within a month, with red tags. These items should be
reviewed and approved by the supervisor and then be placed in a marked storage area.
Set in order: Organise and arrange items so that minimal effort is required between
activities. Label items and create adequate storage areas so that items are easy to
identify and available for immediate usage. Daily items can be stored on a labelled
shadow board, weekly items in labelled drawers, monthly items in cabinets labelled
with pictures and text. Other strategies include painted floors, outlined work areas,
and modular shelves. Visual control techniques should be used to support this step.
.
Shine: Maintain a clean work area. This makes problems more transparent and acts
as a form of visual inspection that enables immediate problem solving. It also helps
to keep items clean and in workable order, ready for immediate use. Shine should
therefore be performed on a daily basis to promote a proactive maintenance system.
Stellenbosch University https://scholar.sun.ac.za
Chapter 3 Lean thinking Industrial Engineering
Page 58
Standardise: Standardised methods and tools should be recognisable throughout the
organisation to maintain and monitor the first three steps. This ensures uniform work
methods throughout the organisation. Effective visual control can be implemented for
easier identification of anomalies and variation. This includes clear work instructions,
posters, scoreboards, charts, and the standard colouration of work areas and tools.
.
Sustain: Be disciplined and adhere to standardised work. This requires continuous
evaluation of 5-S practices, and the cooperation of management and employees to
make it happen. Management should audit 5-S regularly with standard checklist in
the initial phase of implementation, but when 5-S is already a habit, teams can audit
their own work areas in regular intervals while managers only do random inspections.
The 5-S movement should be integrated into more operations after successful initial
implementation. This ensures continuous improvement and maintenance of the daily
work environment. Use posters, pocket manuals, newsletters, performance reviews,
and department tours to distribute and promote 5-S information until it becomes part
of the organisational culture. Remember to use regular audits to stay disciplined and
implement visual control to encourage 5-S practices throughout the organisation. [38]
3.4.4 Visual control
In modern organisations the ideal environment is paperless and important process
information is online. However, people long for a visual environment with charts and
graphs, where they can see at a glance whether their work is in a standard condition
of deviation; even though robots do not care for visual control, people do, and the
system should be designed to support people. Well-designed and well-placed charts
can also be an obvious location for effective discussions within the affected area. [57]
Principle 9: Use visual control so no problems are hidden
Visual control is used to affect behaviour and communicate information to a broad
group of people at once, without text or other written instructions; it is the practical
application of the proverb that states a picture is worth a thousand words. Visual
control should therefore enable people to absorb information without distractions. [16]
The important aspects of visual control are location and information; Charts, graphs,
and posters must provide relevant information where it is needed. These should then
be maintained with updated information to act as focal point for performance reviews.
Stellenbosch University https://scholar.sun.ac.za
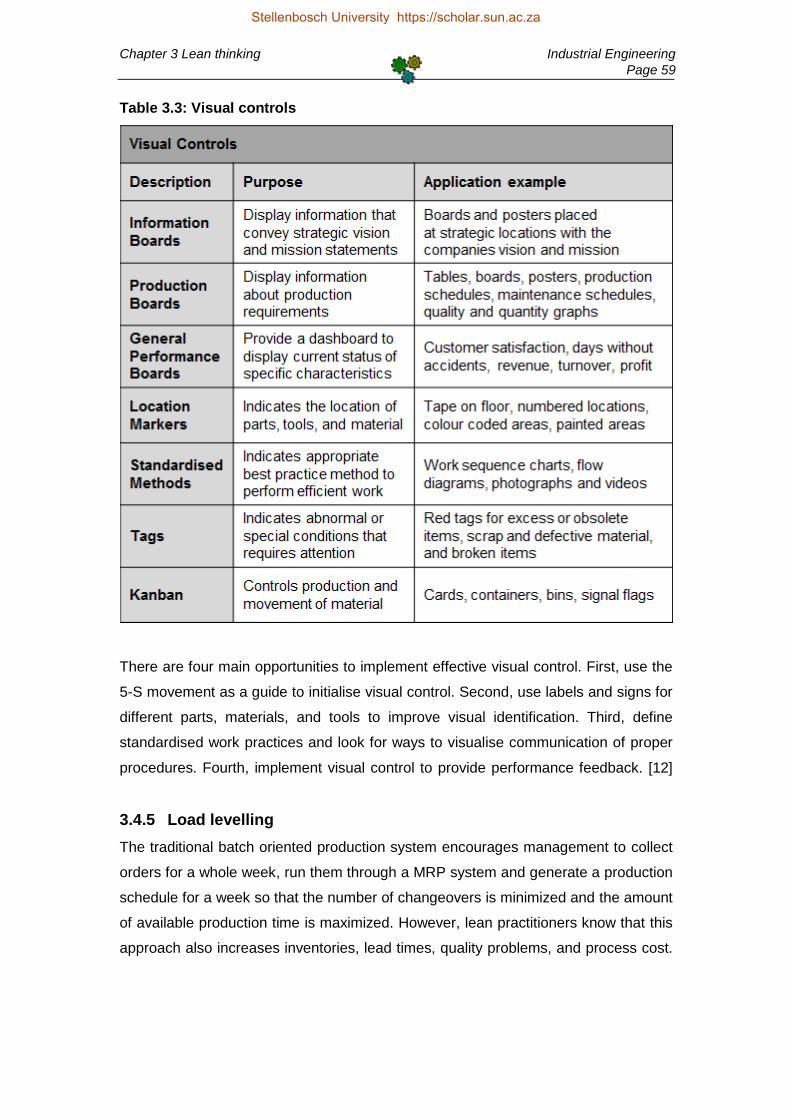
Chapter 3 Lean thinking Industrial Engineering
Page 59
Table 3.3: Visual controls
There are four main opportunities to implement effective visual control. First, use the
5-S movement as a guide to initialise visual control. Second, use labels and signs for
different parts, materials, and tools to improve visual identification. Third, define
standardised work practices and look for ways to visualise communication of proper
procedures. Fourth, implement visual control to provide performance feedback. [12]
.
3.4.5 Load levelling
The traditional batch oriented production system encourages management to collect
orders for a whole week, run them through a MRP system and generate a production
schedule for a week so that the number of changeovers is minimized and the amount
of available production time is maximized. However, lean practitioners know that this
approach also increases inventories, lead times, quality problems, and process cost.
.
Stellenbosch University https://scholar.sun.ac.za
Chapter 3 Lean thinking Industrial Engineering
Page 60
The problem with this approach is that customers do not submit orders for specific
batch sizes, even though batch production is the norm. This also creates issues with
alignment of resources to keep up with demand fluctuation; changes in demand can
either lead to capacity shortage or surplus. This causes unevenness and overburden.
Unevenness is any variation that leads to unbalanced situations. These situations
mean that resources must be available for the highest level of production, even if
average requirements are much lower. Even though it is common for demand to be
uneven, the problem is often hidden with batch production. Demand must therefore
be levelled for the successful implementation of flow. Other causes of unevenness
include problems such as defects, equipment downtime, and lack of resources. [37]
.
Overburden is any activity that pushes personnel or equipment beyond natural limits
and causes unreasonable stress or effort. This includes the use of a machine or tool
to perform a function that it is not designed for, which can lead to breakdown and
defects. Also, from a social perspective, it can be the exploitation of manpower and
insufficient employee preparation that leads to safety, ethical and moral issues. [37]
.
The only way to create continuous flow is to have stable processes. This requires the
elimination of unevenness and overburden, and it also ensures that the organisation
is not forced into a reactive mode. Any attempt to standardise a chaotic process with
high level of variability will lead to frustration, because it is not possible to standardise
variation. The production schedule must therefore be levelled to deal with fluctuations.
.
Principle 4: Level out the workload
This principle is to level total demand over a period of time, rather than to produce
output in relation to the actual fluctuation of customer demand. Initial attempts to
level the workload may require customers to wait for a short period of time so that
daily process volume and mix can be balanced. However, once production is almost
levelled, the process will be flexible enough to respond to changes in demand. [58]
.
Most lean processes are often balanced to support a cycle time some percentage
below takt time to compensate for variation, even though the ideal balanced process
strive to have little or no waste. However, in the ideal process, any operation can
become the constraint if there is fluctuation in performance or customer demand. [40]
Stellenbosch University https://scholar.sun.ac.za

Chapter 3 Lean thinking Industrial Engineering
Page 61
Sometimes selective addition of inventory waste is recommended to avoid a system
where any operation can become the constraint at any moment. Even though this is
contrast to lean belief, levelled workloads require a combination of build-to-order and
build-to-stock, based on predictions. Although it seems wasteful to keep some final
good inventory, far more waste can be removed with a balanced process output. [16]
The build-to-stock approach is used for relatively high volume output that you know
the customer will buy, and stock is continuously replenished through the application
of a pull system. The built-to-order approach is used for less predictable customer
demand. Then a third stream of safety stock provides excess inventory to maintain
balanced process output when demand is low and high demand was expected, or to
provide safety stock for unexpected high demand. These three approaches should
be combined to provide sufficient information for a levelled production schedule. [38]
.
Figure 3.8: Load levelling (operator schedule)
Stellenbosch University https://scholar.sun.ac.za
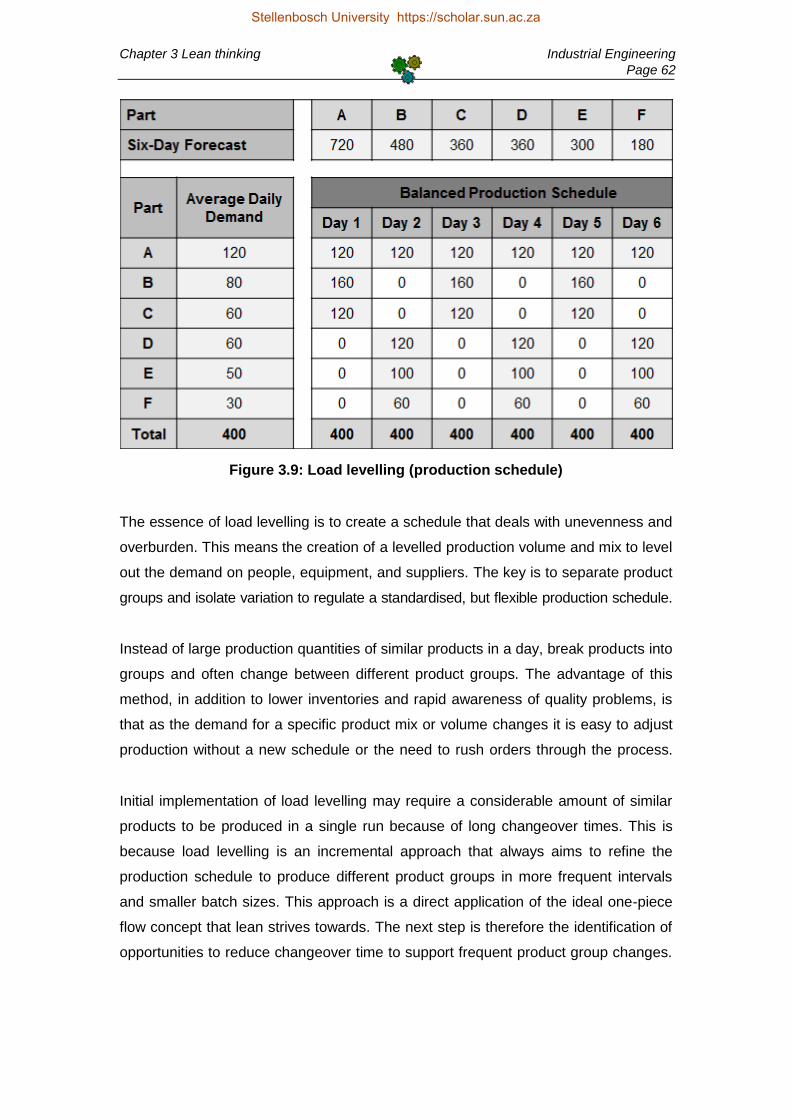
Chapter 3 Lean thinking Industrial Engineering
Page 62
Figure 3.9: Load levelling (production schedule)
The essence of load levelling is to create a schedule that deals with unevenness and
overburden. This means the creation of a levelled production volume and mix to level
out the demand on people, equipment, and suppliers. The key is to separate product
groups and isolate variation to regulate a standardised, but flexible production schedule.
Instead of large production quantities of similar products in a day, break products into
groups and often change between different product groups. The advantage of this
method, in addition to lower inventories and rapid awareness of quality problems, is
that as the demand for a specific product mix or volume changes it is easy to adjust
production without a new schedule or the need to rush orders through the process.
.
Initial implementation of load levelling may require a considerable amount of similar
products to be produced in a single run because of long changeover times. This is
because load levelling is an incremental approach that always aims to refine the
production schedule to produce different product groups in more frequent intervals
and smaller batch sizes. This approach is a direct application of the ideal one-piece
flow concept that lean strives towards. The next step is therefore the identification of
opportunities to reduce changeover time to support frequent product group changes.
.
Stellenbosch University https://scholar.sun.ac.za

Chapter 3 Lean thinking Industrial Engineering
Page 63
3.4.6 Single minute exchange of die
Single minute exchange of die (SMED) is a technique used for rapid changeovers
that allow smaller batches to be processed, while flow is increased and production is
still economical. The phrase “single minute” should not be taken literally, but rather
seen as a goal to reach setups that can be completed in fewer than 10 minutes. [59]
.
SMED actions are required to accommodate an increased demand for larger product
selections, reduced product life cycles and the need to eliminate inventories. Some
advantages of shorter and more efficient setups include flexible systems, shorter lead
time, better quality, higher performance, and the opportunity to level the production
schedule. Setups are therefore standardised, simpler and safer, for better production.
Shigeo Shingo developed an approach to reduce changeover time with the SMED
concept that is based on the separation of internal and external setups. This simple,
yet effective approach is summarised in three steps that form a repeated cycle. [38]
.
Step 1: Observe the process to separate internal setups and external setups; internal
setups can only be performed when the process is stopped, but external setups can
be performed while the process is still in operation. Therefore, focus on the reduction
of external setup time through preparation of equipment before the start of the setup,
the utilisation of the right people, and resources that are available when needed. This
can be supported with basic checklists and functional checks on equipment and tools.
.
Step 2: Convert internal setups to external setups where possible to ensure that the
maximum amount of preparation is accomplished before the process is stopped. This
requires the analysis of every function in each internal setup, and the identification of
opportunities to convert these into external setups. Conversion techniques include
the standardisation of setups and preparation of changeover conditions in advance.
.
Step 3: Streamline internal and external setups through simplification. Take another
look at every function within each setup and identify opportunities to avoid the need
for adjustments, and ultimately eliminate the need for the setup. However, this is not
always practical and often parallel functions are required to reduce setup time. After a
setup is minimised, it should be monitored and maintained with standard visual controls.
Stellenbosch University https://scholar.sun.ac.za
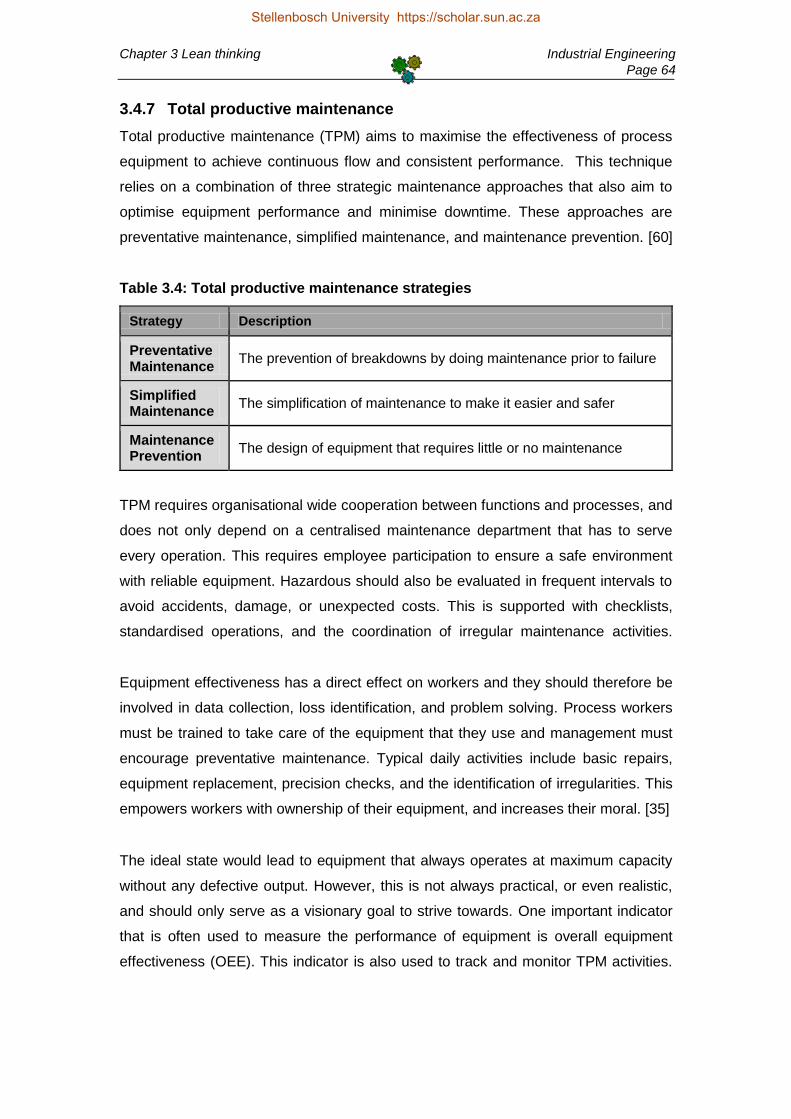
Chapter 3 Lean thinking Industrial Engineering
Page 64
3.4.7 Total productive maintenance
Total productive maintenance (TPM) aims to maximise the effectiveness of process
equipment to achieve continuous flow and consistent performance. This technique
relies on a combination of three strategic maintenance approaches that also aim to
optimise equipment performance and minimise downtime. These approaches are
preventative maintenance, simplified maintenance, and maintenance prevention. [60]
.
Table 3.4: Total productive maintenance strategies
Strategy Description
Preventative Maintenance
The prevention of breakdowns by doing maintenance prior to failure
Simplified Maintenance
The simplification of maintenance to make it easier and safer
Maintenance Prevention
The design of equipment that requires little or no maintenance
TPM requires organisational wide cooperation between functions and processes, and
does not only depend on a centralised maintenance department that has to serve
every operation. This requires employee participation to ensure a safe environment
with reliable equipment. Hazardous should also be evaluated in frequent intervals to
avoid accidents, damage, or unexpected costs. This is supported with checklists,
standardised operations, and the coordination of irregular maintenance activities.
Equipment effectiveness has a direct effect on workers and they should therefore be
involved in data collection, loss identification, and problem solving. Process workers
must be trained to take care of the equipment that they use and management must
encourage preventative maintenance. Typical daily activities include basic repairs,
equipment replacement, precision checks, and the identification of irregularities. This
empowers workers with ownership of their equipment, and increases their moral. [35]
The ideal state would lead to equipment that always operates at maximum capacity
without any defective output. However, this is not always practical, or even realistic,
and should only serve as a visionary goal to strive towards. One important indicator
that is often used to measure the performance of equipment is overall equipment
effectiveness (OEE). This indicator is also used to track and monitor TPM activities.
Stellenbosch University https://scholar.sun.ac.za

Chapter 3 Lean thinking Industrial Engineering
Page 65
Seiichi Nakajima introduced OEE as a fundamental TPM indicator in 1988 to create
awareness of effective equipment utilisation. This indicator supports the identification,
analysis, and reduction of equipment and process related losses. OEE is calculated
as the product of the availability rate, the performance rate, and the quality rate. [61]
Availability rate is the actual amount of time that equipment is in operation versus the
available time, also called load time. This refers to time when the equipment is not in
operation, although it was scheduled to run; so load time does not include planned
stops such as preventive maintenance and operator breaks. A low availability rate
indicates downtime losses in terms of failures, slow setups, and material shortages.
.
Performance rate is the product of the amount of units produced and the theoretical
cycle time per unit, versus the total actual operating time. This refers to equipment
that does not always operate at the standard speed designed to control the specific
process. A low performance rate reflects speed losses in terms of idle time, reduced
speed operations, and unplanned stoppages; this does not include defective output.
Figure 3.10: Overall equipment effectiveness
Stellenbosch University https://scholar.sun.ac.za

Chapter 3 Lean thinking Industrial Engineering
Page 66
Quality rate is the ratio of good units versus the total amount of units produced. This
refers to the portion of output that complies with a specified quality standard. A low
quality rate indicates defect losses in terms of scrap, rework, and start-up problems.
These three factors are used for the identification and reduction of equipment losses
to yield an OEE of 100%. However, this is not always a realistic target. Therefore,
Seiichi Nakajima defined optimal values for each of the OEE factors that are realistic
and achievable: an availability rate that surpasses 90%, a performance rate above
95%, and a quality rate that exceeds 99%, in order to ensure at least 85% OEE. [61]
3.4.8 Built-in-quality
Built-in-quality, also called Jidoka or autonomation, is the concept of “automation with
a human touch” or “intelligent automation” to detect and prevent errors. This concept
is one of the three pillars of the TPS frameworks because customer quality drives the
value proposition of lean organisations. It is also an important part of flow because it
focuses on small batch sizes to ease error detection and ensure quality and flexibility.
The dependence on continuous flow to connect operations increases the severity of
any problem and necessitates their elimination. Built-in-quality systems emphasises
equipment readiness, manpower availability and material supply when operational
functions are stopped because of a failure. Although the traditional believe is that this
is unacceptable, the counterintuitive thinking is an opportunity to identify a weakness
within the system, to attack the weakness, and to strengthen the overall system. [62]
.
Principle 5: Build a culture of stopping to fix problems, to get quality right the
first time
The concept of built-in-quality was introduced when the founder of Toyota, Sakichi
Toyoda, developed the power loom after he watched his grandmother slave away at
a manual loom. The problem with the manual loom was that if a single thread broke,
material woven after this failure was wasted until the problem was detected and the
loom was reorganised. Toyoda noticed this problem and his solution was to build the
human capability into the loom to stop when a problem was detected. He achieved
this with the andon system, which uses a signal to alert the operator that the loom
needs assistance. This became the basis for one of the three pillars of the TPS. [16]
.
Stellenbosch University https://scholar.sun.ac.za

Chapter 3 Lean thinking Industrial Engineering
Page 67
Built-in-quality is a five step approach that aims to detect problems, stop the process,
fix or correct the immediate condition, investigate the root cause, and install a proper
countermeasure. It reduces any adverse impact for the customer, as well as cost of a
mistake because defects are removed before further value is added. Also, when the
recurrence of a problem is prevented at the source as soon as it occurs, the process
is improved in the long run even though the short term result may not be transparent.
.
Motivated people are at the centre of the TPS framework and this is also reflected in
built-in-quality. Traditional organisations assume that mistakes are caused by human
error, but lean organisations are aware that an error is caused by system failure; this
means that errors occur because the current system allows them, and not because
people are incompetent. Organisational wide participation is therefore required to
create systems that prevent mistakes. This also includes the use of poka-yoke. [38]
.
Poka-yoke (error proofing) is any device or procedure that either prevents mistakes
or makes mistakes apparent for elimination. The concept was developed by Shigeo
Shingo in the 1960’s. He pointed out that mistakes are bound to happen, but this can
be prevented to some degree through the implementation of poka-yoke; the objective
is to eliminate the root causes of conditions that introduce errors into the system. [63]
Poka-yoke is a typical lean technique that is used for the identification and evaluation
of problems. It is a concept that is often demeaned because of its relative simplicity;
this is a common problem with most lean ideas. However, poka-yoke is a relevant
technique at locations where people are responsible for a process, because they can
sometimes inadvertently forget important work practices and their performance varies.
A decent poka-yoke device should be simple and cost effective, part of the process,
and able to provide quick feedback from where the error occurred. The feedback
must ensure that an operation can be checked without the need for special attention
from the process worker. Typical poka-yoke devices include checklists, automated
measurements, temperature gauges, limit switches, colour codes, and warning lights.
Remember that advanced technology is pointless unless an effective problem solving
method is implemented that supports the system. Successful built-in-quality systems
call for extensive support structures that provide people with the resources required
to detect and solve problems. This requires a trained and empowered workforce. [38]
Stellenbosch University https://scholar.sun.ac.za

Chapter 3 Lean thinking Industrial Engineering
Page 68
3.5 Establish pull
In 1949 the president of Toyota, Kiichiro Toyoda, challenged his executive team to
improve their production rate and avoid bankruptcy. Taiichi Ohno, vice president of
Toyota, accepted this challenge and developed the pull system with the support of
several other important Japanese industrial innovators such as Shigeo Shingo and
Hiroyuki Hirano. They drew inspiration from the American supermarket structure that
was able to quickly replace any product drawn from the shelves by the customer. [38]
Ohno and Shingo suggested a smooth system that delivers the right material, in the
right quantity, with perfect quality, in the right place, when it is needed, as requested
by the customer. They called their approach just-in-time (JIT) service provision. This
production approach uses takt time, continuous process flow, and a pull system.
Principle 3: Use “pull” systems to avoid overproduction
A pull system controls the flow of work through a process with the release of work
into the system only when it is required because a product or service was requested
by the customer. On the other hand, a push system releases work into the system as
demand is predicted or as work becomes available. This can lead to high inventory,
production chaos, firefighting, extended lead times, and lack of important resources.
There are several advantages to pull systems besides improved responsiveness to
customer demand and prevention of excessive inventories. Additional advantages
include shorter lead times, lower inventory storage costs, shorter time to detect errors
and quality problems, lower risk of obsolescence, less transportation damage, lower
material movement costs, lower space requirements, and shorter travel distance. [64]
Pull systems enable the production of what is needed, based on a signal of what has
just been removed from an operation or process. This signal connects information
throughout the system to minimise overproduction. Furthermore, the signal ensures
continuous replenishment of work into the system. This signal is called kanban. [65]
.
Kanban is a Japanese word that stands for card (Kan) and signal (Ban). It is a visual
control system at the point of control for inventory management. The aim of kanban
is to reduce work in process through the frequent replenishment of small amounts of
buffer material based on consumption. This system ensures that just enough material
is available to produce what is required and protect the system against variation. [35]
Stellenbosch University https://scholar.sun.ac.za

Chapter 3 Lean thinking Industrial Engineering
Page 69
Kanban is to pull systems what MRP is to push systems; but kanban is authorised by
downstream operations to supply work. This signal is used most often in organisation
where there is a stable demand and continuous process flow. Kanban devices should
be easy to understand, simple and effective to visualise, and relatively easy to set up.
A kanban order can be communicated upstream through several different types of
cards or visual signals. A basic card can be send upstream to indicate a required
order. Some organisations have painted squares on the ground or workstations to
signal an order if the square is empty. Sometime a container itself can be used as a
signal device when it requires to be refilled. Coloured golf balls can even be rolled
down a pipe to the replenishment centre to order replenishment of specific work. [38]
Even though inventory is standardised and controlled via kanbans, it does not lead to
zero inventory systems. The challenge is therefore to reduce the number of kanbans
to reduce the inventory buffer. This means that kanbans are a waste that should be
eliminated over time if possible. Start to reduce kanban quantities to promote smaller
batches. The number of kanbans required can be calculated with the formula below.
.
Figure 3.11: Kanban calculation
3.6 Pursue perfection
The nature of continuous improvement means that after the successful completion of
the process focus steps the cycle must be repeated with a more focused perspective
that supports incremental improvement efforts. This is because lean ideas are based
on incremental improvement activities to ensure a stable environment. Even though
initial improvement activities were performed in sequence, lean actions must now be
performed as one, because their influence is strong enough to affect each other. [66]
D x L x (1 + S)
C Where:
K = number of kanban cards
D = average number of units demanded per period
L = lead time to replenish an order (expressed in the same time unit as demand)
S = safety stock expressed as a percentage of average demand
C = container size
K =
Stellenbosch University https://scholar.sun.ac.za
Chapter 4 Theory of constraints Industrial Engineering
Page 70
4. Theory of Constraints
Theory of constraints (TOC) is a continuous improvement methodology that aims to
alleviate system constraints in order to ensure maximum operational throughput. This
scientific approach is based on the assumption that every system consists of multiple
dependent operations and one of these acts as a constraint to the entire system. [67]
The concept of TOC can be understood through the chain analogy: View the system
as a chain of interdependent links that work together toward a common goal. Overall
performance of the chain is governed by the strength of the weakest link. Therefore,
any improvement that doesn’t focus on the weakest link is considered to be wasteful.
One fortunate characteristic of TOC is that the current constraint, or weakest link, is
also the highest priority, because TOC does inherent prioritisation of constraints. This
focused methodology creates opportunities for rapid improvement efforts. Immediate
results include faster process throughput, reduced inventory, and increased capacity.
Organisations with extensive hierarchical structures and centralised knowledge value
TOC even more because activities can be localised with only a few people that have
the authority to implement change. Intensive knowledge of data analysis is also not a
requirement for this approach. Employees are therefore often excluded from problem
analysis because their suggestions are not required for successful improvement. [68]
History of theory of constraints
In 1979 Eliyahu Goldratt, a trained physicist, introduced a software-based production
scheduling approach known as optimised production timetables, changed in 1982 to
optimised production technology. This approach was successful because of the logic
that Goldratt introduced. He also realised that his analytic approach can have a much
broader impact on performance than an improved production plan and schedule. [69]
In 1984, Goldratt used his Socratic way to introduce and teach TOC to the world with
his popular novel, “The Goal”. This management orientated novel provided context
for a basic approach to continuous improvement. It discussed many of his constraint
alleviation philosophies, but it didn’t expand on the complete body of knowledge. [67]
Stellenbosch University https://scholar.sun.ac.za

Chapter 4 Theory of constraints Industrial Engineering
Page 71
Goldratt published “The Race” in 1986 to further develop his logical system and get
concepts straight though illustrations and not in the form of a novel. This clarified the
practical implication of how to implement solutions with the drum-buffer-rope method,
based on metaphors developed in “The Goal”. This book also provided insight into
throughput accounting with the brief introduction of global operational measures. [70]
Goldratt expanded his methodology in 1990 with his book “What is this thing called
Theory of Constraints and how should it be implemented?” This book addressed the
fundamental methods of the TOC thinking process to enable focused problem solving
for any system. The five focusing steps of constrain alleviation is also discussed. [71]
Focus of this chapter
This report discusses TOC as a tactical roadmap, strategic roadmap, and accounting
application. The tactical roadmap, five focusing steps, focuses on the alleviation of
practical constraints. The strategic roadmap, thinking approach, is a logical approach
towards systematic problem solving. Lastly, throughput accounting is a measurement
system that prioritises and monitors improvement efforts to support these roadmaps.
.
4.1 Five focusing steps
The five focusing steps is a tactical roadmap that provides a structured approach to
streamline complex processes through constraint alleviation and synchronisation of
activities to achieve continuous improvement of process performance. This requires
complete appreciation of the interrelated components that comprise the system. [71]
Figure 4.1: Five focusing steps of theory of constraints
Stellenbosch University https://scholar.sun.ac.za
Chapter 4 Theory of constraints Industrial Engineering
Page 72
4.1.1 Identify constraint
Modern organisations are so complex that almost an infinite number of improvement
opportunities are available. However, TOC assumes that every system only has one
immediate constraint that governs its performance. Identification of this constraint is
therefore crucial to streamline complex systems and prioritise improvement activities;
the capacity constraint is also called the bottleneck because it limits the flow of work.
The tactical roadmap, five focusing steps, is utilised for the alleviation of physical
process constraints. These can be categorised as either external or internal. External
constraints can be located at the vendor if material or information is not available to
produce what the customer demands; external constraints can also be located in the
market if production capacity exceeds consumption. Internal constraints are located
in the organisation because of operations with limited capacity that govern flow. [52]
..
Several approaches can be used for the identification of internal constraints. A simple
technique, also an important lean principle, is the direct observation of the process to
thoroughly understand the actual situation at process level. First, look for excess WIP
because inventory often accumulates before the immediate constraint. Then, look for
operations that often need to be expedited to complete important orders on time. [67]
Time spend at process level also promotes an appreciation of individual operations
because of interactions with process workers. This is also an effective way to gather
more information from workers to get their opinion on where demand of an operation
exceeds its capacity. Then focus on that area, but also look for other constraints.
Another basic approach is to evaluate every operation to find the one with the longest
lead time. Use a flowchart or lean VSM to document the process in detail so that it is
easier to evaluate individual operations. This also encourages employee participation
to exploit their knowledge through the application of idea generation techniques. [52]
.
The identified constraint is also known as the drum in the renowned drum-buffer-rope
method. The drum title is implied because the constraint provides a beat (cycle time)
to which other operations can be synchronised. TOC states that an hour lost at the
constraint is an hour lost for the total system. Therefore, initial improvement activities
should support the constraint to operate at or near full capacity. The buffer and the
rope are discussed later when the drum is understood, exploited, and improved. [72]
Stellenbosch University https://scholar.sun.ac.za
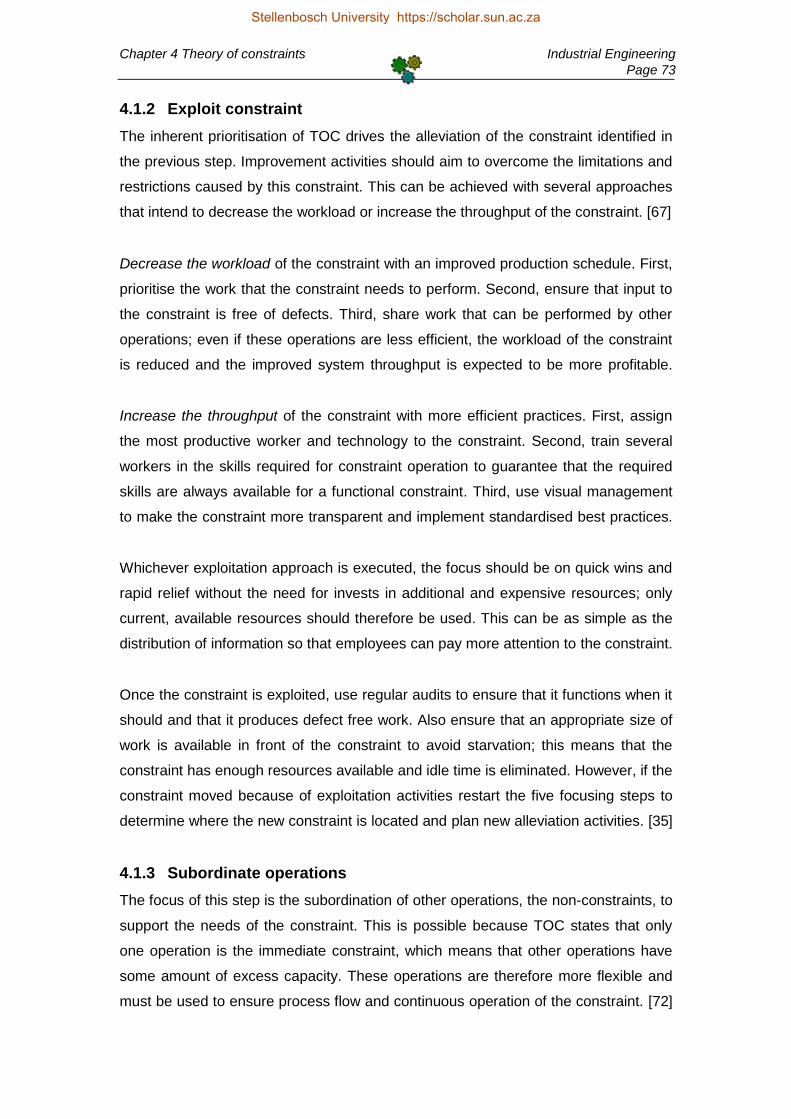
Chapter 4 Theory of constraints Industrial Engineering
Page 73
4.1.2 Exploit constraint
The inherent prioritisation of TOC drives the alleviation of the constraint identified in
the previous step. Improvement activities should aim to overcome the limitations and
restrictions caused by this constraint. This can be achieved with several approaches
that intend to decrease the workload or increase the throughput of the constraint. [67]
Decrease the workload of the constraint with an improved production schedule. First,
prioritise the work that the constraint needs to perform. Second, ensure that input to
the constraint is free of defects. Third, share work that can be performed by other
operations; even if these operations are less efficient, the workload of the constraint
is reduced and the improved system throughput is expected to be more profitable.
.
Increase the throughput of the constraint with more efficient practices. First, assign
the most productive worker and technology to the constraint. Second, train several
workers in the skills required for constraint operation to guarantee that the required
skills are always available for a functional constraint. Third, use visual management
to make the constraint more transparent and implement standardised best practices.
.
Whichever exploitation approach is executed, the focus should be on quick wins and
rapid relief without the need for invests in additional and expensive resources; only
current, available resources should therefore be used. This can be as simple as the
distribution of information so that employees can pay more attention to the constraint.
Once the constraint is exploited, use regular audits to ensure that it functions when it
should and that it produces defect free work. Also ensure that an appropriate size of
work is available in front of the constraint to avoid starvation; this means that the
constraint has enough resources available and idle time is eliminated. However, if the
constraint moved because of exploitation activities restart the five focusing steps to
determine where the new constraint is located and plan new alleviation activities. [35]
4.1.3 Subordinate operations
The focus of this step is the subordination of other operations, the non-constraints, to
support the needs of the constraint. This is possible because TOC states that only
one operation is the immediate constraint, which means that other operations have
some amount of excess capacity. These operations are therefore more flexible and
must be used to ensure process flow and continuous operation of the constraint. [72]
Stellenbosch University https://scholar.sun.ac.za

Chapter 4 Theory of constraints Industrial Engineering
Page 74
The drum-buffer-rope method is used to regulate process flow through the capacity
constraint. Non-constraints are subordinated with the current operational rate of the
constraint to achieve optimum flow and minimise WIP inventory. Remember that the
drum provides the beat (cycle time) that serves as the foundation for subordination.
The buffer is measured in units of time to determine the appropriate time for material
release. Material is then released into the system at fixed time intervals to arrive at
the constraint some period of time prior to its scheduled start. This specified period of
time, the buffer, is used to protect the constraint from starvation because of upstream
variation. The size of the buffer is therefore also dependent on process variation. [73]
The challenge with the buffer is to maintain a safe level of work to avoid starvation,
without the creation of large amounts of inventories. Only the required amount of
material is therefore released into the process. However, some organisations also
maintain a physical buffer in front of the constraint and in front of the final customer to
deal with breakdowns, process variation, lack of resources, and demand fluctuations.
The rope is a signal generated when the constraint receives a work order. Once the
customer placed an order, the rope triggers the release of material into the process
at a certain time dictated by the buffer. Material can be released earlier than required,
with a larger time buffer, to compensate for high process variation. This subordinated
release schedule guarantees flow without the accumulation of excess inventory. [73]
.
Remember, this approach is used to release material into the system, at fixed time
intervals, with an equal amount of work as required by the constraint. It creates an
unbalanced system, which allows non-constraints to ensure smooth operation of the
constraint even in a system with high variation and product mixes. This approach is
opposite to the balanced inventory based (kanban) system used to create lean flow.
.
Figure 4.2: Drum-buffer-rope method with a kanban buffer
Stellenbosch University https://scholar.sun.ac.za

Chapter 4 Theory of constraints Industrial Engineering
Page 75
4.1.4 Elevate constraint
The objective of this step is almost the same as for constraint exploitation. However,
constraint elevation focuses on more complex and substantive improvements. These
improvements must continue to decrease workload or increase throughput until the
constraint is removed. Therefore, larger investments in resources are often required.
.
Several lean practices are often effective when applied for constraint elevation. First,
manage and maintain the constraint with TPM to decrease failures, breakdowns, and
idle time that results from a poor maintenance schedule. Second, evaluate constraint
changeovers with the SMED approach to minimise the loss of production time that is
caused by inefficient changeovers. Third, build quality into the constraint with partial
automation and poka-yoke to ensure defect free output. These practices can also be
used to exploit constraints, but an investment in time makes them more effective. [52]
Evaluate current resources for constraint elevation if the lean practices were not able
to eliminate the constraint. Consider the execution of additional shifts to increase the
utilisation and throughput of the constraint. As soon as the constraint is efficient and
operates at maximum utilisation with the current resources, but demand is still higher
that its capacity, it may be necessary to employ more workers or purchase additional
resources. Another option is to outsource some work to decrease the workload. [67]
.
Investments that are made in this step must be evaluated to determine their effect on
process performance. Therefore, performance data should be analysed to determine
the need for investment, and how it will benefit the organisation as a whole. OEE is a
direct indicator of the effectiveness of the constraint and should therefore be used to
evaluate the current state of the constraint and how it can be improved. Furthermore,
use throughput accounting to determine the effect on system wide performance. [74]
4.1.5 Avoid inertia
The nature of continuous improvement indicates that the five focusing steps must be
implemented as a cycle instead of a once of project. TOC is not completed after the
alleviation of the constraint because of the assumption that there is at all times one
operation in the system that acts as the constraint. Therefore, the cycle is repeated to
discover and alleviate the new constraint. Furthermore, remember that the alleviated
constraint must be supported with a possible change in rules, policies, and priorities.
Stellenbosch University https://scholar.sun.ac.za

Chapter 4 Theory of constraints Industrial Engineering
Page 76
4.2 The thinking process
The thinking process is a strategic roadmap that applies cause-and-effect logic to
understand the core conflict (problem) in processes with many interdependencies. It
is used to analyse the current state, identify the core conflict, and develop an action
plan to reach an improved future state. This approach guarantees that improvements
do not focus on the treatment of symptoms, but rather the elimination of root causes.
.
A suit of logic diagrams, also known as tactic trees, provides guidance throughput the
thinking process. These logic diagrams form the central part of the roadmap and aim
to optimise the performance of the entire organisation instead of individual function in
isolation. This approach is convenient for everyday problem solving because it is able
to deal with intangible constraints such as policies, paradigms, and behaviours. [75]
The tactic trees require different types of logical thinking to accomplish their purpose:
sufficient cause and necessary condition. Sufficient cause thinking uses a cause and
effect approach based on the assumption that the existence of something is sufficient
to cause the existence of something else. Necessary condition thinking is based on
requirements, which means that something must exist for something else to exist. [76]
.
Table 4.1: Classification of the five tactic trees
4.2.1 Current reality tree
The current reality tree (CRT) is a logical structure which represents the current state
of a process in terms of the most probable chain of cause and effect conditions that
lead to the core conflicts. This provides the motivation for the need to improve. The
undesirable effects (UDEs) are identified and traced back to their root causes, which
are identified as the constraints that are responsible for most of the current conflicts.
Stellenbosch University https://scholar.sun.ac.za
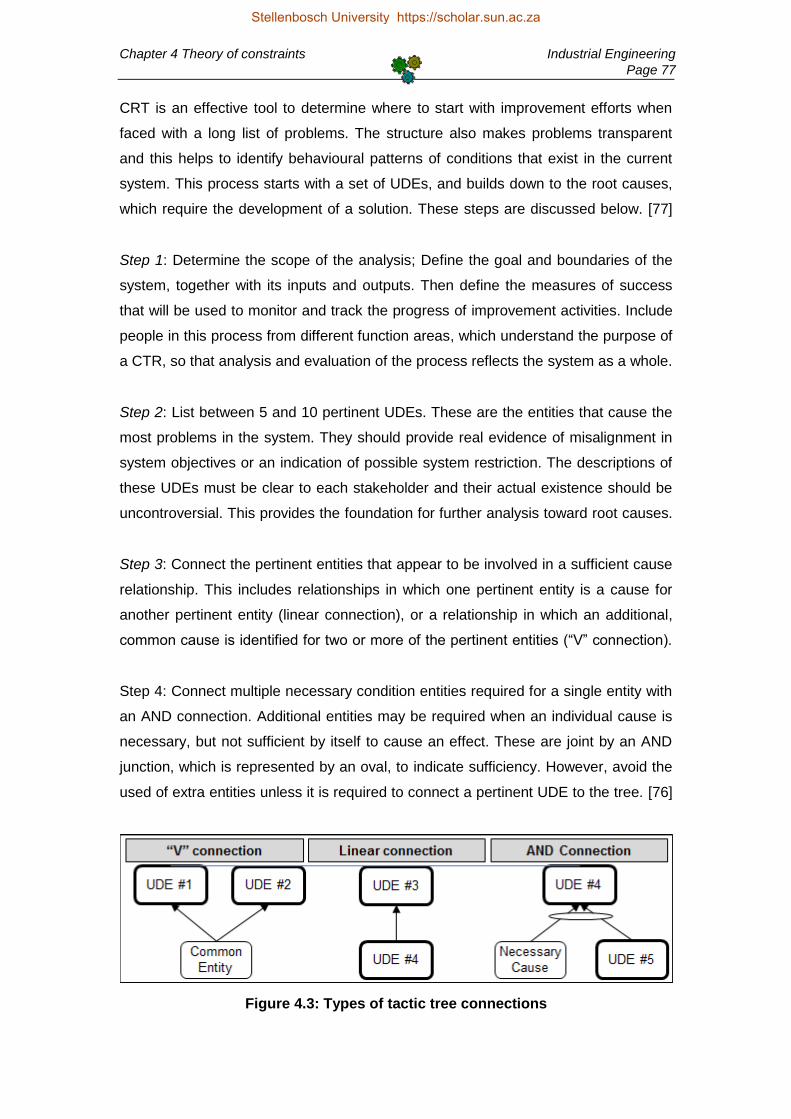
Chapter 4 Theory of constraints Industrial Engineering
Page 77
CRT is an effective tool to determine where to start with improvement efforts when
faced with a long list of problems. The structure also makes problems transparent
and this helps to identify behavioural patterns of conditions that exist in the current
system. This process starts with a set of UDEs, and builds down to the root causes,
which require the development of a solution. These steps are discussed below. [77]
.
Step 1: Determine the scope of the analysis; Define the goal and boundaries of the
system, together with its inputs and outputs. Then define the measures of success
that will be used to monitor and track the progress of improvement activities. Include
people in this process from different function areas, which understand the purpose of
a CTR, so that analysis and evaluation of the process reflects the system as a whole.
.
Step 2: List between 5 and 10 pertinent UDEs. These are the entities that cause the
most problems in the system. They should provide real evidence of misalignment in
system objectives or an indication of possible system restriction. The descriptions of
these UDEs must be clear to each stakeholder and their actual existence should be
uncontroversial. This provides the foundation for further analysis toward root causes.
Step 3: Connect the pertinent entities that appear to be involved in a sufficient cause
relationship. This includes relationships in which one pertinent entity is a cause for
another pertinent entity (linear connection), or a relationship in which an additional,
common cause is identified for two or more of the pertinent entities (“V” connection).
Step 4: Connect multiple necessary condition entities required for a single entity with
an AND connection. Additional entities may be required when an individual cause is
necessary, but not sufficient by itself to cause an effect. These are joint by an AND
junction, which is represented by an oval, to indicate sufficiency. However, avoid the
used of extra entities unless it is required to connect a pertinent UDE to the tree. [76]
.
Figure 4.3: Types of tactic tree connections
Stellenbosch University https://scholar.sun.ac.za
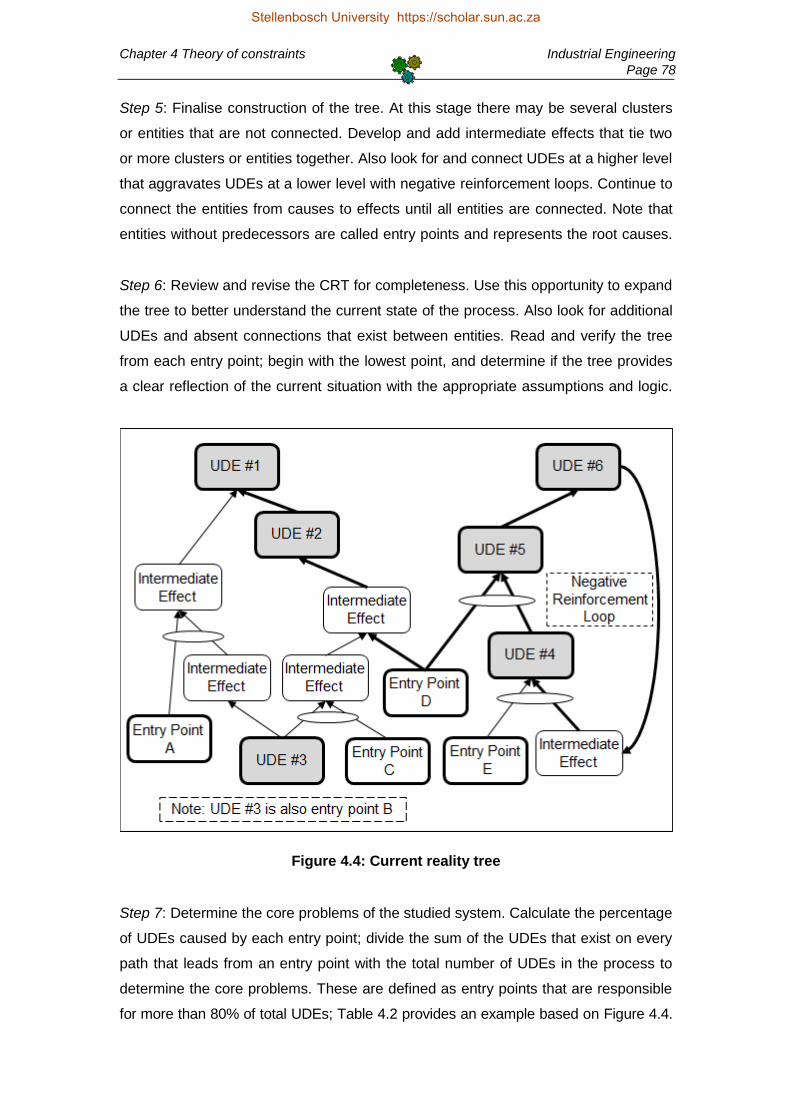
Chapter 4 Theory of constraints Industrial Engineering
Page 78
Step 5: Finalise construction of the tree. At this stage there may be several clusters
or entities that are not connected. Develop and add intermediate effects that tie two
or more clusters or entities together. Also look for and connect UDEs at a higher level
that aggravates UDEs at a lower level with negative reinforcement loops. Continue to
connect the entities from causes to effects until all entities are connected. Note that
entities without predecessors are called entry points and represents the root causes.
Step 6: Review and revise the CRT for completeness. Use this opportunity to expand
the tree to better understand the current state of the process. Also look for additional
UDEs and absent connections that exist between entities. Read and verify the tree
from each entry point; begin with the lowest point, and determine if the tree provides
a clear reflection of the current situation with the appropriate assumptions and logic.
.
Figure 4.4: Current reality tree
Step 7: Determine the core problems of the studied system. Calculate the percentage
of UDEs caused by each entry point; divide the sum of the UDEs that exist on every
path that leads from an entry point with the total number of UDEs in the process to
determine the core problems. These are defined as entry points that are responsible
for more than 80% of total UDEs; Table 4.2 provides an example based on Figure 4.4.
Stellenbosch University https://scholar.sun.ac.za

Chapter 4 Theory of constraints Industrial Engineering
Page 79
Table 4.2: Current reality tree evaluation
Undesirable Effects
1 2 3 4 5 6 Total %
En
try
Po
ints
A X – – – – – 1 17%
B X X X – – – 3 50%
C X X – – – – 2 33%
D X X – X X X 5 83%
E – – – X X X 3 50%
From Table 4.2, it is clear that Entity D is the core problem, because it leads to more
than 80% of the pertinent UDEs. When no entity is responsible for more than 80% of
the pertinent entities, it is necessary to look for a common cause for one or more of
the entry points to the tree. Always double check the answer and envision the CRT
without the core problems. The next step is to solve the identified core problems. [78]
4.2.2 Evaporating cloud
The evaporating cloud (EC), also called conflict resolution diagram, is an analytical
approach used to achieve mutual consensus in search of a plausible solution to the
inherent conflict of the core problem, which is the output of the CRT. This focuses on
the development of future conditions or actions that aim to overcome any inherent
assumptions that prevent the achievement of a specific organisational objective. [77]
Unlike the other tactic trees, the EC has a fixed format that includes two entities that
are defined as opposite wants, which represent the conflict, the need that each want
satisfies based on assumptions, and a common objective that requires both needs to
be satisfied. The EC template is displayed below, followed by its construction steps.
.
Figure 4.5: Evaporating cloud
Stellenbosch University https://scholar.sun.ac.za

Chapter 4 Theory of constraints Industrial Engineering
Page 80
Step 1: Identify the wants. Entity D is the core problem copied from the CRT, and
Entity D’ is then the opposite of the core problem. These entities are prerequisites to
entities B and C, but cannot coexist because they are in conflict with each other.
.
Step 2: Identify the fundamental needs. Entity B represents the need that is achieved
with the existence of Entity D; Entity C represents the need the will be achieved when
Entity D’ exists. However, both B and C are requirements toward the achievement of
a common objective; despite the fact that D and D’ cannot exist at the same time.
.
Step 3: Identify the organisational objective. Create a single objective entity that is a
successor of both needs. If there is no common objective, then there is indeed no
real conflict. Therefore, if a common objective exists, it cannot be achieved at present
because of conflict between the prerequisites. Current policies and paradigms are
therefore most likely some sort of compromise between the two entities that conflict.
..
Step 4: Ensure that the diagram is sensible. Use necessary condition logic to read
the diagram form left to right. This method validates the necessity of each entity that
is a predecessor to another entity. Use this opportunity to fix or clarify the description
of each entity so that everyone affected by the process understand it the same way.
.
Step 5: Review and validate the assumptions. Each arrow is based on one or more
assumptions that determine why a need or a want must be present to achieve its
successor entity. There are also assumptions that underlie the conflict between the
apparent mutual exclusive entities. These assumptions can either be valid or invalid.
.
When every assumption between two entities is considered invalid, the necessary
condition relationship between them is also eliminated. If the assumptions between
the two wants are considered invalid, then the perception of conflict is false and it
doesn’t even exist. Either of these cases establishes that there is no real conflict
situation in the system and a viable path is identified out of this illusion of conflict. [76]
.
Step 6: Brainstorm injections when conflict is still present. An injection is any action
that will enable the achievement of an objective of a necessary condition relationship
without the current necessary condition. This includes actions that aim to eliminate
assumptions that support the conflict between mutual exclusive entities. The goal is to
find a path out of the conflict with the same approach that was used in the previous step.
Stellenbosch University https://scholar.sun.ac.za

Chapter 4 Theory of constraints Industrial Engineering
Page 81
Step 7: Choose one or more simple and practical injections through consensus that
can be implemented to solve the core problem and improve the system. The selected
injections must then be supported with the appropriate resources. Don’t let possible
implementation obstacles restrict the selection of certain injections because a future
reality tree and a prerequisite tree can be constructed to deal with those issues. [78]
.
4.2.3 Future reality tree
The future reality tree (FRT) is a diagram that represents the future state of a system,
which is achieved with the implementation of injections that are designed to eliminate
or reduce UDEs. Its purpose is to ensure the proposed solution will in fact resolve the
unwanted system conditions without the creation of new problems. This also requires
the consideration and incorporation of negative outcome scenarios into the tree. [77]
A well-defined FRT provides the opportunity to review the effectiveness of ideas in
theory before implementation, and also to brainstorm solutions to possible negative
outcomes. This is better than fire fighting, when emergency solutions are required in
reaction to unforeseen problems. The FRT begins with an injection, and then builds
upwards toward a set of desirable effects (DEs). This process is discussed below. [78]
Step 1: Define the injection that is selected for implementation. This injection may be
the result of a previous developed EC, a brainstorming session, or simply an idea or
suggestion. Then create a rectangular entity that represent the injection and describe
it in present tense for a better perspective. This provides the motivation for the FRT.
Step 2: List the anticipated objectives of the injection. These represent the DEs that
summarise the preferred outcome; the objectives can simply be the opposite of the
identified UDEs from the CRT. Then state each DE as a separate objective even if
some of them seem unachieved. This provides the vision toward which to aspire.
Step 3: List potential undesirable conditions (negative branches) of the injection, this
is known as negative branch reservation. UDEs from the CRT can often be used as
negative branches; also, ensure that the selected injection itself is not an undesirable
condition. These are not the same as obstacles, which are defined as difficulties in
the implementation of injections; obstacles can be put aside for the prerequisite tree.
.
Stellenbosch University https://scholar.sun.ac.za
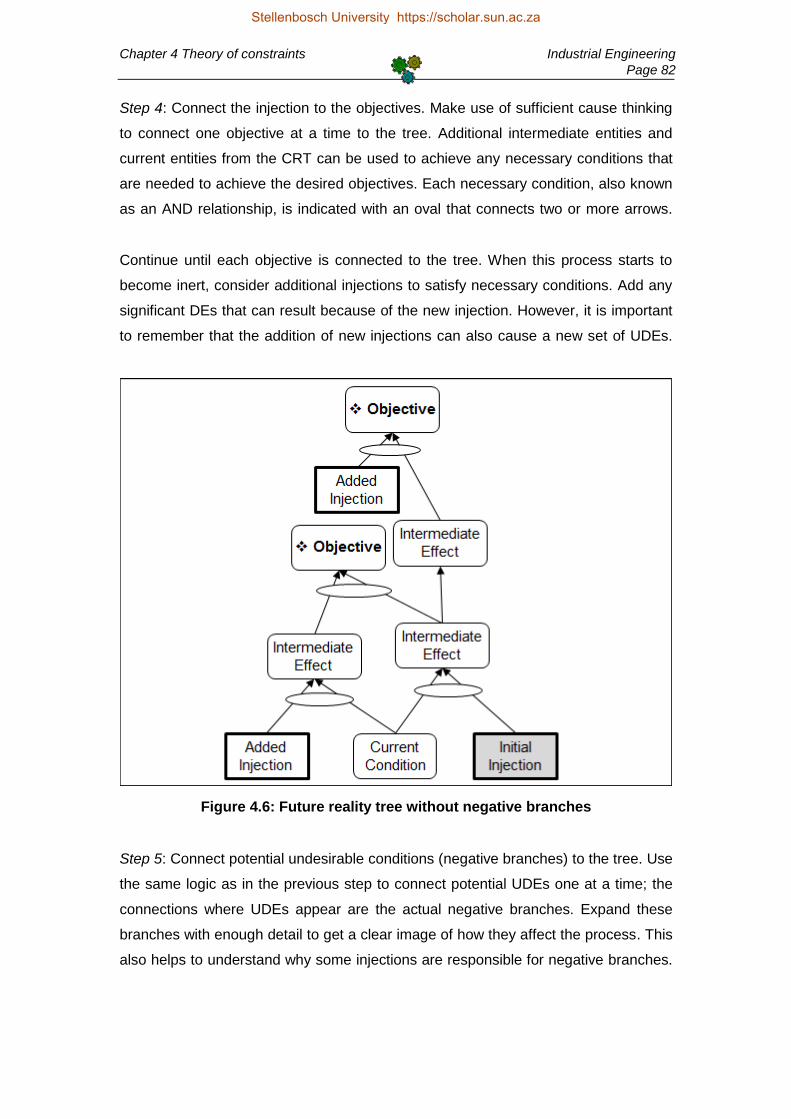
Chapter 4 Theory of constraints Industrial Engineering
Page 82
Step 4: Connect the injection to the objectives. Make use of sufficient cause thinking
to connect one objective at a time to the tree. Additional intermediate entities and
current entities from the CRT can be used to achieve any necessary conditions that
are needed to achieve the desired objectives. Each necessary condition, also known
as an AND relationship, is indicated with an oval that connects two or more arrows.
.
Continue until each objective is connected to the tree. When this process starts to
become inert, consider additional injections to satisfy necessary conditions. Add any
significant DEs that can result because of the new injection. However, it is important
to remember that the addition of new injections can also cause a new set of UDEs.
.
Figure 4.6: Future reality tree without negative branches
Step 5: Connect potential undesirable conditions (negative branches) to the tree. Use
the same logic as in the previous step to connect potential UDEs one at a time; the
connections where UDEs appear are the actual negative branches. Expand these
branches with enough detail to get a clear image of how they affect the process. This
also helps to understand why some injections are responsible for negative branches.
Stellenbosch University https://scholar.sun.ac.za

Chapter 4 Theory of constraints Industrial Engineering
Page 83
Figure 4.7: Future reality tree with negative branches
Step 6: Address the negative branches. Manage them with either reactive mitigation
or proactive avoidance. Reactive mitigation means that new injection are paired with
the UDEs, together with other entities if required, to cause neutral or positive effects
that work against the UDEs. On the other hand, proactive avoidance means that
alternative injections are develop to avoid the presence of entities that cause UDEs.
Figure 4.8: Mitigation and avoidance of negative branches
Stellenbosch University https://scholar.sun.ac.za
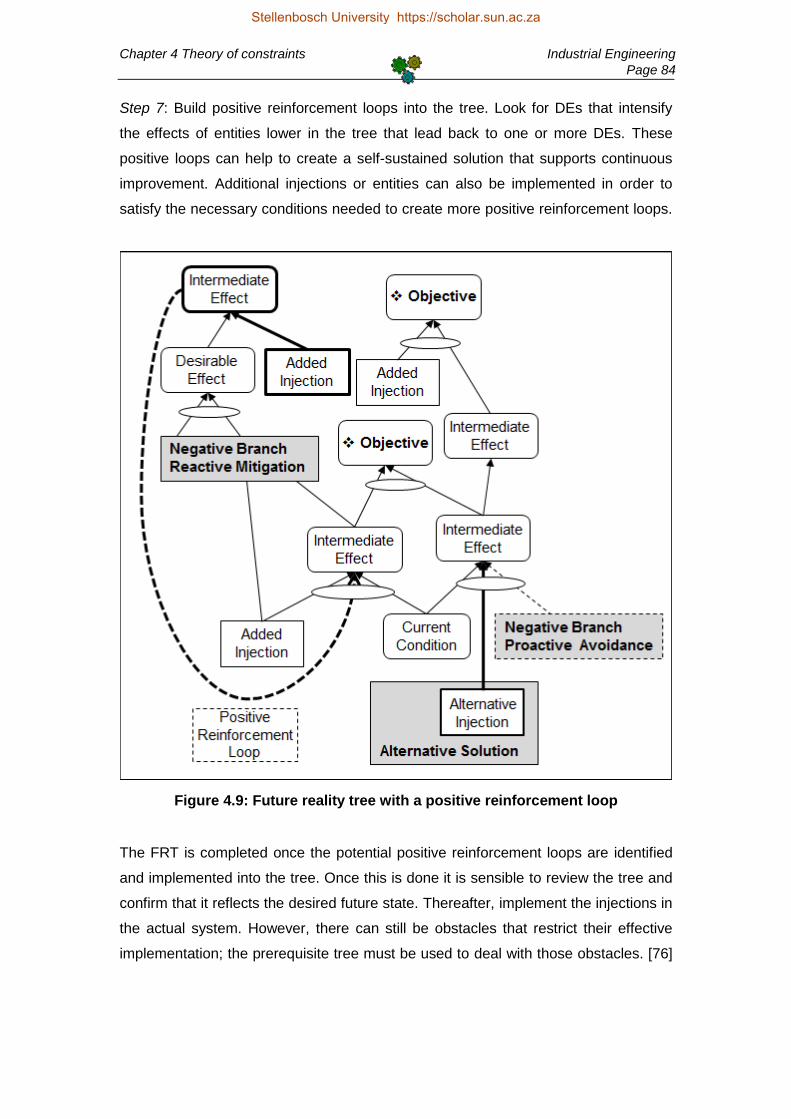
Chapter 4 Theory of constraints Industrial Engineering
Page 84
Step 7: Build positive reinforcement loops into the tree. Look for DEs that intensify
the effects of entities lower in the tree that lead back to one or more DEs. These
positive loops can help to create a self-sustained solution that supports continuous
improvement. Additional injections or entities can also be implemented in order to
satisfy the necessary conditions needed to create more positive reinforcement loops.
.
Figure 4.9: Future reality tree with a positive reinforcement loop
The FRT is completed once the potential positive reinforcement loops are identified
and implemented into the tree. Once this is done it is sensible to review the tree and
confirm that it reflects the desired future state. Thereafter, implement the injections in
the actual system. However, there can still be obstacles that restrict their effective
implementation; the prerequisite tree must be used to deal with those obstacles. [76]
Stellenbosch University https://scholar.sun.ac.za

Chapter 4 Theory of constraints Industrial Engineering
Page 85
4.2.4 Prerequisite tree
The prerequisite tree (PRT) is used to describe the necessary condition relationships
that are required for implementation of injections. This is an effective tool to develop
an implementation roadmap to overcome obstacles that are associated with complex
solutions and procedures. The goal is to establish intermediate objectives that deal
with these complex obstacles. The steps to create the PRT are discussed below. [78]
.
Step 1: Define the objectives. These are entities that describe the goal of the PRT
and can represent injections that were identified in the EC or FRT. It is important to
select organisational wide objectives to avoid suboptimisation. Use present tense for
clear descriptions that communicate the desired outcomes to all the affected people.
.
Step 2: List the obstacles to overcome. Obstacles are current condition entities that
represent the non-existent conditions that are required to achieve objectives. Once
these obstacles are identified each of them should be evaluated to determine their
presence in the system and how this presence prevents the achievement of objectives.
.
Step 3: Brainstorm intermediate objectives to overcome obstacles. These objectives
are represented by milestone entities that must be satisfied in order to achieve the
final objectives. Obstacles can be overcome in one of two ways. First, eliminate the
obstacle completely. Second, eliminate the relevance of the obstacle to the objective.
.
Step 4: Map the implementation sequence of the milestone entities. Start with two
milestones that appear to be associated with each other and connect them with an
arrow to indicate a necessary condition relationship; the assumption behind each
association is the obstacle, which is represented as an obstacle entity. Continue to
connect the milestones to overcome the obstacles until each milestone is connected.
Step 5: Use the objectives that appear to be the most difficult to achieve as the basis
for the PRT, so that it is easier to connect clusters, single entities, and objectives. It is
also possible for some objectives to be milestones for other objectives. Furthermore,
milestones established for an objective may also be used to achieve other objectives.
Connect the obstacles, which the milestones overcome, to objectives. Establish the
associations between obstacles and objectives to form and attach new clusters to the
tree. Connect the milestones that have no necessary dependencies, with any cluster.
Stellenbosch University https://scholar.sun.ac.za

Chapter 4 Theory of constraints Industrial Engineering
Page 86
Figure 4.10: Prerequisite tree
Step 6: At this point all entities must be connected. Ensure that each entry point is
practical and realistic. Consider obstacles that can present themselves when these
entry points are implemented. Create new milestone entities for each new obstacle
that is identified and connect them to a suitable entry point. Continue to deepen the
tree until it feels well connected with entry points that entail no significant obstacles.
.
Step 7: Plan for implementation. Consider the resources required to accomplish each
intermediate objective and make them available when required. This is important to
ensure that implementation activities are performed as planned and that the desired
results are achieved. However, a transition tree is often needed to develop a detailed
action plan to determine the actions required to achieve intermediate objectives. [76]
Stellenbosch University https://scholar.sun.ac.za
Chapter 4 Theory of constraints Industrial Engineering
Page 87
4.2.5 Transition tree
The transition tree (TT) provides a final implementation plan to determine the actions
required to implement the selected improvement ideas. This is almost the same as a
project management tool that provides detail on how to move from the current state
to the desired future state. The TT is also effective when used in high risk situations
because it also applies negative branch reservation to every action, just like the FRT.
The development of a TT also provides a shared vision statement to communicate
and rationalise improvement activities. This is crucial to obtain the commitment from
people that are needed for successful implementation, but are not part of the team
that created the initiative. The procedure to construct the TT is discussed below. [78]
.
Step 1: Define the objectives; it is important to create the implementation plan with
the end in mind. This provides a shared purpose to work towards. The objectives can
be direct copies of the injections from a FRT or intermediate objectives taken from a
PRT. One objective is adequate for the TT, but it is also reasonable to have several
related objectives. Then describe and document these objectives in the present tense.
Step 2: Determine the entry points to the implementation plan. This requires that the
current environment is considered from the point where implementation is planned to
be executed. This environment is represented with current condition entities that can
be used as entry point for the execution of improvement activities. Only a few entry
points are needed at first because more will surface when the TT is further developed.
.
Step 3: Create an action (injection) in order to move towards the objective through
the achievement of intermediate objectives. Actions are entities that can be assigned
to resources that have the influence to execute them. These must be defined with
clear success criteria so that improvement activities can be monitored and evaluated.
.
Step 4: Determine connections between entities. This includes connections between
current condition entities, actions, and the objectives that are expected to result from
these actions. The current conditions and actions must be combined with sufficient
thinking to achieve logical outcomes. If an outcome is an intermediate effect it must
be combined with another action to move towards achievement of the final objective.
.
Stellenbosch University https://scholar.sun.ac.za

Chapter 4 Theory of constraints Industrial Engineering
Page 88
Step 5: Continue to build the tree until all the entities are connected and objectives
are reached. Additional intermediate effects, which represent milestones that must be
completed to achieve the objectives, can sometimes be required. These milestones
are achieved through the combination of actions with current condition entities or with
intermediate effect entities. This approach is also used with sufficient cause thinking.
.
The intermediate effect entities can be copied from the previous PRT. These entities
are necessary conditions because a PRT is used to overcome obstacles and identify
entities that do not exist in the current situation. However, these intermediate entities
are probably not sufficient on their own to achieve the milestones and objectives.
Figure 4.11: Transition tree without negative branches
Step 6: Address the undesirable conditions. This step is somewhat similar to how
negative branch reservations are approach in a FRT. The difference is that in a FRT
the negative branches start with injections and end with the desired conditions, while
a TT starts with desired conditions (objectives) and works back toward the required
injections. Actions copied from a FRT are therefore already designed to avoid UDEs.
Stellenbosch University https://scholar.sun.ac.za

Chapter 4 Theory of constraints Industrial Engineering
Page 89
Develop alternative actions for every negative branch to mitigate the UDE (reactive
approach) or to avoid the UDE (proactive approach) altogether. The detail required
for negative branch reservations depends on the level of risk involved. Execution of
the TT can continue once the objectives are achieved without the existence of UDEs.
.
Figure 4.12: Mitigation and avoidance of negative branches (Transition tree)
Step 7: Execute the improvement plan. This requires the support of management and
an empowered workforce. Review the tree to ensure that the entities are well defined
for clear communication of the implementation sequence and the desired outcomes
for each action. Then assign these actions to people that are able to influence and
implement them. The TT can then be used to track and evaluate execution progress.
Stellenbosch University https://scholar.sun.ac.za
Chapter 4 Theory of constraints Industrial Engineering
Page 90
4.3 Throughput accounting
Throughput accounting is the TOC application for a holistic accounting approach that
focuses on simplicity rather than complexity. This requires operational measures to
evaluate performance of the system as a whole. It is also used to support everyday
operations and to improve the quality of strategic decisions with regards to internal
processes. The purpose is to increase total net profit by means of improved system
throughput, but this approach challenges the principles of traditional cost accounting.
.
Traditional cost accounting is based on full absorption and it is a technical approach
designed to satisfy Generally Accepted Accounting Principles (GAAP). It focuses on
conventional measurements such as net profit, return on investment (ROI), and cash
flow. These retrospective measures do not enable effective judgment of the current
and future impact of decisions because of the way in which they are calculated. [74]
.
A problem with cost accounting is that it encourages overproduction because of its
reliance on efficiencies and pressure for higher utilisation of resources. The excess
inventory has a counterintuitive effect on income because inventory is considered an
asset. But this creates a perceived profit based on inventory that may not be sold or
become obsolete. It also ties up capital that can be used to generate actual income.
.
Another problem with cost accounting as that it puts an extreme amount of emphasis
on cost reduction activities, which can have a negative impact on capacity. This is
because almost all costs are allocated to operating expenses, which primary goal is
to enable and support the organisation to produce throughput. The result is that profit
growth is limited because improvements focus on a finite pool of expenses; rather
focus on throughput because it provides, in theory, unlimited potential for growth. [79]
4.3.1 Basic measures
Dr. Eliyahu Goldratt identified throughput, investment, and operating expense as the
three basic measures that can be applied across organisational functions to monitor
improvement efforts. These measures provide a common language that influences
the behaviour and priorities of organisational resources by rejecting the reliance on
efficiencies, which it sees as counterproductive. They also establish a connection
with traditional financial measures to support strategic and operational decisions. [80]
Stellenbosch University https://scholar.sun.ac.za

Chapter 4 Theory of constraints Industrial Engineering
Page 91
Throughput is the rate at which the system generates money through sales; this can
also be expressed as the value that the system adds to the products or services that
customers demand and purchase. Throughput is calculated as the sales, less the
total variable cost in a given time period. This cost includes material cost and direct
expenses such as commissions, customs duties, and external logistic services. [74]
.
This measure is characterised by both magnitude and speed. That means it focuses
both on the difference between sales price and total variable cost, and also the time
between process expenditures and income received. Improvement with regards to
any of these characteristics has a positive and direct influence on ROI and cash flow.
.
It is crucial to understand how throughput accounting categorises labour and finished
goods inventory. First, labour is not considered a variable cost unless it completely
depends on the amount of output produced, because organisations do not regularly
adjust the workforce every time demand fluctuates. Second, finished goods inventory
is not considered throughput because it has not yet generated money through sales.
.
Figure 4.13: Throughput accounting: Basic measures
Stellenbosch University https://scholar.sun.ac.za
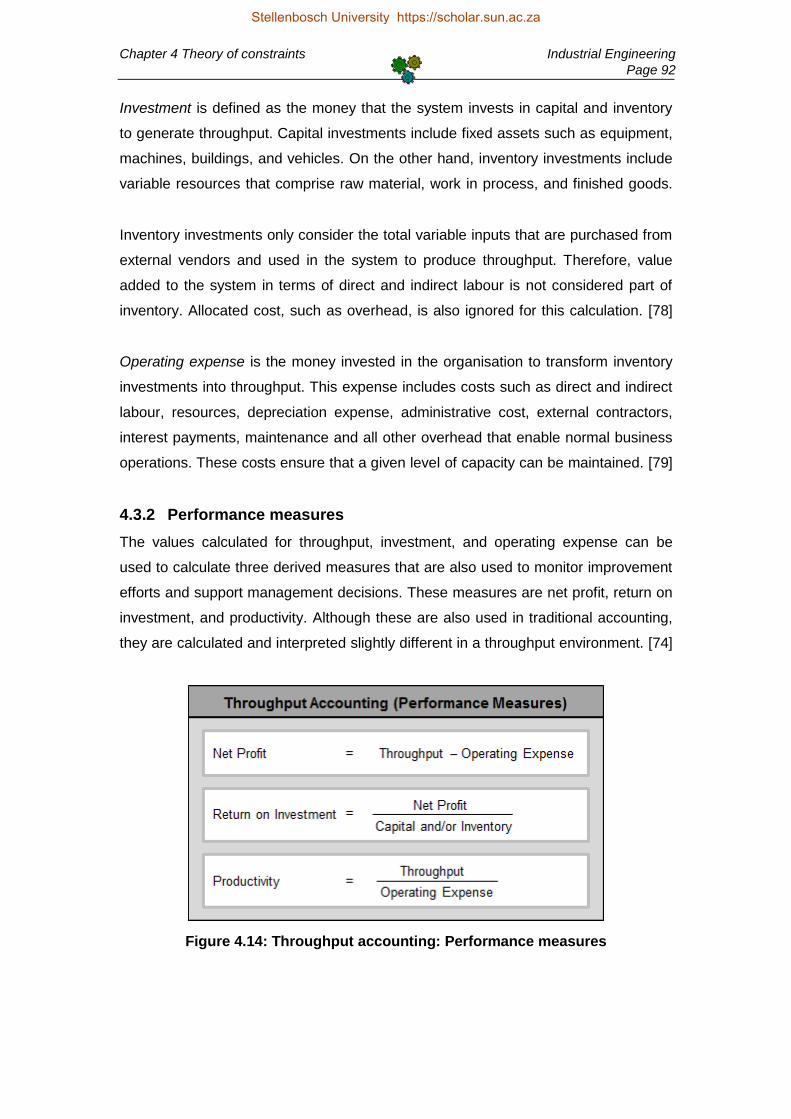
Chapter 4 Theory of constraints Industrial Engineering
Page 92
Investment is defined as the money that the system invests in capital and inventory
to generate throughput. Capital investments include fixed assets such as equipment,
machines, buildings, and vehicles. On the other hand, inventory investments include
variable resources that comprise raw material, work in process, and finished goods.
.
Inventory investments only consider the total variable inputs that are purchased from
external vendors and used in the system to produce throughput. Therefore, value
added to the system in terms of direct and indirect labour is not considered part of
inventory. Allocated cost, such as overhead, is also ignored for this calculation. [78]
.
Operating expense is the money invested in the organisation to transform inventory
investments into throughput. This expense includes costs such as direct and indirect
labour, resources, depreciation expense, administrative cost, external contractors,
interest payments, maintenance and all other overhead that enable normal business
operations. These costs ensure that a given level of capacity can be maintained. [79]
4.3.2 Performance measures
The values calculated for throughput, investment, and operating expense can be
used to calculate three derived measures that are also used to monitor improvement
efforts and support management decisions. These measures are net profit, return on
investment, and productivity. Although these are also used in traditional accounting,
they are calculated and interpreted slightly different in a throughput environment. [74]
.
Figure 4.14: Throughput accounting: Performance measures
Stellenbosch University https://scholar.sun.ac.za

Chapter 4 Theory of constraints Industrial Engineering
Page 93
Net profit is throughput generated less operating expense, for a specified period of
time. Traditional cost accounting aims to improve net profit by cost reduction, from a
finite pool of operating expense, which limits the potential amount of profit growth and
this can also leads to capacity cutbacks. However, throughput accounting focuses on
actions to increase throughput, which has theoretical potential for infinite growth. [80]
.
Return on investment provides information about investments and their overall effect
on throughput. These can be expressed in terms of capital or inventory. Capital ROI
is uncommon because of the assumption that the system already has an excess
level of capacity, with the exception of the constraint. Therefore, inventory ROI is
more often used to support decisions, such as investment for constraint elevation.
ROI is calculated as net profit over investment. As mentioned before, the calculation
is most often done with inventory investment instead of capital investment, because
the focus must be on reduction of variable resources, not fixed assets. However, it is
crucial to avoid resource reductions that have a negative impact on throughput. [79]
.
Productivity is a measure of how efficient the process is through the comparison of
value added cost with operating expense; it is calculated as generated throughput
over operating expense, for a specified period of time. This is used to determine how
changes in operating expense may impact overall throughput. Productivity can also
be shared with employees, because it does not disclose sensitive information, to act
as a motivational driver that displays the operational performance of the system. [52]
..
4.3.3 Throughput accounting reconciliation
Throughput accounting can be reconciled with GAAP so that they can both co-exist
without the need to maintain two sets of books. The reconciliation procedure provides
the benefit of an internal format for standardised reports that complies with internal
measurement information that is used to make strategic and operational decisions.
The differences between throughput accounting and GAAP must first be understood
for successful reconciliation of these approaches. Although both approaches use the
same measures they are calculated in a different manner and presented in a different
format. The important difference is the distinct allocation of overhead and labour. [74]
Stellenbosch University https://scholar.sun.ac.za

Chapter 4 Theory of constraints Industrial Engineering
Page 94
Overhead are assigned to inventory when GAAP is preferred, and it is expensed as
cost of sales in the period that the inventory is sold. However, throughput accounting
states that overhead represents the cost of process capacity within a certain period
of time, and therefore expenses the total system overhead in that specified period.
Direct labour is considered to be a traditional variable expense because of its direct
relation to production volumes. Its cost is therefore assigned to inventory if GAAP is
preferred. However, throughput accounting expenses directs labour in the current
period, unless it is based on piece rate or commission. Direct labour cost is therefore
defined to be in line with the type of remuneration and the production environment.
The allocation of overhead and direct labour to inventory with GAAP means that it
can be stored as an asset across multiple accounting periods until it is charged as
cost of sales when the inventory is sold. This provides a flawed performance reward
system that encourages overproduction to shift some of these expenses from the
current period’s income statement and store it on the balance sheet as inventory. [79]
Throughput accounting follows a simple approach and only assigns material that was
consumed within production to inventory because it is recognised as the only variable
cost involved. Furthermore, it avoids performance reward systems that encourage
overproduction. This is important because excess inventory is considered a liability.
The reconciliation approach consists of two steps to convert GAAP to throughput
accounting. The first step is the adjustment of inventory levels, and the second step
is the adjustment of the format. These reconciliation steps are discussed below. [74]
.
Step 1: Make adjustments to changes in inventory levels. The net income figure of
these accounting approaches will be different when inventory levels changes within
the specified period used for reports. This is because operating expenses in GAAP
are either stored in or released from the inventory value listed on the balance sheet;
however, throughput accounting records operating expenses in the current period.
If there is no volume change between the beginning and ending inventories, and the
corresponding overhead and direct labour rates are identical, then both approaches
will result in the same net value. This is because there is no reassignment of costs if
the organisation sells everything that was produced within the reported financial period.
Stellenbosch University https://scholar.sun.ac.za

Chapter 4 Theory of constraints Industrial Engineering
Page 95
Table 4.3: Throughput accounting inventory adjustment
Inventory Adjustment
Beginning Inventory Units 11 400
Overhead Rate R 5.50
Labour Rate R 4.30
Beginning Inventory R 111 720 (Overhead + Labour) x Inventory Units
Ending Inventory Units 22 400
Overhead Rate R 5.10
Labour Rate R 3.85
Ending Inventory R 200 480 (Overhead + Labour) x Inventory Units
Change in Inventory R 88 760 Ending Overhead – Beginning Overhead
Table 4.3 shows how to calculate and adjust the changes in inventory levels. This
procedure identifies the net change in inventory to remove overhead and labour that
is stored as assets. Note that the respective rates are calculated as overhead and
direct labour costs divided by the total amount of units produced. Table 4.3 also shows
that higher production levels (inventory) can lead to lower overhead and labour rates.
Step 2: Make adjustments to the format. The layout of a GAAP statement specifies
that overhead and direct labour is recorded together with direct material as cost of
goods sold, which is then used to calculate the gross margin. Throughput accounting
calculates throughput contribution instead of a gross margin because it assumes that
the material consumed in production is the only variable expense and should be the
sole contributor to cost of goods sold. The contribution to sales is therefore higher.
.
Furthermore, a GAAP income statement shows a breakdown of operating expenses
with various expense categories such as wages, supplies, and utilities. Throughput
accounting groups these expenses, including overhead and direct labour, into one
category. This category can then be expanded into various levels if a more detailed
overview of the expenditures is needed for further analysis of the income statement.
The example in Table 4.4 shows how to implement these two reconciliation steps as
explained above. The inventory adjustment value is copied from Table 4.3, and the
other values are fabricated for explanatory purposes. The purpose is to show that it is
possible for GAAP to abuse overproduction (excess inventory) to cover a throughput
loss because some of the current operating expenses are recorded as inventory. [79]
Stellenbosch University https://scholar.sun.ac.za

Chapter 4 Theory of constraints Industrial Engineering
Page 96
Table 4.4: Throughput accounting format adjustment
Format
Adjustment
Cost
Accounting
Step 1: Step 2: Throughput
Accounting Format Inventory
Revenue R 1 725 000 R 1 725 000
Cost of goods sold: R -
Material R 485 00 R 485 000
Direct Labour R 295 000 R -295 000 R -
Overhead R 320 000 R -320 000 R -
Total cost of goods R 1 100 000 R 485 000
Gross margin R 625 000
Throughput contribution R 1 240 000
% to Sales 36% 72%
Operating expenses R 540 000 R 615 000 R 88 760 R 1 243 760
Net profit R 85 000 R -3 760
Also look at the difference between gross margin and throughput contribution. The
reason is that throughput accounting considers the system as a whole, while GAAP
allocates costs to specific products. Throughput accounting almost ignores gross
margin analysis at product level, and is therefore a popular approach for the evaluation
and prioritisation of improvement activities that can affect the entire organisation. [74]
Stellenbosch University https://scholar.sun.ac.za
Chapter 5 Six sigma thinking Industrial Engineering
Page 97
5. Six Sigma Thinking
Six sigma is a quality orientated continuous improvement methodology that strives to
reduce variation and improve process performance. It follows a team based problem
solving approach to guide process improvement activities through the identification
and elimination of root problems. This methodology is supported by various basic
process improvement techniques as well as rigorous statistical tools, which require a
skilled workforce that is arranged in a strict hierarchical management structure. [81]
.
History of six sigma
Quality as a concept continues to evolve. In the past, quality was simply defined as
conformance to valid customer requirements. This is known as the goalpost view of
quality and states that output is considered good as long as it falls within acceptable
limits, called specification limits, around a desired value, called the nominal value or
target value. But the definition of quality changed as the concept was further refined.
.
Another, more recent definition known as the Taguchi loss function view of quality
states that quality is a predictable degree of uniformity and dependability, at low cost
and suited to the market. This definition also states that losses accrue as soon as a
quality characteristic of a product or service deviates from the nominal value. The
Taguchi loss function, called the loss curve, expresses these deviation losses in a
measurable format for analysis. Further development of this quality concept, together
with Deming’s theory of management, established the foundation for six sigma. [82]
Six sigma was conceptualised by Bill Smith, an engineer at Motorola, in 1986 as an
organisational wide improvement strategy. It was further popularised when General
Electric adopted it in 1995 with great success under the leadership of their former
CEO, Jack Welsh. Both these companies played a major role in the development of
six sigma from a metric to a methodology, and finally to a management system. [12]
The six sigma metric is designed to measure process variation and create processes
that strive to produce no more than 3.4 defects per million opportunities. This quantity
is calculated from a 6-sigma process, based on the assumption that the mean value
from a stable and normal distribution of output can shift by as much as 1.5 standard
deviations over time. The correctness of this assumption is often questioned by some
statisticians, but it is generally accepted in the industry as a reliable quality measure.
Stellenbosch University https://scholar.sun.ac.za

Chapter 5 Six sigma thinking Industrial Engineering
Page 98
The six sigma methodology builds on the six sigma metric. It is designed to make
statistical process control a real-time operational application that allows for proactive
improvement efforts. The introduction of the rigorous project-oriented DMAIC (Define,
Measure, Analyse, Improve, and Control) cycle also makes six sigma a powerful
team based problem solving and improvement methodology. This model provides a
systematic analysis approach that aims to improve and control process performance.
The six sigma management system is more than just a methodology that focuses on
data analysis to understand and minimise process variation with a set of optimisation
and statistical improvement tools. It is also a practical system with a detailed focus on
the identification and appreciation of customer requirements that align key processes
to achieve of those requirements. Furthermore, the management system is required
to drive rapid and sustainable continuous improvement throughout the organisation.
Focus of this chapter
The execution of six sigma relies on a technical approach that is governed by a
management system. The bulk of this chapter focuses on this technical approach in
terms of the DMAIC cycle. This chapter is then completed with a discussion on the
system of profound knowledge, which is a management theory. However, the rigid
hierarchical management structure is not discussed because it is not applicable in
context of this project, which only focuses on improvements in small organisations.
Figure 5.1: The six sigma DMAIC cycle
Stellenbosch University https://scholar.sun.ac.za

Chapter 5 Six sigma thinking Industrial Engineering
Page 99
The DMAIC cycle provides the main structure for the technical approach; this project
orientated problem solving approach is designed to improve current processes, and
is supported by the application of several process tools. These tools can be divided
into two main groups: statistical analysis tools and process optimisation tools. Both
these tool sets are important for the successful execution of six sigma activities. [12]
.
Statistical analysis tools drive most of the analytical activities with data collected from
process output, simulation, or experiment. These tools include basic statistics as well
as advanced tools. The objectives of this report make it clear that it does not make
sense to discuss some of the advanced statistical tools such as analysis of variance
(ANOVA), regression, and design of experiments (DOE). The focus is therefore on
basic statistics that are sufficient for successful implementation of analytical activities.
Process optimisation tools are the core drivers for process optimisation, design, and
definition of operations. These tools are the main focus of this chapter because of
their relative ease of implementation, which provide a foundation for analysis and
improvement activities. They also promote process thinking and team based problem
solving to identify key problems. These tools are discussed together with some basic
statistical tools in context of the DMAIC cycle for successful improvement execution.
.
The final section of this chapter discusses the management theory, which focuses on
the management of people through leadership, education and empowerment. This
system strives to develop a culture of sustainable improvement. The emphasis on a
strong management system with basic tools may be an unconventional approach
toward six sigma, but this is crucial to ensure that the methodology, in the hands of
the novice, is an exercise in problem solving, instead of an exercise in statistics. [15]
5.1 Define
The purpose of the define phase is to direct efforts toward a sensible improvement
opportunity. This includes the rationale for improvement, an improvement plan, full
comprehension of the relationships within the process, and an analysis to determine
the customer requirements that are important to the process. These are discussed in
terms of three main deliverables that comprise the define phase: (1) project charter,
(2) SIPOC analysis, and (3) a voice of the customer to critical to quality analysis. [83]
Stellenbosch University https://scholar.sun.ac.za
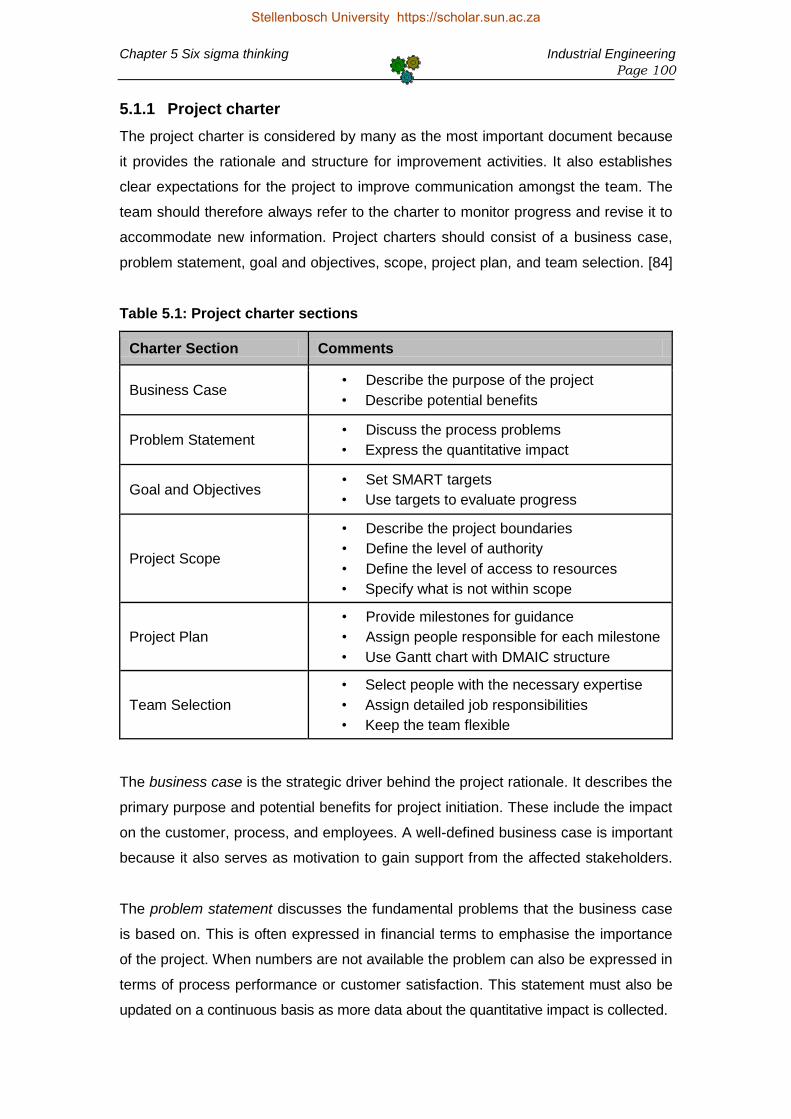
Chapter 5 Six sigma thinking Industrial Engineering
Page 100
5.1.1 Project charter
The project charter is considered by many as the most important document because
it provides the rationale and structure for improvement activities. It also establishes
clear expectations for the project to improve communication amongst the team. The
team should therefore always refer to the charter to monitor progress and revise it to
accommodate new information. Project charters should consist of a business case,
problem statement, goal and objectives, scope, project plan, and team selection. [84]
Table 5.1: Project charter sections
Charter Section Comments
Business Case • Describe the purpose of the project
• Describe potential benefits
Problem Statement • Discuss the process problems
• Express the quantitative impact
Goal and Objectives • Set SMART targets
• Use targets to evaluate progress
Project Scope
• Describe the project boundaries
• Define the level of authority
• Define the level of access to resources
• Specify what is not within scope
Project Plan
• Provide milestones for guidance
• Assign people responsible for each milestone
• Use Gantt chart with DMAIC structure
Team Selection
• Select people with the necessary expertise
• Assign detailed job responsibilities
• Keep the team flexible
The business case is the strategic driver behind the project rationale. It describes the
primary purpose and potential benefits for project initiation. These include the impact
on the customer, process, and employees. A well-defined business case is important
because it also serves as motivation to gain support from the affected stakeholders.
The problem statement discusses the fundamental problems that the business case
is based on. This is often expressed in financial terms to emphasise the importance
of the project. When numbers are not available the problem can also be expressed in
terms of process performance or customer satisfaction. This statement must also be
updated on a continuous basis as more data about the quantitative impact is collected.
Stellenbosch University https://scholar.sun.ac.za

Chapter 5 Six sigma thinking Industrial Engineering
Page 101
The goal and objectives statement must contain specific measures with target values
to drive improvement efforts. These must describe a successful project outcome so
that the team can evaluate the progress of improvement activities and know when
the goal has been accomplished. A general guideline for an effective goal statement
is to set targets that are specific, measurable, achievable, relevant, and time bound.
The scope describes the boundaries of the project and specifies the start and end
steps of the process under consideration. This ensures that the boundaries of the
project do not change so that the focus of the improvement team is maintained on
the right priorities. The scope must also define the level of authority that allows the
team to make decision as well as their level of access to resources. The final part,
which people often omit, is to determine what components are not within the scope.
.
The project plan is an operational document that provides the team with intermediate
milestones to complete. These milestones guide the team through the project steps
and enable them to track their progress. This can contain a Gantt chart to visualise
each milestone with the people responsible for their completion. The phases of the
DMAIC model are often used to provide a structure for more detailed milestones. [14]
Tasks Coordinator Week
1 2 3 4 5 6 7 8 9 10 11 12 13 14
Define
Task 1 Matt
Measure
Task 2 Paul
Task 3 Paul
Analyse
Task 4 John
Task 5 Matt
Improve
Task 6 Frank
Task 7 John
Control
Task 8 Matt
Figure 5.2: Gantt chart
The last section, team selection, assigns detailed responsibilities to team members. It
is important to determine the skill requirements of the project to select team members
with the necessary expertise to fulfil those requirements. This ensures an efficient
and effective team with the right people doing the right things. The team must also be
flexible because the composition can change as the project charter is further refined.
Stellenbosch University https://scholar.sun.ac.za

Chapter 5 Six sigma thinking Industrial Engineering
Page 102
5.1.2 SIPOC
The SIPOC (Suppliers, Inputs, Process, Outputs, and Customers) analysis is a high
level process map that represents the essential elements of the studied process. This
provides a basic process description, which allows team members to quickly develop
a mutual appreciation of the process before improvement activities are initiated. [85]
The team can start the analysis at the end, with the customer, and work towards the
suppliers. A team based approach is recommended to encourage rapid development
and a more accurate analysis of the studied process. At this moment the start and
end points of the process must be described as part of the scope in the project charter.
.
Process Name:
Supplier Input Process Output Customer
Who are the suppliers?
What do they supply?
High level process steps
What is provided by the process?
Who are the customers?
1.
2.
3.
Figure 5.3: SIPOC analysis
The customers are target entities that the process intends to satisfy. These include
internal and external people, companies, systems, or downstream operations that
receive output from any point in the process. The improvement team should focus on
the satisfaction of customers that bring in the most value for the system as a whole.
.
The outputs are the products or services produced by the process and required by
the customers. These can include outputs and requirements in terms of time, cost,
quality, and safety. It is recommended to limit the list to three or four main outputs to
keep the analysis simple, despite the fact the process may produce a larger variety.
The process is a high level map of operations and procedures that are required to
transform the inputs into outputs. Decompose the process into four to seven of the
most important steps between clear start and end points as specified in the project
charter scope. This ensures that the team does not get caught up in too much detail.
Stellenbosch University https://scholar.sun.ac.za

Chapter 5 Six sigma thinking Industrial Engineering
Page 103
The inputs are the resources required for an effective process. These include human
resources, information, capital, equipment and other resources that are consumed or
transformed in the process. It is suggested to limit the list to three or four main inputs.
.
The suppliers provide the inputs identified in the previous step. Suppliers include
internal and external people, companies, systems, upstream processes, and other
sources that are responsible for process inputs. The improvement team should focus
on the satisfaction of suppliers that bring in the most value for the system as a whole.
The completed SIPOC analysis is the foundation for high level process definition and
identification of process measures. This can also be used for the selection of a focus
area for improvement activities. However, because this is only a high level analysis a
more detailed map is probably required to find significant improvement opportunities.
.
5.1.3 VOC to CTQ analysis
The VOC (voice of the customer) to CTQ (critical to quality) analysis is an important
technique to define a process, and is used to develop an appreciation of significant
quality characteristics, which supports the identification and selection of improvement
opportunities. This three step technique includes evaluation of customer perceived
quality requirements, identification of primary requirements with the Kano model, and
the translation of the requirements into process attributes that are critical to quality.
Step 1: Voice of the customer
The purpose of a VOC analysis is to identify the main drivers of customer satisfaction
and ensure that the studied process is aligned with these drivers. This analysis uses
feedback from the customers identified in the SIPOC analysis to determine drivers in
terms of cost, time, quality, safety, and other requirements that they may have. The
problem is that customers express their requirements in a colloquial and imprecise
manner, so it is important to use a structured approach to analyse their feedback. [12]
Information for the VOC analysis is collected from two types of sources: reactive and
proactive. Reactive sources are information that is already available and just require
some evaluation. These include customer complaints, sales information, technical
support, warranty claims, and returns. On the other hand, proactive sources provide
additional information from interviews, surveys, market research, and observations.
.
Stellenbosch University https://scholar.sun.ac.za

Chapter 5 Six sigma thinking Industrial Engineering
Page 104
Process Name:
VOC Customer Information Source Driver
What did the customers say?
Who are the customers?
How was the information collected
What are the drivers critical to?
1.
2.
3.
Figure 5.4: VOC analysis
Once the VOC analysis is completed the data needs to be analysed. The next step
discusses how to utilise the Kano model for identification of the significant customer
requirements. These must then be transformed into critical to quality characteristics.
Step 2: Kano model
The Kano model, developed by Noriaki Kano, is used to analyse and organise the
VOC data, which was collected in the previous step, to estimate their effect on the
different levels of customer requirements and satisfaction. Kano suggested that the
levels of customer requirements are specifications, expectations, and delighters. [86]
Specifications include technical requirements and information that are requested
explicitly by the customer. This information provides a direct reflection of what the
customer perceives as core performance of the product or service. Specification
requirements are therefore proportional to customer satisfaction. This means that
higher fulfilment of the specification will result in higher satisfaction of the customer.
Expectations are basic requirements that are fundamental to customer satisfaction
even though customers do not explicitly mention this information. This is because
expectation requirements are considered obvious and inherent to performance
requests. The fulfilment of expectations will therefore not result in added satisfaction;
however, unfulfilled expectations will lead to a high level of customer dissatisfaction.
Delighters are unspecified characteristics that differentiate between performance to
give a product or service a potential competitive advantage. Their absence cannot
cause customer dissatisfaction because customers don’t anticipate them. But their
presence cause satisfaction to increase faster than the rate of expectation fulfilment.
Stellenbosch University https://scholar.sun.ac.za
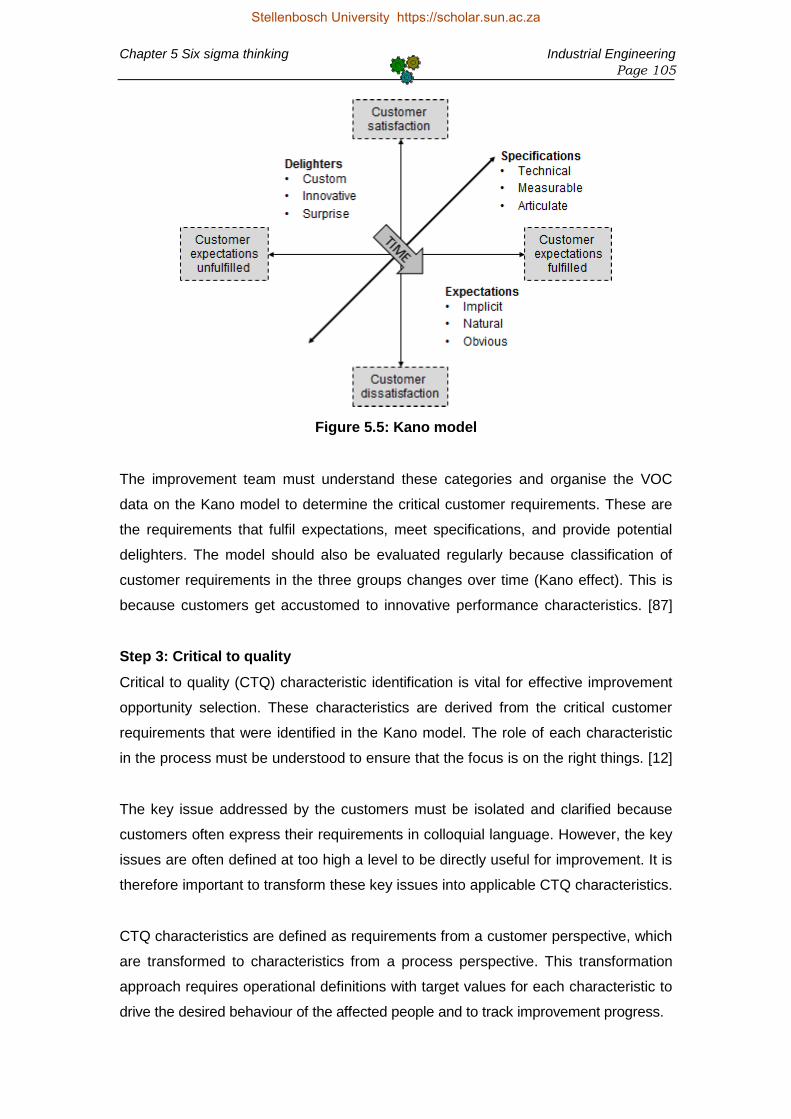
Chapter 5 Six sigma thinking Industrial Engineering
Page 105
Figure 5.5: Kano model
The improvement team must understand these categories and organise the VOC
data on the Kano model to determine the critical customer requirements. These are
the requirements that fulfil expectations, meet specifications, and provide potential
delighters. The model should also be evaluated regularly because classification of
customer requirements in the three groups changes over time (Kano effect). This is
because customers get accustomed to innovative performance characteristics. [87]
Step 3: Critical to quality
Critical to quality (CTQ) characteristic identification is vital for effective improvement
opportunity selection. These characteristics are derived from the critical customer
requirements that were identified in the Kano model. The role of each characteristic
in the process must be understood to ensure that the focus is on the right things. [12]
.
The key issue addressed by the customers must be isolated and clarified because
customers often express their requirements in colloquial language. However, the key
issues are often defined at too high a level to be directly useful for improvement. It is
therefore important to transform these key issues into applicable CTQ characteristics.
.
CTQ characteristics are defined as requirements from a customer perspective, which
are transformed to characteristics from a process perspective. This transformation
approach requires operational definitions with target values for each characteristic to
drive the desired behaviour of the affected people and to track improvement progress.
Stellenbosch University https://scholar.sun.ac.za

Chapter 5 Six sigma thinking Industrial Engineering
Page 106
Process Name:
Continue from VOC analysis
…
Key Issue CTQ Characteristic Target value
What are the key issues?
What are the requirements, in a measurable form?
What are the target values in standard units?
Figure 5.6: CTQ analysis
The VOC to CTQ analysis is completed once the CTQ characteristics are identified
and defined. The team can use these characteristics to select focused improvement
opportunities that will have a significant and positive impact on customer satisfaction.
5.2 Measure
The purpose of the measure phase is to collect and validate measures that represent
the improvement area. This includes a data collection plan, selection of measures,
validation of the measurement system, and the establishment of a baseline. Data
collection is discussed in the PDCA cycle; therefore, only three of these deliverables
are discussed in this section for successful completion of this phase: (1) cause and
effect matrix, (2) measurement system analysis, and (3) performance baseline. [83]
.
5.2.1 Cause and effect matrix
The cause and effect matrix uses the CTQ characteristics, which was identified in the
previous step, to determine the key input measures that influence the process. This
information is crucial to ensure that the team focus on the significant improvement
opportunities that affect the process as a whole. Once these are identified the team
can establish a performance baseline to track and control improvement activities. [12]
The cause and effect matrix is often required when the process has multiple CTQ
characteristics. All the significant input characteristics can then be identified though
their correlation with weighted CTQ characteristics. This process is discusses below.
Step 1: List the CTQ characteristics at the top of the matrix. Use a scale from 1 to 10
to assign a weight for each characteristic in terms of their relative importance to the
final customer. Let 1 indicates the least critical and 10 the most critical characteristics.
Stellenbosch University https://scholar.sun.ac.za

Chapter 5 Six sigma thinking Industrial Engineering
Page 107
Process Name: Bread production line
CTQ characteristics
Cycle Time Cost Sigma Level
Weight 8 10 6
Input characteristics
Correlation of input to CTQ characteristics Total
Vendor 3 3 1 60
Flour Grade 0 9 9 144
Oven Temperature 9 3 9 156
SCALE: 0 = None 1 = Weak 3 = Moderate 9 Strong
Figure 5.7: Cause and effect matrix
Step 2: List in the first column all input characteristics that may affect any of the CTQ
characteristics. Rate the degree to which the input characteristics are correlated to
each CTQ characteristic. Use a scale where 0 indicates no correlation, 3 indicates
weak correlation, 6 indicates moderate correlation, and 9 indicates strong correlation.
Step 3: Multiply each correlation value with the weight and sum across each row to
determine the relative importance of each input characteristic. The inputs with the
highest total scores must be measured together with the CTQ characteristics. These
significant inputs and CTQ characteristics are the critical process characteristics.
5.2.2 Measurement system analysis
Measurement system analysis (MSA) is crucial to ensure that data driven decisions
are based on valid data, even though this is often neglected by inexperienced six
sigma practitioners because they do not realise that the measurement system is also
subjected to variation as any other process; MSA also requires statistical knowledge
that can discourage novice practitioners. However, it is important to understand the
philosophy behind MSA because of its relevance to various project applications. [88]
The measurement system is a process with specific inputs that are transformed to
produce an output in the form of a measurement. It is therefore normal to assume
that the measurement system can produce some variation that influences the validity
of measurements. The source of this variation can be traced back to various system
factors; these can include stability, bias, linearity, discrimination, and precision. [89]
Stellenbosch University https://scholar.sun.ac.za

Chapter 5 Six sigma thinking Industrial Engineering
Page 108
Stability is the capability of a measure to maintain a constant distribution over time
with a given measurement approach. Measurement data can be plotted on a time
based chart to visually represent any deviation. The difference between the mean
values of the measurement series are used to calculate the stability. Deviation can
result from various environmental effects and changes in the measurement system.
.
Bias is the difference between the average of the measurement data and the actual
reference value. The reference value is an industry based standard that provides an
undisputed target for a specific measure. Several measurements must be made to
make a valid conclusion about the bias. The objective is to reach the reference value.
Linearity describes how reliable the measurement approach is over a diverse range
of measurement types. A particular approach may not be suitable for measures with
different characteristics because tool calibration is based on the assumption that the
same conditions prevail. The change in deviation from the mean values calculated
from the actual measures of the measurement range is used to determine linearity.
.
Discrimination is the capability of the measurement system to adapt to small changes
in a measurement characteristic. The problem is that even these small changes can
affect the credibility of the measurement system. Therefore, if the system is not able
to adapt appropriately to these changes, errors in the process will be difficult to find.
.
Precision is crucial to MSA because of its high contribution to the standard deviation
of the measurement system. It is therefore common to assign considerable statistical
effort to determine its significance in terms of system repeatability and reproducibility.
Repeatability variation is a result of the gauge itself. The problem occurs when an
operator measures a characteristic multiple times with the same gauge and obtains
different results in fixed conditions. This variation can be reduced or eliminated with
gauge modifications; otherwise a new gauge must be used for future measurements.
Reproducibility variation is a result of differences between operators and inconsistent
measurement procedures. The problem occurs when multiple operators measure a
characteristic multiple times with the same gauge and obtain different results. One
solution is to train operators to use operational definitions and standardised methods.
Stellenbosch University https://scholar.sun.ac.za

Chapter 5 Six sigma thinking Industrial Engineering
Page 109
Repeatability and reproducibility studies are most reliable when conducted as blind
studies where a sample of representative characteristics is measured two or three
times by two or three independent operators; then analyse the data to validate the
consistency and accuracy of the measured outcomes. Computer software is often
used to deal with this complicated statistical analysis and quantify the variation. [12]
5.2.3 Performance baseline
The final deliverable for the measure phase is to create a performance baseline for
the critical process characteristics as soon as the measurement system is verified as
consistent and accurate; a baseline represents the initial performance of a process
characteristic and also serves as a reference point to track improvement efforts. [90]
.
There are several measures that can be used as a baseline for the critical process
characteristics. These measures include defect rate, process yield, and capability
indices. Capability indices use relatively complex measures based on the assumption
of normality and is limited to stable processes. It is therefore not discussed in this
report because it may lead to a great deal of confusion for novice practitioners. [15]
Measure 1: Process defect rate
A unit (product or service) that does not perform within specification is considered a
defective. This means that it produced a nonconformance, known as a defect, on one
of its fundamental characteristics; each of these characteristics provides a defect
opportunity. Defect rate is most often measured in terms of defects per unit (DPU),
defects per opportunity (DPO), and defects per million opportunities (DPMO). [12]
Defects per unit: Defects per million opportunities:
=
Total number of defects = Defects per opportunity x 1 000 000
Number of units Sigma Level DPMO (shift = 1.5)
6.0 3.40
5.0 233
Defects per opportunity: 4.0 6 210
= Total number of defects 3.0 66 807
Total number of defect opportunities 2.0 308 538
1.0 691 462
Figure 5.8: Process defect rate measures
Stellenbosch University https://scholar.sun.ac.za

Chapter 5 Six sigma thinking Industrial Engineering
Page 110
DPU refers to the average number of defects per unit. However, this value does not
provide a fair comparison between units with different levels of complexity because
the opportunity for defects is larger in complex units. It is therefore recommended to
determine the defects per opportunity to create a comparable performance baseline.
DPO refers to the total number of defects in proportion to the total number of defect
opportunities. This allows the measure to consider the complexity of a unit. However,
the value of DPO can become very small when calculations are done on complex
units with thousands of defect opportunities. Therefore, rather multiply this value with
one million and use DPMO as the baseline. Notice that DPMO is also the benchmark
rate that is used to describe the sigma level of a process as shown in Figure 5.8. [15]
Measure 2: Process yield
The complementary measure of defect rate is process yield, which is defined as the
proportion of units that perform within specification. Measures derived from yield are
also appropriate to describe process capability. Three types of yield can be used to
create a baseline: (1) final yield, (2) first pass yield, and (3) rolled throughput yield. [91]
Final yield is the ratio of the total number of defect free units that a process delivers
over the number of units that entered the system. The problem is that this traditional
method to calculate yield does not consider the resources used for rework, which
cause hidden factories to originate. A hidden factory is an extension of the process
that is caused when the process does not run within specification limits the first time.
.
Figure 5.9: Process yield measures
Stellenbosch University https://scholar.sun.ac.za

Chapter 5 Six sigma thinking Industrial Engineering
Page 111
First pass yield (FPY) is a unit based measure that indicates the percentage of defect
free units that passed through a process the first time without rework. The problem
with FPY is its complete dependence on the distribution of defects. For example,
suppose 100 units enter a process and 10 defects are produced. Now consider a
scenario where all 10 defects occurred in one unit and another scenario where the 10
defects occurred in 10 different units, which give a respective FPY of 99% and 90%.
.
Throughput yield is a defect based measure that differs from FPY in two fundamental
criteria. First, it refers to the number of defects produced, rather than the number of
defective units. Second, it is used to predict future yield based on the assumption
that defects are produced according to a Poisson distribution. These criteria ensure
that throughput yield gives the same value regardless of where the defects occurred;
so it is a more consistent measure, than unit based yield, of the process as a whole.
5.3 Analyse
The purpose of the analyse phase is to convert the raw data collected in the previous
phase into information that provides insight into the process. This includes the use of
graphical tools to interpret and communicate the data. Some analysis tools such as
cause and effect diagrams, histograms, and run charts are discussed in the PDCA
cycle. Only Pareto analysis and scatter plots are therefore discussed in this section
to respectively identify root causes and evaluate correlation between measures. [12]
5.3.1 Pareto analysis
Pareto analysis, developed by Vilfredo Pareto, is an analytical tool that is used for
identification and prioritisation of events. This is based on the assumption that 20
percent of events have 80 of the impact. The 20 percent is known as the vital few
and the remainder as the trivial many. The vital few represent the most important
events and should therefore be the main focus of future improvement activities. [92]
The analysis includes the construction of a column chart that is used to organise data
in descending order of importance. Each column signifies the occurrence frequency
of an event from a variety of qualitative categories such as type of defect, customer
needs, skills required, and investment opportunities. This diverse range of application
makes it more than just a problem solving tool, but also a respectable prioritisation
tool. The next five steps provide a basic approach to construct a Pareto diagram. [15]
Stellenbosch University https://scholar.sun.ac.za

Chapter 5 Six sigma thinking Industrial Engineering
Page 112
Step 1: Identify the possible opportunities (or problems) for a particular process with
the help of idea generation techniques. Collect data for each event in accordance to
specified operational definitions and decide whether cost or number of occurrence is
more important. The order of priority can be different between a cost and a frequency
chart when there is a high variation in cost of events. Also remember that the cost
Pareto chart does not consider invisible cost such as the cost of an unhappy customer.
Step 2: Construct a frequency table for the event count. Multiply each value with the
cost related to each event if the cost approach is preferred. Several small data sets
that accumulated to less than 50 percent of the total can be grouped together into an
“other” category. Sort the opportunities in descending order of importance, and then
add a column that shows the cumulative percentage of each value from top to bottom.
.
Step 3: Prepare the chart. Label the left axis with equal intervals from 0 to a number
equal to or larger than the total cost or counts. Provide a short caption to describe the
unit of measurement. Label the horizontal axis with the event categories from largest
to smallest. Then label the right axis from 0 to 100% and line up the 100% with the
total on the left axis to synchronise the cumulative percentage with the total cost or
total count. Chart preparation is then completed with the addition of a title and a date.
Figure 5.10: Pareto analysis
Stellenbosch University https://scholar.sun.ac.za
Chapter 5 Six sigma thinking Industrial Engineering
Page 113
Step 4: Use columns to plot the data in descending order from left to right. The height
of each column must be equal to the total cost or count of the specific category. Plot
a cumulative percentage line from the centre of the first column where the count
corresponds with the cumulative count axis on the right and continue to the centre of
the second column so that it also corresponds with the cumulative axis. Repeat until
the line reaches the final column to indicate the cumulative frequency of 100 percent.
.
Step 5: Analyse the completed Pareto chart. Look for a sudden decline in the slope
of the cumulative line. This represents the break point that separates the significant
few from the trivial many. If the columns are almost the same height the cumulative
line will be flat and the Pareto principle does not hold. When this happens it is crucial
to categorise the events in a different manner to find other significant opportunities.
Once these steps are completed the improvement team can focus their efforts on the
significant opportunities. Successful exploitation of these opportunities can lead to a
change in their prioritisation. This enforces continuous improvement because all the
exploited opportunities are replaced with the next most significant opportunities. The
Pareto chart is also used to track efforts and see whether the expected results are
achieved in terms of how opportunities are prioritised when the chart is revised. [12]
.
5.3.2 Scatter plot
A scatter plot is a graphical tool used to determine a possible relationship between
two characteristics. The quantification of this relation is known as correlation. This
information is important to understand the effect that the input characteristics can
have on the outcome characteristics. Significant characteristics can be extracted
from the cause and effect matrix. Note that these characteristics must be captured at
the same time to provide unbiased data that is relevant for time based analyses. [93]
.
Once the input and output data is collected the scatter plot can be constructed. First
label two axes with the two respective characteristics. Then pair the simultaneous
measured values for the two characteristics together to form x-y points. Plot these
points on the two axis plot. Although scatter plots is mostly used for two continuous
characteristics, it can also be used when one of the characteristic are measured in
discrete values. Figure 5.11 shows different types of continuous data correlation. [90]
Stellenbosch University https://scholar.sun.ac.za
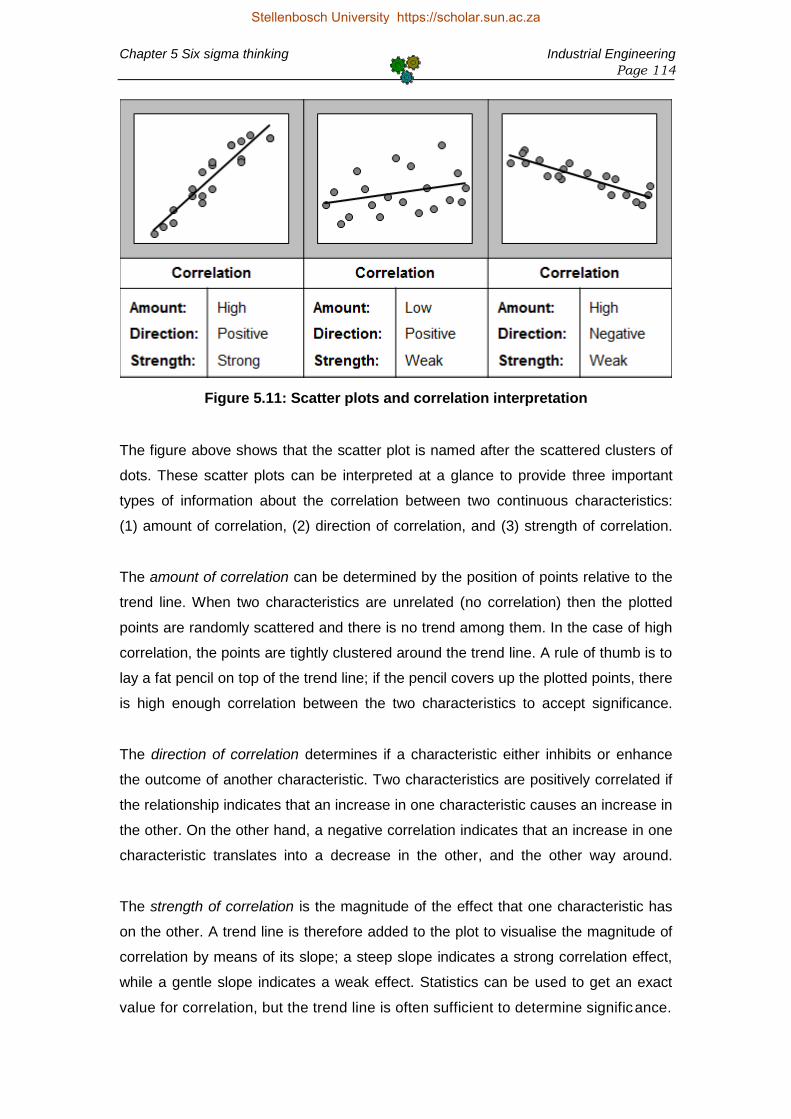
Chapter 5 Six sigma thinking Industrial Engineering
Page 114
Figure 5.11: Scatter plots and correlation interpretation
The figure above shows that the scatter plot is named after the scattered clusters of
dots. These scatter plots can be interpreted at a glance to provide three important
types of information about the correlation between two continuous characteristics:
(1) amount of correlation, (2) direction of correlation, and (3) strength of correlation.
.
The amount of correlation can be determined by the position of points relative to the
trend line. When two characteristics are unrelated (no correlation) then the plotted
points are randomly scattered and there is no trend among them. In the case of high
correlation, the points are tightly clustered around the trend line. A rule of thumb is to
lay a fat pencil on top of the trend line; if the pencil covers up the plotted points, there
is high enough correlation between the two characteristics to accept significance.
The direction of correlation determines if a characteristic either inhibits or enhance
the outcome of another characteristic. Two characteristics are positively correlated if
the relationship indicates that an increase in one characteristic causes an increase in
the other. On the other hand, a negative correlation indicates that an increase in one
characteristic translates into a decrease in the other, and the other way around.
The strength of correlation is the magnitude of the effect that one characteristic has
on the other. A trend line is therefore added to the plot to visualise the magnitude of
correlation by means of its slope; a steep slope indicates a strong correlation effect,
while a gentle slope indicates a weak effect. Statistics can be used to get an exact
value for correlation, but the trend line is often sufficient to determine significance.
Stellenbosch University https://scholar.sun.ac.za
Chapter 5 Six sigma thinking Industrial Engineering
Page 115
5.4 Improve
The purpose of the improve phase is to generate and implement solutions that will
eliminate problems and reduce variation. This requires that the entire team shift their
mindset from analytical studies to creative thinking. Several idea generation and risk
evaluation techniques can be used to get stakeholder support and follow through with
implementation. One approach is pilot improvement, discussed in the PDCA cycle;
but the six thinking hats and failure mode and effect analysis can also be used. [12]
5.4.1 Six thinking hats
Edward De Bono created six thinking hats in 1985 as a method to look at a problem
from several different perspectives until the problems is solved. With this method he
introduced the idea of lateral thinking; a thinking style that is not linear, sequential, or
logical. It requires participant to look in the same direction at any moment.This helps
to move away from habitual thinking styles and towards a rounded view of a process.
Lateral thinking includes constructive and creative thinking that also encourages the
cooperation and coordination of teams. It deals with only one aspect at a time and is
concerned with “what can be”. This approach is opposite to traditional thinking that is
based on the philosophies of Socrates, Plato, and Aristotle. Traditional thinking deals
with many aspects at a time and is concerned with “what is”, which is determined by
analysis, judgment and argument, without team collaboration and cooperation. [94]
.
Six thinking hats can be used by either individuals or teams, where it can minimise
the confrontations that happen when people with different perspectives discuss the
same problem. The approach consists of only six imaginary hats that are used one at
a time; each hat is a different colour and represents a different style of thinking. [12]
.
The white hat calls for information in terms of facts and numbers at hand. Information
is presented in a neutral and objective way to determine what is available, what is
needed, and how it can be obtained. This requires participants to set aside subjective
beliefs, arguments, and opinions to avoid potential deceptive or incorrect information.
The green hat represents an environment that encourages divergent thinking so that
creative possibilities and alternative ideas can be explored. Various lateral thinking
techniques can be used to support divergent thinking and identify opportunities. This
involves participants to set aside their habits of recognition, judgment, and criticism.
Stellenbosch University https://scholar.sun.ac.za

Chapter 5 Six sigma thinking Industrial Engineering
Page 116
The yellow hat signifies optimism and a positive attitude to support the deliberate
search for logical benefits and feasible implementation of a proposed idea. Benefits
are not always obvious and it might be necessary to search for some advantageous
opportunities; so every creative green hat idea deserves some yellow hat attention.
.
The black hat calls for caution and critical judgment to identify obstacles and avoid
unrealistic solutions. This is vital because mistakes can be disastrous if suggestions
do not fit the facts; but do not overuse cautious thinking because too much negative
thoughts can destroy creative ideas, especially in the early stages of problem solving.
The red hat signifies intuition, hunches and emotions. It provides individuals with the
opportunity to state their perspectives without explanation or justification. This helps
teams to reveal conflict and emotions openly without fear of retribution; it is always
valuable to share true emotions because emotions based on logic can be spurious.
The blue hat controls and organises the thinking process. This provides feedback for
the team and guides them through the entire thinking process. Therefore, start with
the blue hat to define the current situation or issue, set the agenda for thinking, and
determine the sequence or utilisation of other hats; also, end with it to summarise
what have been achieved, what have been learned, and what should be done next.
White Hat
Facts; Data; Information
What information do we have?
What information do we need?
Set aside arguments and opinions.
Green Hat
Creativity; Possibilities; Growth
What are possible solutions?
What are the alternatives?
Set aside judgment and criticism.
Yellow Hat
Optimism; Positive; Benefits
Why is this proposal preferable?
How can we make this work?
Every idea deserves positive attention.
Black Hat
Judgment; Caution; Evaluation
What are the obstacles?
What are the weaknesses?
Overuse can stifle creative ideas.
Red Hat
Emotions; Intuition; Hunches
How do I feel about this right now?
How will I react to this idea?
States perspective without justification.
Blue Hat
Organise; Control; Decisions
What do we want to achieve?
What have we achieved?
Manage the thinking process.
Figure 5.12: Six thinking hats
Stellenbosch University https://scholar.sun.ac.za
Chapter 5 Six sigma thinking Industrial Engineering
Page 117
These hats can be used by individuals or teams to reduce team conflict. The crucial
factor is that participants wear the same colour hat at the same time, because each
hat represents a specific attitude to adopt. This requires discipline from each person
to stay focused. The sequence of the hats is not important and hats can be used on
their own at any point as often as needed, or as a sequence of two or more hats. [95]
5.4.2 Failure mode and effect analysis
Failure mode and effect analysis (FMEA) is a systematic approach used to determine
in what ways a technical system might fail, the causes of failure, and the impact that
failures might have on customer satisfaction and process performance. This is crucial
to reduce or eliminate failure risks associated with improvement implementation. [14]
FMEA is standardised for proactive process evaluation to eliminate potential failure
causes before actual failure occurs. The prioritisation of failures is also an important
part of FMEA. This approach ensures that stakeholders are more comfortable with
the process because potential problems can be avoided to make the process more
secure. The steps below guide FMEA for failure identification and prioritisation. [96]
Step 1: Review the process to be analysed and list the relevant components. This
information can be extracted from a flowchart or a fishbone diagram. FMEA suggests
that people from different functional areas contribute ideas, to ensure that a realistic
view of the process is provided for further evaluation of all the individual components.
Step 2: Identify potential ways in which the components of the process might fail;
these are known as the failure modes. The improvement team can brainstorm or use
alternative idea generation techniques for the identification of potential failure modes.
Step 3: Describe and asses the severity of the probable effect, or impact, that each
failure mode might have on customer satisfaction and process performance. A low
severity failure is unlikely to have any noticeable impact on the customer or system,
while a serious failure might lead to functional problems as well as safety concerns.
Step 4: Describe and asses the occurrence probability of the identified effects due to
potential root causes of failure; various methods can be used to determine these root
causes. A low probability indicates that failures are not likely to occur, while a high
probability shows that the system needs revision and modification to be more stable.
Stellenbosch University https://scholar.sun.ac.za

Chapter 5 Six sigma thinking Industrial Engineering
Page 118
Step 5: Describe and access the detectability of the current control system to identify
a failure before it influences the customer; this is the ability of the system to prevent
the failure itself or the impact in the event of a failure. A low detectability score means
that a failure can be detected immediately or at least in the next process step, while a
high detectability score indicates that it is difficult to recognise and eliminate a failure.
Step 6: Calculate the risk priority number (RPN) to prioritise the importance of each
failure mode. The RPN is the product of severity, probability, and detectability, for
each respective failure mode. Once these are calculated the team can focus on the
most important failure modes; the higher the RPN, the higher the importance of the
failure mode. The RPNs can then be plotted on a Pareto chart to visualise priorities.
Step 7: Prepare a plan to eliminate risks associated with high priority failures. Identify
the characteristics that are necessary to prevent a particular failure mode and define
them as critical. Then try to avoid the failure itself or mitigate the effects associated
with the failure. Otherwise, determine a suitable response in case the failure occurs.
RPN is a primary indicator of failure seriousness, but it us it not the only important
output of a FMEA. The relationship between the failure factors (severity, probability,
and detectability) must be considered because a failure might not be critical by itself,
but can have a serious effect when combined with other failures. Therefore, always
consider combinations of potential failures and their causes, conditions, and effects.
Process Steps
Failure Modes
Failure Effects
Se
verity
Failure Causes
Pro
ba
bili
ty
Failure Controls
De
tecta
bili
ty
Risk Priority Number
… … … S … P … D S x P x D
Severity Scores Probability scores Detectability Scores
1 – 2 Almost invisible 1 – 2 Unlikely 1 – 2 Obvious failure
3 – 4 Minor failure 3 – 4 Rarely 3 – 4 Easy
5 – 6 Moderate failure 5 – 6 Sometimes 5 – 6 Moderate
7 – 8 Major failure 7 – 8 Frequently 7 – 8 Difficult
9 – 10 Serious failure 9 – 10 Very often 9 – 10 Undetectable
Note that these scores are just guidelines and require operational definitions.
Figure 5.13: Failure mode and effect analysis
Stellenbosch University https://scholar.sun.ac.za
Chapter 5 Six sigma thinking Industrial Engineering
Page 119
5.5 Control
The purpose of the control phase is to monitor and regulate the process to sustain
improvement efforts after the project is completed and the team is disbanded. This
provides opportunities to ensure that new behaviours become routine, even though it
might take some time, through the use of control charts to guarantee performance
based on the amount of variation that the process exhibits. However, before control
charts can be understood, it is necessary to expand on the concept of variation. [81]
.
Variation
Walter A. Shewart was one of the pioneers who developed the theory of variation
back in the 1920s. He stated that everything we observe or measure varies because
variation is inherent to all processes; but organisations are forced to make decision
based on these values, which might influence performance. Variation is therefore an
important concept that six sigma aims to understand, monitor, and control. Shewart
categorised variation as common cause variation and special cause variation. [97]
Common cause variation is due to natural variation that is inherent to the process, or
because of how the process is managed, or because of the internal environment. It is
often considered beyond the control of the individual and employees should therefore
not be held accountable for such process problems; management is responsible to
isolate and reduce common causes of variation to achieve real quality improvements.
Special cause variation is due to assignable causes that is not a regular part of the
process, but arise because of specific circumstances. This means that it is a result of
factors outside the process and an exception to standard operation. People closest to
the process are responsible for the detection, avoidance, and rectification of this type
of variation when possible; this is important to continuous improvement. However,
management must set policies to detect and control the special causes of variation.
Table 5.2: Causes of variation
Common cause variation Special cause variation
Process design
Improper material
Poor instructions
Inadequate lightning
Ambiguous policies
Untrained employee
Power failure
Machine break down
New raw material
Safety accident
Stellenbosch University https://scholar.sun.ac.za

Chapter 5 Six sigma thinking Industrial Engineering
Page 120
When a process does not exhibit special cause variation it is considered stable. This
means the process is in statistical control, although common cause variation might
still be present. A stable process is a basic requirement for process improvement
efforts. The advantages include known process capability, efficient operations,
predictable performance in the near future, and accurate improvement measures.
There are two fundamental types of mistakes people make in the pursuit of a stable
process. The first mistake, called tampering, is to treat common cause variation as
special cause variation and adjust the system; this is by far the more frequent of the
two mistakes. The second mistake is to treat special cause variation as common
cause variation and accept the problem. Differentiation between the types of variation
is therefore important so that appropriate actions can be taken for improvement. [15]
The theory of variation is also important because it is good practice to always reduce
and control variation even when the process is stable. Management must focus on
continuous reduction of variation to ensure predictable process output. They should
also include employees to sustain improvements with basic statistical tools and time
based charts; the main statistical tool used for this purpose is the control chart. [12]
5.5.1 Control charts introduction
Shewhart introduced control charts in the 1920s, as an extension of the run chart, to
distinguish between common cause variation and special cause variation. He stated
that a process must be stable and kept in control to ensure efficient management and
to enable predictable performance. Controls charts are nowadays accepted in many
situations as the main tool of statistical process control, although it is often adequate
to view patterns of data on run charts. However, the basic concept of control charts is
discussed because it is required to better understand statistical process control. [98]
.
Control charts provide a graphical representation for process characteristics plotted
against time to identify deviation from the mean, process shifts, or unusual event that
occurred; this is important for effective continuous improvement. Therefore, control
charts provide management with guidance to take action and avoid the two common
mistakes made in the pursuit to create stable processes. It also permits management
to strive towards the ideal process through the continuous reduction of variation. [15]
Stellenbosch University https://scholar.sun.ac.za

Chapter 5 Six sigma thinking Industrial Engineering
Page 121
Figure 5.14: Quality consciousness versus quality strategy
Information and guidance provided by control charts can also be used for evaluation
purposes. First, retrospective examination of a chart indicates whether the process
has been in statistical control. Second, evaluation of the current situation supports
tactical decisions to maintain a state of statistical control. Third, it predicts the near
future state of a process based on statistical evidence and process knowledge. [15]
Different types of control charts are used for different scenarios. The appropriate type
of control chart depends on the type of data available, or the quality consciousness of
the organisation. Organisations that have progressed from defect detection, or mass
inspection, to defect prevention should use attribute control charts. Only then can
they advance to a state of continuous improvement and use variable control charts.
.
5.5.2 Attribute control charts
Attribute control charts use discrete data to promote the goalpost view of quality and
create awareness of defect prevention. There two main types of attribute charts are
classification charts and count charts. The chart type depends on the nature of the
data; whether the data is the number or proportion of defects or defective units. [99]
.
Classification charts consist of p charts and np charts, which are respectively used
to deal with proportion and number of defectives. Subgroup sizes for p charts may
vary because it is expressed in proportions; however, subgroup sizes for np charts
must remain constant. Therefore, np charts are often used to introduce control charts
to people, because some people would rather work with whole numbers than fractions.
Stellenbosch University https://scholar.sun.ac.za

Chapter 5 Six sigma thinking Industrial Engineering
Page 122
Count charts consist of u charts and c charts, which are respectively used to deal
with proportion and number of defects (events) per area of opportunity; note that the
area of opportunity can be a product, a time period, a geographical region, or other
areas where one or more defects can be observed. Subgroup sizes for u charts may
vary because it is expressed in proportions; however, subgroup sizes for c charts
must be defined from constant areas of opportunity for reliable control analysis.
Attribute charts support the identification of special causes of variation, even though
their usage is restricted to defects and defectives. This is a form of defect prevention,
which may lead to improved processes that require the examination of excessive
subgroup sizes to detect undesirable events. Therefore, inspection cost increases
and the charts become inefficient as the fraction of defective output approaches zero.
Another disadvantage of attribute control charts is their limitation in the identification
and isolation of individual special causes of variation, because multiple sources of
variation may mask one another and give the impression that the process is stable,
even when variation exists. Attribute controls charts are therefore only considered as
a milestone towards true continuous improvement; so a more reliable and informative
approach is required for further process improvement. This should lead to the next
level of quality consciousness that encourages the use of variable control charts. [15]
Figure 5.15: Attribute control chart selection
Differ
Stellenbosch University https://scholar.sun.ac.za

Chapter 5 Six sigma thinking Industrial Engineering
Page 123
5.5.3 Variable control charts
Variable control charts use continuous data to promote the Taguchi loss function
view of quality and create awareness of improvement. These types of charts reveal
the information obtained though numerical measurements to enable the reduction of
unit-to-unit variation. Variable charts are preferred over attribute charts because they
do not mask valuable information that is crucial for continuous improvement, and to
reduce the difference between customer requirements and process performance. [99]
Continuous data control requires two charts for complete process analysis because
numerical measures provide more information than attribute data; one chart is used
to monitor the location and one is used to monitor the variance of the data. These
charts are grouped together into three sets of control charts: (1) x-bar and R charts,
(2) x-bar and s charts, and (3) individual and moving range charts; the appropriate
variable chart type is determined by the subgroup size that is used for data collection.
X-bar and R charts are used with subgroup sizes of two to nine. These charts are
respective plots of the subgroup average, x-bar, to monitor process location, and the
subgroup range, R, to monitor the process variance; “R” is a robust estimator of the
standard deviation based on the average subgroup range. This simplified estimation
approach makes x-bar and R charts the preferred choice for manual control analysis.
X-bar and s charts are used with subgroup sizes of 10 or more. These charts are
respective plots of the subgroup average, x-bar, to monitor process location, and the
standard error, s, to monitor the process variance; s is a more accurate, statistical
estimator than R and also less robust because R is more sensitive to changes in the
population shape. But contrast to the smaller standard error is the expensive cost of
larger subgroup sizes and more complex calculations. However, computer software
can be used for the construction of x-bar and s charts without tedious calculations.
Individual (I) and moving range (MR) charts are used for variables, measured one
at a time per subgroup. These charts are respective plots of the values for single
measurements, to monitor process location, and the range between two adjacent
data points, to monitor the process variance. Single variable subgroups are common
when measurements must be taken at prolonged intervals, or the measurements are
destructive or expensive, or if the measures represent a single homogeneous batch.
Stellenbosch University https://scholar.sun.ac.za

Chapter 5 Six sigma thinking Industrial Engineering
Page 124
Figure 5.16: Variable control chart selection
5.5.4 Control chart structure
Different types of control charts are calculated and constructed in different manners,
but all control charts have a common structure. There is an abundance of literature
available that provides instructions on the construction of control charts and detailed
analysis of control points to distinguish between causes of variation; therefore, this
section focuses on the components that comprise control chart because it provides
the information required to analyse and monitor improvement. The components that
are studied for control analysis and revision are subgroups, mean, and control limits.
.
Subgroups are sets of measurements that represent a specific process characteristic
over time. These sets are the foundation of control chart construction. The selection
of rational subgroups is important to enable the isolation of special cause variation
between subgroups while variation within subgroups is minimised. Rational selection
may require a trial-and-error solution based on process knowledge and the following
characteristics: number of subgroups, subgroup size, and subgroup frequency. [15]
.
The number of subgroups should be large enough to provide a realistic performance
overview of the studied process. As a rule of thumb, the number of subgroups should
be at least 25 for effective control chart calculations. On rare occasions fewer than 25
subgroups may be used as long as the control limits are recalculated when more
data are obtained; but a control chart should almost never be attempted with fewer
than 10 subgroups. Individual and moving range charts are an exception to this rule
and requires at least 100 subgroups to be reliable, because each subgroup consists
of only one value, and variation is based on observation-to-observation changes.
Stellenbosch University https://scholar.sun.ac.za

Chapter 5 Six sigma thinking Industrial Engineering
Page 125
The subgroup size is the number of measurements that are produced under almost
similar conditions within subgroups. It must be large enough to indicate out-of-control
behaviour when a lack of control exists. The subgroup size for classification control
charts is therefore often larger than required for variable control charts so that some
nonconformances are likely to be included. Another crucial factor is the higher cost of
larger subgroups; even though larger subgroups lead to more reliable control limits.
The subgroup frequency is defined as how often subgroups are selected. It requires
experience and process knowledge to select a logical frequency because it depends
on various factors such as the production rate, elapsed time, and shift duration. The
frequency with which the subgroups are selected should minimise variation between
batches, shifts, machines, or people. Frequent subgroup selection enables special
variation to be captured, isolated, and analysed; but as the process is stabilised, less
frequent subgroup selection is needed and resources can be focused elsewhere. [99]
Figure 5.17: Control chart structure
Stellenbosch University https://scholar.sun.ac.za

Chapter 5 Six sigma thinking Industrial Engineering
Page 126
The mean is calculated from the subgroups to provide a centreline for the control
chart. It is an estimate for central tendency and is required for the calculation of the
standard error used to determine the control limits. This is contrast to the run chart
that uses the median as the centreline to neutralise the effect of very large or very
small values. However, these values are required to calculate reliable control limits.
.
Control limits represent the limits of variation that should be expected from a stable
process. Shewart proposed that control limits should be established at three times
the standard deviation from the process mean; his research indicated that 99.73% of
the common cause variation would fall within these limits. Subgroup averages are
used as control points and compared to control limits to distinguish between causes
of variation; a great deal of literature is available for detailed control point analysis.
.
Control limits are based on the average process variation within sample subgroups. It
is therefore important to construct and analyse the variance chart first when variable
data is studied; note that one chart is constructed and analysed when discrete data is
studied. If the variance chart shows no indication of a lack of control, the location
chart can be constructed and analysed. However, if there is an indication of a lack of
control, the process is not stable and the control limits will also be unreliable and may
not reveal special causes of variation on the location chart even when they exist. [98]
5.5.5 Analysis and revision
Remember that run charts are often adequate to identify general variation, but the
formal statistical analysis of control chart provides more detail in situations where
data are independent and normally distributed. The extra detail helps to differentiate
between causes of variation and is important for the continuous reduction of variation
to increase quality, and also customer satisfaction, in the future. Management should
therefore define the purpose of control analysis to motivate the use of control charts.
Control analysis can start once a control chart is constructed and each component is
thoroughly understood. The purpose is to recognise causes of variation and reduce
the difference between customer requirement and process performance. This can be
done with manual examination of the control chart or with software execution. Once
causes of variation are identified it should be reduced or eliminated and standardised
policies and procedures should be implemented to sustain improvement efforts. It is
therefore crucial to include everyone that is affected through the studied process. [15]
Stellenbosch University https://scholar.sun.ac.za

Chapter 5 Six sigma thinking Industrial Engineering
Page 127
The next step is the identification and isolation of special causes of variation, which
either decrease performance or improve performance. Simple rules can be applied to
determine if a process exhibits a lack of control. The basic rule is to look for data
points that fall outside the control limits, because they are an instant indication that a
process is out of control. A process is also considered unstable if the distribution of
the data points is not random, even though each point falls within the control limits.
Once special causes of variation are identified it should be eliminated or incorporated
by someone who has direct control over the process. Standardised guidelines should
therefore be developed to provide corrective actions and support in the event of an
out of control situation. The out of control data point that corresponds to the cause of
special variation can be deleted and the control limits recalculated once the cause
is eliminated. This cycle is continued until there is no more special cause variation.
.
When all the special causes of variation are eliminated or if none were found on the
control chart, the process is considered to be in a state of statistical control; this is a
basic requirement for further improvement. Focus can then shift to the reduction of
common causes of variation through changes in the process itself. First, move the
process average closer to the desired level. Second, management must reduce the
level of common cause variation with the focus on continuous improvement. [90]
The dynamic nature of continuous improvement requires that control limits should be
revised; but excessive revision of limits is adverse and inappropriate. Control limits
should therefore only be recalculated for three reasons, which also require revision of
the centreline. First, when special causes of variation have been eliminated and the
out of control points have been removed from the data set. Second, changes in the
process because of internal factors that influence critical parameters. Third, when
enough subgroups become available to replace trial limits with regular control limits.
..
5.6 Theory of management
The six sigma management system promotes quality consciousness and provides
guidance for six sigma implementation, which also includes the education of people
in different functional areas to support systems thinking and to create awareness of
their important role in process improvement. This management system can be traced
back to the influence of W. Edwards Deming, whose management theory, the system
of profound knowledge, provides the foundation for several modern quality concepts.
Stellenbosch University https://scholar.sun.ac.za

Chapter 5 Six sigma thinking Industrial Engineering
Page 128
Deming developed the system of profound knowledge to signify the deep insight that
comprehensive process knowledge offers into improvement; process knowledge is
gained from experience and coordinated by theory to promote joy in work, which is
important for breakthrough improvements because the metrics and methodology are
not sufficient on their own to achieve sustainable results. This is based on a holistic
and comprehensive theory of management that is suitable for most industries. [100]
5.6.1 Paradigms
Deming based his management theory on four common paradigms that force people
to interpret data about different situations and develop the environment required to
promote joy in work. These four paradigms represent a shift from the traditional belief
system used by managers to create an environment for process improvement. [15]
Paradigm 1: People are best inspired by a mix of intrinsic and extrinsic motivation;
not only extrinsic motivation. Intrinsic motivation is experienced by people through to
the sheer joy of a work endeavour; management is responsible for the development
of an environment that encourages the release of this internal human energy for the
improvement and innovation of a system. Extrinsic motivation originates from the fear
of punishment or the desire for reward; this restricts the release of intrinsic motivation
through appraisal, judgment, and policies that can destroy the confidence of people.
Paradigm 2: Management should use both a process and results orientation when a
process is evaluated. This allows them to define the capabilities of the process to
predict future performance and make decisions based on scientific data, even though
they should also consider unknown figures such as the benefits of a proud employee
or the cost of an unsatisfied customer. Management should therefore encourage an
improvement culture that focus on the process, and not just manage the results.
Figure 5.18: Paradigms of management
Stellenbosch University https://scholar.sun.ac.za
Chapter 5 Six sigma thinking Industrial Engineering
Page 129
Paradigm 3: The function of management is to optimise the entire system, and not
just the components of the system. They must understand that every system in the
organisation is interdependent and that isolated improvement efforts can affect the
system in a negative manner. Management must therefore focus on the optimisation
of the entire system, even if it means that one or more components are suboptimised.
.
Paradigm 4: Cooperation is better for improvement than competition. Individuals that
are forced to compete cannot reap the benefits of a win-win perspective, therefore
most people lose. Competition is also expensive and costs include rework, waste,
redundancy, reinspection, schedule disruptions, stress, and destruction of joy in work
for individual endeavours. Cooperation is always the preferred paradigm when the
aim of the system is to improve, but competition is preferred when the aim is to win.
.
5.6.2 Components
Deming defined his theory of management as the interaction between these related
components: appreciation of the system, theory of variation, theory of knowledge,
and psychology. Although the system is interdependent, expert knowledge of these
components is not required to understand and use the theory of management. [32]
Appreciation of the system is the comprehension of the complex interaction between
people and processes that work together towards a common purpose; the common
purpose should be well defined to ensure effective alignment of the interdependent
components of the system. Management is responsible to optimise the entire system
toward this common purpose. They should also promote this purpose because it may
require functional management to suboptimise some components; success depends
on the integration of all the components and not the performance of individual parts.
Theory of variation refers to the interaction between the components of the system
and its environment. Variation is discussed earlier in this chapter because of its direct
influence on process performance. In brief again, variation is inherent to processes
and can be categorised as either common or special. Common cause variation is a
result of the inherent design and structure of the system and should be isolated and
reduced by management; special cause variation is the result of external factors and
should be resolved by people that are closest to the process. A system that does not
exhibit special cause variation is stable; that is, it is in a predictable state of variation.
Stellenbosch University https://scholar.sun.ac.za

Chapter 5 Six sigma thinking Industrial Engineering
Page 130
Theory of knowledge is the development of knowledge through a theory that is used
to predict a future outcome, which is compared with the observed outcome, to decide
whether to support, revise, or abandon the theory; knowledge is the quantifiable risk
that the predicted outcome, as stated by the theory, will be wrong. The theory allows
people to learn from the experience, which improve their appreciation of the process;
experience alone is of no value without the aid of theory. Success can therefore not
be copied from system to system based on experience alone; however, the theory
that underlies success can be replicated when the success factors are understood.
Psychology is the appreciation of the human side of change and helps management
to understand how people interact with each other and with the system. People have
different preferences and learning styles that management must recognise and take
into account. Different people also require different amounts of intrinsic and extrinsic
motivation to drive their behaviour. Management should determine the proper mix of
motivation for each person to commit them to change, rather than to rely on direct
interpretation of their behaviour. Once change has been developed that is compatible
with the current culture, people must be informed about the benefits and included in
the solution; this culture must see failure as a result of bad systems, not bad people.
.
5.6.3 Points for management
The six sigma methodology can produce significant, innovative performance results
when it is deployed by dynamic leaders that develop and enable people to participate
in process improvement activities. Leaders must understand the interrelationships
between themselves and their environment, which includes people and processes,
based on an organisational wide perspective. This method is summarised in a set of
14 related points for management, which Deming developed to reflect his view on the
strategic need for leadership to encourage a culture of continuous improvement. [101]
Point 1: Create constancy of purpose toward process improvement. Leaders must
define vision and mission statements based on organisation values and beliefs. The
vision statement seeks to communicate the desired future state of the organisation to
the stakeholders. The mission statement serves to inform stakeholders of the current
reason for the existence of the organisation. Values and beliefs are the principles that
provide a framework for focused, consistent behaviour of the improvement culture so
that participants understand their roles, and feel more secure, within the organisation.
.
Stellenbosch University https://scholar.sun.ac.za

Chapter 5 Six sigma thinking Industrial Engineering
Page 131
Point 2: Adopt the philosophy of management and learn its responsibilities, focus on
the customer, and take leadership for change. This point encompasses the paradigm
shift that leaders have to accept if they strive toward a culture of continuous process
improvement as a consequence of the management theory that Deming developed.
.
Point 3: Cease dependence on inspection as a means to ensure quality; eliminate
the need for mass inspection and rather build quality into the process. The quality
hierarchy provides three levels that guide the persuasion of predictable and reliable
output: (1) defect detection, (2) defect prevention, and (3) continuous improvement.
Defect detection relies on mass inspection to detect and remove defectives, because
defects in output are expected at this level of quality consciousness. Defectives are
removed from the process without consideration of how to avoid defective output and
decrease variation; there is no additional feedback that supports the identification of
further improvement opportunities. Management must stop their reliance on mass
inspection and seek to build quality into the process to prevent the occurrence of
defects in the first place, because the cost associated with defects is unrecoverable.
.
Defect prevention strives to produce predictable output within specification limits and
achieve zero defects. This level of quality consciousness assumes process output
that falls within specification limits will meet customer requirements. People are
therefore under the impression that they don’t have to reduce variation when the
process reaches a state of zero defect production. However, variation reduction and
other improvement activities must continue to ensure the production of predictable
output within specification limits because variation is inherent to processes, which
means that even a stable process will deviate from specification limits in the long run.
Continuous improvement is the constant reduction of process variation, even within
specification limits, to reduce the difference between customer requirements and
process performance. Management must take action to move the process average
closer to the desired value and reduce unit-to-unit variation; reliable and predictable
processes must always be persuaded to compensate for inherent variation. Long
terms decisions and strategic investments should therefore be considered to support
continuous improvement activities, even at the expense of short term financial goals.
Stellenbosch University https://scholar.sun.ac.za

Chapter 5 Six sigma thinking Industrial Engineering
Page 132
: Inspection costs
Capital equipment
Labour
Maintenance
Rent & Utilities
Piece cost (outside vendor quote)
: Possible detrimental costs
Repair cost
Lost production cost
Warranty costs
Cost of unsatisfied customers
Lawsuits ( = ∞ for safety items)
: fraction of defective items
Interpretation of kp rule
0 percent inspection
100 percent inspection
either 0 percent or 100 percent inspection
Note that this is just a guideline because can sometimes be difficult to estimate.
Figure 5.19: The kp rule for inspection
Deming advocated a rule that facilitates the collection of process data to support the
continuous reduction of variation and let quality consciousness progress from defect
detection to continuous improvement. This analytical rule, called the kp rule, is based
on statistical evidence and can be used to minimise the cost of inspection and its
effect on the process through either no inspection or 100 percent inspection given a
stable process; sample inspection is not effective when a process is stable, so it is
not an option. This rule can be applied between any two process points, except when
inspection is destructive or when samples are taken from a homogeneous mixture.
.
It is important to understand that a lack of inspection does not mean zero process
information. Small samples should always be drawn from batches for information
about the process. This information should be analysed with tools such as control
charts to facilitate process improvement. The cost of these small samples is part of
operational cost and is therefore not considered in the cost function to be minimised.
Point 4: Do not award business on the basis of price tag; instead, focus on lowest
total cost and establish long-term relationships with suppliers based on loyalty and
trust. Suppliers and buyers form part of an interrelated system and must therefore be
optimised as a whole; so avoid suboptimisation. Management must understand the
procurement scenarios to optimise this system. These are summarised in Table 5.3.
Stellenbosch University https://scholar.sun.ac.za
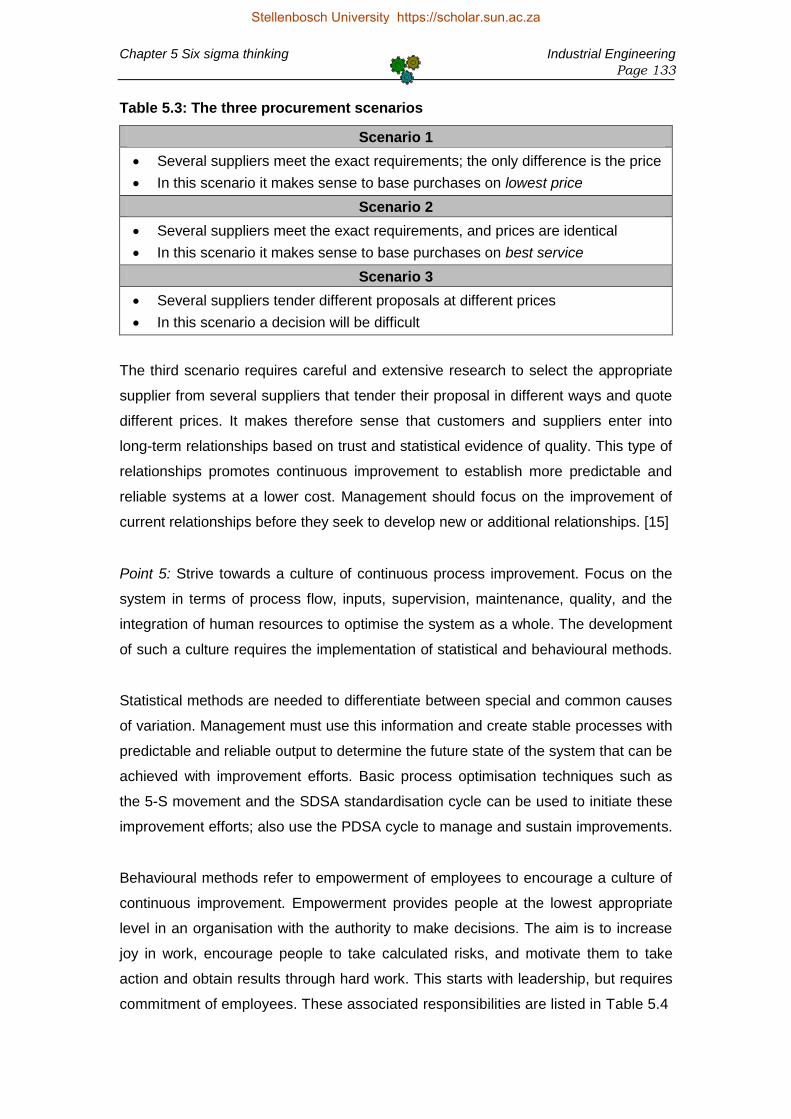
Chapter 5 Six sigma thinking Industrial Engineering
Page 133
Table 5.3: The three procurement scenarios
Scenario 1
Several suppliers meet the exact requirements; the only difference is the price
In this scenario it makes sense to base purchases on lowest price
Scenario 2
Several suppliers meet the exact requirements, and prices are identical
In this scenario it makes sense to base purchases on best service
Scenario 3
Several suppliers tender different proposals at different prices
In this scenario a decision will be difficult
The third scenario requires careful and extensive research to select the appropriate
supplier from several suppliers that tender their proposal in different ways and quote
different prices. It makes therefore sense that customers and suppliers enter into
long-term relationships based on trust and statistical evidence of quality. This type of
relationships promotes continuous improvement to establish more predictable and
reliable systems at a lower cost. Management should focus on the improvement of
current relationships before they seek to develop new or additional relationships. [15]
Point 5: Strive towards a culture of continuous process improvement. Focus on the
system in terms of process flow, inputs, supervision, maintenance, quality, and the
integration of human resources to optimise the system as a whole. The development
of such a culture requires the implementation of statistical and behavioural methods.
Statistical methods are needed to differentiate between special and common causes
of variation. Management must use this information and create stable processes with
predictable and reliable output to determine the future state of the system that can be
achieved with improvement efforts. Basic process optimisation techniques such as
the 5-S movement and the SDSA standardisation cycle can be used to initiate these
improvement efforts; also use the PDSA cycle to manage and sustain improvements.
.
Behavioural methods refer to empowerment of employees to encourage a culture of
continuous improvement. Empowerment provides people at the lowest appropriate
level in an organisation with the authority to make decisions. The aim is to increase
joy in work, encourage people to take calculated risks, and motivate them to take
action and obtain results through hard work. This starts with leadership, but requires
commitment of employees. These associated responsibilities are listed in Table 5.4
Stellenbosch University https://scholar.sun.ac.za

Chapter 5 Six sigma thinking Industrial Engineering
Page 134
Table 5.4: Empowerment: associated responsibilities
Management must provide employees with:
The opportunity to define and document the key processes.
The opportunity to be educated and trained.
The opportunity to improve best practice methods that make up systems.
The latitude to make decisions within the context of best practice methods.
An environment of trust without judgment
Employees must be responsible to:
Train their skills and increase their knowledge of the system.
Participate in the improvement and standardisation of best practice methods.
Utilise their latitude to make decisions within best practice methods.
Best practice methods can consist of either generalised procedures or individualised
procedures. Generalised procedures provide employees with standardised methods
that they must follow and manage through team activities. Individual procedures
provide employees with the opportunity to use their individual differences to manage
procedures on their own, on condition that output of the individualised procedures is
standardised across individuals; this requires organisation wide cooperation. Each
employee must resolve problems within the context of the best practice methods at
operational level; they should not change the best practice method on their own. [15]
Point 6: Management must ensure that employees are trained in their current job to
improve their performance. Employees are an important asset of organisations and
should be empowered to improve their job skill and take joy in their work. This is
achieved through training on the job to either introduce a new behaviour, or change
their current behaviour so that a particular kind of improved behaviour takes effect.
.
Management must track the current distribution of job skills and then consider the
speed at which employees learn so that they can improve the future distribution of
job skills. They should utilise statistical methods that indicate when an employee
reaches a state of statistical control with respect to a job characteristic. If the work
performance of an employee is not in statistical control (unstable), the employee will
benefit from more of the same training. However, if the work performance of an
employee is in statistical control (stable), then the employee has learned everything
from the training program and more of the same type of training will not be beneficial.
Stellenbosch University https://scholar.sun.ac.za
Chapter 5 Six sigma thinking Industrial Engineering
Page 135
Point 7: Institute a leadership structure that integrates people with the system and
enable them to improve the system within the context of best practice methods. A
leader must understand and manage the interrelated components of the system to
achieve a common goal. Leaders must therefore be able to prioritise application of
resources to optimise the system even if it requires that some system components
are suboptimised. Furthermore, leaders must continue to invest in education because
experience without theory does not enable learning or the prediction of future events.
Point 8: Drive out fear in people and encourage them to pursue everyday process
improvement activities. Management can remove the source of fear because it is
known, unlike anxiety, in which case the source is unknown. Common sources of
fear includes a lack of job security, ignorance of company goals, poor supervision,
lack of operational definitions, limitations in training and education, an environment
without trust, and inadequate work procedures. Individuals that are exposed to these
conditions experience poor morale, reduced creativity, poor performance, reluctance
to take risks, poor interpersonal relationships, and reduced motivation. Management
must therefore create a fear and judgment free environment to promote joy in work.
.
Point 9: Strive to break down barriers between departments and adapt a process
orientated management perspective. Barriers between departments prevent the
much needed cooperation and communication that are essential to integrate the
components that comprise the system. Management must understand how these
components interact and encourage cooperation between functions to optimise the
system as a whole. Incentives for isolated optimisation must therefore be eliminated.
.
Point 10: Eliminate slogans, exhortations, and targets that tend to be divisive and
counterproductive to any group of people within the organisation; management must
provide people with operationally defined statements that will motivate individuals and
explain expectations. Statements that do not represent a plan or method to achieve
the expressed goal can create adversarial relationships. Such general statements
only show management’s wishes for a desired result and do not provide employees
with practicable solutions. This leads to an environment of resentment without trust
where employees are not empowered or able to make improvements to the system.
Stellenbosch University https://scholar.sun.ac.za

Chapter 5 Six sigma thinking Industrial Engineering
Page 136
Do it right the first time Right place; Right time
Safety first
Continue to improve Zero defects
Figure 5.20: Slogans that must be avoided
Point 11: Implement leadership as a substitute to numerical management. Arbitrary
numerical management can be a disincentive to performance, reduce total quality,
discourage productivity, and increase waste. Two types of numerical management
that are most often used to coordinate operations are work standards and objectives.
Work standards provide employees with an expected level of performance based on
specified values that have no association with the capabilities of the process. These
do not guide improvement efforts and employees get blamed for problems beyond
their control. This deprives them of joy in work, especially if standards are too high or
too low. Standards that are set to high increase pressure on employees and result in
defects, which diminish morale and motivation; on the other hand, standards that are
set too low lead to idle employees and process losses. Management should therefore
base expectations on process capabilities as determined through statistical methods.
Objectives based on arbitrary numerical values are used to break down projects into
smaller sections. They do not provide new tools, resources, or methods to achieve
the objective. Employees may therefore need to abuse the system to meet the goal,
but this abuse may cause the system to fail elsewhere because of uneven resource
distribution; employees are then held accountable for failure, which reduces pride in
workmanship. Objectives, resources, and methods form an interdependent system
that management must consider, before the organisation of system components and
allocation of resources, to optimise the strategic objectives of the system as a whole.
.
Point 12: Remove barriers that deprive employees from their right to pride and joy in
workmanship. This means the abolishment of traditional methods based on annual
performance appraisals and of management by objectives. Performance evaluation
and reward must be based on quality, which should be driven by personal pride. This
promotes joy in work and motivates employees to improve quality and performance.
.
Stellenbosch University https://scholar.sun.ac.za

Chapter 5 Six sigma thinking Industrial Engineering
Page 137
Table 5.5: Typical barriers that deprive employees from joy in work
# Barrier
1 Unclear expectations with respect to organisational objectives
2 Work standards that force employees to follow rigid procedures
3 Employees that are blamed for problems that are out of their control
4 Rapid design of products without proper, tested prototypes
5 Lack of training and education to develop knowledge of the system
6 Defective equipment and material; unreliable methods and procedures
7 Management systems that focus on results, and not the entire process
8 The traditional, biased performance appraisal management approach
Point 13: Institute a dynamic program of education and self-improvement. This is the
continuous investment in employees to develop and grow their inherent potential to
participate in improvement. Employees must be developed as both professionals and
individuals, because their intellectual property is of primary organisational value. This
should be attempted with internal resources, but outside expertise may be required
for complex situations and the development of leaders. Remember that education is
designed to improve the competence of a person beyond the job now held; on the
other hand, training is used to exploit inherent talent and improve a specific job skill.
Point 14: Commit to change and take action to accomplish the transformation. This
requires an action plan and the cooperation of affected people to achieve the vision
of a six sigma organisation. Management must expand and stimulated the energy
that drives the transformation; this energy can originate from different sources such
as a crisis or a vision. To be able to plan, control, and improve the transformation,
management must know how people will experience the transformation and how
these experiences will interact with each other and with the aim of the transformation.
These 14 points of management provide a strategic framework for transformation
from the traditional paradigm of management, to system of profound knowledge
based management. The traditional management paradigm was developed through
the addition of various improvement concepts that do not consider the relationships
between the interdependent components of the system; but the system of profound
knowledge enables leadership to understand the relationships between the people,
systems, and environment. The system of profound knowledge is based on a holistic
and comprehensive theory of management, which is suitable for most industries. [15]
Stellenbosch University https://scholar.sun.ac.za
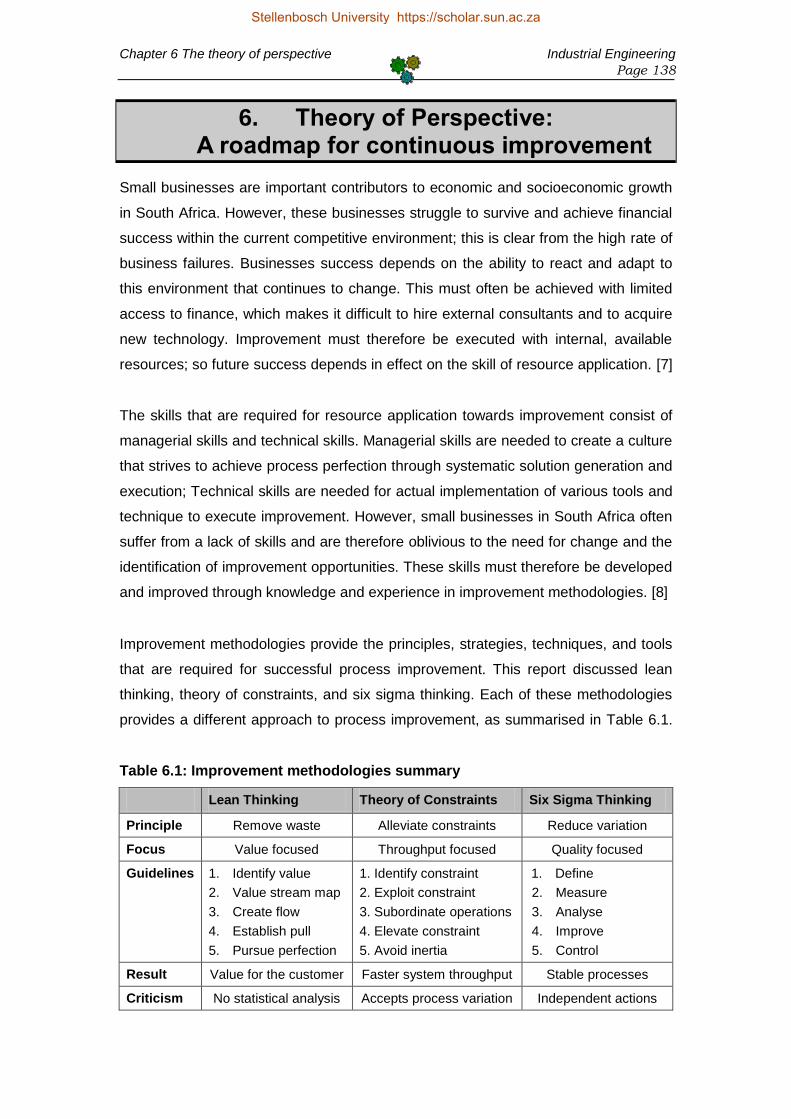
Chapter 6 The theory of perspective Industrial Engineering
Page 138
6. Theory of Perspective: A roadmap for continuous improvement
Small businesses are important contributors to economic and socioeconomic growth
in South Africa. However, these businesses struggle to survive and achieve financial
success within the current competitive environment; this is clear from the high rate of
business failures. Businesses success depends on the ability to react and adapt to
this environment that continues to change. This must often be achieved with limited
access to finance, which makes it difficult to hire external consultants and to acquire
new technology. Improvement must therefore be executed with internal, available
resources; so future success depends in effect on the skill of resource application. [7]
The skills that are required for resource application towards improvement consist of
managerial skills and technical skills. Managerial skills are needed to create a culture
that strives to achieve process perfection through systematic solution generation and
execution; Technical skills are needed for actual implementation of various tools and
technique to execute improvement. However, small businesses in South Africa often
suffer from a lack of skills and are therefore oblivious to the need for change and the
identification of improvement opportunities. These skills must therefore be developed
and improved through knowledge and experience in improvement methodologies. [8]
Improvement methodologies provide the principles, strategies, techniques, and tools
that are required for successful process improvement. This report discussed lean
thinking, theory of constraints, and six sigma thinking. Each of these methodologies
provides a different approach to process improvement, as summarised in Table 6.1.
Table 6.1: Improvement methodologies summary
Lean Thinking Theory of Constraints Six Sigma Thinking
Principle Remove waste Alleviate constraints Reduce variation
Focus Value focused Throughput focused Quality focused
Guidelines 1. Identify value
2. Value stream map
3. Create flow
4. Establish pull
5. Pursue perfection
1. Identify constraint
2. Exploit constraint
3. Subordinate operations
4. Elevate constraint
5. Avoid inertia
1. Define
2. Measure
3. Analyse
4. Improve
5. Control
Result Value for the customer Faster system throughput Stable processes
Criticism No statistical analysis Accepts process variation Independent actions
Stellenbosch University https://scholar.sun.ac.za

Chapter 6 The theory of perspective Industrial Engineering
Page 139
There is an abundance of literature available on these methodologies, and yet some
people struggle to implement the strategies into their organisations. The problem is
that terms such as “lean”, “kanban”, “bottleneck”, “flow” and “variation” have become
corporate buzzwords that people address without sensible consideration of a specific
situation; then, when the approach fails because of incorrect implementation, many
people conclude that the approach does not work in their organisation. Furthermore,
people attempt to replicate approaches that were implemented with relative success
in a different situation; this can also lead to failure and discourage improvement. [16]
Selection of appropriate tools and techniques can be difficult because of this partial,
distorted perception that some people have about improvement. Furthermore, each
of these three improvement methodologies has their own respective advantages and
disadvantages, which determine their relevance to specific situations. Even though
there are many differences between them, the methodologies can co-exist if their
principles and strategies are understood. The common foundation for success is that
these methodologies strive to enhance the perception of improvement, and educate
people on perspective, in order to achieve and sustain real process improvement. [52]
At this point it is important to understand the basic difference between perception and
perspective. Perception is the manner in which something is regarded, understood,
or interpreted; this is based on what one feels to be true even without the appropriate
knowledge or rationale. People observe situations and interpret the actions of other
people, based on their own experience, culture, and values to create their perception,
which can be distorted. This perception is the set of beliefs that defines how people
understand processes and make decisions. The manner in which people approach
improvement can therefore be enhanced with the development of perception. [102]
On the other hand, perspective is a point of view, which is used for the subjective
evaluation of something to determine its relative importance. This is based on a
particular attitude that enables people to think about a situation or problem in a wise
and reasonable manner and to perceive aspects of a subject with the appreciation of
their actual interrelations with each other and to the subject as a whole. Perspective
also contributes to the development of values and beliefs that form the perception of
people. Therefore, perspectives can be used to develop the perception of people
towards process improvement. This report calls this the “theory of perspective”. [103]
Stellenbosch University https://scholar.sun.ac.za

Chapter 6 The theory of perspective Industrial Engineering
Page 140
The theory of perspective is a holistic approach that considers the comprehensive
interdependencies within organisations. This is based on the appreciation of different
perspectives that represent continuous process improvement as an organisational
wide approach. These perspectives provide a synergetic reflection and interpretation
of continuous improvement aspects to create a perception that can guide actual,
successful improvement activities. Therefore, the theory does not focus on direct
process improvement, but on improvement of how people perceive the process, so
that they can improve it themselves; nevertheless, direct improvement is the result.
This theory provides the foundation for the development of a systematic, proactive
roadmap that provides skill constrained small business managers with directions
toward internal, sustainable process improvement without support from external
specialists. The directions are discussed in terms of different perspectives at different
levels. Once these are understood and applied to make successful decisions it is
considered to have corrected distortions and enhanced perception of improvement.
The roadmap does not attempt to construct a new science or expand on available
methodologies; direction provided through the roadmap is used to supplement and
integrate current ideas, and not replace them. These ideas are categorised into two
categories: strategic support and technical support. Strategic support is the
framework of the roadmap itself, as well as the strategic and tactical decisions that
drive process improvement activities. Technical support is the statistical analysis and
process optimisation tools that are used to execute strategic and tactical decisions.
When the roadmap is studied it is crucial to focus on the intent of each perspective,
and not the tools, because the tools can be interchanged to support the intent. The
technical tools, as well as advanced technologies, must also be used to supplement
the roadmap, and not to replace the strategic support. Technology is often used as a
substitute for thinking; but improvement is first a way of thinking, then a way of doing.
There is no time allocated to the perspectives, because continuous improvement
follows an incremental approach, which must consider all the perspectives at the
same time to improve the organisation as the business environment changes. So the
perspectives are not time-bound, but must first be studied in the provided sequence
to develop people’s perception of improvement. Thereafter, the perspectives must be
used to provide a holistic overview of improvement for the organisation as a whole.
Stellenbosch University https://scholar.sun.ac.za
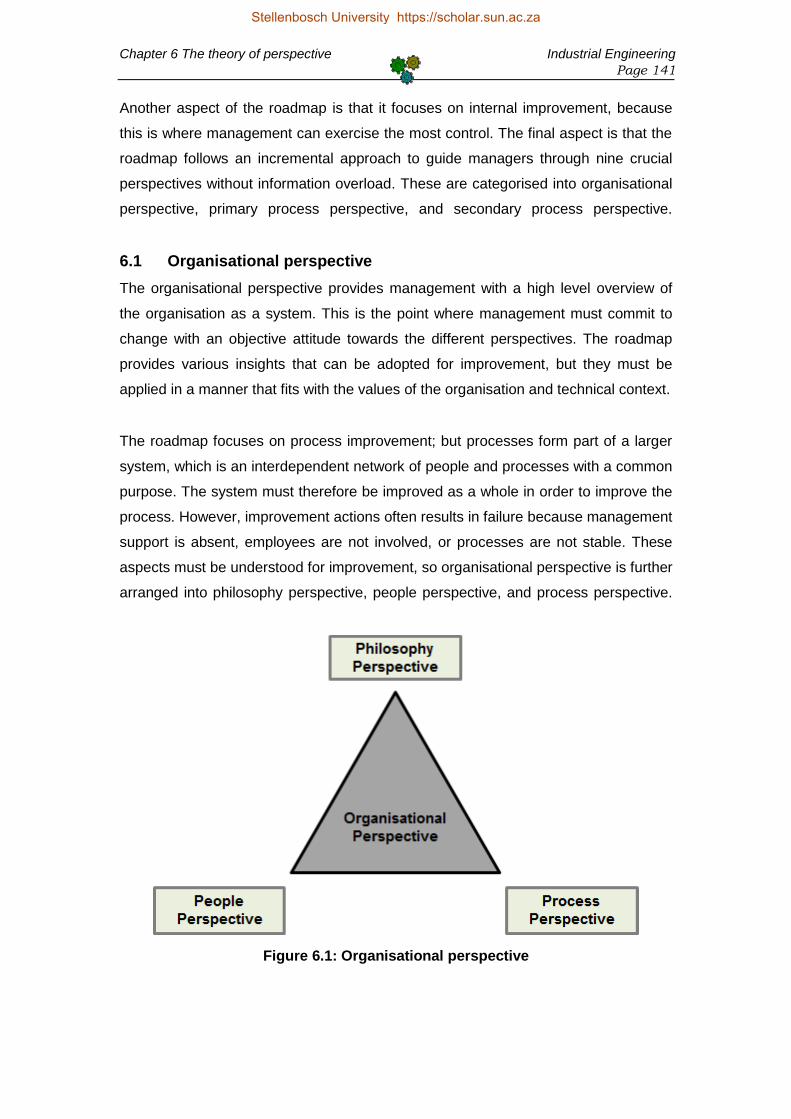
Chapter 6 The theory of perspective Industrial Engineering
Page 141
Another aspect of the roadmap is that it focuses on internal improvement, because
this is where management can exercise the most control. The final aspect is that the
roadmap follows an incremental approach to guide managers through nine crucial
perspectives without information overload. These are categorised into organisational
perspective, primary process perspective, and secondary process perspective.
6.1 Organisational perspective
The organisational perspective provides management with a high level overview of
the organisation as a system. This is the point where management must commit to
change with an objective attitude towards the different perspectives. The roadmap
provides various insights that can be adopted for improvement, but they must be
applied in a manner that fits with the values of the organisation and technical context.
The roadmap focuses on process improvement; but processes form part of a larger
system, which is an interdependent network of people and processes with a common
purpose. The system must therefore be improved as a whole in order to improve the
process. However, improvement actions often results in failure because management
support is absent, employees are not involved, or processes are not stable. These
aspects must be understood for improvement, so organisational perspective is further
arranged into philosophy perspective, people perspective, and process perspective.
Figure 6.1: Organisational perspective
Stellenbosch University https://scholar.sun.ac.za
Chapter 6 The theory of perspective Industrial Engineering
Page 142
6.1.1 Philosophy perspective
The philosophy perspective deals with the alignment of the organisational strategies
that drive current and future operations and improvement activities. This perspective
provides the foundation to rationalise and encourage long-term investment in the
management and development of the organisation as a system; so the philosophy
must be understood to gain support from top management for improvement activities,
and to ensure that the employees and resources work toward a common purpose.
Phase 1: Constancy of purpose
Most organisations have an isolated purpose (goal), which is often to make profit, but
profit is the result and the result alone is not enough to encourage commitment of
people toward improvement. Actual commitment towards improvement requires a
constancy of purpose that promotes a culture and environment in which affected
people can contribute to the purpose; constancy of purpose is based on the strategic
responsibilities of people and is described in the vision and the mission statements.
The vision statement seeks to communicate and inspire a desired future state of the
organisation to stakeholders. The mission statement serves to inform stakeholders of
the current reason for the existence of the organisation. These statements must be
based on the values and beliefs of the organisation to provide a common foundation
for focused and consistent behaviour of an improvement culture, in an environment
where participants understand their roles to feel more secure within the organisation.
Phase 2: Long-term strategic management
Constancy of purpose calls for long-term commitment to continuous improvement
and organisational wide participation to achieve the purpose. Patience is required
because continuous improvement is an incremental approach that strives to develop
the organisation and accomplish the desired future state as described in the vision
statement. The vision must always be considered when decisions are made; even
when a crisis initiates improvement, solutions must be based on long-term strategies.
Management can sometimes be forced to make decisions even at the expense of
short-term financial goals; decisions must always support organisational growth and
the alignment of people and resources towards the desired future state. This shows
dedication to employees and secures their place in the future of the organisation,
which encourages them to commit to the development of an improvement culture.
Stellenbosch University https://scholar.sun.ac.za

Chapter 6 The theory of perspective Industrial Engineering
Page 143
Phase 3: Continuous improvement culture
People tend to seek perfection when improvement activities are developed. This is
known as the utopia syndrome, and is an inhibitor of continuous improvement. The
search of perfection slows down execution of improvement activities and it also leads
to fear of failure. However, people must embrace the risk of failure as an opportunity
to learn and develop new solutions; frequent small changes with the risk of failure are
considered better than stagnation without risks. This approach requires a culture of
continuous improvement to support and execute incremental improvement activities.
Cultural change takes time and requires development of the perception that people
have about incremental improvement. Even though cultural change is not the explicit
focus of this roadmap, the methods that are discussed do contribute to a change in
the culture. Experience in the responsibilities for continuous improvement can also
strengthen the culture itself. The culture is responsible to understand the systems,
make decisions through consensus, solve problems, and reflect on their actions.
The systems within the organisation must be understood to enable identification and
analysis of problems and improvement opportunities. Direct observation is important
to understand the actual situation at operational level. Even top management must
practise direct observation because remote analysis on basis of theoretical standards
or reported data does not always provide a true reflection of the actual situation.
Once the system is understood at operational level decisions can be made with
regards to improvement. These decisions must include the affected people and
consider several options for improvement. This approach broadens the solution base
and gives participants ownership of ideas; however, this can consume a lot of time.
The culture must also strive to solve system problems as part of improvement. This
approach relies on reactive actions and fundamental actions. Reactive actions are
required to maintain the system at its current level of performance; and fundamental
actions are required to improve the system beyond its current level of performance.
After improvement actions are executed, reflection must be used to learn from the
experience. Even when actions resulted in failure, reflection can be used to develop
effective countermeasures. The act of reflection is considered an attitude that is both
an enabler and result of successful improvement actions and forces people to learn.
Stellenbosch University https://scholar.sun.ac.za

Chapter 6 The theory of perspective Industrial Engineering
Page 144
6.1.2 People perspective
The people perspective deals with the development of the people in the organisation
and also the improvement of their work environment. People are an important asset
of the organisation and must be managed to exploit their inherent skill and intellect;
underutilisation of skill and intellect is a fundamental waste. Therefore, investment in
their development is vital to enable their successful participation in management and
improvement activities. However, before people can be included in the system their
values and beliefs must be aligned with the values and beliefs of the organisation.
The development of people, and their work environment, is also required to prepare
them for improvement. Management often focuses on only the tools and techniques
required for improvement because of their isolated perception of improvement as a
technical issue; however, the tools and techniques do not ensure success, it is the
people who use the tools and techniques who must ensure success. Therefore, the
people development focuses on the technical and the social aspects of improvement.
Phase 1: Pride and joy in workmanship
Pride and joy in workmanship is important to increase morale and performance. The
organisation must therefore emphasise openness, which encourages the free flow of
ideas and innovation to develop responsible and loyal people who want to contribute
to improvement. The creation of an open organisation is initiated through the removal
of barriers that deprive people from their right to pride and joy in workmanship.
Several barriers can inhibit the development of people within the organisation. One
significant example is work standards; other barriers are discussed throughout this
roadmap where appropriate. Work standards, not to be confused with standardised
work, provide targets based on the current method, which is not always the most
efficient method. These targets often provide numerical goals without the means to
achieve the goals, which can lead to culture of competition rather than cooperation.
Cooperation is better for continuous improvement than competition, because people
who cooperate share their knowledge and experience in order to learn from each
other, which is not possible through competition. The foundation for cooperation is an
environment of trust, mutual respect and encouragement; these are also crucial for
team based activities. Cooperation is always preferred when the aim is to improve;
competition is preferred when the aim is to win, which is often a short-term solution.
Stellenbosch University https://scholar.sun.ac.za

Chapter 6 The theory of perspective Industrial Engineering
Page 145
The final aspect of pride and joy in work is motivation. People are inspired by both
intrinsic and extrinsic motivation; not only extrinsic motivation. Intrinsic motivation is
experienced through the sheer pleasure of a specific work endeavour; management
is responsible for the development of an environment that fosters intrinsic motivation
for continuous improvement activities. Extrinsic motivation originates from the fear of
punishment or the desire for reward; this restricts the release of intrinsic motivation.
Phase 2: Knowledge, collaboration, and leadership
At this point people must be motivated and encouraged to increase their knowledge
of the system in order to support appreciation of the system and the interpretation of
experience. Knowledge can be increased through training and education. Training is
designed to introduce a new behaviour or change the current behaviour in order to
improve the performance of the current work methods. On the other hand, education
is designed to improve the competence of people beyond the current work methods.
Collaboration is considered one of the most important qualities in people; therefore,
trained and educated people must form cross-functional teams. This means that
people must be able to step outside their designated areas to support fellow team
members. Collaboration requires that people are cross-trained through job rotation in
order to create flexible teams, which coordinate work and knowledge. Job rotation
also creates focused, involved and motivated people who can perform different work.
Leaders should be selected from the teams to promote the organisational philosophy,
support operations, and teach other people. This internal selection approach ensures
that leaders understand the system at operational level, and it also encourages other
people to grow and develop their skills. Even though leadership is a crucial factor for
success, a complex leadership hierarchy is not needed because other people must
be empowered to perform some of the traditional tasks that are assigned to leaders.
Phase 3: Empowerment
Empowerment provides people at the lowest appropriate level of the organisation
with the authority to use their own judgment and make decisions within the context of
best practice methods. Although empowerment starts with leadership, it relies on the
commitment of the people closest to the process. Empowerment is an inherent part
of this roadmap and crucial for improvement; management must therefore encourage
people to make improvement suggestions and execute basic improvement activities.
Stellenbosch University https://scholar.sun.ac.za

Chapter 6 The theory of perspective Industrial Engineering
Page 146
6.1.3 Process perspective
The process perspective deals with the interdependent and interrelated operations
that consume resources (time, machines, equipment, labour, and the environment) to
transform inputs (data, materials, and components) into outputs toward a common
goal. These operational steps can be defined, documented, analysed, and improved.
The problem with process perception is that people often think of processes in terms
of production, but processes exist in every function of the organisation. First, core
processes create physical products or services, which must be distributed to the
customer. Second, support processes control resources and the infrastructure that
the core processes require for operation. Third, management processes are used to
control other processes to ensure effective and efficient operation. Management is
responsible to optimise the three different kinds of processes toward a common goal.
Phase 1: Process orientated view
The traditional functional orientated management view relies on a formal hierarchical
structure that strives to manage and optimise individual function or operations. This
approach enables people to specialise in a specific field of expertise, which requires
a larger workforce in order to cover all function. Furthermore, the optimisation of
individual functions can lead to suboptimisation and harm the system. Therefore, a
different management view is required for the holistic optimisation of the process.
Holistic optimisation of the system needs a process orientated management view that
relies on knowledge of operational interdependencies to align customer requirements
with process specifications. This view focuses on what needs to be done and how to
do it within the boundaries of organisational values and beliefs. Management must
break down barriers between functions to create flexible processes that encourage
cooperation, communication, and cross-functional optimisation of the entire system.
Phase 2: Appreciation of the system
Appreciation of the system is the comprehension of the complex interaction between
the people and processes that work together toward a common goal. Management
must understand and integrate the interdependent components of the system, which
can lead to suboptimisation of individual components in order to optimise the system
as a whole. Therefore, appreciation of the system focuses on the process and the
results; not only results. This appreciation can be improved with visual management.
Stellenbosch University https://scholar.sun.ac.za
Chapter 6 The theory of perspective Industrial Engineering
Page 147
Visual management must be implemented to create transparent processes, with no
hidden problems. Transparent processes are important to communicate information
to a large group of people at once. The purpose of this is to affect the behaviour of
people and improve their appreciation of the system in order to commit them toward
improvement. Visual management is often implemented through charts, graphs, and
poster that show the relevant information at the relevant locations. These must be
maintained with updated information to act as focal points for performance reviews.
Phase 3: Stable processes
A stable process is a basic requirement for process improvement; a stable process is
defined as one that is capable to produce consistent results over time. Advantages of
this include predictable performance, accurate improvement measures, and a more
flexible process that can adapt to varied customer requirements. An unstable process
can be indicated through direct observation of inconsistent work methods and a high
degree of variation in process performance. High variation in a process can occur
because there are no standardised work methods, and the amount of time it takes to
perform a specific operation varies from person to person, across shifts, or over time.
Standardisation is the first step toward direct process improvement. Standardised
work enforces stable and repeatable methods with the aim to maintain constant and
predictable process outputs. The people closest to the work must be empowered to
use the SDSA cycle in order to contribute toward standardisation because of their
experience and knowledge of the specific process. This also encourages consistent
behaviour and performance of people throughout the organisation. Standardised
work must always be improved through the development of more efficient methods.
The antithesis of standardised work is variation. Unstable processes are the result of
high variation and must be standardised to be improved. However, the definition of
variation implies that a process is not able to be standardised. This paradox makes it
seem that the improvement of unstable processes is impossible, but this just means
that unstable processes must be improved with an incremental cycle that isolates
and removes some variation through the implementation of new methods, the new
methods are then standardised, and the cycle is repeated with a smaller focus. Every
time the cycle is repeated a new baseline is created to distinguish between standard
work and nonstandard work. Visual management can be used to support this cycle.
Stellenbosch University https://scholar.sun.ac.za

Chapter 6 The theory of perspective Industrial Engineering
Page 148
6.2 First intermission: Reflect and prepare
The purpose of this intermission is twofold. First, management must ensure that the
people and the processes are aligned toward the philosophy. Second, management
must prepare the PDCA cycle for actual improvement implementation. The methods
that are mentioned to support each perspective are discussed in the literature study.
6.2.1 Reflect on the organisational perspective
At this point management must believe in a long-term commitment toward continuous
improvement in order to realise constancy of purpose. Systems must also be in place
for the development and empowerment of people. Furthermore, people must have an
appreciation of the system and also understand the importance of stable processes.
Table 6.2: Summarised organisational perspective
Perspectives Phases
Philosophy
1. Constancy of purpose
2. Long-term strategic management
3. Continuous improvement culture
People
1. Pride and joy in workmanship
2. Knowledge, collaboration, and leadership
3. Empowerment
Process
1. Process orientated view
2. Appreciation of the system
3. Stable processes
6.2.2 Prepare the PDCA cycle
The PDCA cycle is fundamental for the implementation of the perspectives discussed
throughout the rest of the roadmap. The methods (tools and techniques) in the PDCA
cycle are flexible; so when the cycle is executed it is crucial to focus on the intent of
each step, and not the methods, as these can be interchanged to support the intent.
The PDCA cycle is discussed in detail in Chapter 6. Furthermore, six additional tools
and techniques are included in order to enhance the cycle. First, the six thinking hats
technique can be used in order to support idea generation. Second, measurement
system analysis must be considered to ensure stable, unbiased, linear, impartial, and
precise data collection. Third, Pareto analysis is an extension of a histogram. Fourth,
reflection must be used in order to learn from pilot improvement. Fifth and six, visual
management and standardisation must be implemented to maintain improvements.
Stellenbosch University https://scholar.sun.ac.za
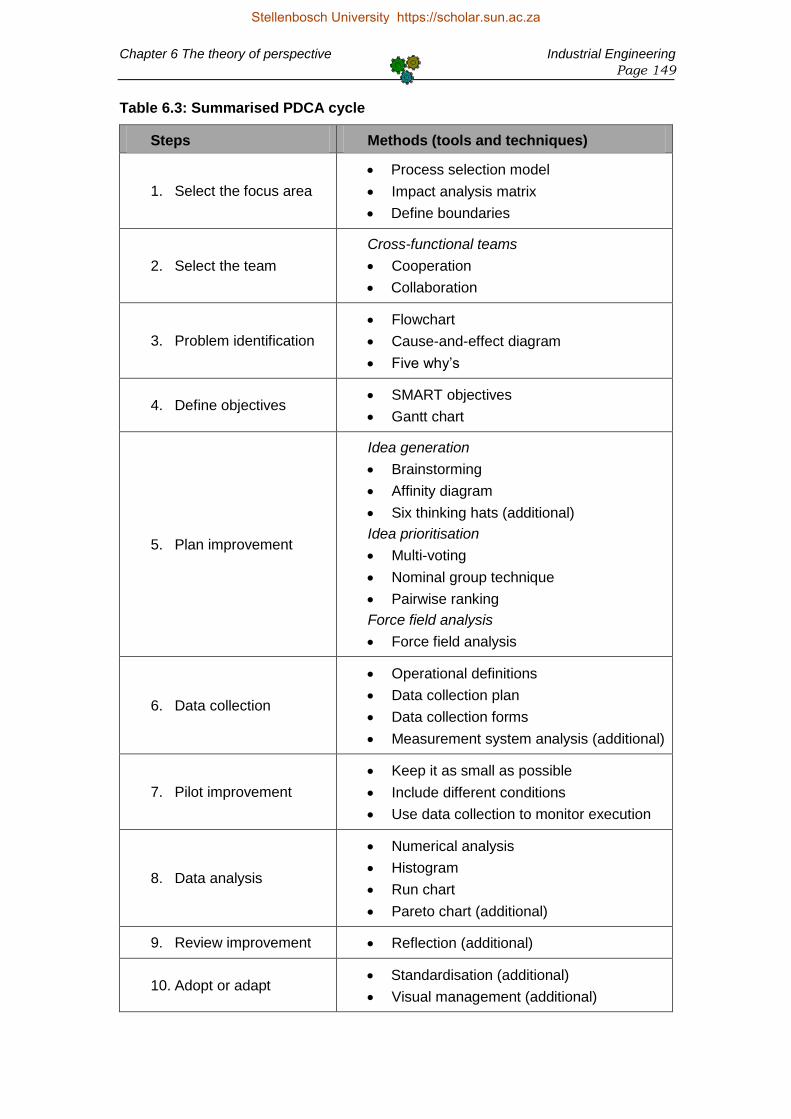
Chapter 6 The theory of perspective Industrial Engineering
Page 149
Table 6.3: Summarised PDCA cycle
Steps Methods (tools and techniques)
1. Select the focus area
Process selection model
Impact analysis matrix
Define boundaries
2. Select the team
Cross-functional teams
Cooperation
Collaboration
3. Problem identification
Flowchart
Cause-and-effect diagram
Five why’s
4. Define objectives SMART objectives
Gantt chart
5. Plan improvement
Idea generation
Brainstorming
Affinity diagram
Six thinking hats (additional)
Idea prioritisation
Multi-voting
Nominal group technique
Pairwise ranking
Force field analysis
Force field analysis
6. Data collection
Operational definitions
Data collection plan
Data collection forms
Measurement system analysis (additional)
7. Pilot improvement
Keep it as small as possible
Include different conditions
Use data collection to monitor execution
8. Data analysis
Numerical analysis
Histogram
Run chart
Pareto chart (additional)
9. Review improvement Reflection (additional)
10. Adopt or adapt Standardisation (additional)
Visual management (additional)
Stellenbosch University https://scholar.sun.ac.za
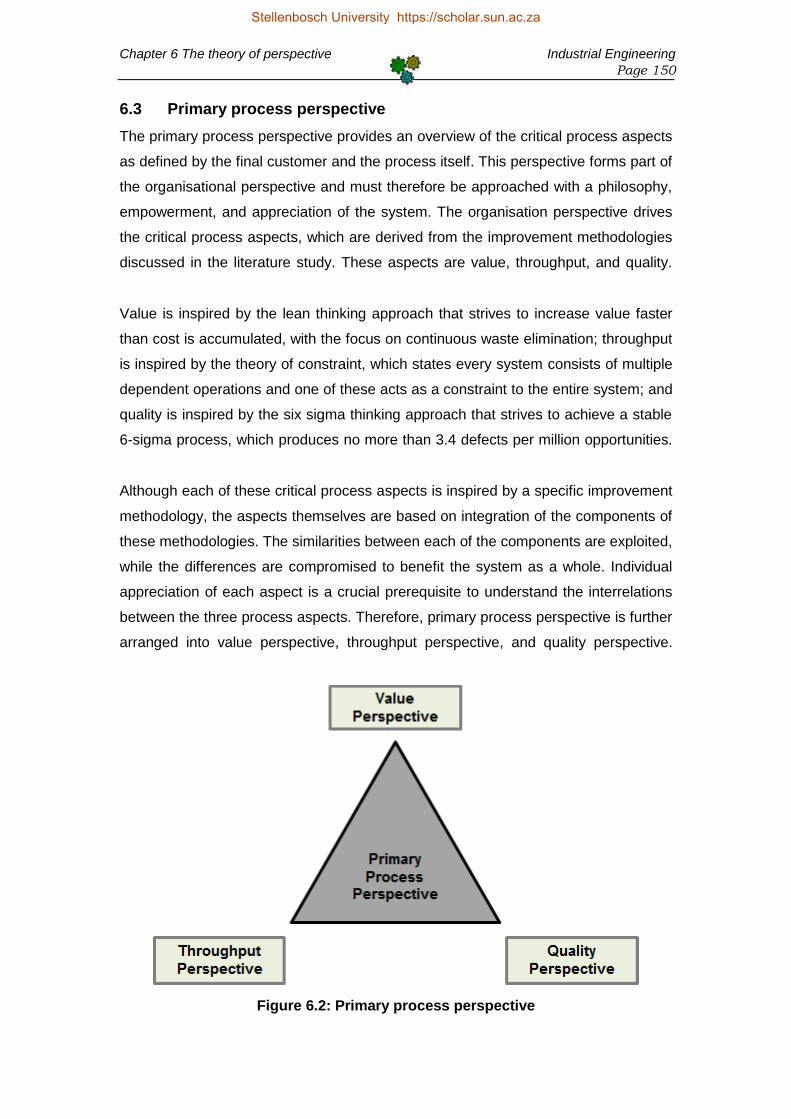
Chapter 6 The theory of perspective Industrial Engineering
Page 150
6.3 Primary process perspective
The primary process perspective provides an overview of the critical process aspects
as defined by the final customer and the process itself. This perspective forms part of
the organisational perspective and must therefore be approached with a philosophy,
empowerment, and appreciation of the system. The organisation perspective drives
the critical process aspects, which are derived from the improvement methodologies
discussed in the literature study. These aspects are value, throughput, and quality.
Value is inspired by the lean thinking approach that strives to increase value faster
than cost is accumulated, with the focus on continuous waste elimination; throughput
is inspired by the theory of constraint, which states every system consists of multiple
dependent operations and one of these acts as a constraint to the entire system; and
quality is inspired by the six sigma thinking approach that strives to achieve a stable
6-sigma process, which produces no more than 3.4 defects per million opportunities.
Although each of these critical process aspects is inspired by a specific improvement
methodology, the aspects themselves are based on integration of the components of
these methodologies. The similarities between each of the components are exploited,
while the differences are compromised to benefit the system as a whole. Individual
appreciation of each aspect is a crucial prerequisite to understand the interrelations
between the three process aspects. Therefore, primary process perspective is further
arranged into value perspective, throughput perspective, and quality perspective.
Figure 6.2: Primary process perspective
Stellenbosch University https://scholar.sun.ac.za

Chapter 6 The theory of perspective Industrial Engineering
Page 151
6.3.1 Value perspective
The value perspective deals with customer perceived value added activities. This
perspective is to the process as philosophy is to the organisation. The purpose of
value addition and creation is to provide the final customer with what is requested,
when it is requested it, in the format that it is request. Value can therefore be added
or created in terms of time, place, or form. All the improvement activities must focus
on these aspects of value with the purpose to increase customer satisfaction, and to
eliminate or reduce the activities that does not add or create value. Feedback from
the final customers is therefore important to understand their perception of value so
that the organisational resources can be aligned to achieve customer expectations.
Phase 1: Value stream creation
The long-term success of an organisation depends on its ability to meet the needs of
its customers based on their perception of value. When the process serves various
customers, improvement activities must focus on the customers that provide the most
revenue. The needs of these customers must be identified, as well as the processes
that create or add value to achieve those needs. Customer feedback can come from
reactive sources, such as customer complaints, sales information, technical support,
warranty claims, and returns; on the other hand, proactive sources can also provide
additional information from interviews, surveys, market research, and observations.
Once the customers are identified a SIPOC analysis can be executed to document
the process that serves these customers. This high level process map can be further
refined with a flowchart. The flowchart must then be used to analyse the operations
in terms of their contribution to value. First, determine what operations are required to
create or add actual value to the product. Second, determine what operations do not
create or add value, but are required to support the value added operations; these
include operations such as maintenance and administration. Third, determine what
operations do not create or add value, and are not required to support value added
operations. These non-value added operations are wasteful and must be eliminated.
Phase 2: Extended 5-S movement
After the wasteful operations are eliminated, improvement focus must shift to waste
within the value added, and non-value added but required, operations. There are
certain fundamental concepts such as orderliness, cleanliness and discipline, which
can be implemented through the 5-S movement to initiate waste elimination activities.
Stellenbosch University https://scholar.sun.ac.za
Chapter 6 The theory of perspective Industrial Engineering
Page 152
The 5-S movement combines the collective talents of people in order to encourage a
culture of improvement with the empowerment of individuals and small groups. This
approach is often demeaned because it is so simple, but a simple approach is ideal
to empower people and let them contribute to the organisation through suggestions
and the implementation of practical and low cost incremental improvements. The five
elements of the 5-S movement are sort, set in order, shine, standardise, and sustain.
The extended 5-S movement has an additional element: simplify. Before the usual
five elements are executed, the operations must first be simplified in order to ensure
that the focus of the 5-S movement is on the appropriate activities. Simplification is
used to challenge the activities in order to determine what activities can be eliminated
or combined, how the sequence or location of activities can change, if it is possible to
remove the person that does the activities, and how these activities can be improved.
Phase 3: Throughput accounting
Dr. Eliyahu Goldratt identified throughput, investment, and operating expense as the
three basic measures that can be applied across organisational functions to monitor
improvements. These measures can also be used to calculate net profit, return on
investment, and productivity. The goal of most organisations is to increase net profit,
which is calculated as throughput minus operating expense; throughput is calculated
as sales minus total variable cost, and operating expense is calculated as all the
expenses used to transform inventory into throughput, minus the cost of raw material.
The calculation of net profit shows that there are two opportunities for improvement:
either increase throughout or reduce operating expense. Waste elimination activities
are therefore executed to focus on the reduction of operating expense and inventory,
which is a variable cost. However, waste elimination activities focus on a finite pool of
resources and can lead to capacity cutbacks. These activities can also discourage
cooperation because people are expected to do more work with fewer resources.
Net profit should therefore be increased with throughput, and in effect value creation,
which has a theoretical potential for infinite growth. Operating expense and inventory
must first be used to protect throughput. So once the minor wastes are reduced with
the 5-S movement, improvements must focus on the constraint that limits throughput.
The PDCA cycle must be executed at least once for the perspective to be completed.
Stellenbosch University https://scholar.sun.ac.za
Chapter 6 The theory of perspective Industrial Engineering
Page 153
6.3.2 Throughput perspective
The throughput perspective deals with the alleviation of system constraints to ensure
maximum rate of production. The system can be viewed as a chain of interdependent
links that work together toward a common goal. Overall performance of the chain is
governed by the strength of the weakest link. Therefore, improvement activities that
do not focus on the weakest link are considered to be wasteful. This is important to
understand because organisations consist of complex systems with an almost infinite
number of improvement opportunities, which must be executed with a limited amount
of resources; resources must therefore be focused on the fundamental opportunities.
The chain analogy provides inherent prioritisation of the fundamental opportunities,
because the weakest link must always be the focus of improvement activities. This
link is known as the constraint and is responsible for the prevention of maximum
process throughput. The constraint can either be external or internal, but external
constraints such as the vendor or market are not within the scope of this roadmap;
internal constraints are located in the organisation because of operations with limited
capacities that govern flow. Throughput is therefore defined in this perspective as the
rate of production, and does not consider sales as defined in the value perspective.
Phase 1: Constraint exploitation
The system has one immediate constraint that must be identified and exploited in
order to streamline operations and improve throughput. Various basic techniques can
be utilised for constraint identification, but the most effective technique is to find the
operation with the longest cycle time; this is the operation with the lowest throughput.
Exploitation activities can be initiated once the constraint is identified; standardised
work, visual management, and the 5-S movement provided the foundation for these
activities. The constraint must be made transparent so that people know where to
focus their attention. Exploitation activities must only use available resources and
people in order to decrease the workload or increase the throughput of the constraint.
Decrease the workload of the constraint through the elimination of insignificant work,
or work that can be performed by other operations; even if these operations are less
efficient, the workload of the constraint is reduced to increase throughput. Then make
sure that the input to the constraint is free of defects, and also that the output of the
constraint is within conformance; quality is discussed in detail in the next perspective.
Stellenbosch University https://scholar.sun.ac.za

Chapter 6 The theory of perspective Industrial Engineering
Page 154
Increase the throughput of the constraint with more efficient practices. The simplest
approach is to ensure that the most productive and skilled person is assigned to the
constraint. Also train several people in the skills required for constraint operation to
guarantee a functional constraint even when some people are absent. Furthermore,
continue to execute standardised work, visual management, and the 5-S movement.
Phase 2: Process flow
Process flow is important to support the constraint and to encourage additional waste
elimination activities. Operations must therefore be connected in terms of physical
location and information so that work can be passed from one operation to the next
without wasteful activities such as transport and delays. However, these connections
lead to operations that are more dependent on each other; so when one operation
shuts down, the next also shuts down. This creates a certain amount of discomfort,
but it also creates a process in which people are forced to think and solve problems.
Process flow should run on an unbalanced schedule. The purpose is to ensure that
other operations support the constraint with their additional capacity. This means that
scheduled work must be performed as fast as possible when orders are received.
Once an operation is completed the operator can clean the work area, help other
team members, or execute other improvement activities. Some people attempt to
balance resources to takt time, which is the minimum rate of production required to
meet customer demand, but the problem with this approach is that every operation in
the process can become the constraint if there is variation in the process, demand or
products. Take note that resource utilisation must be optimised, and not maximised.
Phase 3: Kanban pull system
The kanban pull system is used to control the flow of work through the process based
on customer consumption. This system produces what is needed, based on a signal
(kanban) that connects information between operations. The purpose of the kanban
pull system is to replenish buffers between operations with the same amount of work
that was removed. These buffers are used to protect the process from variation and
minimise overproduction, which is often used to compensate for problems that might
surface when flow is created. Inventory buffers are therefore a waste, which must be
removed once a predictable degree of variation is reached and the process is stable.
The PDCA cycle must be executed at least once for the perspective to be completed.
Stellenbosch University https://scholar.sun.ac.za
Chapter 6 The theory of perspective Industrial Engineering
Page 155
6.3.3 Quality perspective
The quality perspective deals with the management of variation in order to reduce the
difference between process specifications and actual process performance. Quality is
a concept that continues to develop. In the past, quality was defined as conformance
to valid customer requirements. This basic definition is known as the goalpost view of
quality and states that output is considered good as long as it falls within acceptable
limits, called specification limits, around a desired value, called the nominal value or
target value. Dr. Genichi Taguchi further refined this concept and defined quality as a
predictable degree of uniformity and dependability, at low cost, suited to the market.
Phase 1: Theory of variation
Walter A. Shewart stated that variation is inherent to all processes; variation is also
considered the antithesis of standardisation. However, organisations are forced to
make decision based on observations and measures that are influenced by variation;
therefore, variation is an important concept that must be understood, monitored, and
controlled. Shewart categorised variation as either common cause or special cause.
Common cause variation is a result of the inherent design and structure of a system
and should be isolated and reduced by management. Special cause variation is the
result of external factors that arise because of specific circumstances, and should be
detected and corrected by the people that perform the work. A process that does not
exhibit special cause variation is stable; that is, it is in a predictable state of variation.
There are two fundamental types of mistakes people make in the pursuit of a stable
process. The first mistake, called tampering, is to treat common cause variation as
special cause variation and adjust the system; this is by far the more frequent of the
two mistakes. The second mistake is to treat special cause variation as common
cause variation and accept the problem. Differentiation between the types of variation
is therefore important so that the appropriate actions can be taken for improvement.
Phase 2: Quality consciousness
Once the people in the organisation are aware of the theory of variation, the quality
consciousness of the organisation can be determined through the manner in which
the organisation deals with variation in the process. Mass inspection and control
charts are used to support and advance through the different quality consciousness
levels, which are defect detection, defect prevention, and continuous improvement.
Stellenbosch University https://scholar.sun.ac.za

Chapter 6 The theory of perspective Industrial Engineering
Page 156
Defect detection relies on mass inspection to detect and remove defectives, because
defects in output are expected at this level of quality consciousness. This approach
removed defectives from the process without consideration of how to avoid future
problems and decrease variation; there is no additional feedback that supports the
identification of improvement opportunities. The cost of inspection can be minimised
with the kp rule, but the organisation must start to promote the use of control charts.
Defect prevention strives to produce predictable output within specification limits in
order to produce zero defects. This is the goalpost view of quality and is supported
with attribute control charts, which are used for the identification of variation between
the number or proportion of defects and defectives. The problem with this approach
is that people think the process is stable when zero defects are produced; however,
variation is inherent even to stable processes, so improvement must be continuous.
Continuous improvement is the constant reduction of process variation, even within
specification limits, to further reduce the difference between process requirements
and process performance. This is the Taguchi view of quality and is supported with
variable control charts, which are used for the identification of unit-to-unit variation;
more information is collected with this approach. The purpose is to reduce common
cause variation within stable processes in order to compensate for inherent variation.
Phase 3: Baseline measure
Once the process is stable a performance baseline is needed as a reference point to
track improvement activities. Quality measures include defect rate and process yield.
Defect rate is the proportion of nonconformances that occurred. Nonconformances
are characteristics that do not perform within specification limits; each characteristic
provides a defect opportunity. Defect rate can be calculated in terms of defects per
million opportunities, which is also used to determine the sigma level of the process.
Process yield is complementary to the defect rate and is defined as the proportion of
units that perform within specification limits. This measure can be calculated in terms
of first pass yield or throughput yield. First pass yield is used to establish a baseline
for current performance and throughput yield is used to predict future performance.
The PDCA cycle must be executed at least once for the perspective to be completed.
Stellenbosch University https://scholar.sun.ac.za
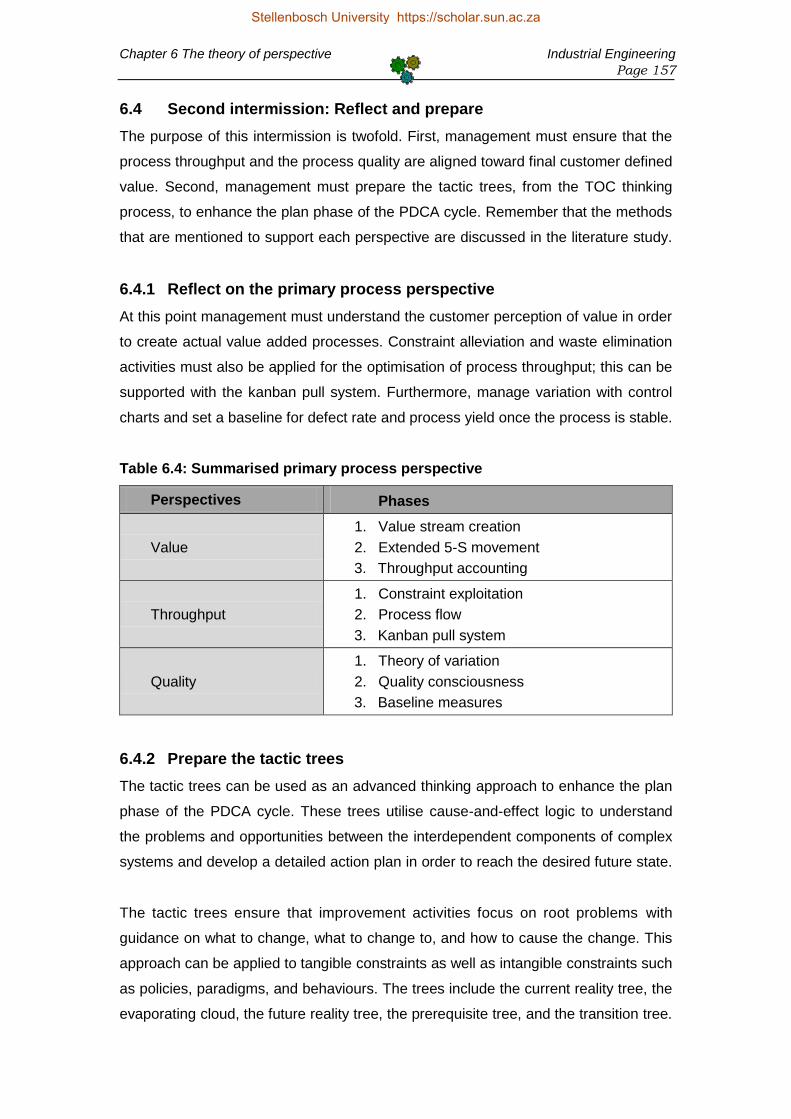
Chapter 6 The theory of perspective Industrial Engineering
Page 157
6.4 Second intermission: Reflect and prepare
The purpose of this intermission is twofold. First, management must ensure that the
process throughput and the process quality are aligned toward final customer defined
value. Second, management must prepare the tactic trees, from the TOC thinking
process, to enhance the plan phase of the PDCA cycle. Remember that the methods
that are mentioned to support each perspective are discussed in the literature study.
6.4.1 Reflect on the primary process perspective
At this point management must understand the customer perception of value in order
to create actual value added processes. Constraint alleviation and waste elimination
activities must also be applied for the optimisation of process throughput; this can be
supported with the kanban pull system. Furthermore, manage variation with control
charts and set a baseline for defect rate and process yield once the process is stable.
Table 6.4: Summarised primary process perspective
Perspectives Phases
Value
1. Value stream creation
2. Extended 5-S movement
3. Throughput accounting
Throughput
1. Constraint exploitation
2. Process flow
3. Kanban pull system
Quality
1. Theory of variation
2. Quality consciousness
3. Baseline measures
6.4.2 Prepare the tactic trees
The tactic trees can be used as an advanced thinking approach to enhance the plan
phase of the PDCA cycle. These trees utilise cause-and-effect logic to understand
the problems and opportunities between the interdependent components of complex
systems and develop a detailed action plan in order to reach the desired future state.
The tactic trees ensure that improvement activities focus on root problems with
guidance on what to change, what to change to, and how to cause the change. This
approach can be applied to tangible constraints as well as intangible constraints such
as policies, paradigms, and behaviours. The trees include the current reality tree, the
evaporating cloud, the future reality tree, the prerequisite tree, and the transition tree.
Stellenbosch University https://scholar.sun.ac.za
Chapter 6 The theory of perspective Industrial Engineering
Page 158
The current reality tree is a logical structure which represents the current state of a
process in terms of the most probable chain of cause and effect conditions that lead
to the core conflicts, or problems. This tree is an effective tool to motivate the need
for improvement and also to determine where to start with improvement activities
when an extensive list of problems exists. All the undesirable effects are identified
and traced back to their root causes, which are responsible for the current problems.
The evaporating cloud (conflict resolution diagram) is an analytical structure used to
achieve mutual consensus in search of plausible solutions to the inherent conflicts of
the core problems. This approach focuses on the development of future conditions or
actions that aim to overcome the inherent assumptions that prevent the achievement
of organisational objectives. The evaporating cloud can also be used when previous
solutions failed or new solutions violate current policies, paradigms, or behaviours.
The future reality tree represents the future state of a system, which is achieved with
the implementation of actions that are designed to eliminate or reduce undesirable
effects. This tree also requires consideration and incorporation of negative outcome
scenarios in order to further explore solutions and ensure that undesirable effects are
replaced with desirable effects. The purpose is to ensure the proposed solution will in
fact resolve the unwanted system conditions without the creation of new problems.
The prerequisite tree is used to describe the necessary condition relationships that
are required for the implementation of improvement actions. This is an effective tool
that can be used for the development of an implementation roadmap to overcome the
obstacles that are associated with complex solutions and procedures. The purpose is
to establish intermediate objectives for the allocation and coordination of resources
and people in order to deal with these obstacles and improve the process as a whole.
The transition tree provides the final implementation plan that represents the actions
required to implement the selected improvement ideas. This action plan is used to
create a shared vision that communicates and rationalises improvement activities in
order to move from the current state to the desired and improved future state. The
transition tree is also effective for high risk situations because the negative outcomes
are considered and mitigated, or avoided, to ensure successful improvement actions.
Stellenbosch University https://scholar.sun.ac.za

Chapter 6 The theory of perspective Industrial Engineering
Page 159
6.5 Secondary process perspective
The secondary process perspective provides an overview of the connections between
the critical process aspects. These connections integrate the critical process aspects
and exploit their benefits further, in synergy with each other, because these benefits
cannot be exploited in isolation to optimise the system as a whole. These connections
are effectiveness, agility, and efficiency. Therefore, secondary process perspective is
arranged into effectiveness perspective, agility perspective, and efficiency perspective.
Effectiveness connects value and quality. This connection focuses on the successful
production of a desired output and on the alignment of the process defined quality
characteristics in order to create customer perceived value. The aim of the connection
is to reduce the difference between customer specifications and process performance.
Agility connects value and throughput. This connection focuses on the rapid adaption
of the process to changes in customer demand and the business environment. The
aim of the connection is to make the process flexible through the use of a levelled
production schedule, to shorten process the lead time even when variation occurs.
Efficiency connects throughput and quality. This connection focuses on the internal
operations that contribute to process flow and the performance of process defined
quality characteristics. The aim of the connection is to further focus improvement
activities on internal constraint alleviation once the process is aligned to create value.
Figure 6.3: Secondary process perspective
Stellenbosch University https://scholar.sun.ac.za

Chapter 6 The theory of perspective Industrial Engineering
Page 160
6.5.1 Effectiveness perspective
The effectiveness perspective deals with the successful production of a desired or
intended output in order to reduce the difference between customer specifications
and actual process output. Therefore, the customer specifications must be understood
and analysed so that improvement activities can be focused on the influential input
characteristics to the process. So this perspective is executed with the end in mind.
Effectiveness is measured in terms of how successful the customer specifications are
satisfied. This means that effectiveness differentiates between quality characteristics
in order to produce characteristics that are significant to the final customer. However,
effectiveness relies on internal operations; therefore, characteristics that influence
these operations, and the customer, must be identified for improvement opportunities.
Phase 1: VOC to CTQ analysis
The first step towards improvement of process effectiveness is to transform customer
specifications into quality characteristics. Customer specifications, derived from the
voice of the customer, must be organised with the Kano model in order to determine
the characteristics that can be used for critical to quality characteristic identification.
The voice of the customer provides the characteristics that are the main drivers for
customer satisfaction. These characteristics can be defined in terms of cost, time,
quality, safety, and other specific customer requirements. The voice of the customer
information can be collected from customer complaints, interviews, sales, technical
support, warranty claims, returns, surveys, market research, and direct observations.
The Kano model is used to analyse and organise the voice of the customer data in
order to determine the effect of specific characteristics on different levels of customer
requirements. The levels of requirements are defined as specifications, expectations,
and delighters. This approach is crucial for detailed analysis of requirements because
customers often express their requirements in a colloquial and imprecise manner.
Critical to quality characteristic identification is crucial for the selection of appropriate
improvement opportunities that will have a significant and positive impact on customer
satisfaction. These characteristics are derived from customer requirements and must
be understood to ensure improvement focuses on the influential aspects. This requires
operational definitions to drive the behaviour of people and to monitor improvements.
Stellenbosch University https://scholar.sun.ac.za

Chapter 6 The theory of perspective Industrial Engineering
Page 161
Phase 2: Cause and effect matrix
Once the critical to quality characteristics that influence the customer are identified,
the input measures that influence the process must be identified. This is crucial in
order to make a connection between customer value and process quality. The input
characteristics, together with the relevant critical to quality characteristics, must be
measured to create a baseline in order to monitor and control improvement activities.
The cause and effect matrix can be used to determine and select the relevant input
characteristics that influence the process and the outcome to the customer. This matrix
is often required when the process has multiple critical to quality characteristics; each
of the significant input measure can then be identified through their correlation with the
relevant quality characteristics, to determine the influence of the input characteristics.
Phase 3: Input-output correlation
The final phase is to determine the influence of the critical input characteristics on the
relevant output characteristics; this influence is known as the correlation between the
characteristics. Correlation is a crucial measure to ensure that improvement activities
focus on the appropriate process characteristics that have a significant and positive
influence on customer satisfaction. Therefore, input and output characteristics must be
measured at the same time to determine how input changes affect process output.
Once the input and output data is collected a scatter plot can be constructed. Scatter
plots pair the simultaneous measured values for two characteristics together in order
to form x-y points that describe the correlation between the two characteristics, and
also allows the identification of unusual patterns, which are the result of special causes
of variation. This graphical representation of characteristics provides information on
the amount of correlation, the direction of correlation, and the strength of correlation.
The amount of correlation describes the position of the points relative to a trend line
in order to determine if the characteristics follow a predictable pattern. The direction
of correlation describes the linear relation between the two characteristics; this can
be either positive or negative if the characteristics influence one another. The strength
of correlation describes the magnitude of the effect that one characteristic has on the
other. This information can also be represented with detailed statistical calculations.
The PDCA cycle must be executed at least once for the perspective to be completed.
Stellenbosch University https://scholar.sun.ac.za
Chapter 6 The theory of perspective Industrial Engineering
Page 162
6.5.2 Agility perspective
The agility perspective deals with the rapid adaption of the process to changes in
customer demand and the business environment. This means that the production
schedule must be flexible in order to create value even when variation in customer
demand occurs. The production schedule must let work flow through the process in
accordance to a pull system that provides value when it is required by the customer.
Phase 1: Continuous flow
Continuous flow, also called one-piece flow, is the rapid and uninterrupted step-by-step
movement of material or information through a system with minimal delays and the
shortest travel distance. Continuous flow aims to increase value added activities and
production throughput, but it also forces problems to the surface in order to improve
the process and develop the people. Although flow is not always practical because of
variation in the process and demand, it provides many opportunities for improvement.
There are several advantages to continuous flow. First, defects are easier detected
and fixed in smaller batches. Second, processes are more flexible because of shorter
lead times. Third, operations are pushed together to improve floor space utilisation
and encourage waste elimination. Fourth, employee morale increases because of
transparent operations and visible improvement. Fifth, standard procedures and an
organised environment reduce the likelihood and severity of hazardous occurrences.
Phase 2: Load levelling
Level the workload over a period of time, rather than to produce output in relation to
the actual fluctuation of customer demand. This is important because customers do
not submit orders for specific batch sizes, even though batch production is the norm,
and variation of customer demand causes overburden and unevenness. Overburden
is the assignment of unreasonable stress or effort to a person, piece of equipment, or
machine. Unevenness is the presence of variation that leads to unbalanced situations.
Production of smaller batches that are aligned with actual customer consumption must
be considered when one-piece flow is not practical. This approach should focus on a
levelled production volume and mix in order to level out the total demand on people,
equipment, and suppliers. The three inputs to considered for a levelled schedule are
built-to-stock, built-to-order, and the amount of buffer stock required to maintain the
constraint. Note that single minute exchange of die is crucial for this to be successful.
Stellenbosch University https://scholar.sun.ac.za

Chapter 6 The theory of perspective Industrial Engineering
Page 163
Phase 3: Drum-buffer-rope method
The drum-buffer-rope method has two functions. First, work flow is regulated through
the constraint in order to produce what is needed, when it is needed; understand that
this pull system is contrast to the push system, which releases work into the process
as demand is predicted or as work becomes available. Second, non-constraints are
subordinated to the constraint in order to create value, even when variation is present.
The drum is the capacity constraint of the process, which provides a beat (cycle time)
to which other operations can be subordinated. Subordination is important to ensure
that the constraint always operate at or near full capacity, because an hour lost at the
constraint is an hour lost for the total system. The drum also provides the opportunity
for a visual control point that can be used to focus improvement activities and also to
maintain a levelled production schedule in order to ensure consistent process output.
The buffer is used to compensate for process variation. This buffer is measured in
units of time, which schedule material release; material is released into the system at
fixed time intervals in order to arrive at the constraint some period of time prior to its
scheduled start. A second buffer is also used between shipment and the constraint in
order to create a control point for a levelled work schedule. Furthermore, when the
process is unstable a protective buffer (Kanban) can be placed in front of the constraint.
The rope is a signal that is generated, when there is a pull from the customer, in
order to communicate and schedule the release of work into the process at a certain
time as dictated by the buffer; the kanban pull system is analogous to a series of
short “ropes”. A larger buffer can therefore be used to release work into the process
earlier than required in order to compensate for variation between operations. This
subordinated schedule ensures flow, without the accumulation of excess inventory.
The drum-buffer-rope method is used to release material into the process, at fixed
time intervals, with the amount of work that the customer requested. This creates an
unbalanced production line, which allows non-constraints to ensure smooth operation
of the constraint even in a system with high variation and product mixes. This method
is opposite to the inventory based kanban pull system, but the kanban system is still
useful when the process is unstable. However, a large kanban is considered a waste.
The PDCA cycle must be executed at least once for the perspective to be completed.
Stellenbosch University https://scholar.sun.ac.za

Chapter 6 The theory of perspective Industrial Engineering
Page 164
6.5.3 Efficiency perspective
The efficiency perspective deals with the successful execution of operations in the
shortest possible time and at the highest appropriate level of quality. This means that
the process must produce output within specification limits, with the minimum amount
of resources. At this point the process must be aligned with the final customer, which
is the end of the process, so this perspective is considered a means to the end. The
focus of this perspective is therefore on the crucial factors that influence the constraint
and the process as a whole, without direct consideration of customer specifications.
Phase 1: Constraint elevation
Constraint elevation relies on large investment in resources in order to eliminate the
immediate constraint with the execution of substantive improvement activities. These
activities should therefore only be executed when the primary process perspective is
implemented and constraint exploitation and subordination of non-constraint did not
manage to eliminate the immediate constraint. Built-in-quality and total productive
maintenance is discussed in this perspective in order to support constraint elevation.
Constraint elevation activities should ensure that the constraint operates at maximum
utilisation with the current resources. Only when demand is higher than the capacity
at maximum utilisation, additional resources and people can be acquired to increase
capacity, or some of the work can be outsourced to decrease the workload. Constraint
elevation activities must continue to decrease the workload or increase throughput until
the immediate constraint is eliminated. Performance data must therefore be analysed
in order to determine the need for investment and its effect on the process as a whole.
Phase 2: Built-in-quality
People are part of the solution, not the problem. However, people are often blamed
for problems, but problems occur because people interact with inefficient processes
and poor work methods. Continuous improvement activities must therefore focus on
built-in-quality and the decision to stop and fixed problem at the point of occurrence.
Built-in-quality is used for the detection and prevention of errors. This concept is also
crucial for the development of a culture that fixes problems at the point of occurrence,
even when production must be stopped; a stable process is therefore essential to avoid
excessive stoppages. Furthermore, build-in-quality calls for extensive support structures
and small batch production in order to improve the detection and prevention of errors.
Stellenbosch University https://scholar.sun.ac.za

Chapter 6 The theory of perspective Industrial Engineering
Page 165
Poka-yoke, which is an inherent part of built-in-quality, can be defined as a device or
procedure that eliminates conditions that introduce errors into the process, or makes
mistakes apparent for elimination. This simple concept is effective at locations where
people are responsible for a process because it prevents human errors. Poka-yoke
devices should be cost effective, part of the process, and able to provide rapid visual
feedback from where the error occurred in order to initiate immediate corrective actions.
Failure mode and effect analysis can be used for the identification and prioritisation
of built-in-quality opportunities. This approach focuses on the significant components
that can lead to failure and the impact of failure on customer satisfaction and process
performance. The three factors that must be considered are severity of the possible
effect, the occurrence probability, and the detectability of possible failures. Once these
factors are understood the highest prioritised failure opportunities can be eliminated.
Phase 3: Total productive maintenance
Total productive maintenance consists of three aspects that ensure continuous flow
and consistent performance: (1) the prevention of breakdowns with the execution of
maintenance prior to failure, (2) the simplification of maintenance activities in order to
make it easier and safer, and (3) the design of machines and equipment that requires
little or no maintenance. These aspects must be subordinated to the constraint and
the affected people must be empowered to participate in basic maintenance activities.
Overall equipment effectiveness (OEE) can be used for the analysis and evaluation
of maintenance activities. This indicator is calculated as the product of availability
rate, performance rate, and quality rate. Availability rate is the actual amount of time
that equipment is in operation versus the available time, or load time. Performance
rate is the product of the amount of units produced and the theoretical cycle time per
unit, versus the total actual production time. Quality rate is the total amount of units
that fall within process specification limits, versus the total amount of units produced.
The kanban pull system can be used to accommodate poor equipment utilisation when
operations are connected. However, realistic target values to strive toward for the
three OEE factors are an availability rate that surpasses 90%, a performance rate
above 95%, and a quality rate that exceeds 99%, in order to ensure at least 85% OEE.
The PDCA cycle must be executed at least once for the perspective to be completed.
Stellenbosch University https://scholar.sun.ac.za
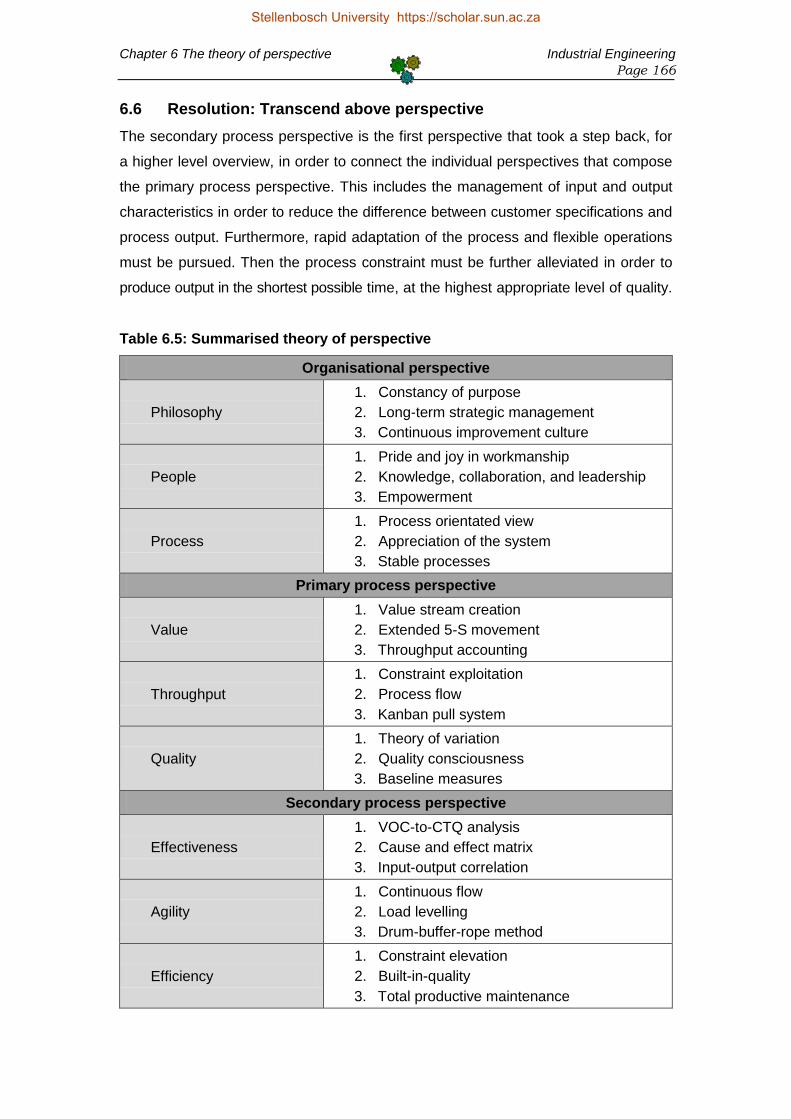
Chapter 6 The theory of perspective Industrial Engineering
Page 166
6.6 Resolution: Transcend above perspective
The secondary process perspective is the first perspective that took a step back, for
a higher level overview, in order to connect the individual perspectives that compose
the primary process perspective. This includes the management of input and output
characteristics in order to reduce the difference between customer specifications and
process output. Furthermore, rapid adaptation of the process and flexible operations
must be pursued. Then the process constraint must be further alleviated in order to
produce output in the shortest possible time, at the highest appropriate level of quality.
Table 6.5: Summarised theory of perspective
Organisational perspective
Philosophy
1. Constancy of purpose
2. Long-term strategic management
3. Continuous improvement culture
People
1. Pride and joy in workmanship
2. Knowledge, collaboration, and leadership
3. Empowerment
Process
1. Process orientated view
2. Appreciation of the system
3. Stable processes
Primary process perspective
Value
1. Value stream creation
2. Extended 5-S movement
3. Throughput accounting
Throughput
1. Constraint exploitation
2. Process flow
3. Kanban pull system
Quality
1. Theory of variation
2. Quality consciousness
3. Baseline measures
Secondary process perspective
Effectiveness
1. VOC-to-CTQ analysis
2. Cause and effect matrix
3. Input-output correlation
Agility
1. Continuous flow
2. Load levelling
3. Drum-buffer-rope method
Efficiency
1. Constraint elevation
2. Built-in-quality
3. Total productive maintenance
Stellenbosch University https://scholar.sun.ac.za
Chapter 6 The theory of perspective Industrial Engineering
Page 167
At this point management must understand the purpose and implementation of each
perspective discussed in this roadmap. The PDCA cycle should also be an inherent
part of the organisational culture in order to support and standardise improvement
activities. Management must also see improvement as the optimisation of resources,
and not as the maximisation of resources utilisation. When the roadmap is understood
and mastered improvement activities can transcend above the individual perspectives.
Transcend above perspective means that management must take another step back
for a higher level overview, as done in the secondary process perspective, in order to
view process improvement as a whole. This view can be seen as performance, which
is comprised of effectiveness, agility, and efficiency. The improvement of process
performance must be implemented with knowledge of the organisational perspective
in order to improve the organisation as a whole. This nonlinear approach relies on
management to sustain improvements, exploit opportunities, and pursue perfection.
The improvements that were implemented throughput the roadmap, as well as future
improvements, must be sustained. Therefore, activities that monitor and control the
process must be standardised to ensure that new behaviours become routine. Other
direct methods to sustain improvements include visual management, standardisation
of procedures, and participation of the affected people. Furthermore, improvements
must be supported and sustained with the possible alteration of policies and priorities.
Do not focus on the correction of problems in the current state; exploit opportunities
to reach the future state. Management must rather focus on opportunities to eliminate
the condition that lead to problems. First, understand the process as a whole, before
the identification of improvement opportunities. Second, implement solutions in order
to exploit these opportunities, and then implement the successful solutions in other
locations with the support of organisational wide cooperation and coordination. This
can be summarised as: Think global, then local, but implement local, then global.
The nature of continuous improvement means that after the successful completion of
improvement activities, new opportunities must be identified. This is also important
because organisations are under pressure to be flexible and adapt to changes in the
current competitive business environment. The PDCA is a crucial approach that must
be repeated and the methods that are inherent to the PDCA cycle will also be more
beneficial when used for incremental improvements that strive to pursue perfection.
Stellenbosch University https://scholar.sun.ac.za

Chapter 7 Validation Industrial Engineering
Page 168
7. Validation
The entire continuous improvement roadmap discussed in Chapter 6 was developed
from lean thinking, theory of constraints, and six sigma. Each of the principles and
methods, except for the PDCA cycle, used in the roadmap was extracted from the
three continuous improvement methodologies as discussed in the literature study.
The organisational perspective was derived and extended from the 4P principles of
Lean Thinking. These are philosophy, people and partners (partners are external and
therefore not part of the roadmap), problem solving (this is inherent to the roadmap),
and process focus. The phases discussed within the organisational perspective are
also further supported with Deming’s theory of profound knowledge for management.
Each of primary process perspectives is inspired and derived from the main focus
point of each of the discussed improvement methodologies; value is derived from
lean thinking, throughput is derived from TOC, and quality is derived from six sigma.
The secondary process perspectives provide an overview of the direct connections
between the primary process perspectives. These connections are crucial to ensure
compliance, integration, and cohesion of improvement activities. The phases of the
process perspectives are copied from the discussed improvement methodologies
and included in the roadmap to support the intent of each phase. The main source of
each process perspective and their phases are shown in Table 7.1 on the next page.
The identification of the process perspectives and their integration was introduced in
the article “Enhancing project management in South African small businesses by
focusing on process improvement methodologies”, which was presented at the 25th
conference of the South African Institute for Industrial Engineering (SAIEE). [104]
Future potential validation of the roadmap can include interviews with small business
managers and actual implementation of the roadmap. The interviews can focus on
the comprehension of strategic support and competence of managers to understand
and utilise the technical support that is discussed within the roadmap. The next step
can then be the actual implementation of the roadmap to determine the effect that
successful implementation can have on the overall performance of a small business.
Stellenbosch University https://scholar.sun.ac.za

Chapter 7 Validation Industrial Engineering
Page 169
This roadmap also provides some opportunities for further research and case studies
to evaluate each perspective for refinement and actual implementation. The roadmap
can also be customised for specific industries and the implication of each perspective
in different situations. Furthermore, the role of modern technology can be evaluated
to determine the integration of the roadmap within enterprise information systems.
Table 7.1: Main source of each improvement phase
Primary process perspective
Value
(LT)
1. Value stream creation
2. Extended 5-S movement
3. Throughput accounting
LT LT
TOC
Throughput
(TOC)
1. Constraint exploitation
2. Process flow
3. Kanban pull system
TOC TOC
LT
Quality
(SS)
1. Theory of variation
2. Quality consciousness
3. Baseline measures
SS SS
SS
Secondary process perspective
Effectiveness
(LT and SS)
1. VOC-to-CTQ analysis
2. Cause and effect matrix
3. Input-output correlation
SS SS
SS
Agility
(LT and TOC)
1. Continuous flow
2. Load levelling
3. Drum-buffer-rope method
LT LT
TOC
Efficiency
(SS and TOC)
1. Constraint elevation
2. Built-in-quality
3. Total productive maintenance
TOC LT
LT
Sources:
LT = Lean Thinking
TOC = Theory of Constraints
SS = Six Sigma
Stellenbosch University https://scholar.sun.ac.za

Chapter 8 Conclusion Industrial Engineering
Page 170
8. Conclusion
Small, medium and micro enterprises are important contributors to the economic and
socioeconomic development of South Africa. However, most enterprises struggle to
become established. The high rate of failure is due to a lack of access to finance,
poor managerial and technical skills, and also the competitive business environment.
The goal of this research report is to develop a systematic and proactive roadmap
that provides skill constrained small business managers with basic directions toward
sustainable and internal process improvement, without expensive external consultation.
Two objectives have been identified that must be completed in order to achieve the
goal: strategic support and technical support. Strategic support was derived from the
three improvement methodologies, based on their values and beliefs of how to
approach continuous improvement. Technical support is provided with the ten step
basic improvement cycle, which is based on an interpretation of the PDCA cycle, and
the methods that were identified for the execution of the improvement methodologies.
Strategic and technical support is integrated into one roadmap that provides the
principles, strategies, and methods required for successful and sustainable process
improvement. This roadmap is called the theory of perspective, and is based on the
principle that perspectives can be used to develop the perception of people toward
process improvement. The values and beliefs that drive these perspectives are direct
reflections of the literature, which consists of theoretical sources and case studies.
Future research can focus on the development of a continuous improvement manual
with detailed instructions for the execution of each perspective. This manual can
include case studies, additional methods, and detailed explanations of the principles
that drive different philosophies and behaviours. Future research can also explore
the two ideas, stated below, for further development of the theory of perspective.
“Do not improve the process as an external consultant; improve how people perceive
the process so that improvement can become inherent to the organisational culture.”
“Break down the walls of perception with knowledge of organisational and process
perspectives in order to transcend above current methods of continuous improvement.”
Stellenbosch University https://scholar.sun.ac.za
References Industrial Engineering
Page 171
References
[1] J. Abor and P. Quartey, “Issues in SME Development in Ghana and South
Africa,” International Research Journal of Finance and Economics, no. 39,
pp. 218-228, 2010.
[2] R. Amra, A. Hlatshwayo and L. McMillan, “SMME Employment in South Africa,”
in Economic Society of South Africa Conference, Bloemfontein, 2013.
[3] The Department of Trade and Industry, “Annual review of small business in
South Africa (2005-2007),” South Africa, 2008.
[4] G. Himes and M. Swelfer, “Building an Enterprise Life Cycle,” MITRE
Publications, 2003.
[5] O. Fatoki and D. Garwe, “Obstacles to the growth of new SMEs in South Africa:
A principal component analysis approach,” African Journal of Business
Managemen, vol. 4, no. 5, pp. 729-738, 2010.
[6] A. Berry, M. von Blottnitz, R. Cassim, A. Kesper, B. Rajaratnam and D. E. van
Seventer, “The Economics of SMMEs in South Africa,” Trade and Industrial
Policy Strategies, Johannesburg, South Africa, 2002.
[7] R. P. Brand, N. D. du Preez and C. Schutte, “A Business Framework to
Network Small South African Enterprises for Sustainability,” South African
Journal of Industrial Engineering, vol. 18, no. 2, pp. 187-201, Nov 2007.
[8] E. Mahembe, “Literature Review on Small and Medium Enterprises' Access to
Credit and Support in South Africa,” National Credit Regulator (NCR), Pretoria,
South Africa, 2011.
[9] N. Bhuiyan and A. Baghel, “An overview of continuous improvement: from the
past to the present,” Emerald Group Publishing Limited, vol. 43, no. 5,
pp. 761-771, 2005.
[10] R. Moen and C. Norman, “Evolution of the PDCA Cycle,” 2006.
[11] N. Kano, “A Perspective on Quality Activities in American Firms,” California
Management Review, vol. 35, no. 3, pp. 12-31, 1993.
[12] T. McCarty, L. Daniels, M. Bremer and P. Gupta, The Six Sigma Black Belt
Handbook (Six Sigma Operational Methods), McGraw-Hill, 2004.
Stellenbosch University https://scholar.sun.ac.za
References Industrial Engineering
Page 172
[13] S. Sharma and A. R. Chetiya, “Six Sigma project selection: an analysis of
responsible factors,” International Journal of Lean Six Sigma, vol. 1, no. 4,
pp. 280-292, 2010.
[14] J. M. Nicholas and H. Steyn, Project Management for Business, Engineering,
and Technology, 3rd ed., Butterworth-Heinemann, 2008.
[15] H. S. Gitlow, A. J. Oppenheim, R. Oppenheim and D. M. Levine, Quality
Management, 3rd ed., Singapore: McGraw-Hill, 2005.
[16] J. K. Liker and D. Meier, The Toyota Way Fieldbook: A Practical Guide for
Implementing Toyota's 4Ps, New York: McGraw-Hill, 2006.
[17] R. Anupindi, S. Chopra, S. D. Deshmukh, J. A. Van Mieghum and E. Zemel,
Managing Business Process Flows, 1999.
[18] B. Smith, “Lean and Six Sigma - A One-Two Punch,” Quality Progress, vol. 36,
no. 4, pp. 37-41, 2003.
[19] R. B. Pojasek, “Asking "why" five times,” Environmental Quality Management,
vol. 10, no. 1, pp. 79-84, 2001.
[20] G. T. Doran, “There’sa SMART way to write management’s goals and
objectives,” Management Review, vol. 70, no. 11, pp. 35-36, 1981.
[21] S. G. Isaksen and J. P. Gaulin, “A Reexamination of Brainstorming Research:
Implications for Research and Practice,” Gifted Child Quarterly, vol. 49, no. 4,
pp. 315-329, 2005.
[22] B. Algozzine and P. G. Haselden, “ips for Teaching: Use of Affinity Diagrams as
Instructional Tools in Inclusive Classrooms,” Preventing School Failure:
Alternative Education for Children and Youth, vol. 47, no. 4, pp. 187-189, 2003.
[23] N. Cross, Engineering Design Methods, 4th ed., John Wiley & Sons, Ltd, 2008.
[24] P. R. Scholtes, B. L. Joiner and B. J. Streibel, The Team Handbook, 3rd ed.,
Oriel, 2003.
[25] P. Deip, A. Thesen, J. Motiwalla and N. Seshardi, “Nominal Group Technique”.
[26] T. Russel, “Pairwise Ranking Made Easy,” Participatory Learning and Action:
PLA Notes, vol. 28, pp. 25-26.
[27] K. Lewin, “Defining the 'field at a given time',” Psychological Review, vol. 50,
no. 3, p. 292, 1943.
[28] J. Thomas, “Force field analysis: a new way to evaluate your strategy,” Long
Range Planning, vol. 18, no. 6, pp. 54-59, 1985.
Stellenbosch University https://scholar.sun.ac.za

References Industrial Engineering
Page 173
[29] W. I. Zangwill and P. B. Kantor, “Toward a Theory of Continuous Improvement
and the Learning Curve,” Management Science, vol. 44, no. 7, pp. 910-920,
1998.
[30] S. Conger, “Six sigma and business process management,” in Handbook on
Business Process Management 1, Berlin Heidelberg, Springer, 2010,
pp. 127-148.
[31] M. Sokovic, D. Pavletic and K. K. Pipan, “Quality improvement methodologies–
PDCA cycle, RADAR matrix, DMAIC and DFSS,” Journal of Achievements in
Materials and Manufacturing Engineering, vol. 43, no. 1, pp. 476-483, 2010.
[32] G. J. Langley, R. D. Moen, K. M. Nolan, T. W. Nolan, C. L. Norman and L. P.
Provost, The Improvement Guide, 2nd ed., San Francisco: Jossey-Bass, 2009.
[33] D. C. Montgomery and G. C. Runger, Applied Statistics and Probability for
Engineers, 4th ed., John Wiley & Sons Inc, 2007.
[34] M. Owen, SPC and Continuous Improvement, Verlag: Springer, 1989.
[35] R. Dirgo, Look Forward Beyond Lean and Six Sigma, Florida: J. Ross
Publishing, 2006.
[36] J. P. Womack, D. T. Jones and D. Roos, The Machine that Changed the World,
Simon and Schuster, 1990.
[37] C. Schlichting, “Sustaining Lean Improvements,” Worcester Polytechnic
Institute , Massachusetts, 2009.
[38] J. K. Liker, “The Toyota Way: 14 Management Principles from the World's
Greatest Manufacturers,” McGraw-Hill, New York, 2004.
[39] S. Bhasin and P. Burcher, “Lean Viewed as a Philosophy,” Journal of
Manufacturing Technology Management, vol. 17, no. 1, pp. 56-72, 2006.
[40] M. Rother, Toyota Kata: Managing People for Improvement, Adaptiveness, and
Superior Results, McGraw-Hill Education, 2010.
[41] D. Mann, “The Missing Link: Lean Leadership,” Frontiers of health services
management, vol. 26, no. 1, pp. 15-26, 2009.
[42] J. J. Dahlgaard and S. M. Dahlgaard-Park, “Lean production, six sigma quality,
TQM and company culture,” The TQM magazine, vol. 18, no. 3, pp. 263-281,
2006.
[43] IBM, “IBM CEO Study: Leading Through Connections,” 2012.
Stellenbosch University https://scholar.sun.ac.za

References Industrial Engineering
Page 174
[44] R. J. King, “Supplier relationship management best practices applied to the
manufacture of a helicopter airframe in China,” Massachusetts Institute of
Technology, 2009.
[45] M. Ballé, “Lean attitude [considering attitude in lean production],” Manufacturing
Engineer, vol. 84, no. 2, pp. 14-19, 2005.
[46] D. K. Sobek, A. C. Ward and J. K. Liker, “Toyota's principles of set-based
concurrent engineering,” Sloan management review, vol. 40, no. 2, pp. 67-84,
1999.
[47] R. B. Austenfeld Jr, “Toyota and Why it is so Successful,” Research Society of
Commerce and Economics–Hiroshima Shudo University, pp. 109-173, 2006.
[48] J. M. Morgan and J. K. Liker, “The Toyota product development system,” New
York, 2006.
[49] J. K. Liker and J. M. Morgan, “The Toyota way in services: the case of lean
product development,” The Academy of Management Perspectives, vol. 20,
no. 2, pp. 5-20, 2006.
[50] M. Rother and J. Shook, “Learning to See: Value Stream Mapping to Add Value
and Eliminate Waste,” Lean Enterprise Institute, Massachusetts, 1998.
[51] T. Ohno, ToyToyota Production System – Beyond Large-Scale Production,
New York: Productivity Press, 1988.
[52] R. Moore and L. Scheinkopf, “Theory of constraints and lean manufacturing:
friends or foes?,” Chesapeake Consulting Inc, 1998.
[53] P. Hines and N. Rich, “The seven value stream mapping tools,” International
journal of operations & production management, vol. 17, no. 1, pp. 46-64, 1997.
[54] S. J. Pavnaskar, J. K. Gershenson and A. B. Jambekar, “Classification scheme
for lean manufacturing tools,” International Journal of Production Research,
vol. 41, no. 13, pp. 3075-3090, 2003.
[55] M. F. Suárez-Barraza, E. Bou and C. Cataldo, “Finding standards, routines and
non-routines in Toyota production system (TPS): standardization without
standardization?,” Lean Manufacturing Journal-Reliable Plant Magazine, vol. 5,
pp. 1-32, 2008.
[56] C. D. Chapman, “Clean house with lean 5S,” Quality Progress, vol. 38, no. 6,
pp. 27-32, 2005.
Stellenbosch University https://scholar.sun.ac.za

References Industrial Engineering
Page 175
[57] G. C. Parry and C. E. Turner, “Application of lean visual process management
tools,” Production Planning & Control, vol. 17, no. 1, pp. 77-86, 2006.
[58] F. A. Abdulmalek and J. Rajgopal, “Analyzing the benefits of lean
manufacturing and value stream mapping via simulation: a process sector case
study,” International Journal of production economics, vol. 107, no. 1, pp. 223-
236, 2007.
[59] T. Dan, “Some notes on the application of Single Minute Exchange of Die
(SMED),” 1992.
[60] K. E. McKone, R. G. Schroeder and K. O. Cua, “The impact of total productive
maintenance practices on manufacturing performance,” Journal of operations
management, vol. 19, no. 1, pp. 39-58, 2001.
[61] S. Nakajima, “Introduction to Total Productive Maintenance,” Productivity
Press: Portland, OR, 1988.
[62] M. Ballé, G. Beauvallet, A. Smalley and D. Sobek, “The thinking production
system,” Reflections, vol. 7, no. 2, pp. 1-12, 2006.
[63] S. Shingo, “Zero quality control: Source inspection and the poka-yoke system,”
Productivity Press, 1986.
[64] M. A. Cusumano, “The Limits of Lean,” Sloan Management Review, vol. 35, pp.
27-27, 1994.
[65] J.-L. Deleersnyder, T. J. Hodgson, H. Muller-Malek and P. J. O'Grady, “Kanban
controlled pull systems: an analytic approach,” Management Science, vol. 35,
no. 9, pp. 1079-1091, 1989.
[66] J. P. Womack and D. T. Jones, “Beyond Toyota: how to root out waste and
pursue perfection,” Harvard business review, vol. 74, no. 5, p. 140, 1996.
[67] E. M. Goldratt and J. Cox, The Goal: A Process of Ongoing Improvement,
3rd ed., Goldratt Group, 2004.
[68] D. Nave, “How to compare six sigma, lean and theory of constraints,” Quality
Progress, vol. 3, no. 35, pp. 73-80, 2002.
[69] K. J. Watson, J. H. Blackstone and S. C. Gardiner, “The evolution of a
management philosophy: The theory of constraints,” Journal of Operations
Management , vol. 25, no. 2, pp. 387-402, 2007.
[70] E. M. Goldratt and R. E. Fox, The Race, New York: North River Press, 1986.
Stellenbosch University https://scholar.sun.ac.za
References Industrial Engineering
Page 176
[71] E. M. Goldratt, Theory of Constraints: What is this thing called Theory of
Constraints and how should it be implemented?, New York: North River Press,
1990.
[72] E. M. Goldratt, The haystack syndrome, Croton-on-Hudson: North River, 1990.
[73] E. Schragenheim and B. Ronen, “Drum-buffer-rope shop floor control,”
Production and Inventory Management Journal, vol. 31, no. 3, pp. 18-22, 1990.
[74] S. M. Bragg, Throughput Accounting: A Guide to Constraint Management,
Hoboken, New Jersey: John Wiley & Sons Inc, 2007.
[75] V. Mabin, “Goldratt's "Theory of Constraints" Thinking Processes: A Systems
Methodology linking Soft with Hard,” in 17th International Conference of the
System Dynamics Society and 5th Australian & New Zealand Systems
Conference, Wellington, New Zealand, 1999.
[76] R. McNally, “Thinking with Flying Logic,” Report of Sciral, Colorado, 2011.
[77] F. S. Patrick, “Using Resistance to Change (and the TOC Thinking Processes)
to Improve Improvements,” in Proceedings: IIE Solutions Conference, Institute
of Industrial Engineer, Norcross, GA, 2001.
[78] L. J. Scheinkopf, Thinking for a Change: Putting the TOC Thinking Processes
to Use, CRC Press, 1999.
[79] D. Smith, The measurement nightmare: How the theory of constraints can
resolve conflicting strategies, policies, and measures, CRC Press, 1999.
[80] M. C. Gupta and L. H. Boyd, “Theory of constraints: a theory for operations
management,” International Journal of Operations & Production Management,
vol. 28, no. 10, pp. 991-1012, 2008.
[81] M. S. Raisinghani, H. Ette, R. Pierce, G. Cannon and P. Daripaly, “Six Sigma:
concepts, tools, and applications,” Industrial Management & Data Systems, vol.
105, no. 4, pp. 491-505, 2005.
[82] R. Ganeshan, S. Kulkarni and T. Boone, “Production economics and process
quality: a Taguchi perspective,” International Journal of Production Economics,
vol. 71, no. 1, pp. 343-350, 2001.
[83] N. R. Senapati, “Six Sigma: myths and realities,” International Journal of Quality
& Reliability Managemen, vol. 21, no. 6, pp. 683-690, 2004.
[84] D. S. Hayes, “Evaluation and application of a project charter template to
improve the project planning process,” Project Management Institute, 2000.
Stellenbosch University https://scholar.sun.ac.za
References Industrial Engineering
Page 177
[85] J. Wijma, A. Trip, D. R. J. M. M and S. Bisgaard, “Quality Quandaries:
Efficiency Improvement in a Nursing Department,” Quality Engineering, vol. 21,
no. 2, pp. 222-228, 2009.
[86] E. Sauerwein, F. Bailom, K. Matzler and H. H. Hinterhuber, “The Kano model:
How to delight your customers,” International Working Seminar on Production
Economics, vol. 1, pp. 313-327, 1996.
[87] Q. Xu, R. J. Jiao, X. Yang, M. Helander, H. M. Khalid and A. Opperud, “An
analytical Kano model for customer need analysis,” Design Studies, vol. 30,
no. 1, pp. 87-110, 2009.
[88] V. Hajipour, A. Kazemi and S. M. Mousavi, “A fuzzy expert system to increase
accuracy and precision in measurement system analysis,” Measurement,
vol. 46, no. 8, pp. 2770-2780, 2013.
[89] S.-G. He, G. A. Wang and D. F. Cook, “Multivariate measurement system
analysis in multisite testing: An online technique using principal component
analysis,” Expert Systems with Applications, vol. 38, no. 12, pp. 14602-14608,
2011.
[90] C. Gygi, N. DeCarlo and B. Williams, Six Sigma for Dummies, Indianapolis,
Indiana: Wiley Publishing Inc, 2005.
[91] S. Graves, “Six sigma rolled throughput yield,” Quality Engineering , vol. 14,
no. 2, pp. 257-266, 2002.
[92] R. Banuelas, J. Antony and M. Brace, “An application of Six Sigma to reduce
waste,” Quality and Reliability Engineering International, vol. 21, no. 6,
pp. 553-570, 2005.
[93] I. Cox, M. A. Gaudard, P. J. Ramsey, M. L. Stephens and L. Wright, Visual six
sigma: making data analysis lean, John Wiley & Sons, 2009.
[94] E. De Bono, Six thinking hats, Penguin, 1999.
[95] E. De Bono, “Serious creativity,” Journal for Quality and Participation, p. 12, 1995.
[96] C. Welborn, “Using FMEA to assess outsourcing risk,” Quality Progress, vol. 8,
no. 17, pp. 17-21, 2007.
[97] Y. Chen, D. J. Corr and P. L. Durango-Cohen, “Analysis of common-cause and
special-cause variation in the deterioration of transportation infrastructure: A
field application of statistical process control for structural health monitoring,”
Transportation Research Part B: Methodological , vol. 59, pp. 96-116, 2014.
Stellenbosch University https://scholar.sun.ac.za

References Industrial Engineering
Page 178
[98] W. H. Woodall, “The statistical design of quality control charts,” The Statistician,
pp. 155-160, 1985.
[99] J. S. Oakland, Statistical process control, Routledge, 2008.
[100] J. C. Anderson, M. Rungtusanatham and R. G. Schroeder, “A theory of quality
management underlying the Deming management method,” Academy of
Management Review, vol. 19, no. 3, pp. 472-509, 1994.
[101] H. R. Neave, “Deming's 14 points for management: framework for success,”
The Statistician, pp. 561-570, 1987.
[102] P. Rookes and J. Willson, Perception: Theory, development and organisation,
Psychology press, 2000.
[103] J. Mezirow, “How critical reflection triggers transformative learning,” in
Fostering critical reflection in adulthood, Jossey-Bass Publishers, 1990,
pp. 1-20.
[104] H. F. Winterbach and K. H. von Leipzig, “Enhancing project management in
South African small business by focusing on process improvement
methodologies,” in 25th Conference of the South African Institute for Industrial
Engineering, Stellenbosch, 2013.
Stellenbosch University https://scholar.sun.ac.za