a culture of health through civic engagement and data
TRANSCRIPT

A Culture of Health Through Civic Engagement and Data
Fourth Annual Report
Submitted by Bryan Bayles, PhD, MPHCurator of Anthropology and Health

Senior Management Team
Sarah Mendiola, H-E-B Body Adventure Education Manager
Marise McDermott, President & CEO
Bea Abercrombie, Chief Administrative Officer
Thomas L. Adams, Curator of Paleontology and Geology
Michelle Anderson, Director of Strategic Initiatives
Bryan P. Bayles, Curator of Anthropology and Health
Kim Biffle, Chief of Engagement
Katye Brought, Director of Communications
Robin Brown, Executive Assistant
Alexandra Bynum, Director of Major Gifts
Charlie Esquivel, Information System Administrator
Amy Fulkerson, Chief Curator
Linda Gerber, Director of Retail Services
Katherine Nelson Hall, Heritage Curator for Texas History
Brady Haynes, Project Manager
Helen Holdsworth, Curator of Texas Wild
John Laurenson, Manager of Exhibits
Sandra Lopez, Controller
Brian Luallen, Chief of Visitor Experience
Adam Mazuca, Director of Group & School Logistics
Amy Mitchell, Director of Education
Heather Russo, Chief of Advancement
Bruce Shackelford, Texas History Curator
Harry Shafer, Curator of Archeology
Aimee Spana, Director of Visitor Engagement
Mike Sprague, Chief of Facilities and Security
Beth Stricker, Director of Exhibit Design and Interpretative Strategy
Marcos Suniga, Director of Security & Public Safety
Chris Suwanski, IT Project Director
The Witte Museum inspires people to shape the future of Texas through transformative and relevant
experiences in nature, science and culture.

YEAR FOUR HIGHLIGHTS:Childhood Obesity• There has been an encouraging statistically significant decline in the percentage of youth ages 13 to 18 who were ‘Obese’ (>= 85th percentile for age and gender) from Year 1 (25.5%) to Year 4 (18.5%).
Physical Activity • Longitudinal data shows a steady upward trend towards increased screen time over the past four years among school age youth. For example, the proportion of Bexar County youth ages 13-18 reporting four or more hours of screen time per day (TV, video games) has increased from 23.3% in Year 1 to 30.5% in Year 4. This change is statistically significant.• While challenges still remain, an encouraging majority (55.1%) of Bexar County school-age youth (ages 8-18) report being physically active for sixty minutes three or more times the previous week.
Healthy Eating and Nutrition• An alarming 38.9% of Bexar County teenagers ages 13-18 reported eating ‘no vegetables’ the previous day. Only 10.2% of Bexar County respondents chose vegetables as their favorite healthy snack. Sustained, coordinated and targeted efforts are required to increase the popularity of vegetables as the “go-to” healthy snack. • For the fourth year in a row, fruit and vegetable consumption was lowest, sedentary screen time and soda consumption highest, in the age group of 13 to 18 year olds in Bexar County. Teenagers remain a consistently important target population for outreach, programs and strategic initiatives.• No significant declines in soda consumption are evident in any age group during the past four years. Approximately 16% of school-age youth (ages 8-18) in Bexar County report drinking two or more sodas per day.

The Witte Museum Joins Powerful Partners to TransformSan Antonio into the City of the Future
Four years ago, as the People’s Museum, and with more than 100 community partners, Witte Museum leadership decided to put a stake in the ground and dedicate its entire science center to a pioneering, revolutionary model: the H-E-B Body Adventure Powered by University Health System. The Witte has long-standing and profound social equity through the diverse multigenerational demographics of its visitors. Since its grand opening on May 24, 2014, the H-E-B Body Adventure has issued over half a million (600,0077) POWERpasses as of June 1, 2018, with each visitor choosing a virtual “Buddy” and experiencing authentic interactive physical and mental health behavioral change. With the unveiling of the Witte’s $100 million, once-in-a century transformation, we now proudly state that the Witte Museum is where nature, science and culture meet through a lens of Texas Deep Time, with themes of land, water and sky.
The H-E-B Body Adventure, rapidly approaching a million engaged POWERpass users, is at a pivotal transformative moment as well. These first four years have yielded a “proof-of-concept” that is unprecedented in the nation: a museum as a focal point for transformative health and wellness activities, powerful partnerships and community metrics. Evaluations from students, teachers and families reveal resounding and sustained success. The H-E-B Body Adventure enables visitors to experience, and then reflect on, health behavior change with a focus on Health IQ, Empowerment and sustained Wellness.
As the H-E-B Body Adventure enters its fifth year, the next phase of the H-E-B Body Adventure unfolds in earnest: a phase where community transformation and engagement takes center-stage. Longitudinal analyses of people striving to live vibrantly, and seeking inspiration to do so, are yielding unprecedented, completely anonymous data at a local level. These metrics are already being used to leverage new partnerships, sustain and broaden existing ones, and directly inform important local policy discussions. This directly underscores and speaks to the Witte Museum’s impactful sourcing statement: The Witte Museum is a bold leader shaping the future of Texas through powerful partnerships that transform San Antonio into the City of the Future where all people have the opportunity to create an extraordinary life.
1

The Witte Museum institutes a high level of museum best practices, as evidenced by its continuous accreditation by the American Alliance of Museums (AAM) since 1974. As the museum field’s mark of distinction, accreditation offers high-profile, peer-based validation of the museum’s best practices in strategic planning, collection stewardship, fiscal stability, emergency preparedness, audience relevance and community impact. The Witte was recently re-accredited and reviewers found that the museum’s “exemplary practices are probably too numerous to list,” and that the Witte “has shown a tremendous commitment to public service.” The Witte is a successful, engaging, “participatory” museum, with growing audiences and community partners. The H-E-B Body Adventure Powered by University Health System is at the forefront of audience relevance and community impact through its programming, events and the use of data for localized strategic planning, partnership building and policy change. Armed with powerful Body Adventure data that indicated 17% of Bexar County youth ages 13 to 18 felt they did not have safe outdoor places where they could play, this data informed San Antonio Metropolitan Health District’s work with the City and San Antonio’s Parks and Recreation to invest $700,000 in park and trail improvements in targeted high-need neighborhoods.
Localized data is particularly important for its ability to highlight and inform discussions surrounding the crucial issue of health equity. As outlined in the 2017 Bexar County Community Health Improvement Plan, achieving health equity means to attaining the highest level of health for all residents of Bexar County by providing them with full and equal access to opportunities that empower and enable them to lead healthy lives. To achieve health equity (not to be confused with health equality), we must address the root causes or the systemic and structural barriers that cause inequities including in education, employment, housing, and health care.
Achieving health equity also involves investing in innovative solutions to address the social determinants of health (that is, the circumstances of daily life), as well as nurturing those aspects of daily life that support healthy and thriving neighborhoods.
The Witte Museum together with its astounding partners, has resoundingly answered this call with the H-E-B Body Adventure Powered by University Health System.
2

The H-E-B Body Adventure has fostered an astounding array of creative, enduring collaborative partnerships to change the culture of health in San Antonio and beyond. These partners include the region’s largest and most visionary food retailer H-E-B, multiple recognized national leaders in hospital and clinical care systems (University Health System, the Children’s Hospital of San Antonio™), premiere health insurers (Blue Cross Blue Shield of Texas, Aetna) County and City entities (San Antonio Metropolitan Health District, the Mayor’s Fitness Council, County Commissioner’s Office, San Antonio Parks and Recreation) as well as additional cross-sector partners including leading Foundations (the Baptist Health Foundation of San Antonio, the Saint Susie Charitable Foundation, Methodist Healthcare Ministries, the Semp Russ Foundation of the San Antonio Area Foundation, the Genevieve and Ward Orsinger Foundation, the Beulah M. and Felix J. Katz Memorial Trust, Dan and Gloria Oppenheimer Fund and Valley View Trust of the San Antonio Area Foundation), the Harvey E. Najim Family Foundation, as well as additional partnership with the University of Texas Health at San Antonio, University of the Incarnate Word, YMCA of Greater San Antonio, the Culinary Institute of
America, Urban Capital Partners, Inc. (formerly SRG Force Sports), KLRN, the San Antonio Botanical Garden, BioMed SA, the Synergy Studio, and the Pearl Farmer’s Market, and visionary individuals such as Susan Moulton and Dr. Dacia and Lanham Napier and Witte Members.
The data published in the H-E-B Body Adventure Annual Reports illustrate that San Antonio and the region have quite a bit of work to do to impact health behaviors positively, but with the Body Adventure as a community resource at “the People’s Museum,” change is possible for those who experience their own personal health journey in this safe, encouraging space. Already, we see glimmers of hope in increasing healthy food and movement awareness. Culinary
medicine and healthy cooking and gardening initiatives are now thriving at the Witte and throughout San Antonio. This is terrific given the seduction of sedentary lifestyles and the convenience expanding exponentially of calorie-dense, nutritionally deficient processed foods.
Although there are 600,000 POWERpasses issued, you will see in this report that specific topics and demographics will show considerably fewer numbers, particularly as we examine targeted neighborhoods and age or gender-specific data. Also, it must be noted that after four years, the Witte Team recognizes that to capture comprehensive data in every category, exhibition processes will have to be modified. Please see the “Lessons Learned” section later in the report for more details.
Goals for the Body Adventure
The goals of the H-E-B Body Adventure are 1) to provide a safe haven for learning about how our bodies work (Health IQ), 2) to encourage visitors to set small, attainable goals (Empowerment) and 3) to offer a journey to sustained health (Wellness) for entire families. To accomplish these goals, the H-E-B Body Adventure introduces peer modeling, gaming technologies, physical activity and a regionally relatable cultural focus into a four-story, immersive indoor-outdoor experience. The three key themes of Health IQ, Empowerment and Wellness shape the content, creating teachable moments through exhibits, programs, daily demonstrations by trained professional actors (InterActors) and environments that invite hands-on experiential learning for all ages and bodies. Interactives and demonstrations are themed around locally recognizable landmarks and community resources, so that the H-E-B Body Adventure serves as a ‘hub’ of transformational experience that translates back to increased awareness and use of San Antonio’s growing network of parks, walking and cycling trails and other resources.
3
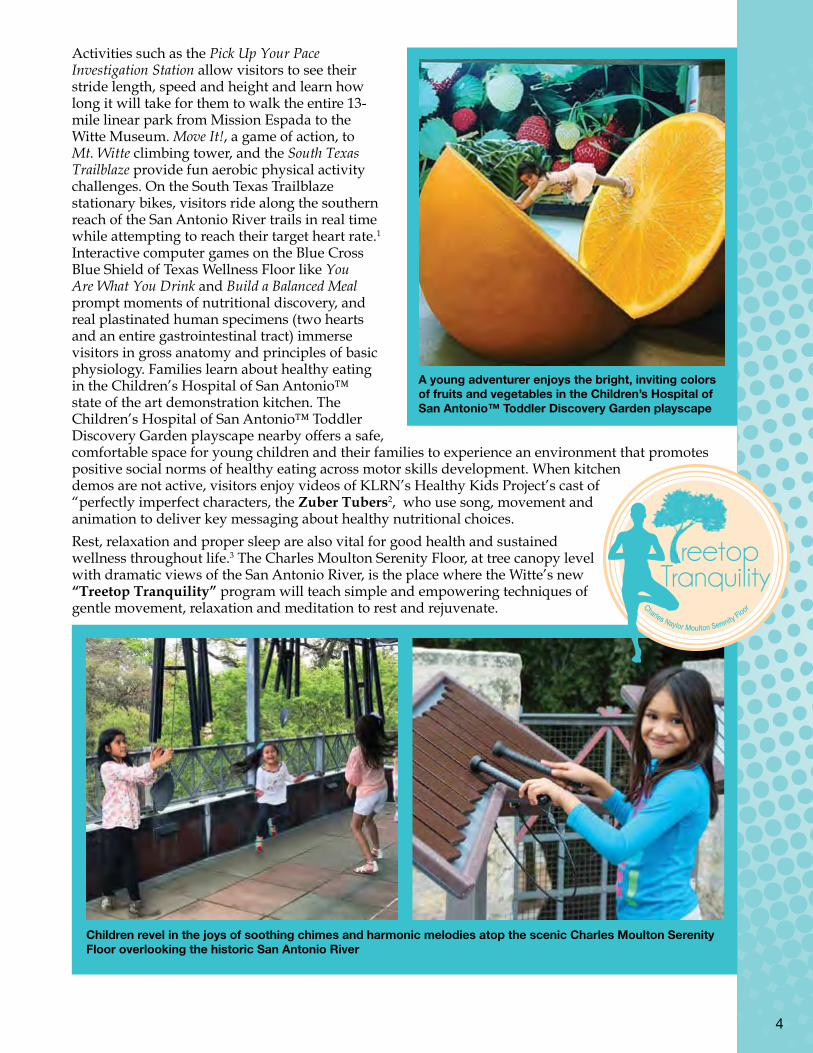
Activities such as the Pick Up Your Pace Investigation Station allow visitors to see their stride length, speed and height and learn how long it will take for them to walk the entire 13-mile linear park from Mission Espada to the Witte Museum. Move It!, a game of action, to Mt. Witte climbing tower, and the South Texas Trailblaze provide fun aerobic physical activity challenges. On the South Texas Trailblaze stationary bikes, visitors ride along the southern reach of the San Antonio River trails in real time while attempting to reach their target heart rate.1 Interactive computer games on the Blue Cross Blue Shield of Texas Wellness Floor like You Are What You Drink and Build a Balanced Meal prompt moments of nutritional discovery, and real plastinated human specimens (two hearts and an entire gastrointestinal tract) immerse visitors in gross anatomy and principles of basic physiology. Families learn about healthy eating in the Children’s Hospital of San Antonio™ state of the art demonstration kitchen. The Children’s Hospital of San Antonio™ Toddler Discovery Garden playscape nearby offers a safe, comfortable space for young children and their families to experience an environment that promotes positive social norms of healthy eating across motor skills development. When kitchen demos are not active, visitors enjoy videos of KLRN’s Healthy Kids Project’s cast of “perfectly imperfect characters, the Zuber Tubers2, who use song, movement and animation to deliver key messaging about healthy nutritional choices.
Rest, relaxation and proper sleep are also vital for good health and sustained wellness throughout life.3 The Charles Moulton Serenity Floor, at tree canopy level with dramatic views of the San Antonio River, is the place where the Witte’s new “Treetop Tranquility” program will teach simple and empowering techniques of gentle movement, relaxation and meditation to rest and rejuvenate.
Children revel in the joys of soothing chimes and harmonic melodies atop the scenic Charles Moulton Serenity Floor overlooking the historic San Antonio River
Charles Naylor Moulton Serenity Floor
4

H-E-B Body Adventure Enters Next Phase of Community Transformation, Education and Impact The fourth year of the H-E-B Body Adventure continues the tremendous momentum from last year, and marks a transition to what we are confident will now be a new and even-more powerful phase whereby the partnerships and data forged will become laser-focused on community transformation, policy discussion and change. That our community is primed for this potentially seismic change is evidenced by the astounding recognition from the Robert Wood Johnson Foundation, who has chosen San Antonio to receive its esteemed 2018 Culture of Health Prize. San Antonio was one of only four commuities to win the prize from over 200 applicants. Spearheaded by City leadership and the San Antonio Metropolitan Health District under the guidance of Director Dr. Colleen Bridger and Medical Director Dr. Junda Woo, the accomplishment of this award is a remarkable testament that San Antonio’s concerted and coordinated efforts to address health behavior change and health equity have truly reached the national and international stage. The Witte Museum is extremely proud to have been shoulder-to-shoulder with such incredible partners. In its first four years, the H-E-B Body Adventure has garnered an impressive array of awards, including the Inaugural Texas Association of Museum’s Media Innovation and Excellence Award, special recognition from the San Antonio Mayor’s Fitness Council, the American Alliance of Museums, and the University of Texas Health at San Antonio’s Institute for the Integration of Medicine and Science,
and was inducted to the University Health System Texas Diabetes Institute Wall of Honor.
Additionally, the Inside You! Anatomy Table (sponsored by Dr. Dacia and Lanham Napier in honor of her parents) on the Blue Cross Blue Shield of Texas Wellness floor has become an integral focus of cutting edge training for the nation’s future healthcare providers. Through formal collaborative agreements with the University of the Incarnate Word and the University of Texas Health at San Antonio Medical, Nursing, Dental and Allied Health schools, the Witte Museum has enrolled more than 150 undergraduate rehabilitation science and physical therapy students and more than 40 medical, nursing and other allied health students in a structured program of training, presentation and self-reflection as facilitators on this high-tech, life-
5

size, touch-screen, virtual dissection table. It is programmed for in-depth, hands-on exploration of body systems based on real, thin-layer human anatomy scans. The Witte has for several years been an approved work-study site by the UT Health-SA Office of Financial Aid, which provides students a financial incentive for time spent training and working in the H-E-B Body Adventure. The project has been so successful, it was expanded yet again this year. The Anatomy Table is now an official rotation for UT Health San Antonio Third-Year Medical Residents in the Department of Family and Community Medicine during their “Community-Oriented Primary Care” course. Fifteen Resident physicians are each spending one month working on the Table and interacting with the Witte’s diverse families.
A collaborative ongoing study coordinated by the Witte Museum, Metro Health and the UT Health-SA examines whether a structured program of training, presentation and self-reflection in a unique informal learning environment can improve interpersonal communication skills and increase self-efficacy for engaging in discussions about physical activity, nutrition and wellness topics among future physicians. The project, enttitled “Enhancing Empathy and Communication Skills among Future Health Professions Students through Partnership with a Community Museum” has been made possible with funds from the National Center for Advancing Translational Science, National Institutes of Health (Grant UL1 TR001120). Preliminary findings of this project were presented at the 2017 IIMS Community Engagement Symposium. Among the interesting findings were that students who chose to volunteer and participate in the program already scored significantly higher than the national average on quantitative tests of empathy. In addition, a battery of tests that gauged
student confidence in their personal skills highlighted that students felt least confident of their abilities to engage family members whose first language was Spanish in discussions about the body and wellness.
According to the U.S. Census Bureau, approximately 37% of Bexar County residents speak Spanish in the home, and of these, 30.4% speak English “Less than Very Well.”4 The U.S. Department of Health and Human Services defines Health Literacy as “the ability to obtain, process, and understand basic health information and services that are needed to make suitable health decisions.” Health Literacy is a critical social determinant of health.5 In fact, health literacy is considered a stronger predictor of an individual’s health status than income, employment status, education level, and racial/ethnic group.6 As a result of these findings, the curriculum has been modified to include basic terms, phrases and tips on engaging visitors and patients who may not easily understand English.
Observations have found that making a small effort to use a phrase or term in Spanish or another language can go a very long way toward establishing trust and fosteing further conversation among the families in the H-E-B Body Adventure.
6

Curator of Anthropology and Health, Dr. Bryan Bayles continues to speak throughout the city, state and nation to diverse audiences, continually garnering important professional and media coverage.7 At the Association of Science-Technology Centers 2017 Annual Conference in San Jose, California Dr. Bayles was joined by prestigious colleagues from Google, the Exploratorium, and Local Projects, to explore the concept of “Smart Exhibits” and how new technologies, such as the POWERpass system, Anatomy Table, and biofeedback-based activities, can be harnessed to scaffold learning and enhance visitor engagement. The panel highlighted on a national stage in Silicon Valley how the Witte Museum is at the forefront of STEM technology and the growing interface of museums and community engagement.
Dr. Bayles also represents the Witte Museum on several Advisory Boards and committees, including the Executive Committee of the Mayor’s Fitness Council, the H-E-B Statewide Health and Wellness Promotion Committee, the UT Health-San Antonio’s IIMS Community Engagement Board, the San Antonio Health Literacy Initiative, the Bexar County Healthy Beverage Coalition, San Antonio Health Advisory Board and the University of Texas at San Antonio (UTSA) San Antonio Chronic Disease Collaborative, which seeks to further leverage community-wide partnerships to sustain crucial research in health equity and preventable chronic disease. This year, data and interactive learning models were shared at multiple seminal community–wide forums, including the It’s Time Texas Annual Summit, Applied Anthropology and Health courses at UTSA and the University of Texas Health-San Antonio’s Voelcker Biosciences Academy for aspiring physicians and allied health professionals. Presentations were also made to the UT Health-SA’s $24 million National Institutes of Health-funded Clinical and Translational Science Award (CTSA) Leadership Advisory Committee8, the Health Cell9, and other high-profile organizations.
The Witte Society Scholarship Fund has also been thrilled to host day students from the Fox Tech High School for Health and Law Professions for SA Works Job Shadow Day. Students toured the H-E-B Body Adventure and shadowed its staff, while completing site observations. The feedback has been truly inspiring. The Witte staff was described by students as ‘lively,’ ‘welcoming,’ ‘bright,’ and “innovative”. One student noted that “The Witte values finding the best in the people, but also doing it in a way that they will enjoy.” Another student noted that they “wanted to know more about having confidence,”
striking a chord of recognition with the H-E-B Body Adventures’ key pillar of Empowerment.
The convergence of the themes of Health IQ, Empowerment and Wellness were also clearly evident as students enthusiastically cheered on their classmates on Mt. Witte during a newly expanded after-school initiative as part of Urban Capital Partners ‘Becoming A Better You’ program, in coordination with the San Antonio Independent School District. Already, more than 300 students have already been served by this innovative program.
The successful relationship serves eight elementary school campuses, located predominately in San Antonio’s Near Eastside and Southeast regions. Each campus visited the H-E-B Body Adventure four times, with each visit emphasizing targeted curriculum intended to improve the academic and social development of youth by addressing goal-setting and empowerment within the context of healthy eating, fun physical activity, mindfulness and self-control. The Witte looks forward to expanding the scope of this powerful, after-school partnership.
7

The Witte education team takes pride in being an educational resource for Texas. This year under the leadership of Director of Education Amy Mitchell, the team welcomed its new Body Adventure Education Manager, Sarah Mendiola.
With a degree in Exercise Science and a passion for empowering museum visitors to discover more about the human body and to set small, attainable goals for personal health, Sarah has updated Body Adventure school programs, ensuring their alignment to Texas Essential Knowledge and Skills (TEKS) requirements to supplement classroom learning. Sarah also developed new H-E-B Body Adventure demonstrations, and collaborated with Special Programs Manager Joshua Segovia on the development of numerous health-themed Super Saturdays. Together with Director of Play Christina Cate, Sarah continues to develop, and evaluate Interactive Student Programs, Gallery Theater programs and daily demonstrations. These deeply engaging activities are designed to meet students’ needs for health and wellness education and teachers’ requests for relatively short, impactful programs in the health sciences.
This is an exciting time for both University Health System and the Witte
Museum. Just as the Witte Museum has completed its own $100 million transformation to widespread accolades, University Health System continues to advance our mission to improve the good health of our community through high-quality, compassionate patient care, innovation, education and discovery.
In 2014, we doubled the size of University Hospital with the opening of the Sky Tower at University Hospital, creating South Texas’ most a beautiful and technologically advanced hospital. We also constructed a six-story clinical building on our historic Robert B. Green Campus downtown. This project greatly expanded our primary and specialty services for both adults and children. Earlier this year, with a goal of improving the health of those living and working in neighborhoods east of downtown, we opened the Dr. Robert L.M. Hilliard Center on a two-acre site on the East Side provided by the San Antonio Housing Authority. This state-of-the-art health center offers primary care, women’s and children’s services, and more. Dr. Hilliard was a pioneering obstetrician-gynecologist, and we are so honored to have our health center bear his name.
Just as the H-E-B Body Adventure enters its next phase of re-invigoration, we too are embarking on the next phase of our capital improvement program. This $452 million project includes a women & children’s inpatient tower and a new heart, vascular
and endoscopy center at University Hospital. Our vision is to create a place that enhances synergy and coordination of care across the whole continuum of care -from a brand new pregnancy, through birth, and through all of the routine and complex medical situations along life’s journey. These investments also ensure we are creating a place that becomes “the” place for the best and brightest specialists to train and stay in our community to care for us, our children and children’s children into the future. You will begin to see these projects taking shape over the next year.
The H-E-B Body Adventure Powered by University Health System continues to be a national model of harnessing technologies and interactive museum experiences to increase our community’s Health I.Q., Empowerment and Wellness through enduring partnerships, powerful metrics and strategic community outreach. We are extremely proud of our ongoing investments in these pioneering technologies and the community programs of the Witte Museum’s H-E-B Body Adventure. The H-E-B’s unique model and data have been shared with hundreds of policy leaders, physicians, residents, nurses, allied health personnel and students, as well as museum, educational and community health advocates throughout the nation.
Our dedicated professionals have enjoyed annual healthy Family Days at the Witte, Healthy U Express screening events, and we have leveraged our collaboration to bring in additional partners to further enhance our shared impact on the health and happiness of our community.
Congratulations to the Witte. We look forward to many more years of powerful partnership.
8

The Witte Team and Board of Trustees especially recognize the Harvey E. Najim Family Foundation for increasing support of field trip scholarships for students to visit the H-E-B Body Adventure and participate in health and wellness programs.
With such visionary sustained support, the Witte’s robust educational programs continue to grow impressively. While a total of 33,327 students experienced hands-on, TEKS-aligned science, nature and history programs in 2016, this number has steadily increased to over 40,000 students this year. During Year 4, the Witte also offered two of its first-ever, fully-sold-out “Mini-Chef” Summer Camps, where youth learned to create their own healthy recipes from start to finish.
The total number of schoolchildren participating in H-E-B Body Adventure educational programs continues to increase dramatically through this support. While 4,093 students participated in one of the four structured educational programs relating specifically to health and wellness science in the H-E-B Body Adventure in 2015-2016, that number has been steadily increasing, to over 7,400 in 2017-2018. After an initial quadrupling of the number of students grades K-2 participating in the Food is Fuel nutrition program from Year 1 to Year 2 to 2,254 students, this number has doubled again and remained steadily over 4,000 in both Years 3 and 4. The number of students grades 3-5 participating in the Put Your Heart Into It! education program more than quadrupled from just over 600 to 2,041 in Year 3 and now 3,086 in Year 4. After an initial tripling of the number of students in grades 6-8 participating in The Machine Within: Muscle Mechanics, which explores physical activity and the anatomical and structural workings of the musculoskeletal system, these numbers also increased from a steady 1,000 to 1,480 this year. It is critical to note, that these numbers hugely underestimate the total numbers of school-aged youth who engage in hands-on learning and experience transformative education at the Witte Museum. It does not include total visitorship and the thousands of youth participating in health-themed Family Days, after-school programs, summer camps, gallery tours and more.
The ever-growing array of educational offerings and H-E-B Body Adventure-themed Family Days made possible through the collaboration of our partners like H-E-B, University Health System, and BlueCross BlueShield of Texas, continue to be in very high demand and receive extremely high evaluation scores. Teachers also provide insightful comments that help the Witte know what some of the strengths in the programs are from the teachers’ perspectives. In response to “Did
9

the program correspond to the TEKS (Texas Essential Knowledge and Skills)?” teachers answered, “Yes, science and math TEKS; health TEKS; Food groups, math, science, social studies TEKS.” Teachers also noted “We learned about keeping our bodies healthy and how we can visually “see what is good for us.” The team was especially pleased to see comments such as “Natural resources – we talked about how foods come from nature.” This was especially encouraging as the Witte increasingly integrates its curricula and activities across the broad scope of the natural sciences and history, drawing upon the strengths of its outstanding new galleries. When asked, “What was your favorite aspect of the program?” teachers responded with phrases like: “hands-on activities;” “very kid friendly;” “presenters were very engaging;” “Offers direct connections to their health;” “ties right into the 6th grade Science curriculum;” “I liked that students learned ways to keep their hearts healthy: very practical for their lives;” “Seeing the garden—the kids loved it!’ among many others. This feedback indicates the Witte is on track to achieving the goal of increasing students’ and teachers’ Health IQ, personal Empowerment, and lifelong Wellness.
This year, the H-E-B Body Adventure again served as a site for the Annual Public Health Camp led by the University of Texas School of Public Health San Antonio Regional Campus in collaboration with the UT Heath San Antonio Area Health Education Center (AHEC). The camp has continued to grow, reaching over 80 high school juniors and seniors, representing over 20 high schools, 7 Independent School Districts, as well as Charter Schools and Catholic Schools from across the state. The Witte Museum’s H-E-B Body Adventure also serves as a site for the extremely successful American Diabetes Association Project Power Camp. The American Diabetes Association’s Project Power Camp has hosted more than 100 local youth ages 9 to 14, who have been identified to be at-risk of developing type 2 diabetes. Project Power Camp empowers campers in an educational and fun-filled environment and focuses on diabetes education, nutrition, physical activity and combatting obesity. According to pre- and post-test results provided by the American Diabetes Association, campers and parents showed significant increases in knowledge and awareness of nutrition and physical activity likely to lead to behavioral changes.
The H-E-B Body Adventure has been well-loved in its four years of operation. A refresh of the H-E-B Body Adventure is imminent to support the tremendously powerful operations of the exhibits and interactives as the museum continues to serve an increasing number of school children and visitors and provide a longitudinal study on the health of the community. A refresh of the infrastructure will include the purchase and replacement of high-tech exhibit components, a renovation of facilities to accommodate a growing audience, exciting new exhibition interactives, fresh paint and a reprinting and installation of graphic components. While the H-E-B Body Adventure experience undergoes a refresh, the Witte Museum will update graphic components to create and highlight community connections throughout the space, ensuring that the Body Adventure stays relevant to the local community and directly informs and empowers visitors to be aware of, and use local resources near their homes. Community connections will take the form of maps or info-graphics of community resources (gardens, trails, free health classes), increased collaboration with the San Antonio Food Bank as well as its Mobile Mercado, an increase in culinary offerings through partnerships with UHS, UT-Health San Antonio medical and nursing students, and much more. The next few years will, the Witte seeks to effectively “close the loop” so that visitors make take what they have learned in the H-E-B Body Adventure directly into their lives and their communities.
10

POWERpass SystemAt the heart of the H-E-B Body Adventure is a sophisticated system of networked exhibition components called the POWERpass, made possible through the visionary support of University Health System. This year a total of 143,937 visitors signed-in and received POWERpass cards: an increase from the previous two years. The POWERpass technology is the key differentiator between the H-E-B Body Adventure and other health science museums.
Decades of evidence-based research have demonstrated that a supportive social matrix is critical in building self-efficacy for health behavior change. Therefore, the Witte Museum made peer support an integral aspect of the POWERpass experience. Visitors sign-in, select one of twelve ‘Buddies’ and receive a POWERpass card that allows their chosen Buddy to guide them virtually throughout their adventure. Buddies are real San Antonio residents of diverse ages and backgrounds who were chosen as inspiring role models. They participated in extensive training on health behavior skill-building and goal-setting in the areas of physical activity, healthy eating and relaxation. Throughout their training, Buddies were interviewed and filmed so that they relate to
museum visitors through inspirational, supportive and empowering multimedia presentations linked to the interactive exhibition components. The POWERpass card provides visitors with a personalized experience that culminates with a take-home POWERprofile card to remember their visit.
Each year, consistently, the most popular Buddies selected continue to be Evan (12 yr old Anglo male), Lexie (9 yr old Hispanic/Latino female), Carrie (19 yr old Asian female) and Matthew (12 yr old African American/White male). The broad ethnic demographic of the most popular Buddies chosen is notable, as it also reflects the broad, mixed heritage and demographic representativeness of the Witte visitors. Data from all four years confirms that male visitors continue to show a definite preference for male Buddies, and female visitors showed a definite preference for female Buddies. In the tables below, the most popular four of the twelve Buddies are shown by gender. These percentages and rankings have remained remarkably consistent from year to year. This indicates that one goal of giving visitors an opportunity to choose someone they identify with continues to be working extremely well.
The phenomena of visitors choosing individuals ‘like themselves’ is further reflected in the increasing age of the top 4 most popular buddies shown in the tables above. While Evan, Matthew and Elisa are in the age range of 9 to 15, Hudson, Carrie and Elisa, were each in their early twenties at the time of filming, with Cheyenne in her late twenties and Paul in his early 50s.
Female Visitors
Buddy Year 1 Year 2 Year 3 Year 4 Selected 93,495 75,942 75,440 75,195
Lexie (age 9) 30.2% 28.8% 31.5% 33.3% Carrie 21.1% 21.1% 20.8% 21.2% Elisa 11.2% 11.6% 10.9% 10.9% Cheyenne 7.8% 8.0% 7.9% 7.9%
Top 4 Most Popular H-E-B Body Adventure Buddy Selections by Year; All Ages
Male Visitors
Buddy Year 1 Year 2 Year 3 Year 4 Selected 81,496 64,358 65,408 68,742
Evan (age 12) 39.4% 38.4% 38.3% 38.4% Matthew 20.1% 20.8% 20.7% 20.7% Hudson 10.8% 10.6% 10.8% 10.8% Paul 8.2% 8.0% 8.2% 8.2%
Top 4 Most Popular H-E-B Body Adventure Buddy Selections by Year; All Ages
11

Despite lower POWERpass engagement, adults ages 30 and older tend to be represented more highly in our extraordinarily popular evening programs, health-themed Family Days and interactive presentations. For example, the evening Salud! Culinary Nights program continues to routinely sell out. Salud! is a series of tasty and interactive evening programs for adults featuring local chefs and a
diverse array of cuisines and topics in the Children’s of Hospital of San AntonioTM Demonstration Kitchen. Cooking demonstrations for each program spotlight culturally and seasonally themed menu items.
Visitors meet top local chefs, farmers, ranchers and food historians in an intimate setting as they present information, history and stories about the selected menu enjoyed by all. Each program also features wine or beer pairings from the finest Texas wineries and breweries. Visitors have been treated to a vast array of events, including a ‘back-by-popular-demand’ edition of a dinner of edible insects from partners Bug Vivant
featuring Executive Chef Stephen Paprocki Chef Chris Cook, Chef Jeff White, Pastry Chef Jenn Riesman with Hotel Emma and Alamo Beer. Dr. Harry Shafer, the Witte Museum’s Curator of Archaeology, discussed the importance of insects to the prehistoric hunter-gatherer inhabitants of South Texas and the Lower Rio Grande Valley as found in its rich archeological record. Nowhere else but the Witte Museum is healthy cuisine, South Texas Heritage and history brought together in such a unique fashion.
Some Notes on MethodologyWhile it should be noted that POWERpass data is in essence a convenience sample, Bexar County has never before had estimates of the prevalence of many of these key health behaviors at the zip code level for a sample size this large and diverse. The data, therefore, represents a thoroughly unique snapshot of community health, unprecedented in the nation. The Witte Museum continues to work very closely with the San Antonio Metropolitan Health District to continually refine and improve data collection procedures and analytic methods to achieve maximum reliability. The Witte is especially excited to be working with the San Antonio Metropolitan Health District’s newly formed Office of Informatics, led by Chief of Informatics, Dr. Golareh Agha. In addition, concerted efforts are being made to enhance the usefulness of this data for the public, for whom this data is ultimately both derived from and to which it is dedicated. It should be understood that the present report supersedes previous annual data reports.10
While there are now over 600,000 POWERpass visits, it can be confusing to see much lower sample sizes for individual survey items, and particularly BMIs/Obesity. This is because, while many visitors sign-in and receive a POWERpass, not all enter their zip code fully, and those that do may or may not therefore be identifiable within Bexar County. While Bexar County is the focus of the present report, additional analyses are underway examining larger regions, such as Texas Department of State Health Services Region 8, which encompasses Bexar and multiple surrounding counties. Furthermore, since University Health System is the central hub of a much larger service area, analyses are underway to examine these broader populations. Such analyses promise to be quite informative, with even more robust sample sizes, allowing for the identification of regional similarities and differences. Additionally, in the present report, smaller cohorts often form the target of specific analyses. For example school-age children (ages 8-18 only) who complete both height and weight stations (on separate floors), thus yielding BMI, further reduce the numbers. Because the public
12

importance of issues surrounding childhood obesity, heights and weights were examined extremely carefully, and extreme outliers removed using anthropometric guidelines from the Center for Disease Control growth charts. While this further reduces the total sample size, it strengthens the reliability of the data. Regardless, nowhere else are survey data at sample sizes over 35,000 and childhood obesity estimates at the zip code level of nearly 9,000 cases available in Bexar County. The H-E-B Body Adventure POWERpass system has been a resounding success and model for the nation for innovative and transformative data collection to inform public policy and local strategic planning.
Longitudinal ResultsThe Witte Museum is committed to continued longitudinal data collection in the H-E-B Body Adventure for the benefit of the entire community.11The H-E-B Body Adventure represents a thoroughly unique broad community sample hitherto unavailable, and certain trends can be inferred and statistical tests employed—particularly as data continue to accumulate and the project is sustained through the generous support of community partners, visitors and members. Following previous reports, certain statistical tests and charts use Body Adventure zip code-level data to aggregate responses by eight subsectors. These subsectors are derived from the eight healthcare subsectors used in the Bexar County Community Health Needs Assessment (CHNA) and Community Health Improvement Plan (CHIP): a key guiding document for Bexar County public health strategic planning prepared by the Health Collaborative.12 These eight sectors were developed by Community Information Now (CI: Now)13 for the 2013 and 2016 Assessments based on Zip Code Tract Areas (ZCTAs), as zip code is a common variable across many local and state datasets. These sectors were developed using a non-statistical process to group adjacent ZCTAs with similar median household incomes (from U.S. Census Bureau American Community Survey five-year estimates) and with the
aim of having a sufficiently large and similar total population size for each sector. The final groupings, though, also took into account local understanding of “parts of town” as reflected in the commonly-used and widely-accepted divisions of north-, south-, east-, and westside. CI:Now’s methodology has proven extremely helpful in assisting both the Witte Museum and many other City partners in engaging in discussions about health equity and the complex intersections of neighborhood development, income, housing, and other variables commonly referred to as the “social determinants of health.”14
Geography
During Sign-In, a visitor enters their age, gender and zip code and selects a Buddy. Of the 600,076 visitors who have received POWERpass cards as of May 31, 2018, 451,792 individuals (75.3%) entered a valid, identifiable zip code.15 This percentage has remained stable since opening, though it has increased slightly in Year 4, and is actually quite a remarkable success rate. While 88% of these identifiable zip codes are from Texas, visitors from all U.S. States have been represented all four years, including the U.S. Virgin Islands and Guam.
The following maps show the museum’s continued strong reach nationwide and especially in Texas. A table of counties with the most POWERpass users highlights that the Witte Museum visitation is also
13

reaching throughout the state with significant draw from central Texas, the major cities (Dallas/Ft. Worth, Houston, Corpus Christi) and also along the Texas-Mexico border region (Laredo, McAllen, Eagle Pass, Del Rio, etc). Over 1,000 additional individuals from Alaska, Hawaii, Puerto Rico, Guam, American Samoa also experienced the H-E-B Body Adventure.
Year 1 174,991 77.8% 70.1% 51.7% (136,089) (122,729) (90,494) Year 2 140,300 11.6% 10.9% 10.9% (106, 049) (94,615) (67,347) Year 3 140,848 74.2% 65.3% 47.5% (104,450) (92,028) (66,841) Year 4 143,937 73.3% 64.6% 47.0% (105,504) (92,937) (67,675)
RankTop 20 Most Frequent
POWERpass Users by Texas County(all ages); 2014-2018
Percentage of Identifiable Zip
Codes from Total POWERpasses
Total POWERpasses
Issued
Percentage of Total POWERpasses
with Identifiable Zip Codes from Texas
Percentage of Total POWERpasses
with Identifiable Zip Codes from
Bexar County
County Frequency 1 Bexar 292,357 2 Guadalupe 12,918 3 Comal 10,341 4 Travis 6,598 5 Webb 5,218 6 Harris 4,953 7 Atascosa 4,379 8 Wilson 4,334 9 Hidalgo 3,948 10 Medina 3,959 11 Kendall 3,687 12 Nueces 3,476 13 Hays 3,128 14 Cameron 2,473 15 Kerr 2,368 16 Dallas 2,311 17 Tarrant 2,310 18 Williamson 2,088 19 Maverick 1,495 20 Bandera 1,262
14

How Representative areH-E-B Body Adventure Visitors and Surveys?The Witte Museum is known as “The People’s Museum,” and takes this extremely seriously, investing in targeted marketing, underwriting of transportation and field trips and efforts to remove barriers to transformational museum experiences for the entire community. Some 80,000 individuals attend the Museum (including the H-E-B Body Adventure) annually during our Free Tuesdays. This equitable outreach could not be accomplished without the generous support of members, trustees and donors such as the Harvey E. Najim Family Foundation.
In the previous Annual Report, a number of ways of visualizing the representativeness of the H-E-B Body Adventure visitors were presented; by self-reported ethnicity, by City Council District, by Community Health Needs Assessment (CHNA) Healthcare Subsectors and also by Bexar County Zip Codes. The data clearly showed the H-E-B Body Adventure continues to reach a remarkably representative socio-demographic and geographic sample of the Bexar County community.16
The following chart, which was not included in the previous report, shows the ACS 2015 population distribution for Bexar County aggregated by Health Collaborative/CI: Now city sector and compared with the proportions of total responses to the Witte’s H-E-B Body Adventure All About You survey game kiosks. While there is an oversampling of the Near Northside (where the Witte Museum is located), the representativeness of the data is very impressive. Furthermore, while the Southeast and Southwest sectors of the city are more sparsely populated, and thus represent a very small proportion of the overall population of Bexar County, they are very well-represented as a proportion of the Witte’s survey responses. This is heartening since, although they represent low-density population sectors, they also tend to be high-need areas. As is evident in the following pages the Southeast and Southwest sectors of the county bear a disproportionate burden of certain social determinants of health that have been shown to be associated with adverse health outcomes. The 2016 Bexar County Health Needs Assessment17 is an excellent resource to visualize the broader social context within which the Witte’s H-E-B Body Adventure’s data is set. For example, pages 33, 40-42 show maps of literacy rates, family and household income, and working-age unemployment by zip code and census track. These factors of daily life are increasingly recognized as key “upstream” factors the determining the “downstream” adverse health outcomes of largely preventable chronic disease.
Representativeness of Witte Survey Data
Comparison of 2015 National American Community Survey of Bexar County Population with Witte ‘All About You’ Survey Response by City Sector;
All Year; School-Age Youth ages 5-17
15
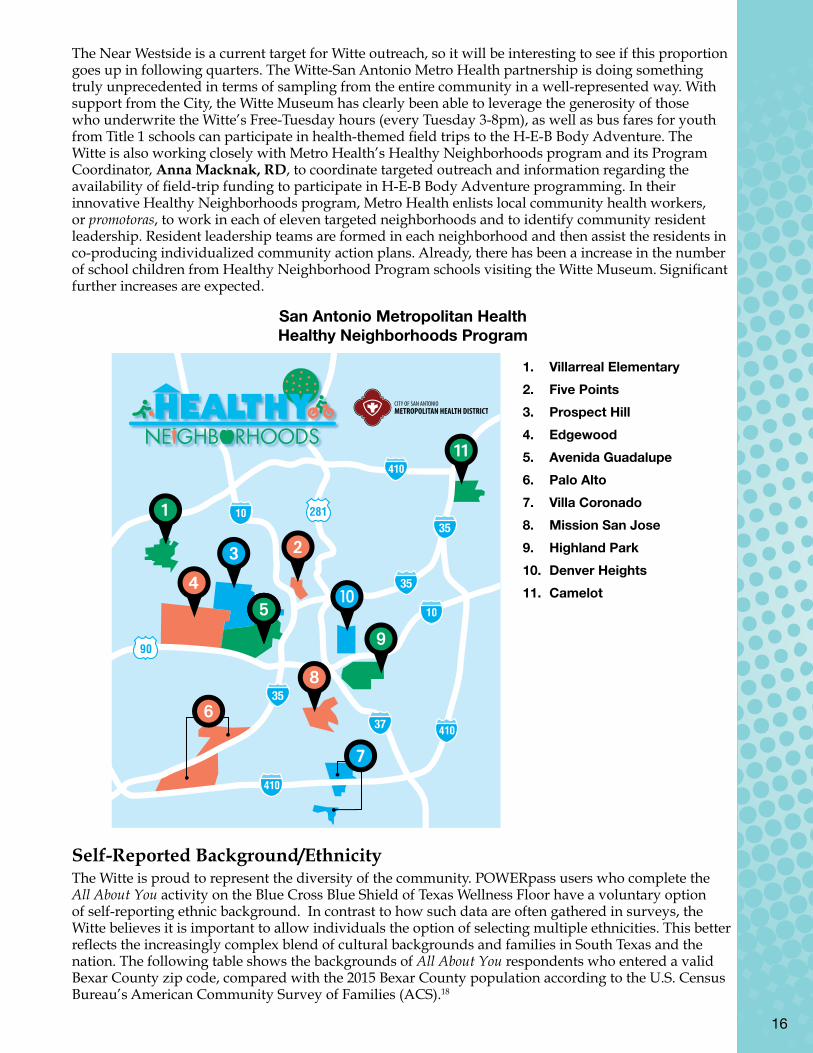
The Near Westside is a current target for Witte outreach, so it will be interesting to see if this proportion goes up in following quarters. The Witte-San Antonio Metro Health partnership is doing something truly unprecedented in terms of sampling from the entire community in a well-represented way. With support from the City, the Witte Museum has clearly been able to leverage the generosity of those who underwrite the Witte’s Free-Tuesday hours (every Tuesday 3-8pm), as well as bus fares for youth from Title 1 schools can participate in health-themed field trips to the H-E-B Body Adventure. The Witte is also working closely with Metro Health’s Healthy Neighborhoods program and its Program Coordinator, Anna Macknak, RD, to coordinate targeted outreach and information regarding the availability of field-trip funding to participate in H-E-B Body Adventure programming. In their innovative Healthy Neighborhoods program, Metro Health enlists local community health workers, or promotoras, to work in each of eleven targeted neighborhoods and to identify community resident leadership. Resident leadership teams are formed in each neighborhood and then assist the residents in co-producing individualized community action plans. Already, there has been a increase in the number of school children from Healthy Neighborhood Program schools visiting the Witte Museum. Significant further increases are expected.
Self-Reported Background/Ethnicity The Witte is proud to represent the diversity of the community. POWERpass users who complete the All About You activity on the Blue Cross Blue Shield of Texas Wellness Floor have a voluntary option of self-reporting ethnic background. In contrast to how such data are often gathered in surveys, the Witte believes it is important to allow individuals the option of selecting multiple ethnicities. This better reflects the increasingly complex blend of cultural backgrounds and families in South Texas and the nation. The following table shows the backgrounds of All About You respondents who entered a valid Bexar County zip code, compared with the 2015 Bexar County population according to the U.S. Census Bureau’s American Community Survey of Families (ACS).18
4 Edgewood
5 Avenida Guadalupe
6 Palo Alto/South San
1 Villarreal
2 Five Points
3 Prospect Hill
7 Villa Coronado/
Mission Del Lago
8 Mission-San Jose
9 Highland Park
J Denver Heights
K Camelot
San Antonio Metro Health Healthy Neighborhoods handout 1601015.indd 2 9/25/15 10:11 AM
1. Villarreal Elementary2. Five Points3. Prospect Hill4. Edgewood5. Avenida Guadalupe6. Palo Alto7. Villa Coronado8. Mission San Jose9. Highland Park10. Denver Heights11. Camelot
San Antonio Metropolitan Health Healthy Neighborhoods Program
16

Comparing cumulative 4-year Witte data with the U.S. Census Bureau’s 2012-2016 5-year American Community Survey estimate demonstrates equitable and representative participation in the All About You survey at the H-E-B Body Adventure. The Witte shows a slightly disproportionate representation of American Indian or Alaska Natives and Native Hawaiian or Other Pacific Islanders. The higher percentage of individuals in the ‘Other’ category very likely simply reflect differences in data collection methodology between the H-E-B Body Adventure and the ACS, since the H-E-B Body Adventure allows individual to choose multiple backgrounds in any combination, giving them more freedom to self-identify.
Year 1 Year 2 Year 3 Year 4 Hispanic or Latino (any race) 52.1% 54.3% 53.7% 54.3% 59.5% White non-Hispanic 32.3% 29.7% 30.3% 28.9% 28.6% Black or African American alone 6.1% 6.2% 5.7% 7.1% 7.2% Asian alone 2.8% 3.0% 2.7% 3.0% 2.7% Native Hawaiian or 1.2% 1.1% 1.2% 1.1% 0.1% Other Pacific Islander American Indian or Alaska Native 1.7% 1.6% 2.0% 1.7% 0.2% Other 3.9% 4.1% 4.6% 4.2% 1.8%
Age All 4 Years Year 1 Year 2 Year 3 Year 4 Group 1-2 2.7% 2.9% 2.2% 2.7% 2.8% 3-7 26.0% 27.3% 23.3% 25.4% 27.5% 8-12 38.8% 38.1% 37.7% 39.5% 39.8% 13-18 9.9% 8.6% 12.4% 9.3% 9.8% 19-24 4.9% 4.3% 5.7% 5.1% 4.6% 25-34 6.2% 6.4% 6.5% 6.2% 5.3% 35-44 4.7% 5.4% 4.8% 4.6% 4.1% 45-64 4.5% 4.8% 4.8% 4.6% 3.9% 65+ 2.4% 2.2% 2.6% 2.6% 2.3% Total 592,853xx 173,448 138,652 139,001 141,752
Self-Reported BackgroundH-E-B Body Adventure
Bexar County Respondents2015
U.S. CensusBexar County
POWERPass Users by Age Groups and Year
17

Age and GenderThe average (mean) age of POWERpass users has fluctuated between 16 in Years 1 and 4 to 17 in Years 2 and 3.19 The median age --a 10 year old-- is still a more accurate reflection of the “typical” POWERpass user. Consistent with all previous years, a slight majority (53%) of visitors signing-in and receiving POWERpass cards during Year 4 were female.
School-aged children, ages 5 through 18, continue to represent 71% of overall POWERpass users (n=100,302/141,752). Year 4 represented a slight increase from previous years, which averaged approximately 68% school-age visitors. They also represent the largest percentage of responders to the San Antonio Metropolitan Health District-sponsored All About You survey kiosks.
POWERpass Station Popularity
Of the nine POWERpass stations within the H-E-B Body Adventure, the most popular and most visited on the first floor are consistently the South Texas Trailblaze cycles and See Your Own Heartbeat. On the Blue Cross Blue Shield Wellness floor, the most popular activity is You Are What You Drink,
Year 1 Year 2 Year 3 Year 4 Hispanic or Latino (any race) 52.1% 54.3% 53.7% 54.3% 59.5% White non-Hispanic 32.3% 29.7% 30.3% 28.9% 28.6% Black or African American alone 6.1% 6.2% 5.7% 7.1% 7.2% Asian alone 2.8% 3.0% 2.7% 3.0% 2.7% Native Hawaiian or 1.2% 1.1% 1.2% 1.1% 0.1% Other Pacific Islander American Indian or Alaska Native 1.7% 1.6% 2.0% 1.7% 0.2% Other 3.9% 4.1% 4.6% 4.2% 1.8%
Age All 4 Years Year 1 Year 2 Year 3 Year 4 Group 1-2 2.7% 2.9% 2.2% 2.7% 2.8% 3-7 26.0% 27.3% 23.3% 25.4% 27.5% 8-12 38.8% 38.1% 37.7% 39.5% 39.8% 13-18 9.9% 8.6% 12.4% 9.3% 9.8% 19-24 4.9% 4.3% 5.7% 5.1% 4.6% 25-34 6.2% 6.4% 6.5% 6.2% 5.3% 35-44 4.7% 5.4% 4.8% 4.6% 4.1% 45-64 4.5% 4.8% 4.8% 4.6% 3.9% 65+ 2.4% 2.2% 2.6% 2.6% 2.3% Total 592,853xx 173,448 138,652 139,001 141,752
Self-Reported BackgroundH-E-B Body Adventure
Bexar County Respondents2015
U.S. CensusBexar County
POWERPass Users by Age Groups and Year
You Are What You Drink empowers families to take control over healthy hydration. South Texas Trailblaze challenges visitors to reach
a target heart rate while cycling along the Mission Reach of the historic San Antonio River.
18

where visitors choose a beverage and see how long it takes to work it off. The popularity is extremely promising given the urgent problem of excessive liquid calories and sugar-sweetened beverage consumption in South Texas and the nation. As shown later in this report, this urgency is also reflected in the survey responses to All About You, where a very high proportion of visitors report daily consumption of sodas and the lack of change in this behavior over four years. The All About You kiosks, made possible through the generous support of the San Antonio Metropolitan Health District, also remain extremely popular, being completed by nearly a third of visitors.
This coming year, as renovations and content additions occur in the H-E-B Body Adventure, the Witte Museum is excited to welcome two new powerful partners; Methodist Healthcare Ministries and the American Heart Association. Near the very popular See Your Own Heartbeat and the Deep in the Heart plastinated human heart specimens, sponsored by Baptist Health Foundation, there will be an exciting new addition called the ‘Stayin’ Alive Hands-Only CPR Kiosk.’ This engaging, fun and educational interactive aligns beautifully with the key pillar of “Empowerment” in the H-E-B Body Adventure. Only the second kiosk ever installed in the state of Texas, this game allows visitors to the Witte’s Body Adventure to practice hands-only CPR techniques to the beat of the disco classic “Stayin’ Alive” (at 100 to 120 beats per minute – the rate you should push on the chest during CPR).
Visitors of all ages are thereby empowered to take action should a health emergency occur. Every year, more than 350,000 cardiac arrests occur outside the hospital, many in the home and more than 20 percent in public places such as airports and sporting facilities. Survival depends on immediately receiving CPR from someone nearby. Hands-Only CPR has been shown to increase the chance of a bystander taking action in a cardiac emergency; most Americans (70 percent) feel helpless to act during a cardiac emergency because they do not know how to administer CPR or they are afraid of hurting the victim.20 When trained in a fun, non-clinical and supportive environment
All 4 Years Year 1 Year 2 Year 3 Year 4First Floor South Texas Trailblaze 46.8% 47.8% 45.1% 44.9% 48.9% (277,203) (82,949) (62,554) (62,378) (69,322) See Your Own Heartbeat 45.4% 47.1% 46.0% 43.8% 44.3% (269,048 (81,655) (63,749) (60,912) (62,732) Pick Up Your Pace 38.3% 40.2% 38.5% 37.6% 36.3% (Walk) (226,873) (69,698) (53,367) (52,296) (51,512) Pick Up Your Pace 18.3% 25.3% 17.4% 15.9% 13.0% (Height) (108,448) (43,814) (24,127) (22,126) (18,381)Blue Cross Blue Shield of TexasTM Wellness Floor All About You 26.3% 28.0% 26.0% 25.6% 25.2% (155,940) (48,556) (36,065) (35,646) (35,673) Build a Balanced Meal 25.5% 26.9% 25.8% 24.6% 24.4% (151,143) (48,556) (36,065) (35,646) (34,519) Relax Your Brain 25.5% 26.9% 25.8% 24.6% 24.4% (151,143) (46,675) (35,797) (34,152) (27,376) Sign-Out 26.3% 28.0% 26.0% 25.6% 25.2% (locatedonfirst& (155,940) (48,556) (36,065) (35,646) (35,673) secondfloors) TOTAL 592,853 173,448 138,652 139,001 141,752
Percentage and Number of Visitors who CompletedPOWERpass Activity
No
Total (100%)Skipped
Yes, less than once this week
Yes, once or twice this
week
Yes, 3 or more times
this week
Year 3 Year 4 Year 3 Year 4 Year 3 Year 4 Year 3 Year 4 8.4% 8.4% 7.8% 8.0% 10.9% 9.9% 7.7% 7.3%
8.5% 9.5% 8.2% 9.0% 9.8% 11.4% 11.9% 11.8%
24.7% 25.2% 24.0% 24.5% 27.6% 27.4% 28.6% 27.5%
56.3% 55.1% 57.6% 56.5% 51.0% 50.1% 50.8% 52.1%
2.1% 1.9% 2.42% 2.1% 0.7% 1.2% 1.1% 1.3% 5,509 8,156 4,423 6,361 1,086 1,795 3,039 3,744
School Age(Ages 8-18) Ages 8-12 Ages 13-18 Age 19+
Physical Activity among Bexar County ‘All About You’ Respondents by Age Group: Oct 16-May 31, 2018
Were you physically active for a total of at least 1 hour this week?(‘Physically active means your heart beats faster
and you breathe hard some of the time.’)
19

like the H-E-B Body Adventure, people are far more likely to remember the correct pace and feel empowered to save lives. In April 2014, just two days after learning hands-only CPR from the Dallas/Ft.Worth International Airport (DFW) training kiosk, 21-year old University of Dayton student Matt Lickenbrock successfully performed it to save the life of a fellow student. Completing the game three times over 15 minutes and practicing until he earned a perfect score, Matt was empowered with a new training that prepared him to save a life.21
All About You Survey Questions Despite the undisputed benefits of regular physical activity, increased consumption of fruits and vegetables, and reduced consumption of sugar-sweetened beverages, too few Americans engage in these behaviors. According to the Trust for America’s Health, chronic diseases such as type-2 diabetes and heart disease are responsible for seven of 10 U.S. deaths, 75% of the $2.5 trillion spent on medical care costs and billions of lost dollars in productivity each year.22 Located on the Blue Cross Blue Shield of TexasTM Wellness floor, the All About You interactive kiosks made possible through the generous support of the San Antonio Metropolitan Health District has been running exceptionally smooth and remains very popular. At this station, visitors take a picture of their face (not saved in the database) and through interactive, questions about their health behaviors and preferences, build a fun, animated avatar that is then printed on their take-home POWERprofile next to that of their selected Buddy.
20

Physical ActivityNational Physical Activity Guidelines for Americans suggests that taking part in aerobic and muscle-strengthening activities each week will improve one’s physical and emotional well-being. Children and adolescents should engage in at least 60 minutes of physical activity every day. Most of the 60 minutes or more a day should be either moderate or vigorous intensity physical activity and should include vigorous activity at least 3 days a week. The H-E-B Body Adventure is providing a critical opportunity for children, adolescents and adults to engage in moderate and vigorous physical activity towards the end of increasing these rates and meeting SA202023, Health Collaborative Community Health Improvement Plan24 and national goals.
Numerous activities throughout the H-E-B Body Adventure are designed to encourage and empower individuals to engage in heart-healthy aerobic activity in a fun, locally relevant setting. At South Texas Trailblaze, for example, visitors are challenged to reach a target heart rate while cycling their virtual avatars along the Mission Reach of the San Antonio River, accompanied by their Buddy. The Pull Your Own Weight Pulleys, Mt. Witte climbing wall, and Move It!: A Game of Action interactive light up gaming floor are just some of the many additional opportunities.
Beginning in October 2016, a new question was introduced that more accurately captures both child and adult physical activity levels, while also allowing for more direct comparison to other surveys that monitor the nation’s achievement of national recommendations for moderate and vigorous physical activity (at least 60 minutes per day for youth): Were you physically active for a total of at least 1 hour this week? (The following is audio, but not shown on screen: ‘Physically active means your heart beats faster and you breathe hard some of the time.’)
Data shows that a majority of respondents (over 50%) with valid Bexar County zip codes report being physically active for an hour 3 or more times the previous week. Younger children ages 8 to 12 report being the most physically active, with 57.6% reporting one hour of physical activity three or more times the previous week in Year 4. The least physically active age group are those Bexar County school-age youth ages 13 to 18, with 50.7% reporting one hour of physical activity three or more times the previous week.
21

With one exception (zip code 78002 near Atascosa, TX), most zip codes (such as 78215, 78209, 78248, 78257 and 78231) on the Northside account for the highest percentage of self-reported physical activity among school-age youth ages 8 through 18. The map and accompanying zip code list shows the proportion of school-age respondents who reported doing sixty minutes of physical activity three or more times in the previous week.
All 4 Years Year 1 Year 2 Year 3 Year 4First Floor South Texas Trailblaze 46.8% 47.8% 45.1% 44.9% 48.9% (277,203) (82,949) (62,554) (62,378) (69,322) See Your Own Heartbeat 45.4% 47.1% 46.0% 43.8% 44.3% (269,048 (81,655) (63,749) (60,912) (62,732) Pick Up Your Pace 38.3% 40.2% 38.5% 37.6% 36.3% (Walk) (226,873) (69,698) (53,367) (52,296) (51,512) Pick Up Your Pace 18.3% 25.3% 17.4% 15.9% 13.0% (Height) (108,448) (43,814) (24,127) (22,126) (18,381)Blue Cross Blue Shield of TexasTM Wellness Floor All About You 26.3% 28.0% 26.0% 25.6% 25.2% (155,940) (48,556) (36,065) (35,646) (35,673) Build a Balanced Meal 25.5% 26.9% 25.8% 24.6% 24.4% (151,143) (48,556) (36,065) (35,646) (34,519) Relax Your Brain 25.5% 26.9% 25.8% 24.6% 24.4% (151,143) (46,675) (35,797) (34,152) (27,376) Sign-Out 26.3% 28.0% 26.0% 25.6% 25.2% (locatedonfirst& (155,940) (48,556) (36,065) (35,646) (35,673) secondfloors) TOTAL 592,853 173,448 138,652 139,001 141,752
Percentage and Number of Visitors who CompletedPOWERpass Activity
No
Total (100%)Skipped
Yes, less than once this week
Yes, once or twice this
week
Yes, 3 or more times
this week
Year 3 Year 4 Year 3 Year 4 Year 3 Year 4 Year 3 Year 4 8.4% 8.4% 7.8% 8.0% 10.9% 9.9% 7.7% 7.3%
8.5% 9.5% 8.2% 9.0% 9.8% 11.4% 11.9% 11.8%
24.7% 25.2% 24.0% 24.5% 27.6% 27.4% 28.6% 27.5%
56.3% 55.1% 57.6% 56.5% 51.0% 50.1% 50.8% 52.1%
2.1% 1.9% 2.42% 2.1% 0.7% 1.2% 1.1% 1.3% 5,509 8,156 4,423 6,361 1,086 1,795 3,039 3,744
School Age(Ages 8-18) Ages 8-12 Ages 13-18 Age 19+
Physical Activity among Bexar County ‘All About You’ Respondents by Age Group: Oct 16-May 31, 2018
Were you physically active for a total of at least 1 hour this week?(‘Physically active means your heart beats faster
and you breathe hard some of the time.’)
Percent of School-Age Youth (Ages 8 to 18) that Reported High Physical Activity (3+ times this week), by Zip; Years 3 and 4
Top 20 Zip Codes with Percent of School-Age Youth (Ages 8-18) that Reported High Physical Activity (3+ times this week), Years 3 and 4
22
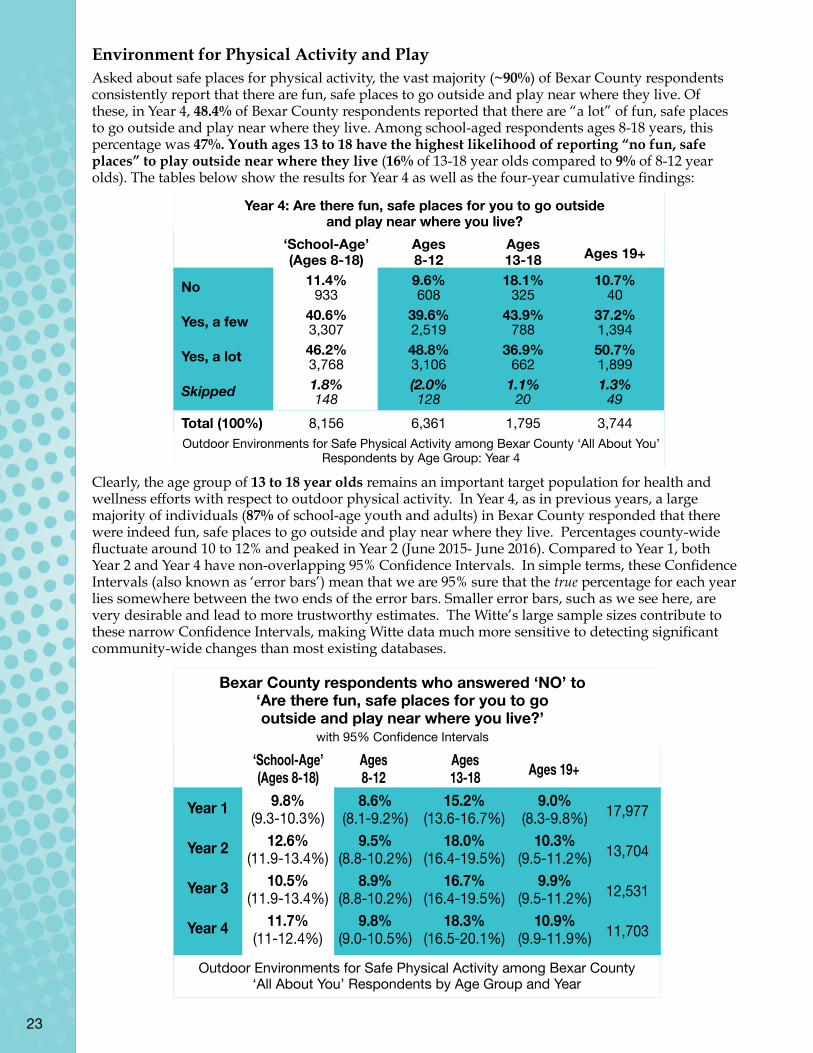
Environment for Physical Activity and PlayAsked about safe places for physical activity, the vast majority (~90%) of Bexar County respondents consistently report that there are fun, safe places to go outside and play near where they live. Of these, in Year 4, 48.4% of Bexar County respondents reported that there are “a lot” of fun, safe places to go outside and play near where they live. Among school-aged respondents ages 8-18 years, this percentage was 47%. Youth ages 13 to 18 have the highest likelihood of reporting “no fun, safe places” to play outside near where they live (16% of 13-18 year olds compared to 9% of 8-12 year olds). The tables below show the results for Year 4 as well as the four-year cumulative findings:
Clearly, the age group of 13 to 18 year olds remains an important target population for health and wellness efforts with respect to outdoor physical activity. In Year 4, as in previous years, a large majority of individuals (87% of school-age youth and adults) in Bexar County responded that there were indeed fun, safe places to go outside and play near where they live. Percentages county-wide fluctuate around 10 to 12% and peaked in Year 2 (June 2015- June 2016). Compared to Year 1, both Year 2 and Year 4 have non-overlapping 95% Confidence Intervals. In simple terms, these Confidence Intervals (also known as ‘error bars’) mean that we are 95% sure that the true percentage for each year lies somewhere between the two ends of the error bars. Smaller error bars, such as we see here, are very desirable and lead to more trustworthy estimates. The Witte’s large sample sizes contribute to these narrow Confidence Intervals, making Witte data much more sensitive to detecting significant community-wide changes than most existing databases.
‘School-Age’ Ages Ages (Ages 8-18) 8-12 13-18 Ages 19+
No 11.4% 9.6% 18.1% 10.7% 933 608 325 40
Yes, a few 40.6% 39.6% 43.9% 37.2% 3,307 2,519 788 1,394
Yes, a lot 46.2% 48.8% 36.9% 50.7% 3,768 3,106 662 1,899
Skipped 1.8% (2.0% 1.1% 1.3% 148 128 20 49Total (100%) 8,156 6,361 1,795 3,744Outdoor Environments for Safe Physical Activity among Bexar County ‘All About You’
Respondents by Age Group: Year 4
Outdoor Environments for Safe Physical Activity among Bexar County ‘All About You’ Respondents by Age Group and Year
Year 4: Are there fun, safe places for you to go outside and play near where you live?
Bexar County respondents who answered ‘NO’ to ‘Are there fun, safe places for you to go outside and play near where you live?’
with 95% Confidence Intervals
Year 1 9.8% 8.6% 15.2% 9.0% (9.3-10.3%) (8.1-9.2%) (13.6-16.7%) (8.3-9.8%) 17,977
Year 2 12.6% 9.5% 18.0% 10.3% (11.9-13.4%) (8.8-10.2%) (16.4-19.5%) (9.5-11.2%) 13,704
Year 3 10.5% 8.9% 16.7% 9.9% (11.9-13.4%) (8.8-10.2%) (16.4-19.5%) (9.5-11.2%) 12,531
Year 4 11.7% 9.8% 18.3% 10.9% (11-12.4%) (9.0-10.5%) (16.5-20.1%) (9.9-11.9%) 11,703
‘School-Age’(Ages 8-18)
Ages8-12
Ages13-18 Ages 19+
23

This means that these years represent a small, but statistically significant, increase in the percentage of Bexar County school-age youth reporting that there were ‘no fun, safe places’ to go outside and play near where they live. To understand this better, more detailed analyses will be required of specific zip codes that have seen changes in these percentages over the four years. These analyses are currently underway in collaboration with the San Antonio Metropolitan Health District and San Antonio Parks and Recreation.
The following map and chart of Confidence Intervals across sectors of Bexar County demonstrates that, as with most other variables, significant geographic disparities exist across the county with respect to perceptions of safe, fun places to play outdoors. Again, the Near Northside, Far Northwest, and Far Northside show statistically significant and more positive perceptions of safety and physical environments compared to the other parts of the county.
The most dramatic regional differences can be seen between the Near Westside and the Far Northside. When we compile the four years of data, more than twice as many school-age youth in the Near Westside are likely to respond that there are no fun, safe places to play near where they live compared with those on the Far Northside.
These unprecedented data have provided important assistance in identifying targeted outreach efforts and city-wide planning across partners and institutions.
Percent Bexar Co. Youth (8-18) who report
Percent of School-Age Youth (Ages 8-18) that Reported, No fun, safe places near where they live to go outside and play by Zip Code, Year 4
Top 20 Zip Codes with Percent of School Age Youth (Ages 8-18) that Reported, No fun, safe places near where they live to go outside and play.
24

Favorite Physical ActivitiesThe table below shows the rankings of the ‘Favorite Ways to Stay Active and Get Moving’ selected by school-age respondents by gender and year. Consistently across all years, males showed a significantly higher preference for Team Sports than girls (32.4% vs. 11.3%). The top 3 favorite activities chosen by males across all four years were Team Sports (32.4%), Running (17.8%) and Swimming/Water sports (16.3%), while the most popular activities among females were Dancing (19.1%), Walking (19%) and Swimming/Water sports (16.3%). It is interesting to note that boys and girls share a similar joy of swimming and water sports.
Year 1 Year 2 Year 3 Year 4 All 4 Years Combined
Team Sports 34.4% 33.6% 31.4% 29.2% 4,517 (32.4%)
Running 16.7% 17.7% 18.7% 18.6% 2,486 (17.8%) Swimming/Water 16.5% 16.2% 16.0% 16.4% 2,274 Sports (16.3%)
Biking 10.7% 10.2% 10.3% 11.5 1,491 (10.7%)
Walking 6.7% 7.3% 7.9% 8.8% 1,057 (7.6%)
Weight Lifting 5.9% 6.7% 6.3% 5.5% 850 (6.1%)
Dancing 5.1% 4.5% 4.7% 5.6% 692 (5.0%)
Yoga 1.3 % 1.1% 1.7% 1.1% 180 (1.3%)
Gardening 1.1% 1.3% 1.3% 1.3% 170 (1.2%)
Skipped 1.8% 1.5% 1.7% 2.0% 244 (1.8%) Total (100%) 4,477 3,254 3,068 3,162 13,961
Year 1 Year 2 Year 3 Year 4 All 4 Years Combined Dancing 20.9% 21.6% 21.5% 18.2% 6,826 (19.1%)
Walking 7.8% 8.9% 9.5% 18.9% 6,790 (19.0%) Swimming/Water 26.0% 22.1% 23.6% 19.5% 6,572 Sports (18.4%) Running 11.3% 13.2% 11.8% 10.8% 4,027 (11.3%)
Team Sports 18.2% 18.9% 16.4% 12.6% 4,464 (12.5%)
Biking 9.1% 7.7% 8.8% 7.3% 2,479 (6.9%)
Yoga 3.5% 3.9% 4.2% 5.8% 2,127 (6.0%)
Weight Lifting 1.7% 2.1% 2.7% 3.7% 1,295 (3.6%)
Gardening 1.6% 1.5% 1.5% 2.1% 806 (2.3%) Skipped 56 (0.7%) 63 (1.1%) 49 (0.9%) 1.2% 310 (0.9%) Total 7,761 5,989 5,303 7,451 35,696
FAVORITE PHYSICAL ACTIVITIESWhat is your favorite way to stay active and get moving?
Bexar County School-Age Males (8-18)
Bexar County School-Age Females (5-18)
25

Dancing was consistently and significantly more popular among females (19.1% vs 5% respectively). Running, however, is more popular among boys (17.8% vs. 11.3%) Dancing and running, however, are both low-cost activities that require no equipment and are excellent ways to stay aerobically fit.
Another activity that remains significantly more popular among females than males is Yoga (6% vs. 1.3% respectively). Interestingly, at the national level, gentle, mindful movement practices like yoga has steadily become more popular. In 2012 (the most recent year for which there is nationally representative data), approximately 21 million adults—nearly double the number from 2002—and 1.7 million children practiced yoga. Body Adventure data regarding popularity of these activities is also reflected at the national level. Yoga, tai chi and qi gong, all meditative movement therapies, are significantly more common in female youth ages 17 and under compared to boys (4.2% vs. 1.0% respectively). There is a growing body of evidence that certain mind and body practices can help people better manage pain and reduce stress.26
Sedentary BehaviorScreen Time As one key metric of sedentary behavior, All About You also includes a question about time spent watching TV or at a computer screen playing video games. The American Academy of Pediatrics recommends that children and teens should engage with entertainment media for fewer than two hours per day, and that this should be high-quality content.27 Across all ages and respondents, as well as all four years, greater than 50% of the All About You participants reported two or more hours of screen time per day. High proportions of Bexar County respondents spend more than 2 hours per day watching television or playing video games:
Four hours or more of screen time among 8 to 12 year-olds has increased from 18.2% in Year 1, to 21.8% in Year 4. Among 13 to 18 year-olds, the increase has been from 23.3% to 30.5%. As in all previous years, it is apparent that adolescents –the age group of 13-18 year olds- remain a particular target age for sustaining any educational or public health messaging and represent a peak time for screen use. Most importantly, there has been a gradual and steady increase in the percentage of Bexar County school-age respondents who report 4 or more hours of screen time per day (TV, video game
Year 4: Screen time among Bexar County Respondents by Age Group ‘On an average school or work day, how many hours do you watch TV or play video games?’
None 11.7% 12.2% 9.8% 7.7% 954 778 176 290
Less than 1 hr per day 31.5% 33.6% 24.4% 32.1% 2,572 2,135 437 1,218
2 to 3 hours a day 31.7% 30.9% 34.6% 42.6% 2,587 1,966 621 1,614
4 or more hours a day 23.3% 21.4% 30.1% 16.4% 1,899 1,358 541 621
Skipped 1.8% 2.0% 1.1% 1.3 144 124 20 50
Total 100% 100% 100% 100% 8,156 6,361 1,795 3,793
‘School Age’(Ages 8-18)
Ages8-12
Ages13 -18
Ages 19+
Year 1 Year 2 Year 3 Year 4 Fruit29 Vegetables30 Fruit Vegetables Fruit Vegetables Fruit VegetablesNo, I didn’t eat 20.0% 31.8% 23.1% 33.6% 23.0% 34.2% 22.4% 34.4%any ____ yesterday.Yes, I ate ____ 25.5% 26.8% 25.4% 26.3% 25.0% 24.4% 24.4% 24.6%1 time yesterday.Yes, I ate ____ 23.7% 19.8% 22.8% 19.2% 22.2% 19.4% 22.3% 17.9%2 times yesterday.Yes, I ate ____ 29.9% 20.6% 27.6% 20.2% 28.8% 20.8% 29.7% 21.7%3 or more times yesterday.Skipped 1.0% 1.0% 1.1% 0.9% 1.0% 1.1% 1.2% 1.4%Total 11,826 8,904 8,102 8,142
Did you eat any ______ yesterday?
Table: Fruit and Vegetable Consumption among Bexar County School-Age (Ages 8-18) Respondents by Year
26

use). This increase has proven to be statistically significant, as can be seen by the non-overlapping 95% Confidence Intervals below:
Regional differences in screentime are demonstrated in the following map.
As San Antonians become more tech-savy, the high use of digital media highlights the urgency of bridging nature and health and providing a broader array of opportunities for transformative outdoor experiences, both within and beyond city.
Percent of School-Age Youth (Ages 8-18) that Reported 4+ Hours of screentime per day
Top 20 Zip Codes with Percent School-Age Youth (Ages 8-18) that Reported 4+ Hours of screentime per day
27

Nutrition and Healthy EatingBuild a Balanced Meal Nutrition is a vital part of a healthy lifestyle and well-being, so it should be noted here that the Witte has several exhibits in the H-E-B Body Adventure that address the importance of good nutrition. For instance 151,143 individuals have played the fun, interactive game Build A Balanced Meal, where visitors are challenged to select nutritious foods from the major food groups according to MyPlate.gov national dietary recommendations. By selecting a balanced mix of foods, visitors fuel their selected Buddy on an interactive walking trek along the San Antonio River from Mission Espada to the Witte Museum. This has proven to be an extremely popular game, as visitors repeatedly play to meet the challenge of adequately balancing their plate. What is particularly encouraging is that the age distribution of visitors playing this game mirrors that of the general POWERpass users. That is, visitors of all ages are enjoying this interactive nutrition education game.
Favorite Healthy SnacksConsistent with previous years, fruit (chosen by 57.4% of Bexar County school-age respondents in Year 4) continues by far to be the most popular item selected as a favorite healthy snack. Vegetables consistently come in last place as a favorite healthy snack among school-age youth. This changes rather dramatically in adults, where vegetables jump to the second-most popular healthy snack item behind fruit, with more than twice as many adults (ages 19+) as school-age youth choosing vegetables as a favorite healthy snack (16% vs 7% respectively). Similar results were found in all years.
Fruit and Vegetable ConsumptionThe Federal Dietary Guidelines for Americans recommend vegetables and fruits, whole grains and low-fat dairy products in order to reduce the risk of chronic disease and obesity. The All About You kiosk helps the Witte and its partners monitor community-wide achievement of these Dietary Guidelines. The low percentage of respondents selecting vegetables as a favorite food has already
had an impact on specific messaging for the Witte’s interactive demonstrations to school groups and families. In collaboration with the Children’s Hospital of San AntonioTM Culinary Health Education for Families (CHEF) program’s Chef Maria Palma and Medical Director Julie LaBarba, MD, FAAP, the Witte continues to develop an array of diverse recipes and scripts for H-E-B Body Adventure presenters that focus specifically on how to “dress up” or make vegetables more appealing as fun snacks. The Witte is also targeting fun ways to make water both tasty and the drink of choice over sugar-sweetened beverages. These efforts are strongly informed by baseline findings from the All About You station and the high popularity of You Are What You Drink stair stepper.
28
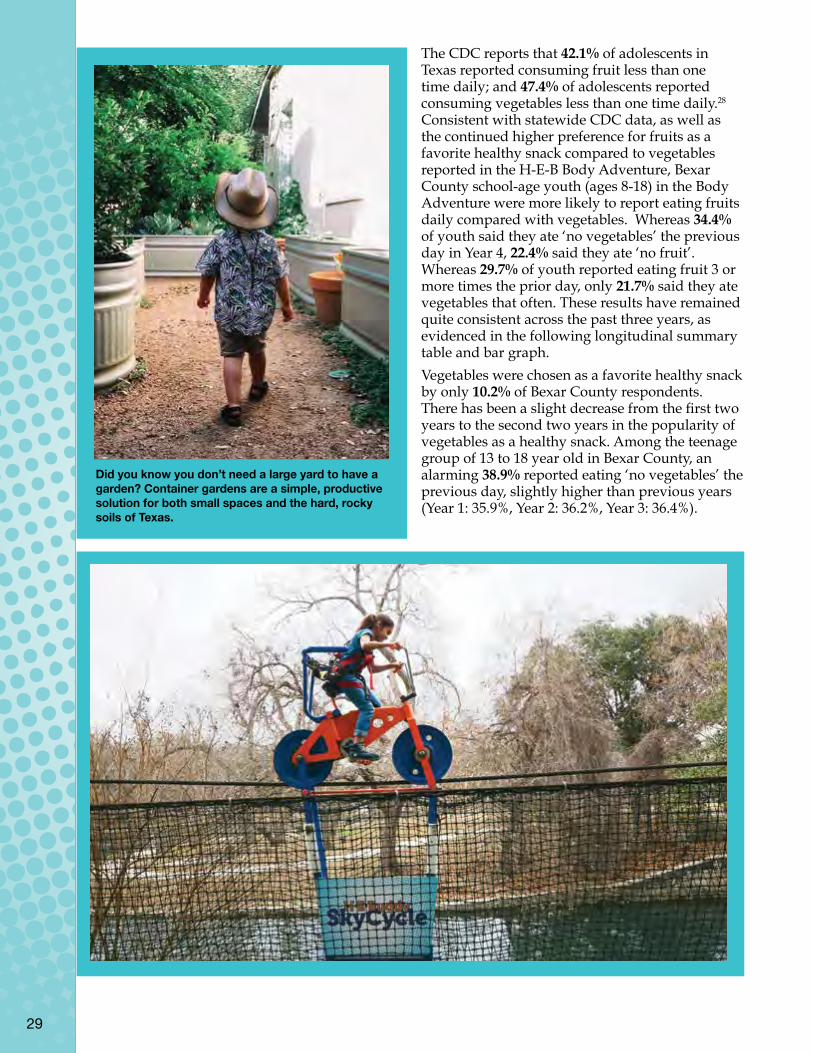
The CDC reports that 42.1% of adolescents in Texas reported consuming fruit less than one time daily; and 47.4% of adolescents reported consuming vegetables less than one time daily.28 Consistent with statewide CDC data, as well as the continued higher preference for fruits as a favorite healthy snack compared to vegetables reported in the H-E-B Body Adventure, Bexar County school-age youth (ages 8-18) in the Body Adventure were more likely to report eating fruits daily compared with vegetables. Whereas 34.4% of youth said they ate ‘no vegetables’ the previous day in Year 4, 22.4% said they ate ‘no fruit’. Whereas 29.7% of youth reported eating fruit 3 or more times the prior day, only 21.7% said they ate vegetables that often. These results have remained quite consistent across the past three years, as evidenced in the following longitudinal summary table and bar graph.
Vegetables were chosen as a favorite healthy snack by only 10.2% of Bexar County respondents. There has been a slight decrease from the first two years to the second two years in the popularity of vegetables as a healthy snack. Among the teenage group of 13 to 18 year old in Bexar County, an alarming 38.9% reported eating ‘no vegetables’ the previous day, slightly higher than previous years (Year 1: 35.9%, Year 2: 36.2%, Year 3: 36.4%).
29

Year 4: Screen time among Bexar County Respondents by Age Group ‘On an average school or work day, how many hours do you watch TV or play video games?’
None 954 778 176 290 (11.7%) (12.2%) (9.8%) (7.7%)
Less than 1 hr per day 2,572 2,135 437 1,218 (31.5%) (33.6%) (24.4%) (32.1%)
2 to 3 hours a day 2,587 1,966 621 1,614 (31.7%) (30.9%) (34.6%) (42.6%)
4 or more hours a day 1,899 1,358 541 621 (23.3%) (21.4%) (30.1%) (16.4%)
Skipped 144 124 20 50 (1.8%) (2.0%) (1.1%) (1.3)
Total 8,156 6,361 1,795 3,793 (100%) (100%) (100%) (100%)
‘School Age’(Ages 8-18)
Ages8-12
Ages13 -18
Ages 19+
Year 1 Year 2 Year 3 Year 4 Fruit29 Vegetables30 Fruit Vegetables Fruit Vegetables Fruit VegetablesNo, I didn’t eat 20.0% 31.8% 23.1% 33.6% 23.0% 34.2% 22.4% 34.4%any ____ yesterday.Yes, I ate ____ 25.5% 26.8% 25.4% 26.3% 25.0% 24.4% 24.4% 24.6%1 time yesterday.Yes, I ate ____ 23.7% 19.8% 22.8% 19.2% 22.2% 19.4% 22.3% 17.9%2 times yesterday.Yes, I ate ____ 29.9% 20.6% 27.6% 20.2% 28.8% 20.8% 29.7% 21.7%3 or more times yesterday.Skipped 1.0% 1.0% 1.1% 0.9% 1.0% 1.1% 1.2% 1.4%Total 11,826 8,904 8,102 8,142
Did you eat any ______ yesterday?
Table: Fruit and Vegetable Consumption among Bexar County School-Age (Ages 8-18) Respondents by Year
The dramatic reduction in both fruit and vegetable consumption during the teenage years is particularly evident when visualized this way.
30

Another interesting finding that emerged when examining fruit and vegetable consumption over four years is that there was a consistent and significant gender difference in the percentage of school-age girls and boys consuming no fruit and no vegetables respectively. In both cases, males were least likely to eat fruit and vegetables compared with girls. That is, the percentage of school-age boys (ages 8-18) reporting they ate ‘no fruit’ or ‘no vegetables yesterday’ was significantly higher than that of school-age females. Chi-squared tests were used to assess group differences with statistical significance set at p<0.05. Similar gender differences were seen in school-age youth consumption of sodas. The following charts show gender differences by year and cumulatively using fruit as an illustration.
A reference line at 22.2% has been added to the 95% Confidence Interval graph to highlight that they do not cross, and therefore the gender difference is statistically significant when examined across all four years cumulatively.
Year 1 Year 2 Year 3 Year 4 Males 21.5% 23.9% 23.9% 25.0% (20.2-22.8%) (22.2-25.6%) (22.2-25.6) (23.3-26.6%) Females 17.0% 18.4% 18.7% 17.9% (16.0-17.9%) (17.2-19.6%) (17.4-19.9%) (16.7-19.2%) Statistically Pearson chi2(1) = Pearson chi2(1) = Pearson chi2(1) = Pearson chi2(1) = significant 31.2476 28.5731 25.0029 45.2776 if Pr<0.05 Pr = 0.000 Pr = 0.000 Pr = 0.000 Pr = 0.000
Year 1 Year 2 Year 3 Year 4 Males 27.5% 30.28% 33.69% 29.44% (24.2-30.9%) (26.9-33.6%) (29.8-37.6%) (25.7-33.2%) Females 26.27% 31.28% 31.68% 29.03% (24-28.6%) (20.1-33.5%) (29-34.3%) (26.5-31.6%) Statistically Pearson chi2(1) = Pearson chi2(1) = Pearson chi2(1) = Pearson chi2(1) = significant 0.3780 0.2377 0.7011 0.0321 if Pr<0.05 Pr = 0.539 Pr = 0.626 Pr = 0.402 Pr = 0.858
Percent of Bexar Co Youth Ages 8-12 who report they‘Ate NO FRUIT yesterday’ by Year and Gender
Percent of Bexar Co Youth Ages 13-18 who report they‘Ate NO FRUIT yesterday’ by Year and Gender
31
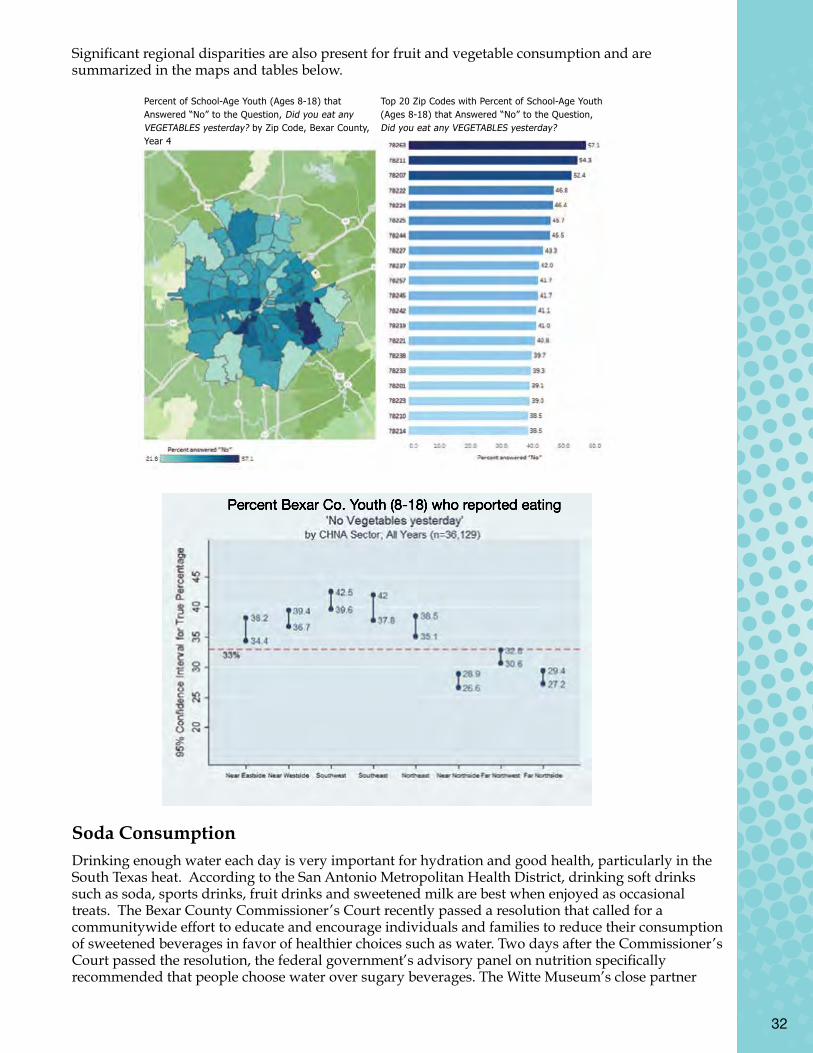
Percent Bexar Co. Youth (8-18) who reported eating
Significant regional disparities are also present for fruit and vegetable consumption and are summarized in the maps and tables below.
Soda ConsumptionDrinking enough water each day is very important for hydration and good health, particularly in the South Texas heat. According to the San Antonio Metropolitan Health District, drinking soft drinks such as soda, sports drinks, fruit drinks and sweetened milk are best when enjoyed as occasional treats. The Bexar County Commissioner’s Court recently passed a resolution that called for a communitywide effort to educate and encourage individuals and families to reduce their consumption of sweetened beverages in favor of healthier choices such as water. Two days after the Commissioner’s Court passed the resolution, the federal government’s advisory panel on nutrition specifically recommended that people choose water over sugary beverages. The Witte Museum’s close partner
Percent of School-Age Youth (Ages 8-18) that Answered “No” to the Question, Did you eat any VEGETABLES yesterday? by Zip Code, Bexar County, Year 4
Top 20 Zip Codes with Percent of School-Age Youth (Ages 8-18) that Answered “No” to the Question, Did you eat any VEGETABLES yesterday?
32
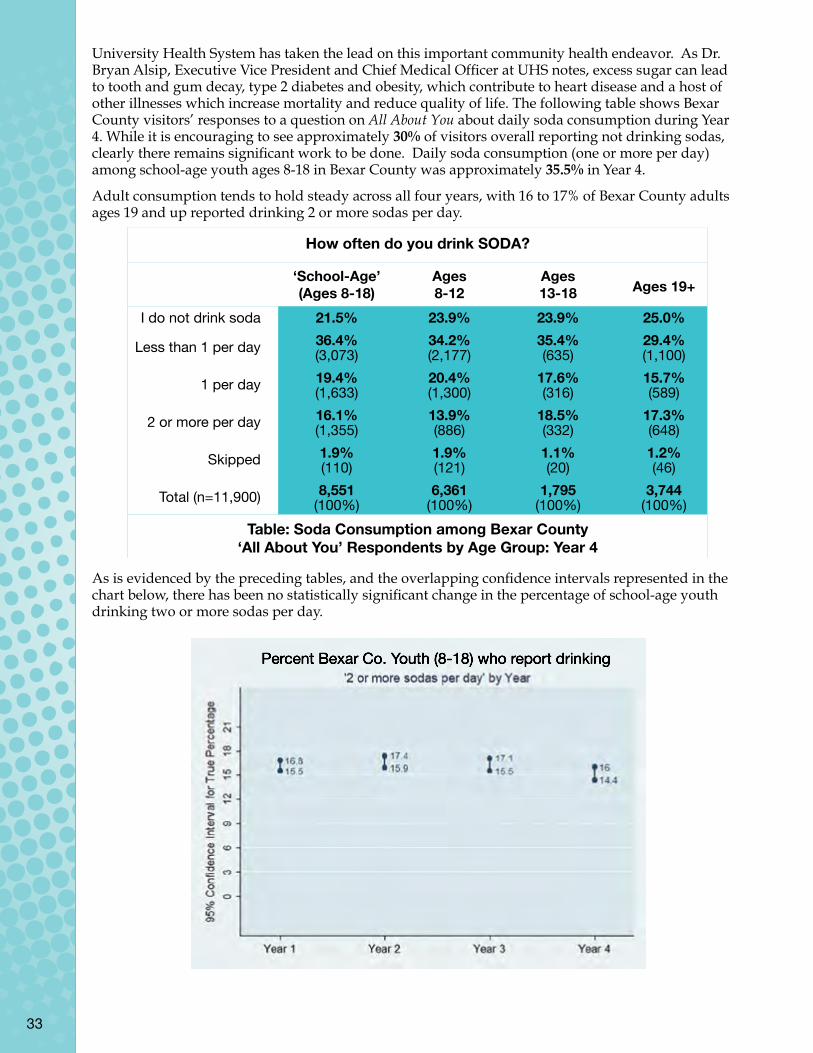
University Health System has taken the lead on this important community health endeavor. As Dr. Bryan Alsip, Executive Vice President and Chief Medical Officer at UHS notes, excess sugar can lead to tooth and gum decay, type 2 diabetes and obesity, which contribute to heart disease and a host of other illnesses which increase mortality and reduce quality of life. The following table shows Bexar County visitors’ responses to a question on All About You about daily soda consumption during Year 4. While it is encouraging to see approximately 30% of visitors overall reporting not drinking sodas, clearly there remains significant work to be done. Daily soda consumption (one or more per day) among school-age youth ages 8-18 in Bexar County was approximately 35.5% in Year 4.
Adult consumption tends to hold steady across all four years, with 16 to 17% of Bexar County adults ages 19 and up reported drinking 2 or more sodas per day.
As is evidenced by the preceding tables, and the overlapping confidence intervals represented in the chart below, there has been no statistically significant change in the percentage of school-age youth drinking two or more sodas per day.
‘School-Age’ Ages Ages (Ages 8-18) 8-12 13-18 Ages 19+
I do not drink soda 21.5% 23.9% 23.9% 25.0%
Less than 1 per day 36.4% 34.2% 35.4% 29.4% (3,073) (2,177) (635) (1,100)
1 per day 19.4% 20.4% 17.6% 15.7% (1,633) (1,300) (316) (589)
2 or more per day 16.1% 13.9% 18.5% 17.3% (1,355) (886) (332) (648)
Skipped 1.9% 1.9% 1.1% 1.2% (110) (121) (20) (46)
Total (n=11,900) 8,551 6,361 1,795 3,744 (100%) (100%) (100%) (100%)
‘School-Age’ Ages Ages (Ages 8-18) 8-12 13-18 Ages 19+
Underweight (< 5th percentile) 4.0% 4.4% 2.4% 1.5% (353) (307) (46) (56) Normal Weight 51.2% 50.8% 52.3% 28.4% (5th to < 85th percentile) (4,503) (3,514) (989) (1,075) Overweight 1,696 18.5% 22.2% 30.9% (85th to <95th percentile) (19.3%) (1,276) (420) (1,167) Obese 2,251 26.3% 23.1% 39.2% (85th to <95th percentile) (25.6%) (1,815) (436) (1,484) Total (100%) 8,803 6,912 1,891 3,782
How often do you drink SODA?
BMI Percentile Categories by Age Group: Years 1-4
Table: Soda Consumption among Bexar County ‘All About You’ Respondents by Age Group: Year 4
Percent Bexar Co. Youth (8-18) who report drinking
33

Similar trends over the four years were found when broken down into finer age groups (ages 8-12, 13-18, 19 and older). No significant declines in soda consumption are evident in any age group.
Several interesting findings, however, did emerge from the data. During the school-age years, soda consumption increases and peaks during adolescence. Youth 13 to 18 years old significantly more likely than their younger counterparts 8-12 years old, and adults 19 and older, to report consuming two or more sodas per day. This has been the case in previous years, and occurred again in Year 4.
Education and outreach regarding the risks of heavy consumption of sugar-sweetened beverages such as soda, remains a high priority.
Significant regional differences exist for high soda consumption, with soda consumption highest on the Near Eastside and Southeast sectors and lowest on the Far Northside.
School-age boys were significantly more likely to consume two or more sodas per day compared with girls (18.1% vs. 13.6% respectively; Pearson chi2(1) = 33.4185 Pr = 0.000). This disparity is statistically significant and has held consistent each year.
Percent Bexar Co. Residents who report drinking
Percent of School-Age Youth (Ages 8-18) that Reported Drinking 2+ sodas per day by Zip Code, Bexar County, Year 4
Top 20 Zip Codes with Percent of School-Age Youth (Ages 8-18) that Reported Drinking 2+ sodas per day
34

Overweight and Obesity Body Mass Index (BMI) is a number calculated from a person’s weight and height (weight (kg) / [height (m)]2). BMI can be calculated for a significant subset of visitors to the H-E-B Body Adventure, providing estimates of overweight and obesity on a scale heretofore unavailable. Because the amount of body fat changes with age and is different between boys and girls, BMI is both age- and gender-specific for children and adolescents. The CDC BMI-for-age growth charts take into account these differences and visually show BMI as a percentile ranking.
From 1995 to 2010, the prevalence of obesity in Texas adults doubled (15.9% to 31.7%). Among Texas youth in grades 9 through 12, the rates of obesity have fluctuated since 1995 from a low of 13.2% in 2009 to 15.7% in 2016, with very little significant change made at the statewide. It is important to note that these CDC data are based on national surveys that are self-report (“About how much do you weigh without shoes?” and “About how tall are you without shoes?”) The Centers for Disease Control and Prevention (CDC) reports that 33.6% of Texans were obese (Body Mass Index >30) in 2016.31 Rates of overweight and obesity among adults in Bexar County according to the San Antonio Metropolitan Health District were 70.4%, higher than the national average of 64.8% as of 2016.32
Since age and gender are captured during Sign-In with the POWERpass, if a visitor experiences both the Pick Up Your Pace Walk Investigation Station and the You Are What You Drink stepper the Witte is able to calculate age and gender-specific weight status categories for both children and adults according to CDC standards. The height sensor is an industrial ultrasonic sensor from Senix (model TSPC-15S) that calculates a measurement from the top of the visitors head and subtracts that from a precalibrated floor distance based on the height of the sensor installation. At You Are What You Drink, visitors step up to a giant, colorful soda cup. Using a commercially available exercise stepper and scale that was sensitized, calibrated and integrated into the design, visitors select water or a sugary beverage and learn from their selected Buddy how long it will take to burn off the calories. Visitors’ weight is read here, though not displayed to the visitor. This decision was made in consultation with community Science Summit participants in order to avoid stigmatization and a misguided focus on pounds as opposed to overall wellness. It is important to emphasize that even in the absence of weight loss, significant improvements in health and well-being can be achieved through increased physical activity, healthy eating and proper rest and relaxation. The scale is reset/calibrated to zero on a daily basis each morning to avoid any ‘drift’ from the hundreds of visitors using the scales daily.
For adults, BMI is interpreted through categories that are not dependent on gender or age. While BMI does not measure body fat directly, research has shown that it correlates to more direct measures of body fat, such as underwater weighing and dual energy x-ray absorptiometry (DXA). The correlation between the BMI and body fatness is fairly strong, but some important caveats remain regarding interpretation of weight status using BMI. Even if two people have the same BMI, it is possible that their level of body fatness and muscularity (and thus general fitness) may differ. The Witte Museum and its partners recommend that all individuals consult a trained healthcare provider to perform appropriate assessments in order to evaluate an individual’s health status and risks.
Annual data comparisons are shown here with the caveat that they should be interpreted cautiously, and again, do not reflect BMI status change at the individual level. This is a very important point.
35
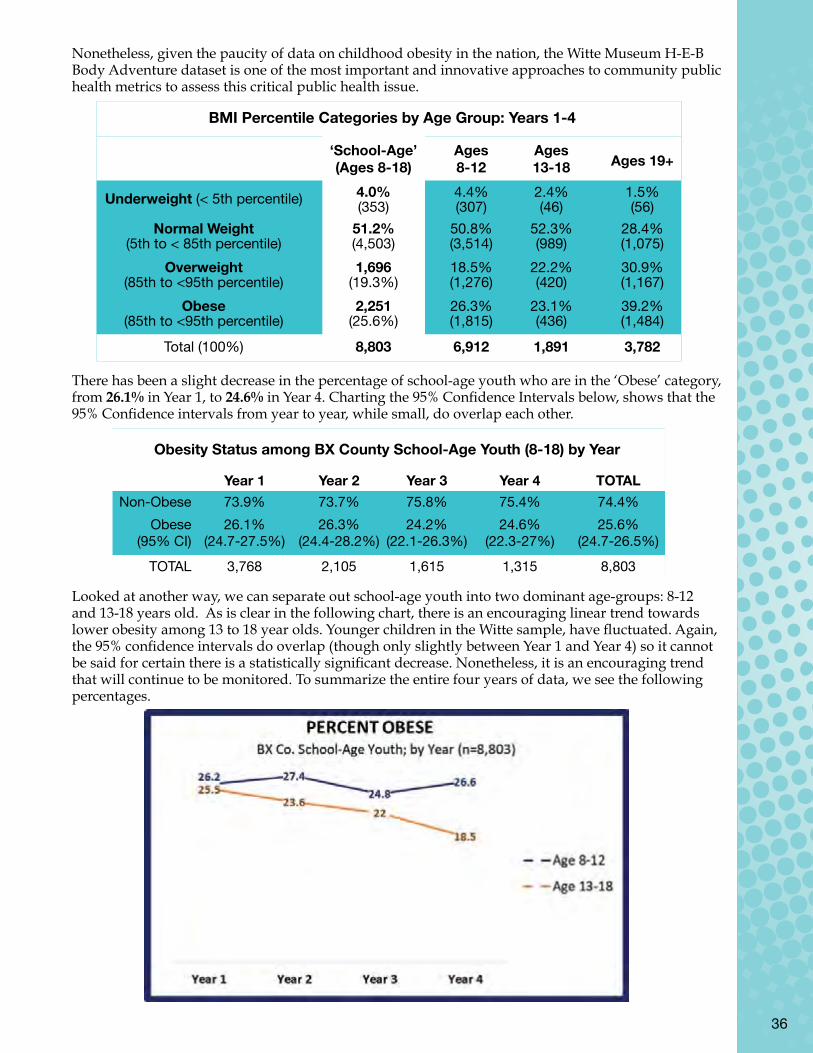
Nonetheless, given the paucity of data on childhood obesity in the nation, the Witte Museum H-E-B Body Adventure dataset is one of the most important and innovative approaches to community public health metrics to assess this critical public health issue.
There has been a slight decrease in the percentage of school-age youth who are in the ‘Obese’ category, from 26.1% in Year 1, to 24.6% in Year 4. Charting the 95% Confidence Intervals below, shows that the 95% Confidence intervals from year to year, while small, do overlap each other.
Looked at another way, we can separate out school-age youth into two dominant age-groups: 8-12 and 13-18 years old. As is clear in the following chart, there is an encouraging linear trend towards lower obesity among 13 to 18 year olds. Younger children in the Witte sample, have fluctuated. Again, the 95% confidence intervals do overlap (though only slightly between Year 1 and Year 4) so it cannot be said for certain there is a statistically significant decrease. Nonetheless, it is an encouraging trend that will continue to be monitored. To summarize the entire four years of data, we see the following percentages.
‘School-Age’ Ages Ages (Ages 8-18) 8-12 13-18 Ages 19+
I do not drink soda 21.5% 23.9% 23.9% 25.0%
Less than 1 per day 36.4% 34.2% 35.4% 29.4% (3,073) (2,177) (635) (1,100)
1 per day 19.4% 20.4% 17.6% 15.7% (1,633) (1,300) (316) (589)
2 or more per day 16.1% 13.9% 18.5% 17.3% (1,355) (886) (332) (648)
Skipped 1.9% 1.9% 1.1% 1.2% (110) (121) (20) (46)
Total (n=11,900) 8,551 6,361 1,795 3,744 (100%) (100%) (100%) (100%)
‘School-Age’ Ages Ages (Ages 8-18) 8-12 13-18 Ages 19+
Underweight (< 5th percentile) 4.0% 4.4% 2.4% 1.5% (353) (307) (46) (56) Normal Weight 51.2% 50.8% 52.3% 28.4% (5th to < 85th percentile) (4,503) (3,514) (989) (1,075) Overweight 1,696 18.5% 22.2% 30.9% (85th to <95th percentile) (19.3%) (1,276) (420) (1,167) Obese 2,251 26.3% 23.1% 39.2% (85th to <95th percentile) (25.6%) (1,815) (436) (1,484) Total (100%) 8,803 6,912 1,891 3,782
How often do you drink SODA?
BMI Percentile Categories by Age Group: Years 1-4
Table: Soda Consumption among Bexar County ‘All About You’ Respondents by Age Group: Year 4
Year 1 Year 2 Year 3 Year 4 TOTAL Non-Obese 73.9% 73.7% 75.8% 75.4% 74.4% Obese 26.1% 26.3% 24.2% 24.6% 25.6% (95% CI) (24.7-27.5%) (24.4-28.2%) (22.1-26.3%) (22.3-27%) (24.7-26.5%)
TOTAL 3,768 2,105 1,615 1,315 8,803
Year 1 Year 2 Year 3 Year 4 TOTAL
Ages 8-12 26.2% 27.4% 24.8% 26.6% 6,912 (24.7-27.7%) (25.1-29.7%) (22.5-27.2%) (23.8-29.3%)
Ages 13-18 25.5% 23.6% 22% 18.5% 1,891 (22.1-29%) (20.2-26.9%) (17.6-26.3%) (14.2-22.8%)
TOTAL 3,768 2,105 1,615 1,315 8,803
Percent Obese
(95% CI)
Male Female Underweight 4.5% 3.7% (< 5th percentile) (160) (193)
Normal Weight 49.5% 52.3% (5th to < 85th percentile) (1,746) (2,757)
Overweight 17.4% 20.6% (85th to <95th percentile) (612) (1,084)
Obese 28.6% 23.5% (≥95thpercentile) (1,010) (1,241)
Total (100%) 3,528 5,275
Obesity Status among BX County School-Age Youth (8-18) by Year
Obesity Status among BX County School-Age Youth (8-18) by Age Group and Year
Gender Differences in Obesity among Bexar County School-Age Youth
Ages 8-18 (Years 1-4)
36

Year 1 Year 2 Year 3 Year 4 TOTAL Non-Obese 73.9% 73.7% 75.8% 75.4% 74.4% Obese 26.1% 26.3% 24.2% 24.6% 25.6% (95% CI) (24.7-27.5%) (24.4-28.2%) (22.1-26.3%) (22.3-27%) (24.7-26.5%)
TOTAL 3,768 2,105 1,615 1,315 8,803
Year 1 Year 2 Year 3 Year 4 TOTAL
Ages 8-12 26.2% 27.4% 24.8% 26.6% 6,912 (24.7-27.7%) (25.1-29.7%) (22.5-27.2%) (23.8-29.3%)
Ages 13-18 25.5% 23.6% 22% 18.5% 1,891 (22.1-29%) (20.2-26.9%) (17.6-26.3%) (14.2-22.8%)
TOTAL 3,768 2,105 1,615 1,315 8,803
Percent Obese
(95% CI)
Male Female Underweight 4.5% 3.7% (< 5th percentile) (160) (193)
Normal Weight 49.5% 52.3% (5th to < 85th percentile) (1,746) (2,757)
Overweight 17.4% 20.6% (85th to <95th percentile) (612) (1,084)
Obese 28.6% 23.5% (≥95thpercentile) (1,010) (1,241)
Total (100%) 3,528 5,275
Obesity Status among BX County School-Age Youth (8-18) by Year
Obesity Status among BX County School-Age Youth (8-18) by Age Group and Year
Gender Differences in Obesity among Bexar County School-Age Youth
Ages 8-18 (Years 1-4)
As with most variables, significant regional variation exists with respect to BMI and obesity status. The following map displays regional variation in obesity status within Bexar County youth ages 8-18 by specific zip codes and then by healthcare subsector aggregation.
As evidenced in the chart and graphs below, school-age youth in the Southwest, Near Eastside, Near Westside and Southeast share a statistically significant disproportionate burden of obesity compared with other, more northern sectors of the city. One can be 95% confident that the true percentage of obesity in our sample lies between the percentages represented at right.
Percent Obese Bexar Co. School-Age Youth (8-18) by Sector
Percent of School-Age Youth (Ages 8-18) Obese by Zip Code, Bexar County, Years 1-4
Top 20 Zip Codes with Percent of School-Age Youth (Ages 8-18) Obese, Years 1-4
37

Obesity was slightly higher among school-age boys than girls in the overall Witte sample. Males had an average obesity proportion of 28.6% (27.1-30.1%) while females had an average of 23.5% (22.4-24.7%). This difference was statistically significant due to non-overlapping 95% Confidence Intervals.
Lessons Learned and the FutureThe release of this Fourth Annual Report and the beginning of the fifth year of operations provides an ideal opportunity to reflect upon the lessons learned from the data, visitor and partner feedback. The next several years promise to be extraordinarily exciting as the Witte draws upon these lessons and bolsters its commitment to addressing them shoulder-to-shoulder with our dedicated partners.
The H-E-B Body Adventure Powered by University Health System has been a resounding success. There is room for improvement. While the numbers of survey responses are extremely impressive—in fact, entirely unprecedented in the nation—there is an opportunity to improve. The museum and its partners must find ways to increase the engagement/capture rates across multiple interactives for stronger cumulative data. To increase the numbers of successful BMIs collected, visitors must not only know their zip code at Sign-In, but must also complete both the Pick Up Your Pace height station (on the first floor) and the You Are What You Drink stair stepper located on the second floor. There is a tremendous number of youth who complete one or two, but not all of them. This is a lost opportunity. Similarly, only 25 to 28% of POWERpass users also fully complete one of the two All About You survey kiosks on the second floor. This too provides an opportunity for significant improvement in survey results. Simply put, not all visitors engage in all interactives which compromised some critical data sets (e.g. BMI).
The H-E-B Body Adventure is not a linear, sequential and single-floor experience, but rather an immersive series of experiences where visitors are free to sign-in and visit one or more stations as they please. There is a need, therefore to develop creative strategies to incentivize the completion of as many of the POWERpass components as possible. One strategy the Witte plans to implement is to develop additional graphic signage and wayfinding. The Witte also plans to develop fun ‘checklist’ cards that visitors will receive and complete each time they finish a POWERpass station. If they complete all stations, they may then add their contact information and place the card in an engaging exhibition quality “dropbox” to be entered for regularly occurring raffles. Awards may include experiences such as Curator-led family hiking adventures at the Witte’s Rock Art Foundation White Shaman Preserve in the Lower Pecos, or tours of the Government Canyon State Natural Area dinosaur track site (where Witte Curator of Paleontology and Geology Dr. Thomas Adams has mapped hundreds of footprints), discounts in the store and other partner-sponsored items. Not only could this dramatically increase engagement, survey numbers and BMI estimates, it offers additional opportunities to reinforce key Health IQ, Empowerment and Wellness messaging. Individual contact data cannot in any way be linked to actual POWERpass number codes. Therefore, the anonymity of POWERpass data is never compromised.
From a population and public health perspective, the data in this reports highlights a number of additional challenges. While Bexar County is doing quite well in its levels of physical activity, it is nonetheless concerning to see a gradual and significant increase in the proportion of school-age youth watching television or playing video games for four or more hours per day. The survey question does not specify whether this is a ‘fixed screen’ versus mobile device or phone, as these borders have become all-but erased in the past decades. Regardless, as San Antonians become more tech-savy, the high use of digital media highlights the urgency of the Witte Museum and its partners’ programs that bridge outdoor recreational activities and wellness. Time and a close connection with nature unequivocally nurtures physical and mental well-being, as evidenced by massive new international studies.7 Studies have shown that excessive media use can contribute to attention problems, school difficulties,
Year 1 Year 2 Year 3 Year 4 TOTAL Non-Obese 73.9% 73.7% 75.8% 75.4% 74.4% Obese 26.1% 26.3% 24.2% 24.6% 25.6% (95% CI) (24.7-27.5%) (24.4-28.2%) (22.1-26.3%) (22.3-27%) (24.7-26.5%)
TOTAL 3,768 2,105 1,615 1,315 8,803
Year 1 Year 2 Year 3 Year 4 TOTAL
Ages 8-12 26.2% 27.4% 24.8% 26.6% 6,912 (24.7-27.7%) (25.1-29.7%) (22.5-27.2%) (23.8-29.3%)
Ages 13-18 25.5% 23.6% 22% 18.5% 1,891 (22.1-29%) (20.2-26.9%) (17.6-26.3%) (14.2-22.8%)
TOTAL 3,768 2,105 1,615 1,315 8,803
Percent Obese
(95% CI)
Male Female Underweight 4.5% 3.7% (< 5th percentile) (160) (193)
Normal Weight 49.5% 52.3% (5th to < 85th percentile) (1,746) (2,757)
Overweight 17.4% 20.6% (85th to <95th percentile) (612) (1,084)
Obese 28.6% 23.5% (≥95thpercentile) (1,010) (1,241)
Total (100%) 3,528 5,275
Obesity Status among BX County School-Age Youth (8-18) by Year
Obesity Status among BX County School-Age Youth (8-18) by Age Group and Year
Gender Differences in Obesity among Bexar County School-Age Youth
Ages 8-18 (Years 1-4)
38

sleep and eating disorders, as well as contribute to childhood obesity. A significant and increasing proportion of youth in Bexar County are clearly exceeding recommended levels of screen time, and this remains an important issue for continued educational outreach and awareness campaigns. By limiting screen time and offering high quality educational media as well as non-electronic formats for physical education and activity such as outdoor programs, books, newspapers and board games, parents and community members can help guide youth towards healthier behaviors.
The Witte Museum is at the forefront of this initiative, and intends to intensify its focus to actively bridge its H-E-B Body Adventure Programs with its Nature and Science galleries and specifically its outdoor programs and activities. The Witte Museum’s educational programs already incorporate a diversity of educational media as well as indoor and outdoor physical activity, reading, writing and problem-solving skills fully aligned with the Texas Essential Knowledge and Skills (TEKS) standards. The Witte will work closely with its strong partners to lead by doing in order to encourage behavior change toward more movement and less sedentary lifestyles.
Bexar County and the City of San Antonio appear to be doing better in the areas of physical activity than healthy eating. This is a testament to the tremendous efforts and direct actions of so many in City and County leadership that have led to remarkable transformations, expansions and improvements along the San Antonio River, hiking and biking trails, Confluence Park, and more. It is a testament, for example, to the marvelous work of San Antonio Parks and Recreation and their free Fitness in the Parks program, the annual Siclovia events organized by the YMCA of Greater San Antonio.
Strong physical activity policies alone, however, will not dramatically move the needle on the epidemics of preventable chronic disease and childhood obesity. Calories in the food supply have consistently risen since the onset of the obesity epidemic in the 1980s (about 500 to 800 per person a day) and these foods are often ultra-processed and high in salt, sugar, fat and flavor additives that are engineered to trigger peoples’ appetites to eat more.33 As calories in the food supply increased, and physical activity decreased, the nation’s weight increased correspondingly. “Energy-in” education and policies, therefore, are an absolutely core component of impacting the overall wellness of the nation and our community. The weight of scientific opinion has long been that Americans need to eat far more fruits and vegetables. For perspective, a 110- to 165 calorie energy gap contributing to childhood
39

obesity could be eliminated by removing one can of soda (150 calories), energy drink, sweet tea or other sugar-sweetened beverage per day from a child’s diet. On the other hand, a child would need to spend almost two hours walking to school to burn off the equivalent number of calories.
Vegetables were chosen as a favorite healthy snack by only 10.2% of Bexar County respondents. There has also been a slight decrease from the first two years to the second two years in the popularity of vegetables as a healthy snack. Among the teenage group of 13 to 18 year olds in Bexar County, an alarming 38.9% reported eating ‘no vegetables’ the previous day. This was slightly higher than previous years (Year 1: 35.9%, Year 2: 36.2%, Year 3: 36.4%). A large-scale, targeted campaign to
increase the popularity and shift negative perceptions of vegetables as the “go-to” healthy snack may be needed. The Witte stands ready to work closely with its partners to amplify this messaging and align it across partners so families continue to receive consistent, empowering and actionable advice.
In direct response to the data showing slight decreases in fruit and vegetable consumption during the summer months, the Witte Museum has begun working closely with the San Antonio Food Bank to develop creative new programs and messaging to “bridge” the months when families are at home during the summer and holidays. Visitors can expect, for example, to see the Food Bank’s Mobile Mercado visible at the H-E-B Body Adventure. The Witte is excited to stand shoulder-to-shoulder with its partners to “close the loop” --from community to museum to community. The Witte is committed to nurture and grow the tremendous spark that exists presently around healthy eating and an appreciation of South Texas’ unique historical culinary heritage.
The Witte Museum has been an integral leader within the City of San Antonio’s major initiatives to improve the health of its citizens. In 2010, when former Mayor Julián Castro appointed the Mayor’s Fitness Council challenging San Antonio to be
one of the healthiest and most active communities in the nation, the Witte was already underway transforming its popular H-E-B Science Treehouse into the H-E-B Body Adventure to address these issues. Mayor Ron Nirenberg has recently sounded the call again, highlighting the key role that strength training and “eating clean” plays in keeping himself and his family fit physically and mentally.34
It is now widely accepted that the relative contribution of clinical medical care to health and well-being is small – an estimated 10% to 20%.35 As noted in the 2016 Bexar County Community Health Needs Assesment, the larger share of disparities in health and life expectancy, therefore, can be traced not so much to differences in access to or use of clinical medical care. Rather, these disparities are strongly influenced by dramatic differences in social, economic, and environmental conditions. The Witte Museum’s H-E-B Body Adventure Powered by University Health System provides the ideal place to ignite transformative health behavior change in physical activity and nutrition through engaging interactive and educational museum experiences.
40

1 Target heart rates, of course, vary by age and gender and were set in consultation with San Antonio Metropolitan Health and American Heart Association guidelines. Targets are set as 70% of a visitor’s estimated maximum heart rate (220 minus their age) with some adjustment for younger ages. 2 For more information, see http://www.klrn.org/healthy-kids/ 3 National Institutes of Health, National Heart, Lung and Blood Institute. Why is Sleep Important?. Available online at: http://www.nhlbi.nih.gov/health/health-topics/topics/sdd/why 4 U.S. Census Bureau; 2014 ACS 1-Year Estimates, Table S1601. See The Health Collaborative 2016 Community Health Needs Assessment page 32 for more details. 5 U.S. Department of Health and Human Services, Office of Disease Prevention and Health Promotion. (n.d.) America’s Health Literacy: Why we need accessible health information. http://health.gov/communication/literacy/issuebrief/ 6 World Health Organization. (2013). Health literacy: The solid facts. http://www.euro.who.int/__data/assets/pdf_ file/0008/190655/e96854.pdf 7 See for example: Rich Marini “Massive New Study Confirms Nature Nurtures Your Health. San Antonio Express News. July 12, 2018. ; Erin Nichols “1 in 7 kids in Bexar County believe there are no fun, safe places near home.” News Report. Fox News San Antonio; September 29th 2016. https://foxsanantonio.com/news/local/1-in-7-kids-in-bexar-county-believe-there-are-no-fun-safe-places-near-home
See also Videos on the following outlets: https://www.fitcitysa.com/witte-museum-h-e-b-body-adventure/
https://www.fitcitysa.com/witte-museum-anatomy-table/ 8 https://news.uthscsa.edu/ut-health-san-antonio-24-million-nih-research-boost/ 9 http://thehealthcell.org/ 10 While total numbers for previous years may vary slightly from prior reports, these variations do not substantially affect the interpretations of previous reports in any material way. They are largely the result of small exclusions of, for example, in mistyped zip codes, ages (for example an individual typing age 111, when they likely intended age 11, etc.) and minor changes in zip code boundaries over time. For instance, previous reports included certain zip codes as “Bexar County” that were not technically Bexar County. That is, these outlying zip codes had small proportions of their populations that overlapped into Bexar County, and were included. To more accurately reflect the county where the majority of residents from those zip codes reside, the proper County designation was used, per the advice of Texas State Demographer Dr. Lloyd Potter. 11 A word of caution regarding year-to-year comparisons: the samples are, of course, not the exact same populations each year. Therefore, they do not indicate behavior change at the individual level. This is, of course, the case in most longitudinal community or school-based health surveys.
12 Health Collaborative. 2014. Bexar County Community Health Improvement Plan. Available online http://iims.uthscsa.edu/sites/iims/files/Newsletters/Bexar%20County%20SA%20CHIP_Full%20copy.pdf
13 See Community Information Now’s excellent public data dashboard available online at http://cinow.info/
14 The World Health Organization. 2015. Social Determinants of Health. http://www.who.int/social_determinants/en/
15 Because of formatting differences, the zip codes do not include U.S. P.O. Box addresses and possible Mexican postal addresses of which we know there are a significant and possibly growing number, given the strong reach along the Texas-Mexico border counties. Examining these additional zip code captures, as well as international zip codes is the
41
Where and how we live, work, play and learn create an interconnected web, or social matrix, that profoundly influences our health. Improving health and well-being will mean both improving those conditions and explicitly addressing the effects those conditions have already had on so many members of our community. While equality means that everyone has the same resources, equity means everyone has the resources they need to thrive. Leveraging cross-sector community partnerships to offer new tools to advance public learning and well-being is at the very core of the Witte’s strategy. With the success of the past four years, the next several years will bring renewed focus to cementing, enhancing and extending these powerful partnerships.
It is true that Texas and the nation continue to face significant challenges with respect to preventable chronic diseases. Nonetheless, the Witte Museum’s H-E-B Body Adventure Powered by University Health System, together with the tremendous commitment of our partners, has unequivocally demonstrated that change is possible. Innovative solutions and approaches are both possible and attainable. The future of community health in Texas is indeed bright.

42
subject of current investigation, given the Witte Museum and San Antonio’s increasing draw as an international travel destination.
16 See page 13 of 3rd Annual Report. Available online: https://www.wittemuseum.org/wp-content/uploads/2015/04/hebbaReport_2017.pdf
17 The Health Collaborative. 2016 Community Health Needs Assessment. http://healthcollaborative.net/chna/the-2016-chna-report/
18 United States Census Bureau, Quick Facts. Accessed Aug 14, 2017. https://www.census.gov/quickfacts
19 Ages over 98 were removed as likely mistake; this accounts for the slightly lower total number of POWERpass users here compared to the actual total of 600,077.
20 The American Heart Association. Hands-Only CP FAQ. Available online: https://cpr.heart.org/idc/groups/ahaecc-public/@wcm/@ecc/documents/downloadable/ucm_494175.pdf See also: Fran Kritz If you thought CPR was too hard, start humming ‘Stayin’ Alive’ and read this. The Washington Post. April 13, 2015. Accessed online May 15, 2017.
21 Nancy Brown. Matt Learned CPR During a Layover. Two Days Later, He Saved Sean’s Life. Huffpost. 03/24/2016; Updated 12/06/2017. Available online: https://www.huffingtonpost.com/nancy-brown/matt-learned-cpr-during-a_b_9524904.html
22 Trust for America’s Health (2013) A Healthier America 2013: Strategies to Move from Sick Care to Health Care in the Next Four Years. Available at www.healthyamericans.org 23 SA2020. The Data Dashboard. Accessed July 8, 2015. Available online at http://www.sa2020.org/what-is-sa2020/
24 Health Collaborative. 2014. Bexar County Community Health Improvement Plan. Available online http://iims.uthscsa.edu/sites/iims/files/Newsletters/Bexar%20County%20SA%20CHIP_Full%20copy.pdf
25 Healthy People 2020 [Internet]. Washington, DC: U.S. Department of Health and Human Services, Office of Disease Prevention and Health Promotion [Accessed July 8, 2015] Available from: http://www.healthypeople.gov/
26 Black LI, Clarke TC, Barnes PM, Stussman BJ, Nahin RL. Use of complementary health approaches among children aged 4-17 years in the United States: National Health Interview Survey, 2007-2012. National health statistics reports; no 78. Hyattsville, MD: National Center for Health Statistics. 2015.
27 American Academy of Pediatrics. Media and Children. (2013) Available at https://www.aap.org/en-us/advocacy-and-policy/aap-health-initiatives/pages/media-and-children.aspx

28 Center for Disease Control and Prevention. Texas State Nutrition, Physical Activity, and Obesity Profile. Available online: https://www.cdc.gov/nccdphp/dnpao/state-local-programs/profiles/texas.html
29 The audio in this question adds the following clarification prompt: “Do not count fruit juice. Fruit may be fresh, canned, frozen or dried.”
30 The audio in this question adds the following clarification prompt: “Do not count French Fries or chips. Vegetables include carrots, broccoli, celery, and salads or baked potatoes. They can be raw or cooked, fresh or frozen, canned or even dried.” On a methodological aside, it is important to note that the high proportion of individuals reporting no vegetable consumption (together with other ‘undesirable’ behaviors elsewhere) appears to indicate that visitors are being quite honest in their responses to All About You. Indications suggest that there does not appear to be a ‘desirability’ bias whereby visitors are just telling us “what they think we want to hear”-- a frequent problem in survey research. 31 Sahini, Lakshmi & Bhakta, Nimisha. Prevalence of Obesity among Adults by Demographic Characteristics, Risk Factors, Other Conditions, and Place of Residence, Texas, 2016. Texas Health and Human Services; Texas Department of State Health Services. Available online: https://www.dshs.texas.gov/Obesity/Data/
32 San Antonio Metropolitan Health District, Bexar County Behavioral Risk Factor Surveillance System Data Report 2016. Available online: https://www.sanantonio.gov/Portals/0/Files/health/News/Reports/BRFSSReport2016_5-31-18. pdf?ver=2018-06-04-155732-877
33 Kevin Hall. How did we get here?: Explaining the obesity epidemic. Nutrition Action Healthletter, July/Aug 2018: 3-5. 34 Richard A. Marini ‘Mayor-elect is fit to lead. Like, really fit.’ San Antonio Express News. June 16, 2017.
35 See for example, McGovern, L., Miller, G., & Hughes Cromwick, P. (2014, August 21). Health Policy Brief: The Relative Contribution of Multiple Determinants to Health Outcomes. http://healthaffairs.org/healthpolicybriefs/brief_pdfs/healthpolicybrief_123.pdf
43
*Please note: Any public use or interpretation of data from the H-E-B Body Adventure Annual Reports must be accompanied by the following statement/disclaimer:This [explain activity] was prepared or accomplished by [insert author name(s)] in his/her personal capacity. The opinions expressed in this article (or presentation) do not reflect the view of either the San Antonio Metropolitan Health District or the Witte Museum.


The H-E-B Body Adventure Powered by University Health Systemis generously supported by
Susan NaylorIn honor of Charles Moulton
Children’s Hospital of San AntonioTM
San Antonio Metropolitan Health DistrictThe Aetna Foundation
Baptist Health Foundation of San AntonioDr. Dacia Napier in honor of her parents, Dr. John and Noreen Hammerick
Saint Susie Chariable FoundationMethodist Healthcare Ministries
Witte Museum membersThe development of educational programs for the The H-E-B Body Adventure was generously supported
by the Semp Russ Foundation of the San Antonio Area Foundationwith initial support from the Genevieve and Ward Orsinger Foundation
and a grant from the Beulah M. and Felix J. Katz Memorial TrustDan and Gloria Oppenheimer Fund, Valley View Trust of the San Antonio Area Foundation
and the Harvey E. Najim Family Foundation
The H-E-B Body Adventure is made possible through collaborative partnerships with H-E-BThe University of Texas Health Science Center at San Antonio
San Antonio Metropolitan Health DistrictYMCA of Greater San Antonio
the Culinary Institute of Americathe San Antonio Botanical Garden
BioMed SAThe Synergy Studio
and the Pearl Farmer’s MarketSan Antonio Food Bank
The American Heart AssociationThe American Diabetes Association
Urban Capital Partners
www.WitteMuseum.org3801 Broadway | San Antonio, Texas | 78209-6396