a data-driven optimization approach for mixed-case
TRANSCRIPT

A data-driven optimization approachfor mixed-case palletization andthree-dimensional bin packing
by
Paulo R. V. de Carvalho
A thesispresented to the University of Waterloo
in fulfillment of thethesis requirement for the degree of
Master of Applied Sciencein
Management Sciences
Waterloo, Ontario, Canada, 2018
c© Paulo R. V. de Carvalho 2018


I hereby declare that I am the sole author of this thesis. This is a true copy of the thesis,including any required final revisions, as accepted by my examiners.
I understand that my thesis may be made electronically available to the public.
iii


Abstract
Palletization is the most standard method of packaging and transportation in the retailindustry. Their building involves the solution of a three-dimensional packing problemwith side practical constraints such as item support and pallet stability, leading to whatis known as the mixed-case palletization problem. Motivated by the fact that solvingindustry-size instances is still very challenging for current methods, we propose a newsolution methodology that combines data analysis at the instance level and optimizationto build pallets. Item heights are first analyzed to identify possible layers and to deriverelationships between item positions. Items are stacked in pairs and trios to create superitems, which are then arranged to create layers of even height. The resulting layers arefinally stacked to create pallets. The layers are constructed using a reduced-size mixedinteger program as well as a two-dimension placement heuristic. Computational tests onindustry data show that the solution approach is extremely efficient in producing high-quality solutions in fast computational times.
v


Acknowledgements
First, I would like to thank my supervisor Prof. Samir Elhedhli to whom I am trulygrateful. He offered me the opportunity to transfer to the research-based Masters program,stimulating my scientific curiosity and passion towards Data Science and Operations Re-search. I appreciate his always inspiring speeches and extremely positive attitude, hisenormous patience and valuable guidance towards my development in scientific writing (ina foreign language), and for being supportive and always challenging me.
I would like to thank the readers of this thesis, Prof. Fatma Gzara and Prof. BissanGhaddar for their valuable comments and insights.
I appreciate my colleagues Cynthia Waltho, for being one of the people responsible forbringing me into the research life. Burak Yildiz for all the help and discussions about binpacking. Daniel Ulch for the hours and help on all other projects so I could focus on mythesis.
I am grateful to our industry partner for providing the challenges and resources thatmade this thesis possible.
My wife Julia is without any doubt a fundamental part of all this work. For all thetimes I could not go forward and she was there to give me strength, inspiration and love,and for being my partner in all, for inspiring me, pushing me to always leave my comfortzone, for leaving all behind in Brazil and come to this new life with me.
My father, mother, sisters for being the cornerstone of my life and giving me everythingso I could be here today.
Borges, my friend and boss, to whom I am grateful for the encouragement and support.My Professors Catai and Chiquito for the inspiration and help.
Thanks to my friend Rodolfo for somehow letting me know that I got into universitythat day, and the support during my Masters admission process and move to Canada.
vii


Dedication
I dedicate this to my love Julia, my family and friends, and all the ones like me thathave always been curious and asked so many questions.
ix


Table of Contents
List of Tables xiii
List of Figures xv
1 Introduction 1
2 Literature review 5
3 Problem Definition and Solution Methodology 9
3.1 Mathematical Formulation . . . . . . . . . . . . . . . . . . . . . . . . . . . 9
3.2 Solution Methodology . . . . . . . . . . . . . . . . . . . . . . . . . . . . . 11
3.2.1 Phase 1 - Item Grouping . . . . . . . . . . . . . . . . . . . . . . . . 11
3.2.2 Phase 2 - Item Placement . . . . . . . . . . . . . . . . . . . . . . . 16
3.2.3 Support Evaluation . . . . . . . . . . . . . . . . . . . . . . . . . . . 21
3.3 An Illustrative Example . . . . . . . . . . . . . . . . . . . . . . . . . . . . 21
4 Numerical Testing 25
4.1 Tests on the 750-item instance . . . . . . . . . . . . . . . . . . . . . . . . . 25
4.1.1 Phase 1 - Item grouping . . . . . . . . . . . . . . . . . . . . . . . . 26
4.1.2 Phase 2 - Item placement . . . . . . . . . . . . . . . . . . . . . . . 27
5 Conclusion 41
References 43
xi


List of Tables
4.1 Characteristics of the 750-item instance . . . . . . . . . . . . . . . . . . . . 25
4.2 Initial results based on [LL3] . . . . . . . . . . . . . . . . . . . . . . . . . . 28
4.3 Final results based on [LL3] . . . . . . . . . . . . . . . . . . . . . . . . . . 30
4.4 3-corner item support per bin - [LL3] . . . . . . . . . . . . . . . . . . . . . 32
4.5 Full support evaluation - [LL3] . . . . . . . . . . . . . . . . . . . . . . . . . 33
4.6 Final results iterative method per group - MaxRects . . . . . . . . . . . . . 33
4.7 3-corner item support per bin - MaxRects . . . . . . . . . . . . . . . . . . 38
4.8 Full support evaluation - MaxRects . . . . . . . . . . . . . . . . . . . . . . 39
xiii


List of Figures
3.1 Representation of an Item and a Pallet . . . . . . . . . . . . . . . . . . . . 9
3.2 Representation of a Pair and a Trio . . . . . . . . . . . . . . . . . . . . . . 11
3.3 Flowchart for phase 1 . . . . . . . . . . . . . . . . . . . . . . . . . . . . . . 15
3.4 Flowchart for the MIP phase . . . . . . . . . . . . . . . . . . . . . . . . . . 19
3.5 Flowchart for the MaxRects phase . . . . . . . . . . . . . . . . . . . . . . . 20
3.6 Sample height profile . . . . . . . . . . . . . . . . . . . . . . . . . . . . . . 21
3.7 Height profile after the first grouping step . . . . . . . . . . . . . . . . . . 22
3.8 Height profile after the second grouping step . . . . . . . . . . . . . . . . . 22
3.9 Optimization results for the three groups . . . . . . . . . . . . . . . . . . . 23
3.10 Optimization result as a long layer . . . . . . . . . . . . . . . . . . . . . . 24
3.11 Final Pallet arrangement . . . . . . . . . . . . . . . . . . . . . . . . . . . . 24
4.1 750-item instance height profile . . . . . . . . . . . . . . . . . . . . . . . . 26
4.2 750-item instance height profile after phase 1 . . . . . . . . . . . . . . . . . 27
4.3 Height distribution of the remaining items . . . . . . . . . . . . . . . . . . 29
4.4 Height distribution of the remaining items after grouping . . . . . . . . . . 29
4.5 The final pallets using [LL3] - 1 to 4 . . . . . . . . . . . . . . . . . . . . . 31
4.6 The final pallets using [LL3] - 5 to 8 . . . . . . . . . . . . . . . . . . . . . 32
4.7 The 3 best and worst layers in terms of area coverage using MaxRects . . . 34
4.8 Layer coverage for group 2 . . . . . . . . . . . . . . . . . . . . . . . . . . . 35
4.9 Layer coverage for group 3 . . . . . . . . . . . . . . . . . . . . . . . . . . . 35
xv

4.10 Layer coverage for group 4 . . . . . . . . . . . . . . . . . . . . . . . . . . . 36
4.11 The final pallets using MaxRects - 1 to 4 . . . . . . . . . . . . . . . . . . . 37
4.12 The final pallets using MaxRects - 5 to 8 . . . . . . . . . . . . . . . . . . . 38
xvi

Chapter 1
Introduction
Transportation and warehousing play a fundamental role in every country’s economy. Forexample, they represented 4.3% of Canada’s Global Domestic Product (GDP) in 2015. Inaddition, world freight volume is expected to increase by a factor of 4.3 by 2050 (TransportCanada, 2016). Considering this growth, improving efficiency and providing cost effective-ness are essential to ensure financial sustainability and competitiveness in this industrialsegment.
In in a survey of logistics service providers and companies, 98% of logistics suppli-ers stated that data-driven decision making is essential to the success of supply chains.Moreover, 85% of them believe that effective manipulation of big data will become a corecompetency in this sector (Capgemini and Langley, 2017). Furthermore, data analytics isthe featured topic of the 2017 edition of the survey. When asked about the most importantinitiatives regarding data analytics in logistics and supply chain management, 71% of par-ticipants identified “Improving process quality and performance”, followed by “Improvinglogistics optimization” with 70%.
In this work, we focus on one of the basic and most common forms of goods trans-portation, which is pallet transportation. The efficiency of pallet transportation dependson the palletization process, which is the process by which an order, typically very large, ispacked in different pallets. This problem, known as the mixed-case palletization problem,is a generalization of the three-dimensional bin packing problem (3DBPP).
One and two-dimensional versions of bin packing problems have been extensively stud-ied as opposed to the more challenging three-dimensional version (Zhao et al., 2016). Three-dimensional bin packing problems consist of packing items inside a container (bin) whereitems are placed side-by-side, parallel to the edges of the container. The problems are often
1

categorized by the heterogeneity of items, the characteristics of the bin, and the objectiveof the packing (Bortfeldt and Wascher, 2013).
Aside from basic geometric constraints, Bortfeldt and Wascher (2013) define five addi-tional categories. Container-related constraints include weight limit and distribution, whileloading priority, orientation, and stacking are within the item-related category. Cargo-related constraints include shipment integrity and item-specific allocation. Positioningconstraints impose separation of items, for example, food from cleaning products. Load-related constraints involve cargo stability. Most of the current work on 3DBPP does notconsider these practical constraints as indicated by Bortfeldt and Wascher (2013) and Zhaoet al. (2016).
The traditional 3DBPP is already difficult to solve, and the inclusion of practical con-straints makes the task even more challenging. As exact methods face limitations whendealing with large instances, approximation methods and heuristics are more suitable totackle practical problems. Zhao et al. (2016), while comparing different solution methods,separate heuristics into placement and improvement. Arranging items in modular blockssuch as walls or layers is the basis of most placement and construction heuristics.
Motivated by the need for more efficient solution methodologies, we propose a data-driven optimization approach for the mixed-case palletization and three-dimensional binpacking problems. We combine data analysis and optimization in an efficient solutionmethodology where analysis of the item dimensions at the instance level is used to enhancethe optimization by fixing variable and reducing problem size, while also accounting forpractical constraints such as support and stability.
The solution methodology is composed of two phases. The first phase is devoted to,analyzing the instance under study, identify groups of items that when stacked achieve acertain target height. A common height can include single as well as special two and three-item arrangements. The second phase is item placement, and for each common heighta layer is constructed where only pallet depth is enforced. This long layer will later bedivided into multiple layers. By construction, the layers are dense to maximize volumeutilization and provide adequate support. The formation of layers is done using a reduced-size three-dimensional bin packing mixed-integer program (MIP) formulation as well as atwo-dimensional placement heuristic proposed by Jylanki (2010).
The main contribution of this work is a data-driven solution methodology based oninstance analysis and optimization. The data analysis at the instance level defines themain blocks of the optimization model and drives the heuristic methodology. It leads tosolutions of large problems that are otherwise out of reach of exact methods and are verychallenging for current heuristics.
2

The remainder of this thesis is organized as follows. In Chapter 2, a literature reviewis performed. Chapter 3 defines the problem and the solution methodology. Chapter 4presents the numerical tests and results. Conclusions and future research are given inChapter 5.
3


Chapter 2
Literature review
Being the core problem in mixed-case palletization, we start by reviewing the literatureon 3DBPP. The review paper by Bortfeldt and Wascher (2013) provides a definition anda classification scheme depending on problem characteristics.
Wascher et al. (2007) classify container loading problem into seven types: Single Stock-Size Cutting Stock, Multiple Stock-Size Cutting Stock, Residual Cutting Stock, SingleBin-Size Bin Packing, Multiple Bin-Size Bin Packing, Residual Bin Packing, and OpenDimension Problems. More details on the specific definition of each category are given byWascher et al. (2007).
Bortfeldt and Wascher (2013) extend Wascher et al. (2007) by analyzing 163 papers,published between 1980 and 2011, focusing on the types of constraints considered. Weightlimits are accounted for in 23 papers, while weight distributions are in 19. Meanwhile,loading priorities are only in 3 papers, orientation in 15, and stacking in 25 out of the163 papers reviewed. In addition, 19 papers consider complete-shipment, 13 allocation,and 28 account for positioning constraints. Finally, load-related stability and complexityconstraints are considered in 61 and 15 papers respectively. Although some constraint typesare widely adopted, the authors observe that practicality (by addressing several constraintssimultaneously) is still scarce. As more than 75% of the papers consider at most 2 typesof constraints. This is most likely due to the solution methodologies not being ready toaccommodate such complexity. The current work is a step in this direction.
The recent survey by Zhao et al. (2016) analyzes 113 papers, focusing mainly on solu-tion approaches: heuristics (placement or improvement) or exact methods. Improvementheuristics create rules and mechanisms to place items inside the container in order togenerate an initial solution and/or iterate between different solutions. by exploring the
5
neighbourhood of the solution. Placement heuristics tackle the problem by building walls,layers, or blocks of items, and by creating a sequence for the placement. This search canbe associated with a placement heuristic, to construct an initial solution. The authorsnote that the number of exact methods is relatively small compared to heuristics, and con-clude that only a small portion of the papers addresses real-world constraints. They alsoemphasize that more challenging and realistic benchmark data-sets need to be proposed.
George and Robinson (1980) present a two-phase construction heuristic based on wallbuilding. The first phase identifies an empty space to be filled and the second fill it. Thewalls are based on the dimensions of the first box placed, which is selected according toa ranking criteria. Bischoff and Marriott (1990) propose a compound technique basedon two-dimensional packing. They propose a hybrid approach that considers 14 differentheuristics, to select the best solution. The 14 different heuristic base methods come fromcombinations of 3 methods and 6 ranking rules, applied to instances ranging from 1 typeof boxes to 20 different types. Based on the results for all methods, the authors propose acompound heuristic, that apply different methods in a sequence.
To maximize the number of items in a single bin, Mohanty et al. (1994) propose aheuristic based on the multi-dimensional knapsack problem. Bischoff and Ratcliff (1995)address the multi-drop container loading problem and present a heuristic that combinespacking and a sequence based on destination. They are able to solve larger problemsthan Bischoff and Marriott (1990). Ratcliff and Bischoff (1998) incorporate load bearingconstraints.
Faina (2000) proposes a geometric model to reduce the problem to a finite enumeration,presenting good results for problems with less than 128 items. Pimpawat and Chaiyaratana(2001) utilize a co-operative co-evolutionary genetic algorithm. Their results indicate bet-ter performance in terms of containers required, compared to standard genetic algorithm.Pisinger (2002) aggregates tree search algorithm to ranking criteria, achieving considerableimprovements in the space filling.
Lodi et al. (2002) introduce a two-phase Tabu search heuristic. In the first phaseitems are grouped by height, and then sorted by area. The heuristic is then used asa base to generate solutions for the Tabu search. Farøe et al. (2003) propose a guidedlocal search. It initiates with an upper bound generated by a greedy heuristic, then thealgorithm iteratively reduces the number of bins searching for a feasible solution. Mouraand Oliveira (2005) include modifications based on GRASP (greedy randomized adaptivesearch procedure) to the framework of George and Robinson (1980), increasing volume useand cargo stability.
Bischoff (2006) proposes a random search method that accounts for load bearing. It
6

creates a scoring framework, accounting for suitability of items and impact on future place-ments. Crainic et al. (2008) present an extreme point placement heuristic. Extreme pointsare identified and items are placed based on a best-fit decreasing heuristic. This workis developed further in Crainic et al. (2009) where a two-level Tabu search (TS2pack) isintroduced. The first level reduces the number of bins and the second level optimizes thepacking.
Zhu et al. (2012) propose a set covering formulation with a prototype-based columngeneration approach. The goal is to minimize the cost of containers used while consideringsupport constraints. The efficiency is improved by the generation of prototypes, which aregood approximation of columns.
Goncalves and Resende (2013) combine a biased random-key genetic algorithm toset the order in which the items are packed and a constructive heuristic combined withmaximal-space representation to determine where each box is placed.
Hifi et al. (2014) use an integer linear programming heuristic that breaks the probleminto a series of single knapsack problems. It is composed of two phases, selection andpositioning. The first phase defines a subset of items susceptible to an active container,and the second packs the already selected items. A greedy heuristic is added to deal withlarger instances. Elhedhli et al. (2017) propose a slicing heuristic based on the relativepositioning mixed integer formulation that forces dense layers at the bottom of the bins.The results show good performance on item support.
Toffolo et al. (2017) propose a decomposition method with multi-phase heuristics. Theproblem is decomposed into two types of subproblems, stacks and bins. The method, basedon a MIP model, dynamically build layers and pack them into containers. Local searchis also applied to enhance solution performance. Mahvash et al. (2017) study a combined3DBPP and vehicle routing problem. They decompose the problem and solve it with acolumn generation based technique. Wu et al. (2017) propose a three-stage heuristic withphases defined as: fastener packing, carton packing, and crate packing. The first is usedto determine a packing strategy depending on the item shape, selecting predeterminedpacking patterns to maximize the filling rate. The second aims to increase utilization ofthe crates while considering sequence and allocation constraints, and the third is a heuristicbased on multi-layer search used to load the blocks created in the previous stages into thecontainers.
Formulations based on MIP form an important part of the 3DBPP literature. Chenet al. (1995) developed a mixed integer formulation based on relative positioning thatconsiders non-uniform sized items and containers.
7

Martello et al. (2000) propose a branch-and-bound method to the 3DBPP with or-thogonal packing. This work proposes lower bounds on the number of bins. The work isextended in Martello et al. (2007), where algorithm 864 and a benchmark instance wereproposed.
Fasano (2004) considers orthogonal placement with balancing conditions and proposesa MIP formulation heuristic. At each iteration the method increases the number of itemspicked, maintaining the relative position of the previous solutions. This work is extendedin Fasano (2008) with a recursive procedure based on non-blind local search. Wu et al.(2010) extend Chen et al. (1995) to take box orientation into account.
Allen et al. (2012) introduce a space indexed formulation to overcome limitation of therelative positioning model. The method is claimed to be strong but faces limitations dueto the number of variables generated. Paquay et al. (2016) use MIP to minimize unusedspace and incorporate some real-world constraints as weight distribution and stability.Paquay et al. (2017) introduce a heuristic to generate a good initial solution, based ondecomposition and relax-and-fix, insert-and-fix and fractional relax-and-fix methods.
Junqueira et al. (2012b) incorporate vehicle routing into the 3DBPP also accountingfor vertical stability, as an extension of Junqueira et al. (2012a).
Yildiz et al. (submitted in 2017) use a column generation approach where the pricingis a two-dimensional layer generation problem. They are able to solve large problems infast computational time.
8

Chapter 3
Problem Definition and SolutionMethodology
In this chapter, we first formulate the 3DBPP as a mixed integer program and then givethe details of the two-phase solution methodology we propose.
3.1 Mathematical Formulation
Consider a set of items i ∈ {1, 2, ..., n} of rectangular shape, with width (wi), depth (di)and height (hi) that have to be packed in a pallet of width (W ), depth (D), and height (H ).The items have to be placed parallel to the edges of the pallet with no physical overlap.An illustration is given in figure 3.1.
Figure 3.1: Representation of an Item and a Pallet
9

Given a Cartesian co-ordinate system with origin at the lower left corner of the bin,the 3DBPP can be modeled as a MIP with decision variables:
csi : the front, lower, left coordinate of item i = 1, 2, ..., n along direction s = x, y, z
psij =
{1 if item i = 1, 2, ..., n precedes item j = i + 1, 2, ..., n along direction s = x, y, z,
0 otherwise
h : the maximum height of all packed items.
For now, let us assume that the height of the bin, H, is large enough to accommodateall items, and formulate what is known as the Open Bin Packing problem:
[BPP]: min h
s.t.∑
s=x,y,z
(psij + psji) ≥ 1 i = 1, ..., n; j = i + 1, ..., n (3.1)
psij + psji ≤ 1 i = 1, ..., n; j = i + 1, ..., n; s = x, y, z (3.2)
csi + lsi ≤ csj + Ls(1− psij) i = 1, ..., n; j = i + 1, ..., n; s = x, y, z (3.3)
0 ≤ csi ≤ Ls − lsi i = 1, ..., n; s = x, y, z (3.4)
czi + lzi ≤ h i = 1, ..., n (3.5)
psij ∈ {0, 1} i = 1, ..., n; j = i + 1, ..., n; s = x, y, z (3.6)
h, csi ≥ 0 i = 1, ..., n; s = x, y, z (3.7)
where, Lx = W, Ly = D, Lz = H, lxi = wi, lyi = di, and lzi = hi; i = 1, ..., n.
The first constraints (3.1) make sure that any two items differ in at least one direction,which means having at least one relative positioning variable greater than zero. Constraints(3.2) ensure that an item can not both proceed and precede an other. Constraints (3.3)prohibit overlap by setting the minimum distance between items along the direction ofnon-overlap. Constraints (3.4) place items inside the pallet limits, and constraints (3.5)define the bin height as the maximum of all item heights. The objective function minimizesthe height of the pallet.
10
3.2 Solution Methodology
Due to the complexity of solving mixed-case palletization problems, especially when prac-tical constraints such as support and stability are incorporated, we propose a two-phasesolution approach that combines data analysis and optimization in an attempt to use infor-mation about item placement to reduce the complexity of the optimization. The approachhas two main phases.
3.2.1 Phase 1 - Item Grouping
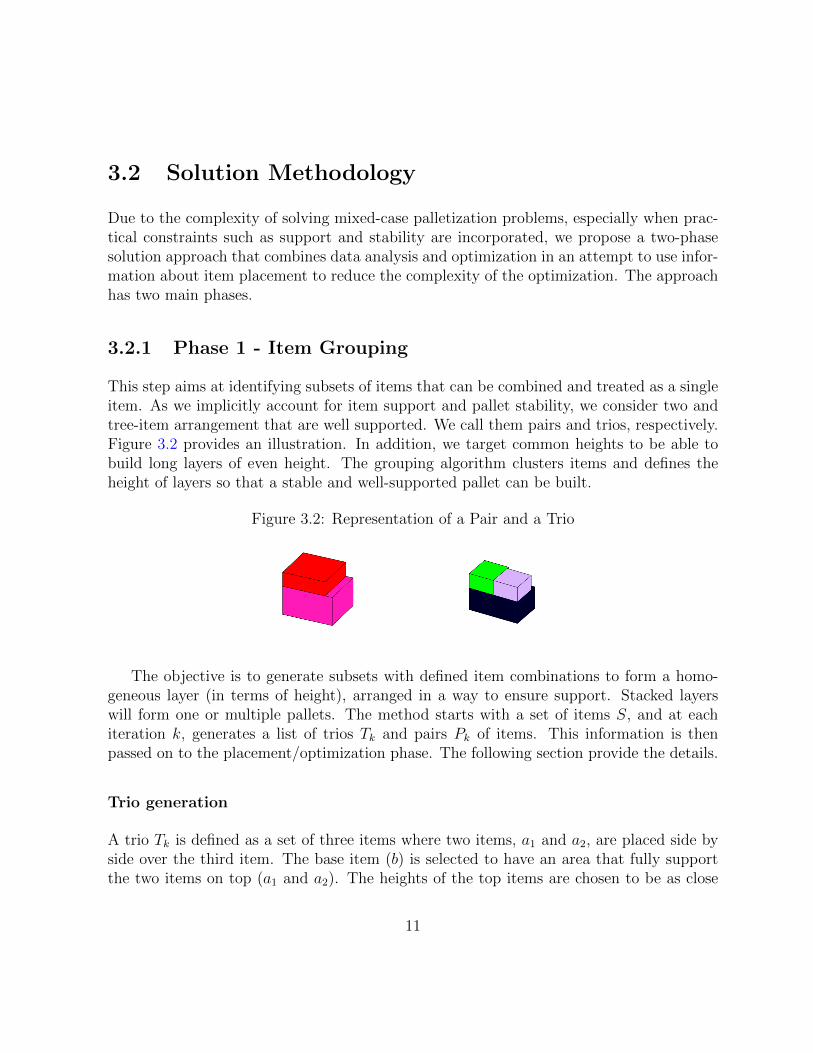
This step aims at identifying subsets of items that can be combined and treated as a singleitem. As we implicitly account for item support and pallet stability, we consider two andtree-item arrangement that are well supported. We call them pairs and trios, respectively.Figure 3.2 provides an illustration. In addition, we target common heights to be able tobuild long layers of even height. The grouping algorithm clusters items and defines theheight of layers so that a stable and well-supported pallet can be built.
Figure 3.2: Representation of a Pair and a Trio
The objective is to generate subsets with defined item combinations to form a homo-geneous layer (in terms of height), arranged in a way to ensure support. Stacked layerswill form one or multiple pallets. The method starts with a set of items S, and at eachiteration k, generates a list of trios Tk and pairs Pk of items. This information is thenpassed on to the placement/optimization phase. The following section provide the details.
Trio generation
A trio Tk is defined as a set of three items where two items, a1 and a2, are placed side byside over the third item. The base item (b) is selected to have an area that fully supportthe two items on top (a1 and a2). The heights of the top items are chosen to be as close
11

as possible to each other and total height b + a1 (or b + a2) being within the target heightinterval.
The first target height is the tallest item’s height. This is because it is a layer settingitem, i.e., a layer should be at least as tall as this tallest item. For subsequent iterations,the function combination from library itertools in python is used. This function generatesall combination of a predetermined number of elements (2 items - 1 base and 1 top). Then,the heights are summed for every combination and the value with the highest occurrenceis taken.
After setting the target height r, two additional parameters are defined: height toleranceth and trio tolerance tw. The height tolerance th is the maximum deviation allowed on anaccepted height combination. It defines the allowable range as r± th. The trio tolerance twis analogous to th, but for the width dimension. The trio generation algorithm is presentednext:
12
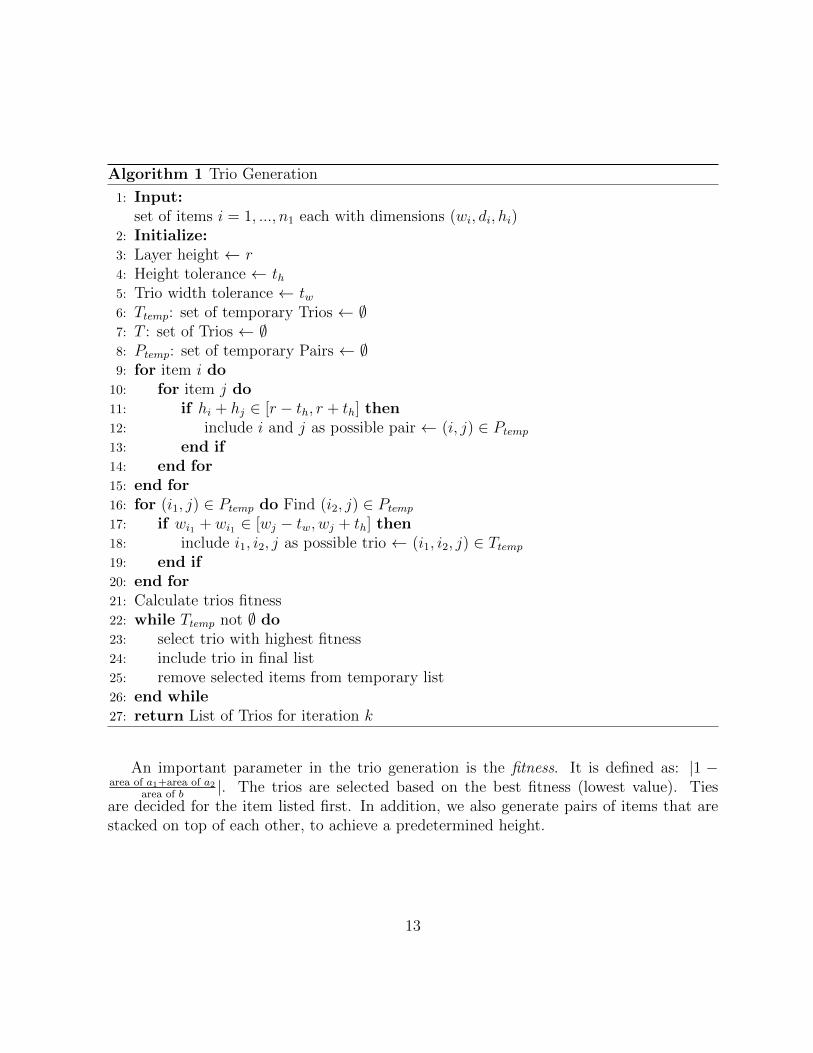
Algorithm 1 Trio Generation
1: Input:set of items i = 1, ..., n1 each with dimensions (wi, di, hi)
2: Initialize:3: Layer height ← r4: Height tolerance ← th5: Trio width tolerance ← tw6: Ttemp: set of temporary Trios ← ∅7: T : set of Trios ← ∅8: Ptemp: set of temporary Pairs ← ∅9: for item i do
10: for item j do11: if hi + hj ∈ [r − th, r + th] then12: include i and j as possible pair ← (i, j) ∈ Ptemp
13: end if14: end for15: end for16: for (i1, j) ∈ Ptemp do Find (i2, j) ∈ Ptemp
17: if wi1 + wi1 ∈ [wj − tw, wj + th] then18: include i1, i2, j as possible trio ← (i1, i2, j) ∈ Ttemp
19: end if20: end for21: Calculate trios fitness22: while Ttemp not ∅ do23: select trio with highest fitness24: include trio in final list25: remove selected items from temporary list26: end while27: return List of Trios for iteration k
An important parameter in the trio generation is the fitness. It is defined as: |1 −area of a1+area of a2
area of b|. The trios are selected based on the best fitness (lowest value). Ties
are decided for the item listed first. In addition, we also generate pairs of items that arestacked on top of each other, to achieve a predetermined height.
13
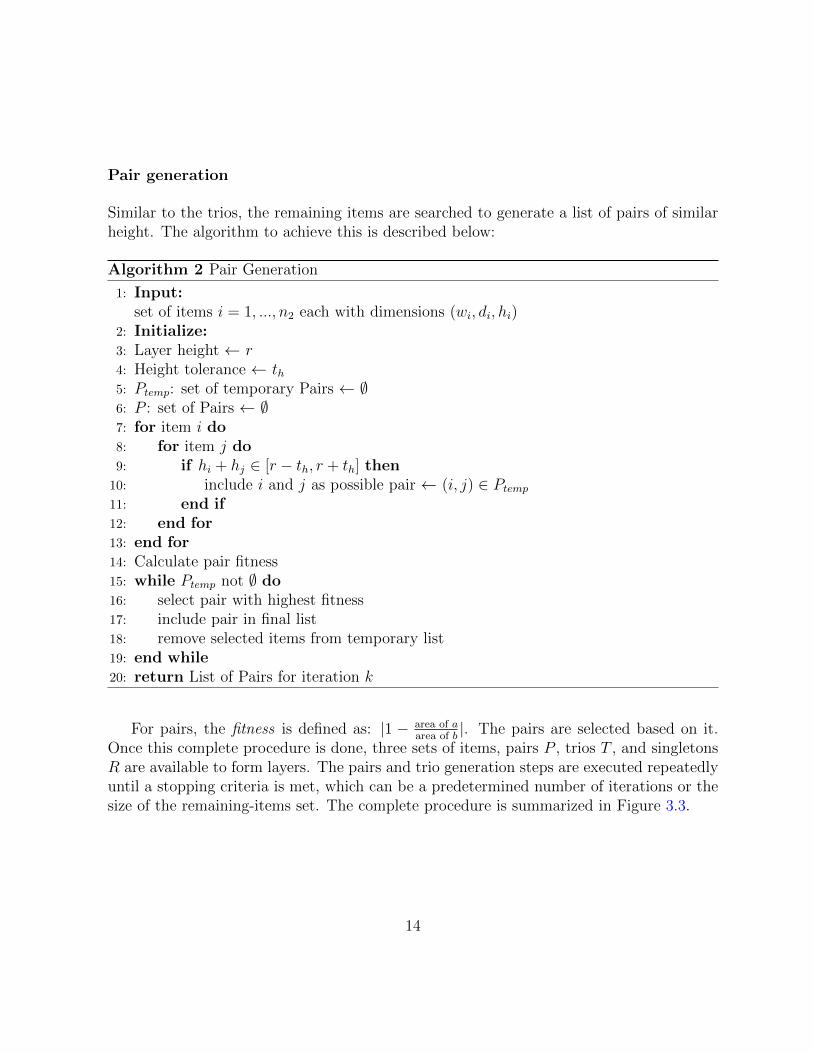
Pair generation
Similar to the trios, the remaining items are searched to generate a list of pairs of similarheight. The algorithm to achieve this is described below:
Algorithm 2 Pair Generation
1: Input:set of items i = 1, ..., n2 each with dimensions (wi, di, hi)
2: Initialize:3: Layer height ← r4: Height tolerance ← th5: Ptemp: set of temporary Pairs ← ∅6: P : set of Pairs ← ∅7: for item i do8: for item j do9: if hi + hj ∈ [r − th, r + th] then
10: include i and j as possible pair ← (i, j) ∈ Ptemp
11: end if12: end for13: end for14: Calculate pair fitness15: while Ptemp not ∅ do16: select pair with highest fitness17: include pair in final list18: remove selected items from temporary list19: end while20: return List of Pairs for iteration k
For pairs, the fitness is defined as: |1 − area of aarea of b
|. The pairs are selected based on it.Once this complete procedure is done, three sets of items, pairs P , trios T , and singletonsR are available to form layers. The pairs and trio generation steps are executed repeatedlyuntil a stopping criteria is met, which can be a predetermined number of iterations or thesize of the remaining-items set. The complete procedure is summarized in Figure 3.3.
14

Figure 3.3: Flowchart for phase 1
Define Layer Height
Start,Complete Data
Set
Trio within
tolerance?
Generate all possible trios
Discard, try next
Append to list,
try next
yes
noTrios left?
yes
no
Remove used items from original set
Generate all possible pairs
Pair within
tolerance?
Discard, try next
Append to list,
try next
yes
noPairsleft?
yes
no
Remove used items from original set
New round
possible?
yes
no
Generate input for item
placement
End Data Analysis phase
The procedure starts with the complete set of items. A target layer height is defined,and all possible trios are found. The items used for the trios are removed from the set.With the remaining items, pairs are generated. Again, the covered items are removedfrom the set. A check is performed to evaluate if another round is necessary, based on aminimum size of the remaining group or a predetermined number of rounds to be executed.If another round is necessary, the procedure is re-started, if not, it is terminated.
15

In the following section, we will detail how the output of phase 1 is incorporated intothe placement methods - the mathematical model and the two-dimensional heuristic.
3.2.2 Phase 2 - Item Placement
3.2.2.1 Modified mathematical model
After the item grouping phase, the mathematical formulation [BPP] is modified to incor-porate the information generated in phase 1. This will reduce the problem complexity.
Problem Decomposition
The first impact from the data analysis is that the placement will be executed on reducedand selected groups. Within each group, a reduced-size problem is solved using a modifiedversion of [BPP] where H is fixed to the desired height and W is set to be sufficiently largeto accommodate all items in a long strip. Complete layers will be generated within thesegroups. This model is solved repeatedly for different groups, generating multiple layers.
Relative Positioning
The grouping algorithm defines which items are stacked on top of each other given thepredetermined layer height. This enforces pzab = 1 where a is the bottom item and b thetop item in pair (a, b). The same is applied to the trios (a1, a2, b), accounting for therelations between top items a1 and a2, and the base item b. The corresponding constraintsare pza1b = 1 and pza2b = 1
The paired items should also be aligned, to make sure they sit on top of each otherand not in different places in the x, y plane. This is achieved by the following constraints:cxa− cxb = 0 and cya− cyb = 0. For the trios the constraints are: cxa1 − cxb = 0 and cya1 − cyb = 0for top item a1, and cxa2 − cxa1 = lxa1 and cya2 − cyb = 0 for item a2.
Long layer approach
The resulting layer for each group has a homogeneous height, a fixed depth, and a longwidth (‘long layer’). To be able to cut it into multiple layers having the depth and widthof the pallet, we introduce artificial items, called separators. These items, have very small
16

width, depth D and can be thought of as being sheets of cardboard. Their positioning isdefined by: cxseparatork = k ×W, k = {1, 2, ..., K}, cyseparatork = czseparatork = 0.
Objective function
With the long layer approach, the objective function has to be adapted to minimize thetotal length and create dense layers. To achieve that, we maximize the area of items insidethe pallet. In other words, we maximize the area of all items placed in the first section ofthe layer, which coincide with the pallet. We define a new binary variable xi for i = 1, ..., n,which takes a value of 1 if the item i is in the first section of the layer.
Modified model
Given trios T , pairs P , and separators n, the new mathematical model is:
17

[LL3]: max∑i
(lxi lyi )xi
s.t. (3.1)− (3.6)
csi + lsi ≤ r i = 1, ..., n (3.7)
pzab = 1 (a, b) ∈ P (3.8)
pza1b = 1, pza2b = 1 (a1, a2, b) ∈ T (3.9)
cxa − cxb = 0
cya − cyb = 0
cxa1 − cxb = 0
cya1 − cyb = 0
cya2 − cyb = 0
cxa2 − cxa1 = lxa1 (a1, a2, b) ∈ T (3.10)
cxseparatork = k ×W k = {1, ..., K} (3.11)
cyseparatork = czseparatork = 0 k = {1, ..., K} (3.12)
cxi + Mxi ≤ W + M i = 1, ..., n (3.13)
cxi + Wxi ≥ W i = 1, ..., n (3.14)
xi ∈ {0, 1} i = 1, ..., n (3.15)
csi ≥ 0 i = 1, ..., n; s = x, y, z (3.16)
The model is used iteratively for a subset of items until the complete group is covered.The goal is to form 1 or 2 acceptable layers in each iteration. Constraints (3.7) definethe maximum height as the target height r set in phase 1. Constraints (3.8) define therelative positioning (on the z coordinate) of items paired in the grouping phase. Constraints(3.9) do it for the items in a trio. Constraint (3.10) separates the top items in a trio by itswidth. Constraints (3.11) and (3.12) set the position of the artificial items (the separators).Constraints (3.13) and (3.14) ensure that the variable xi has a value of 1 for the items inthe first part of the layer, where we want to maximize the area coverage. The completeprocedure is summarized in Figure 3.4.
18
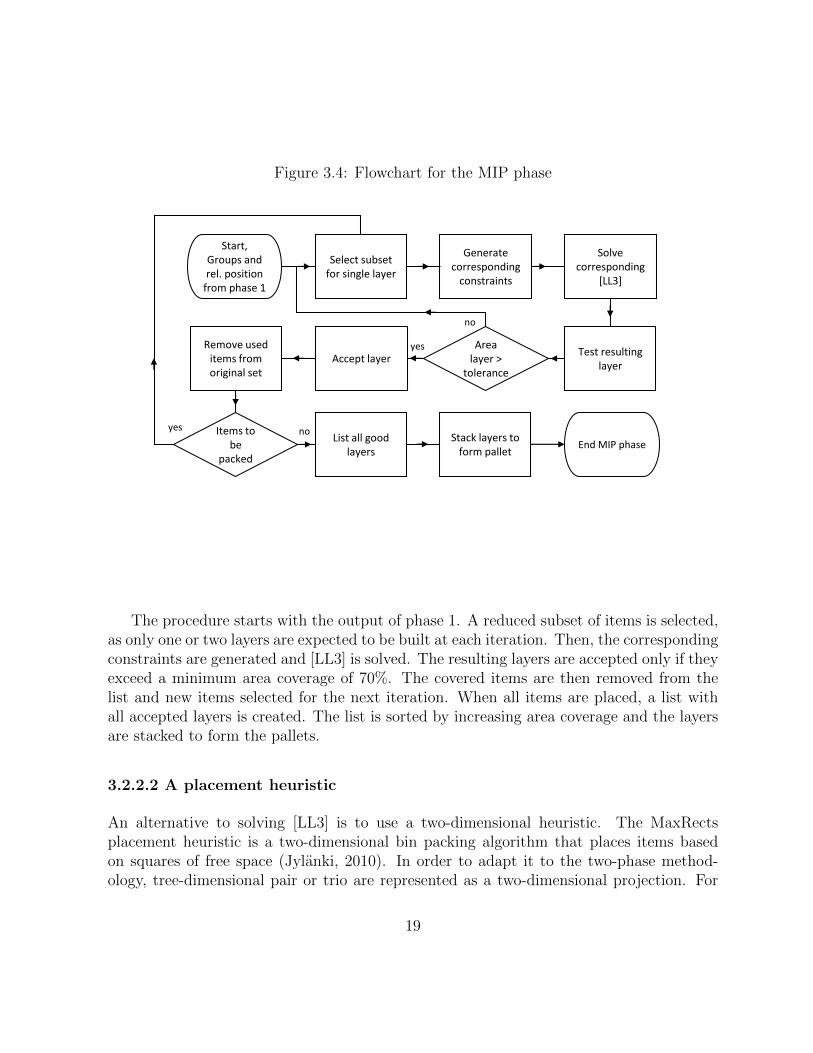
Figure 3.4: Flowchart for the MIP phase
Test resulting layer
Select subset for single layer
Start,Groups and rel. position
from phase 1
Generatecorresponding
constraints
no
Accept layer
Items to be
packed
noyes
Remove used items from original set
yes
List all good layers
Solve corresponding
[LL3]
Area layer >
tolerance
End MIP phaseStack layers to
form pallet
The procedure starts with the output of phase 1. A reduced subset of items is selected,as only one or two layers are expected to be built at each iteration. Then, the correspondingconstraints are generated and [LL3] is solved. The resulting layers are accepted only if theyexceed a minimum area coverage of 70%. The covered items are then removed from thelist and new items selected for the next iteration. When all items are placed, a list withall accepted layers is created. The list is sorted by increasing area coverage and the layersare stacked to form the pallets.
3.2.2.2 A placement heuristic
An alternative to solving [LL3] is to use a two-dimensional heuristic. The MaxRectsplacement heuristic is a two-dimensional bin packing algorithm that places items basedon squares of free space (Jylanki, 2010). In order to adapt it to the two-phase method-ology, tree-dimensional pair or trio are represented as a two-dimensional projection. For
19

a pair, composed items a and b, the projection vi is defined by the expression: vi =(max{wa, wb},max{da, db}); for a trio composed by items a1, a2, and b the expression isthen vi = (max{(wa1 + wa2), wb},max{da1 , da2 , db}). For each group, a list of rectangles(projections) is the input for MaxRects. The algorithm returns the layers with the coor-dinates of each element. The top items are then added based on the information from theitem-grouping phase. Several layers are created covering all items in that group.
The procedure is performed for each group, discarding the layers that do not satisfy theminimum coverage criteria (70%). These rejected pairs and trios are put together with theoriginal remaining items and MaxRects is executed to create uneven layers (to be used asthe pallet’s top layer). After all items are covered, the three-dimensional layer are recreatedfrom the MaxRects results, which are then stacked and the final pallet generated.
The flowchart for the two-phase method, using the MaxRects heuristic, is presented inFigure 3.5.
Figure 3.5: Flowchart for the MaxRects phase
Create projection list for MaxRects
Start,Groups and rel. position
from phase 1
Generate 2D layers
End
Space items
Generate final solution
Yes
No
Generate layers with remaining
items
Accept layerAll groups processed
?
Recreate 3D layer
Area layer >
tolerance
Discard layer, list items as remaining
Stack layers to create pallets
Yes
No
20

3.2.3 Support Evaluation
Support is an important requirement in mixed-case palletization. An item is said to havepartial support if 3 out of 4 corners are supported by an item below it. An item has fullsupport if all its bottom corners are in contact with items below it, or 70% of its area restson items below it.
3.3 An Illustrative Example
We illustrate the proposed methodology on a practical 50-item instance from an industrialpartner. The heights, graphed in Figure 3.6, range from 86 to 302 mm.
Figure 3.6: Sample height profile
We start with a target height of 302 ± 3 mm, forming 12 pairs (no trios). With thesepairings, the height distribution is as depicted in Figure 3.7.
21

Figure 3.7: Height profile after the first grouping step
Performing a second pairing, 9 new pairs are formed within the height of 455 mm. Thenew height distribution is depicted in Figure 3.8.
Figure 3.8: Height profile after the second grouping step
22

After two rounds, the original set of 50 items is reduced to three groups, of 24, 18, anda remaining subset of 8 items.
As seen, the data analysis phase successfully modifies the height distribution fromalmost a straight line in Figure 3.6 to a step function with well-defined target heights. Thefirst group has a target height of 302 mm and the second 455 mm. With this information,the optimization step focuses on the three groups of items defined. Model [LL3] is solvedwith a running time of 15 seconds for each group. The solutions are given in Figures 3.9a,3.9b and 3.9c, respectively.
(a) Solution of the first group (b) Solution of the secondgroup
(c) Solution of the remainingitems
Figure 3.9: Optimization results for the three groups
Figures 3.10 and 3.11 display the solution as a single layer and as a pallet, respectively.It is clear that the pallet has a good volume usage, is composed by layers with good itemssupport, and does not have towers. Note that from an industry perspective, layers arepreferred to towers as they increase volume usage and lead to stable pallets.
23

Figure 3.10: Optimization result as a long layer
Figure 3.11: Final Pallet arrangement
24

Chapter 4
Numerical Testing
The proposed solution methodology is tested on industrial instances supplied by a globallogistics company. All tests were performed using an Intel(R) Core(TM) i7-3517U CPU @1.90GHz 2.40GHz computer with 6.00 GB of Installed memory (RAM). Python 3.6 wasused for data analysis and placement heuristics and MATLAB R2015b with CPLEX 12.6.2to solve the mixed-integer program.
We start by testing on an industrial instance composed of 750 items. We use a NorthAmerican standard pallet of size W = 1219, D = 1016, and H = 2200mm.
4.1 Tests on the 750-item instance
The 750-item instance is based on real orders. The width, height and depth distributionis summarized in table 4.1 and the height distribution is graphed in Figure 4.1
Table 4.1: Characteristics of the 750-item instance
Width Depth Heightmean 358.1 246.9 209.2st. dev. 76.2 53.1 75.8min 182 164 81max 602 403 435
25

Figure 4.1: 750-item instance height profile
4.1.1 Phase 1 - Item grouping
Applying the grouping method leads to 4 groups of items and a remaining set. The firsthas a height around 435 mm, the height of the tallest item. It is composed of 53 triosand 187 pairs, covering 533 items. The second group has a height around 315 mm, with 3trios and 45 pairs covering an additional 99 items. The third, contains 14 pairs and 2 triosamong 34 items grouped around a height of 446 mm. The fourth and last has 19 itemspaired over 292 mm, with 1 trio and 9 pairs. By that, 685 items out of 750 are grouped,allowing multiple layers to be built within these subsets. The remaining 65 items are notgrouped further, as the new groups would not constitute a layer. The corresponding heightprofile is graphed in Figure 4.2.
26
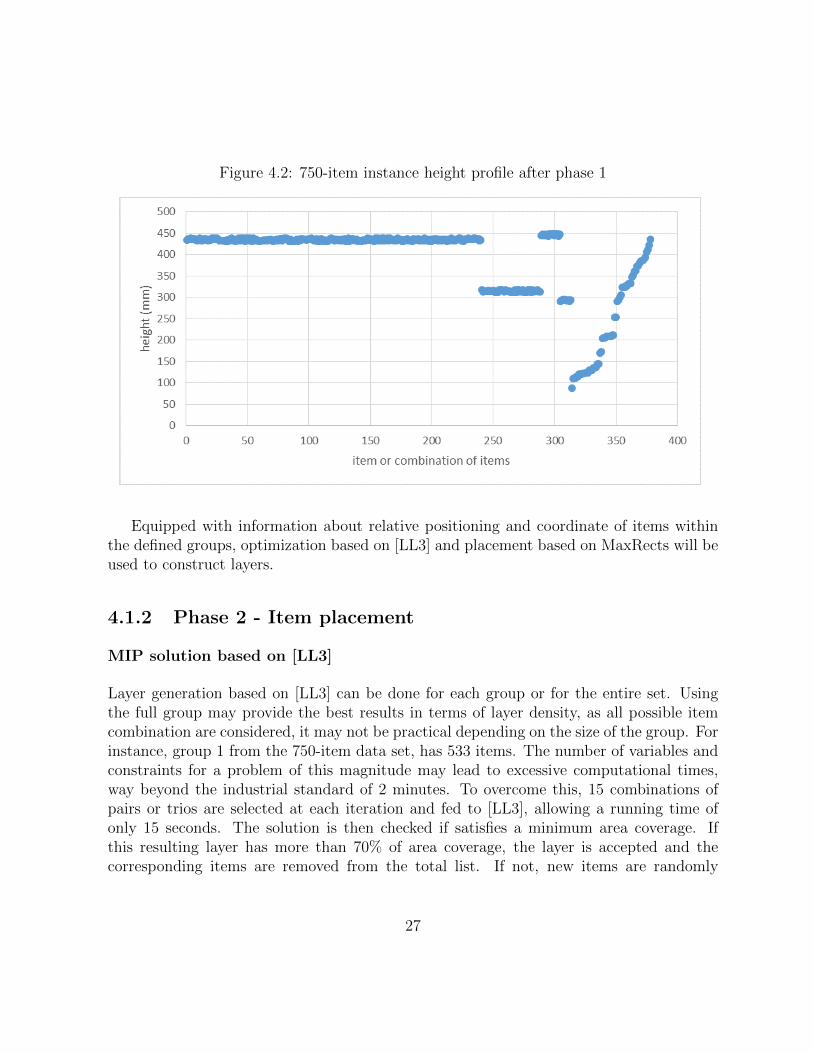
Figure 4.2: 750-item instance height profile after phase 1
Equipped with information about relative positioning and coordinate of items withinthe defined groups, optimization based on [LL3] and placement based on MaxRects will beused to construct layers.
4.1.2 Phase 2 - Item placement
MIP solution based on [LL3]
Layer generation based on [LL3] can be done for each group or for the entire set. Usingthe full group may provide the best results in terms of layer density, as all possible itemcombination are considered, it may not be practical depending on the size of the group. Forinstance, group 1 from the 750-item data set, has 533 items. The number of variables andconstraints for a problem of this magnitude may lead to excessive computational times,way beyond the industrial standard of 2 minutes. To overcome this, 15 combinations ofpairs or trios are selected at each iteration and fed to [LL3], allowing a running time ofonly 15 seconds. The solution is then checked if satisfies a minimum area coverage. Ifthis resulting layer has more than 70% of area coverage, the layer is accepted and thecorresponding items are removed from the total list. If not, new items are randomly
27

selected and the optimization executed. This procedure is repeated until no more itemsare left in that group.
Processing of Groups 1- 4
For item Group 1, it took 25 iterations to process the 533 items, leading to 25 acceptedlayers and one rejected (with 9 items). Group 2 had 5 iterations with 5 accepted layerscovering 97 out of 99 items. For group 3, one layer with 21 items was selected and 13 itemsremained. Group 4 had all its 19 items placed in one accepted layer. The final result afterprocessing these four groups is presented in table 4.2.
Table 4.2: Initial results based on [LL3]
Group Accepted Covered Items Avg layer min layer max layerlayers items remaining area % area % area %
Group 1 25 524 9 80% 76% 86%Group 2 5 97 2 82% 79% 84%Group 3 1 21 13 77% 77% 77%Group 4 1 19 0 68% 68% 68%
After processing all the groups, it was possible to generate 31 layers covering 661 items.The 24 uncovered items and the original 65 remaining set were reprocessed in phase 1 inan attempt to generate more layers. Figure 4.3 shows the distribution of the remainingitems.
28
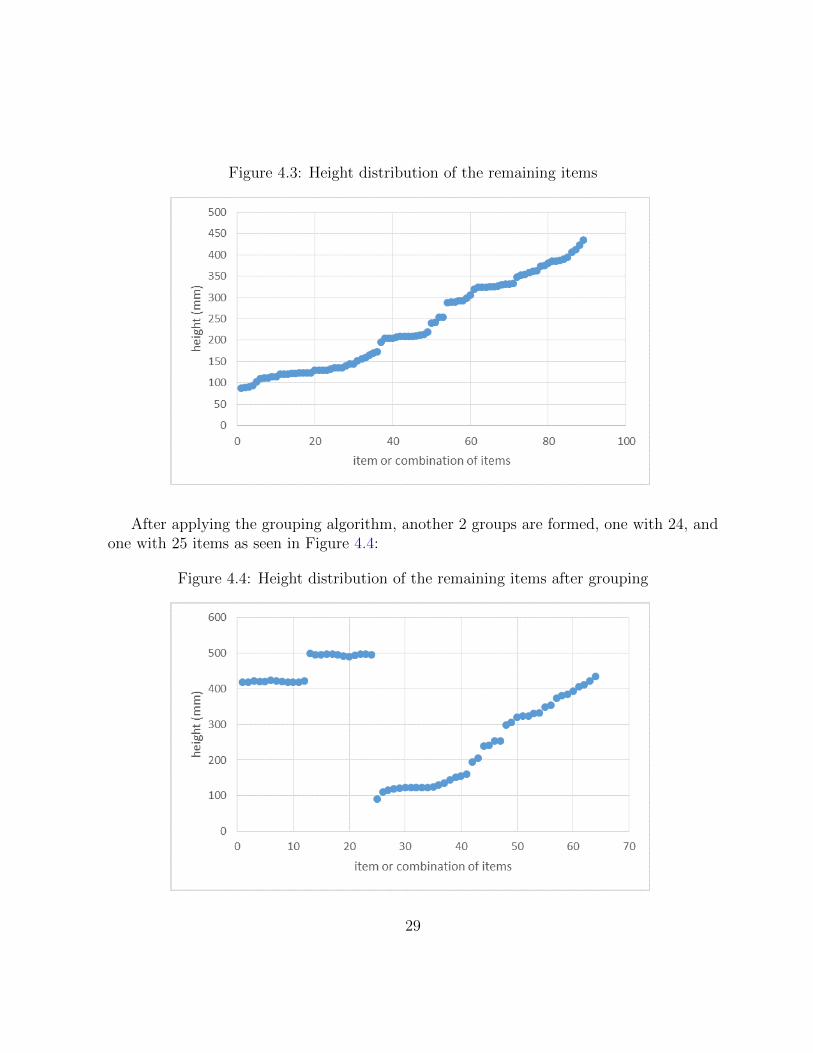
Figure 4.3: Height distribution of the remaining items
After applying the grouping algorithm, another 2 groups are formed, one with 24, andone with 25 items as seen in Figure 4.4:
Figure 4.4: Height distribution of the remaining items after grouping
29
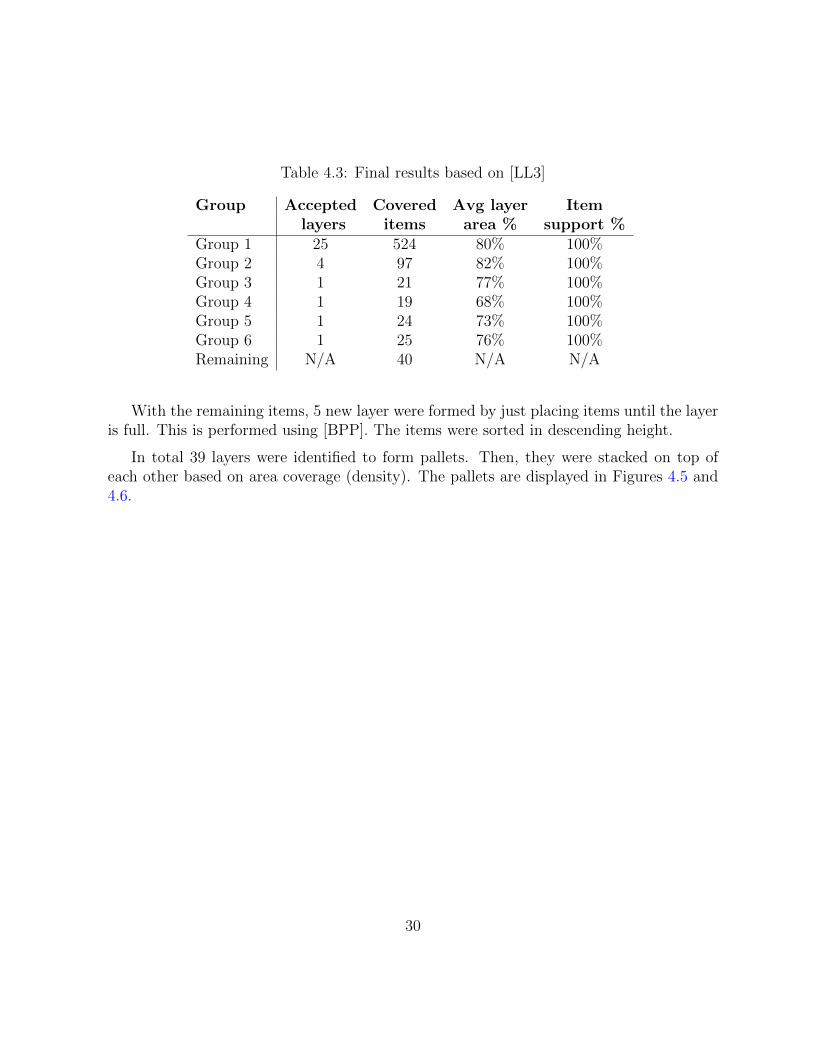
Table 4.3: Final results based on [LL3]
Group Accepted Covered Avg layer Itemlayers items area % support %
Group 1 25 524 80% 100%Group 2 4 97 82% 100%Group 3 1 21 77% 100%Group 4 1 19 68% 100%Group 5 1 24 73% 100%Group 6 1 25 76% 100%Remaining N/A 40 N/A N/A
With the remaining items, 5 new layer were formed by just placing items until the layeris full. This is performed using [BPP]. The items were sorted in descending height.
In total 39 layers were identified to form pallets. Then, they were stacked on top ofeach other based on area coverage (density). The pallets are displayed in Figures 4.5 and4.6.
30
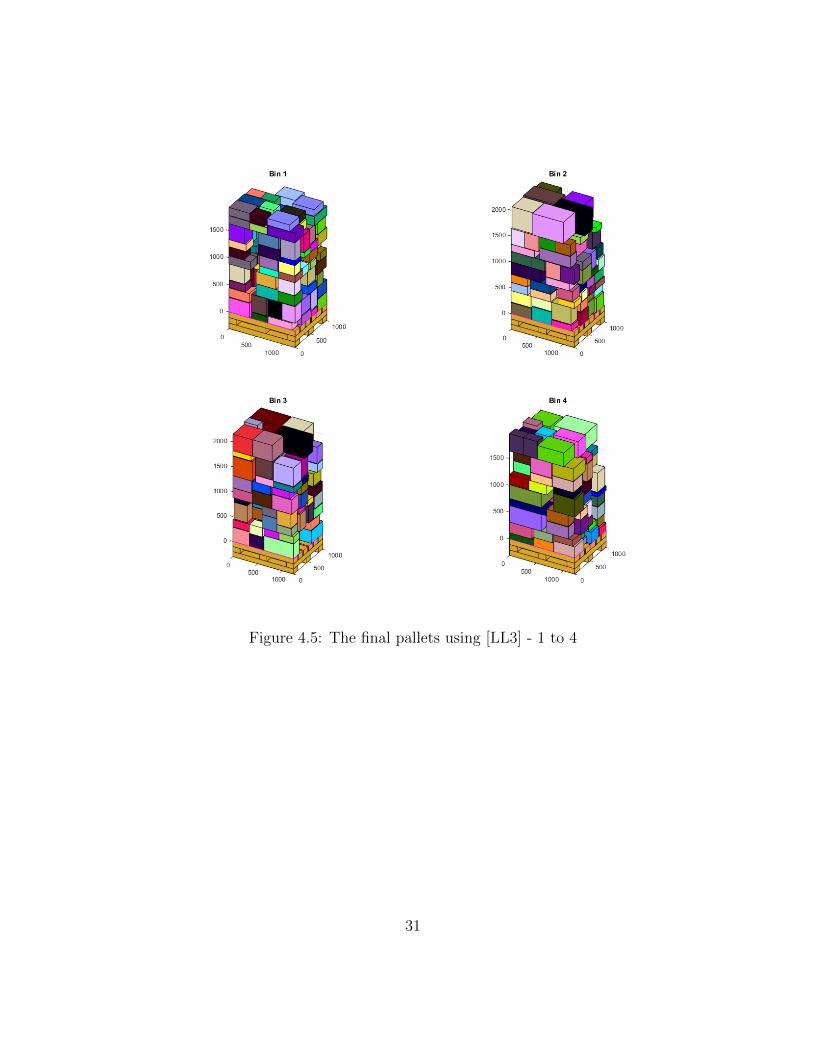
Figure 4.5: The final pallets using [LL3] - 1 to 4
31

Figure 4.6: The final pallets using [LL3] - 5 to 8
We mentioned earlier that one of the benefits of using layer is item support, which isone of the features that distinguishes mixed-case palletization from 3DBPP. To assess towhat extent item support is achieved, we evaluate the support of each item based on thecondition that 3 out of 4 corners are supported by an item underneath (partial support).The results are displayed in table 4.4.
Table 4.4: 3-corner item support per bin - [LL3]
Bin 1 Bin 2 Bin 3 Bin 4 Bin 5 Bin 6 Bin 7 Bin 8Nb of items 111 94 99 90 101 97 80 78Item Support (%) 86.5 83.0 80.8 80.0 80.2 81.4 82.5 87.2
32

The results for a more strict support criteria (where an item is fully supported if it hasat least 70% of its area over other items beneath) are presented in table 4.5.
Table 4.5: Full support evaluation - [LL3]
Average % area Min % area Nb of items withsupport support support > 70%
MIP 76.3 13.51 471 (62.8%)
With more than 62.8% of items fully supported, it is clear that the methodology doesenforce support implicitly. The performance could be increased by modifying the palletformation step.
Placement heuristic based on MaxRects
The same instance with the 750 items is processed now using the 2D heuristic MaxRectsfrom rectpack1 library. As MaxRects only determines the position of the base, post pro-cessing is necessary to place the top items and recreate the tree-dimensional layer.
Table 4.6 presents the groups and number of layers generated.
Table 4.6: Final results iterative method per group - MaxRects
Group Generated Covered Avg layer Itemlayers items area % support %
Group 1 26 533 86.5% 100%Group 2 5 99 71.7% 100%Group 3 3 52 61.3% 100%Group 4 2 20 41.5% 100%Remaining N/A 46 N/A N/A
The generation of layers using MaxRects is much faster that MIP, giving the flexibilityto change the groups and test different arrangements to improve support. From first group,26 layers were generated covering 533 of the 750 items. The layer with highest area coveragehas 93.4% and the lowest 69.7%. Figure 4.7 displays the three most and least dense layers.
1https://github.com/secnot/rectpack
33

Figure 4.7: The 3 best and worst layers in terms of area coverage using MaxRects
From group 2, 5 layers were generated covering all 99 items with an average areacoverage of 71.7%, a maximum of 91.7%, and a minimum of 31.8%. The layer projectionsare displayed in Figure 4.8.
34

Figure 4.8: Layer coverage for group 2
Based on the 52 items in group 3, three layers were created. They have area coverageof 92.2%, 80.4%, and 16.8%.
Figure 4.9: Layer coverage for group 3
Group 4 produces only two layers with its 20 items. One layer has 77.3% of areacoverage and the other, with just two items, has 5.8%. Figure 4.10 presents the layers.
35
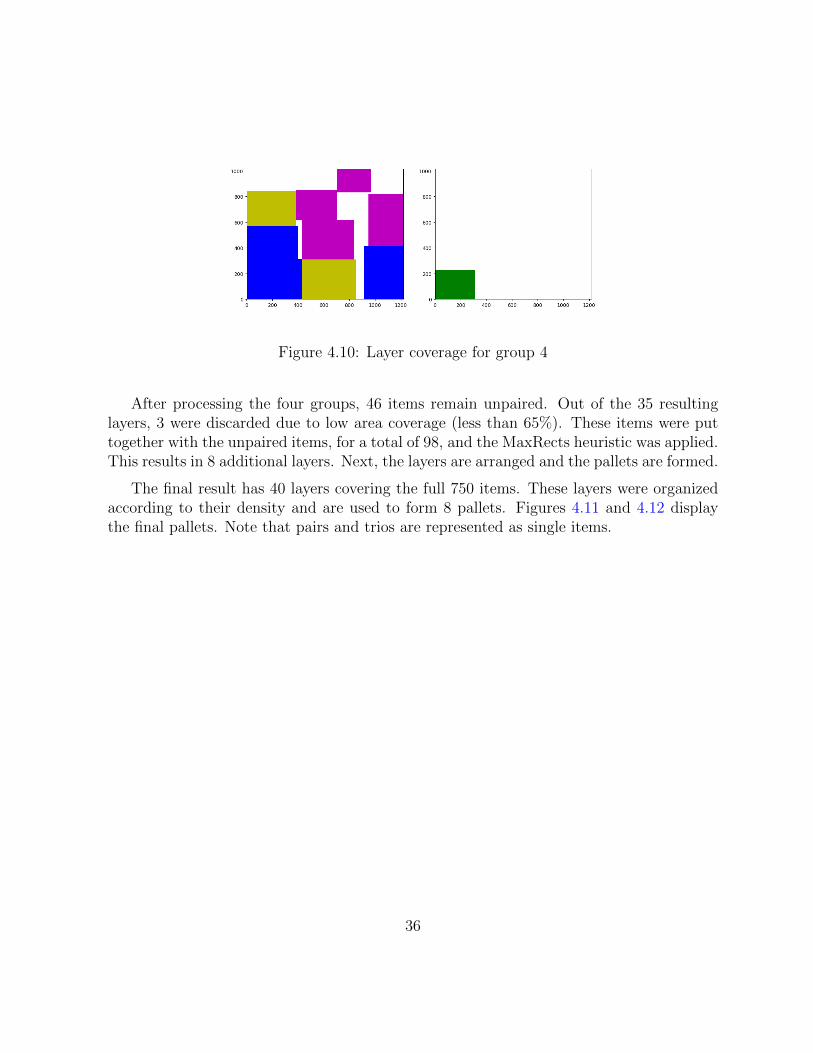
Figure 4.10: Layer coverage for group 4
After processing the four groups, 46 items remain unpaired. Out of the 35 resultinglayers, 3 were discarded due to low area coverage (less than 65%). These items were puttogether with the unpaired items, for a total of 98, and the MaxRects heuristic was applied.This results in 8 additional layers. Next, the layers are arranged and the pallets are formed.
The final result has 40 layers covering the full 750 items. These layers were organizedaccording to their density and are used to form 8 pallets. Figures 4.11 and 4.12 displaythe final pallets. Note that pairs and trios are represented as single items.
36

Figure 4.11: The final pallets using MaxRects - 1 to 4
37
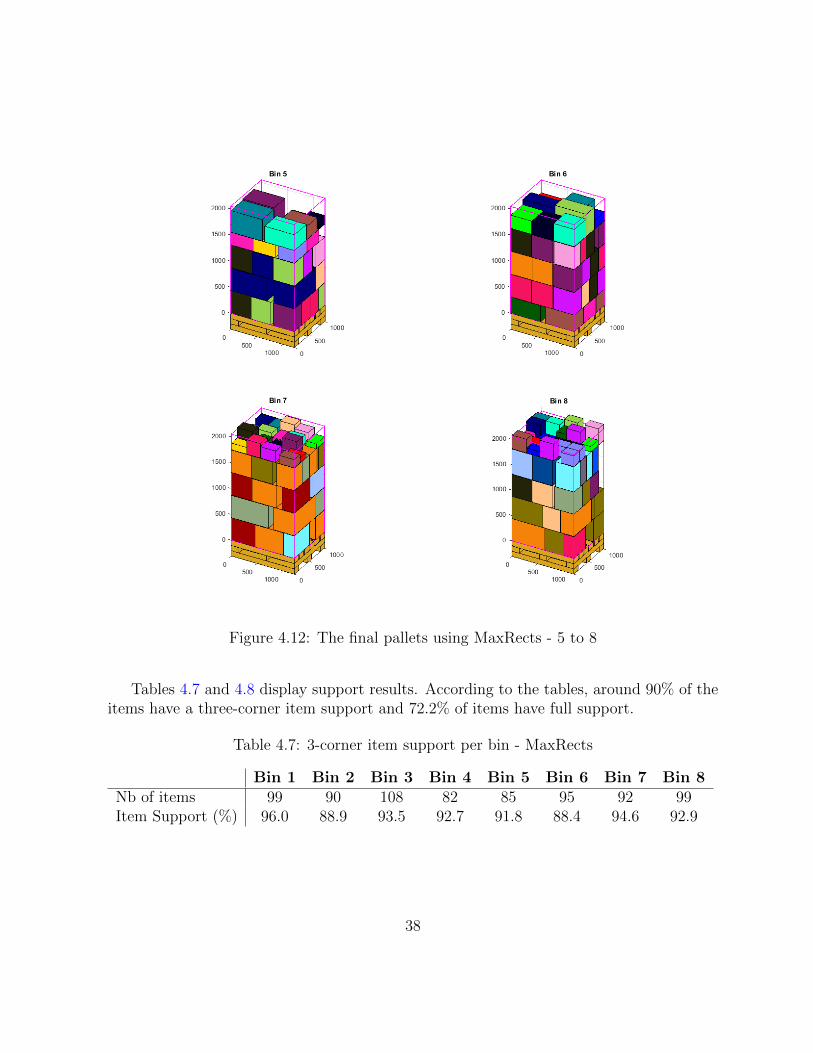
Figure 4.12: The final pallets using MaxRects - 5 to 8
Tables 4.7 and 4.8 display support results. According to the tables, around 90% of theitems have a three-corner item support and 72.2% of items have full support.
Table 4.7: 3-corner item support per bin - MaxRects
Bin 1 Bin 2 Bin 3 Bin 4 Bin 5 Bin 6 Bin 7 Bin 8Nb of items 99 90 108 82 85 95 92 99Item Support (%) 96.0 88.9 93.5 92.7 91.8 88.4 94.6 92.9
38

Table 4.8: Full support evaluation - MaxRects
Average % area Min % area Nb of items withsupport support support > 70%
MaxRects 85.15 0.84 542 (72.2%)
The MaxRects solution has a higher average support than that based on [LL3]. 542items are fully supported compared to 471; and the average area supported is 85% comparedto 76%.
39


Chapter 5
Conclusion
In this thesis, we proposed a new data-driven solution approach for the mixed-case palleti-zation problem that combines data analysis and optimization. Depending on the instance,we analyze the height distribution of items, combine them into pairs an trios to createdistinct sets with uniform height. Items of the same height are then used to form layers,which are in turn stacked to form a three-dimensional packing. The layer formation areoptimized using a mixed-integer programming model as well as fast placement heuristic.
Layers are a highly desired feature in palletization for several reasons. They tend tomaximize volume usage, provide adequate support for items, lead to stable pallets, and areeasy to build in automated warehouses. From a modeling perspective, building a three-dimensional packing based on layers reduces the problem to a two-dimensional bin packingproblem.
Tests on a large industrial dataset composed of 750 items reveal that the approach issuccessful in reducing the set of items into 4 groups, each with a common height, as a wella fifth small group of remaining items. The uniform height groups are used to form layersby passing the relative positioning and the coordinate information of the grouped itemsinto a three-dimensional mixed integer programming formulation. A fast placement 2Dheuristic was also used. The resulting solution leads to eight well-built pallets where morethan 85% of the items have at least 3 corner support.
Possible future research based on the two-phase method can focus on the incorporationof other practical constraints, such as guaranteed item support and load bearing. Thesecan be handled at the layer formation or pallet building phases, respectively.
41


References
Allen, S. D., Burke, E. K., Marecek, J., 2012. A space-indexed formulation of packingboxes into a larger box. Operations Research Letters 40 (1), 20–24.
Bischoff, E., 2006. Three-dimensional packing of items with limited load bearing strength.European Journal of Operational Research 168 (3), 952–966.
Bischoff, E. E., Janetz, F., Ratcliff, M., 1995. Loading pallets with non-identical items.European Journal of Operational Research 84 (3), 681–692.
Bischoff, E. E., Marriott, M. D., 1990. A comparative evaluation of heuristics for containerloading. European Journal of Operational Research 44 (2), 267–276.
Bischoff, E. E., Ratcliff, M., 1995. Issues in the development of approaches to containerloading. Omega 23 (4), 377–390.
Bortfeldt, A., Wascher, G., 2013. Constraints in container loading–a state-of-the-art re-view. European Journal of Operational Research 229 (1), 1–20.
Capgemini, Langley, C. J., 2016. 2016 third-party logistics study: The state of logisticsoutsourcing. Tech. rep., http://www.3plstudy.com/3pldownloads.php.
Capgemini, Langley, C. J., 2017. 2017 21st annual third-party logistics study: The stateof logistics outsourcing. Tech. rep., http://www.3plstudy.com/3pldownloads.php.
Chen, C., Lee, S.-M., Shen, Q., 1995. An analytical model for the container loading prob-lem. European Journal of Operational Research 80 (1), 68–76.
Crainic, T. G., Perboli, G., Tadei, R., 2008. Extreme point-based heuristics for three-dimensional bin packing. Informs Journal on Computing 20 (3), 368–384.
43

Crainic, T. G., Perboli, G., Tadei, R., 2009. TS 2 PACK: A two-level tabu search forthe three-dimensional bin packing problem. European Journal of Operational Research195 (3), 744–760.
Elhedhli, S., Gzara, F., Yan, Y. F., 2017. A MIP-based slicing heuristic for three-dimensional bin packing. Optimization Letters, 1–17.
Faina, L., 2000. A global optimization algorithm for the three-dimensional packing problem.European Journal of Operational Research 126 (2), 340–354.
Farøe, O., Pisinger, D., Zachariasen, M., 2003. Guided local search for the three-dimensional bin-packing problem. Informs Journal on Computing 15 (3), 267–283.
Fasano, G., 2004. A MIP approach for some practical packing problems: Balancing con-straints and tetris-like items. Quarterly Journal of the Belgian, French and Italian Op-erations Research Societies 2 (2), 161–174.
Fasano, G., 2008. MIP-based heuristic for non-standard 3D-packing problems. 4OR 6 (3),291–310.
George, J. A., Robinson, D. F., 1980. A heuristic for packing boxes into a container.Computers & Operations Research 7 (3), 147–156.
Goncalves, J. F., Resende, M. G., 2013. A biased random key genetic algorithm for 2Dand 3D bin packing problems. International Journal of Production Economics 145 (2),500–510.
Hifi, M., Negre, S., Wu, L., 2014. Hybrid greedy heuristics based on linear programmingfor the three-dimensional single bin-size bin packing problem. International Transactionsin Operational Research 21 (1), 59–79.
Junqueira, L., Morabito, R., Yamashita, D. S., 2012a. three-dimensional container load-ing models with cargo stability and load bearing constraints. Computers & OperationsResearch 39 (1), 74–85.
Junqueira, L., Morabito, R., Yamashita, D. S., 2012b. MIP-based approaches for thecontainer loading problem with multi-drop constraints. Annals of Operations Research199 (1), 51–75.
Jylanki, J., 2010. A thousand ways to pack the bin-a practical approach to two-dimensionalrectangle bin packing. http://clb. demon. fi/files/RectangleBinPack. pdf.
44

Lodi, A., Martello, S., Vigo, D., 2002. Heuristic algorithms for the three-dimensional binpacking problem. European Journal of Operational Research 141 (2), 410–420.
Mahvash, B., Awasthi, A., Chauhan, S., 2017. A column generation-based heuristic forthe three-dimensional bin packing problem with rotation. Journal of the OperationalResearch Society, 1–13.
Martello, S., Pisinger, D., Vigo, D., 2000. The three-dimensional bin packing problem.Operations Research 48 (2), 256–267.
Martello, S., Pisinger, D., Vigo, D., Boef, E. D., Korst, J., 2007. Algorithm 864: Gen-eral and robot-packable variants of the three-dimensional bin packing problem. ACMTransactions on Mathematical Software (TOMS) 33 (1), 7.
Mohanty, B. B., Mathur, K., Ivancic, N. J., 1994. Value considerations in three-dimensionalpackinga heuristic procedure using the fractional knapsack problem. European Journalof Operational Research 74 (1), 143–151.
Moura, A., Oliveira, J. F., 2005. A GRASP approach to the container-loading problem.IEEE Intelligent Systems 20 (4), 50–57.
Paquay, C., Limbourg, S., Schyns, M., Oliveira, J. F., 2017. MIP-based constructive heuris-tics for the three-dimensional bin packing problem with transportation constraints. In-ternational Journal of Production Research, 1–12.
Paquay, C., Schyns, M., Limbourg, S., 2016. A mixed integer programming formulationfor the three-dimensional bin packing problem deriving from an air cargo application.International Transactions in Operational Research 23 (1-2), 187–213.
Pimpawat, C., Chaiyaratana, N., 2001. Using a co-operative co-evolutionary genetic algo-rithm to solve a three-dimensional container loading problem. In: Evolutionary Compu-tation, 2001. Proceedings of the 2001 Congress on. Vol. 2. IEEE, pp. 1197–1204.
Pisinger, D., 2002. Heuristics for the container loading problem. European Journal ofOperational Research 141 (2), 382–392.
Ratcliff, M., Bischoff, E., 1998. Allowing for weight considerations in container loading.Operations Research Spektrum 20 (1), 65–71.
Scheithauer, G., 1991. A three-dimensional bin packing algorithm. Elektronische Informa-tionsverarbeitung und Kybernetik 27 (5/6), 263–271.
45

Toffolo, T. A., Esprit, E., Wauters, T., Berghe, G. V., 2017. A two-dimensional heuris-tic decomposition approach to a three-dimensional multiple container loading problem.European Journal of Operational Research 257 (2), 526–538.
Transport Canada, may 2016. Transportation in Canada 2015. Tech. rep.,https://www.tc.gc.ca/eng/policy/anre-menu.htm.
Wascher, G., Haußner, H., Schumann, H., 2007. An improved typology of cutting andpacking problems. European Journal of Operational Research 183 (3), 1109–1130.
Wu, H., Leung, S. C., Si, Y.-W., Zhang, D., Lin, A., 2017. Three-stage heuristic algorithmfor three-dimensional irregular packing problem. Applied Mathematical Modelling 41,431–444.
Wu, Y., Li, W., Goh, M., de Souza, R., 2010. Three-dimensional bin packing problem withvariable bin height. European Journal of Operational Research 202 (2), 347–355.
Yildiz, B., Gzara, F., Elhedhli, S., submitted in 2017. Three-dimensional bin packing andmixed-case palletization. Operations Research.
Zhao, X., Bennell, J. A., Bektas, T., Dowsland, K., 2016. A comparative review of 3dcontainer loading algorithms. International Transactions in Operational Research 23 (1-2), 287–320.
Zhu, W., Huang, W., Lim, A., 2012. A prototype column generation strategy for themultiple container loading problem. European Journal of Operational Research 223 (1),27–39.
46