a driving of mounted attenuator markings in during
TRANSCRIPT

A Driving Simulator Study:
Evaluation of Vehicle Mounted Attenuator Markings in Work Zones During Different Times of the Day
Final Report
Submitted by:
Ghulam H. Bham, PhD Ming C. Leu, PhD Durga Raj Mathur Manoj Vallati
Civil, Architectural and Environmental Engineering Missouri University of Science and Technology
1401 N. Pine Street 135 Butler Carlton Hall
Rolla, MO 65409 Email: [email protected], Telephone: 573‐341‐6286, Fax: 573‐341‐4729
Sponsoring Agency and Institution: Smart Work Zone Deployment Initiative
Iowa State University
Agency monitor: Daniel Smith
ii
TECHNICAL REPORT STANDARD TITLE PAGE
1. Report No. 2.Government Accession No. 3. Recipient’s Catalog No.
FHWA MO-2010-00X
5. Report Date
4. Title and Subtitle
A Driving Simulator Study: Evaluation of Vehicle Mounted Attenuator Markings in Work Zones During Different Times of the Day
September 2010
6. Performing Organization Code NA
7. Author(s) 8. Performing Organization Report No.
Ghulam H. Bham, PhD, Ming C. Leu, PhD, Durga Raj Mathur, Manoj Vallati
NA
9. Performing Organization Name and Address 10. Work Unit No.
Civil, Architectural and Environmental Engineering Missouri University of Science and Technology 1401 N. Pine Street Rolla, MO 65409
11. Contract or Grant No.
12. Sponsoring Agency Name and Address
13. Type of Report and Period Covered
Smart Work Zone Deployment Initiative Final Report
14. Sponsoring Agency Code
15. Supplementary Notes
16. Abstract This report presents a study of driver perceptions using a driving simulator carried out on the effectiveness of four markings which vary in striping patterns and color combinations used at the rear of vehicle mounted attenuators (VMAs) in work zones during daytime, dusk and nighttime. One hundred and twenty participants from different age groups took part in the evaluation of VMA markings by driving through virtual highway work zones. During this experiment, driver reaction to VMA markings was determined based on their lane change distance (LCD). Additionally, the drivers were surveyed using a detailed subjective survey. Analysis of variance (ANOVA) was performed to determine the significant variables affecting the LCD. For each time of day, a pair wise least-square means test was conducted to calculate the difference in LCD between the markings. A Kolmogorov- Smirnov test was carried out to evaluate the significance of differences between the LCD frequency distributions of the markings. For the subjective evaluation, the markings were ranked by participants indicating their preferences using four different criteria for each time of day. The participants were also surveyed on the features of the individual markings and for the most preferred marking. The results of the objective and subjective evaluations indicated that, overall, the red and white checkerboard pattern was most effective. 17. Key Words 18. Distribution Statement
vehicle mounted attenuator (VMA), driving simulator, virtual reality, work zone, driver behavior, traffic control devices (TCD)
19. Security Classif (of this report) 20. Security Classif. (of this page) 21. No of Pages 22. Price
Unclassified Unclassified 37
Form DOT F 1700.7 (8-69)
iii
EXECUTIVE SUMMARY
Vehicle mounted attenuators (VMAs) are crash cushions mounted at the rear of vehicles and can reduce the severity of rear-end collisions with vehicles in work zones. The literature reviewed did not offer specific guidelines for selecting VMA color combination or striping patterns. The present research is a first step towards determining effective VMA markings for use in construction zones for different times of the day with drivers from different age groups. This study evaluated four vehicle mounted attenuators (VMAs) used by Departments of Transportation (DOTs) in work zones to determine the effectiveness of specific striping patterns and color combinations. US Departments of Transportation (DOTs) were surveyed on the VMA practice in work zones and the results indicated that the yellow and black inverted ‘V’ pattern was widely used as it was provided by most VMA suppliers. The DOTs use the lane change distance and crash data to determine the effectiveness of VMAs. The VMAs were reported to reduce the number and severity of crashes in work zones.
A driving simulator study was conducted to evaluate VMAs for daytime, dusk and nighttime. One hundred and twenty participants from different age groups took part in the evaluation of VMA markings by driving through virtual highway work zones. During this experiment, driver reaction to VMA markings was determined based on their lane change distance (LCD). When tested during the daytime for the mean LCDs, the red and white checkerboard pattern and the orange and white vertical striped pattern were found to be more effective compared to the two other patterns (yellow and black inverted ‘V’ pattern and lime green and black inverted ‘V’ pattern) evaluated. For the dusk condition, the test indicated that the yellow and black inverted ‘V’ pattern was significantly less effective than the other three patterns. The mean LCD of the red and white checkerboard pattern was the largest; however, the differences between the LCD of this pattern and the LCDs of the orange and white vertical striped pattern and of the lime green and black inverted ‘V’ pattern were not statistically significant. For the nighttime condition, no significant differences in the mean LCDs of the patterns were observed.
The drivers were also surveyed using a detailed subjective survey. During the subjective evaluation, the markings were ranked by participants indicating their preferences using four different criteria for each time of day. The participants were also surveyed on the features of the individual markings and for the most preferred marking. The analysis for daytime and nighttime conditions indicated that the participants preferred the red and white checkerboard pattern over other patterns for visibility, capturing the attention of drivers, and contrast with the VMA background criteria. During dusk, the same pattern was preferred for capturing the attention and color contrast with the VMA. When surveyed in terms of overall effectiveness, the red and white checkerboard pattern was the preferred pattern.
The results of the objective and subjective evaluations indicated that, overall, the red and white checkerboard pattern was most effective.

iv
ACKNOWLEDGEMENTS
The authors gratefully acknowledge the grants for this project from the Smart Work Zone Deployment Initiative pool fund study, the Mid-America Transportation Center, and the Intelligent Systems Center at the Missouri University of Science and Technology. The following people are also acknowledged: Ken Gorman, Brian Swift, Bhanu Javvadi and Nikhil and the numerous participants of the experiment.
v
TABLE OF CONTENTS
Pages EXECUTIVE SUMMARY ........................................................................................................... iii ACKNOWLEDGEMENTS ........................................................................................................... iv LIST OF ILLUSTRATIONS ......................................................................................................... vi LIST OF TABLES ........................................................................................................................ vii INTRODUCTION .......................................................................................................................... 1 METHODOLOGY ......................................................................................................................... 2 DISCUSSION OF RESULTS......................................................................................................... 7 CONCLUSIONS........................................................................................................................... 19 RECOMMENDATIONS .............................................................................................................. 19 REFERENCES ............................................................................................................................. 21 APPENDIX A: Screening Questionnaire ..................................................................................... 22 APPENDIX B: Pre-Driving Questionnaire .................................................................................. 24 APPENDIX C: Post-Experiment Questionnaire ........................................................................... 25

vi
LIST OF ILLUSTRATIONS
Figures Pages 1. Vehicle mounted attenuator patterns .......................................................................................... 1 2. Work zone configuration ............................................................................................................ 4 3. USDOT Survey Results .............................................................................................................. 9 4. Lane Change Distance Frequency Histogram and Cumulative Frequency Curves for Different Patterns ...................................................................................................................... 13

vii
LIST OF TABLES
Tables Pages 1. Statistical Results: Main Effects and Interactions .................................................................... 10 2. LCD: Mean, Standard Deviation and p-values of LSMEANS test for Patterns during different Times of the Day ........................................................................................................ 11 3. Results of Kolmogorov Smirnov Test for the Frequency Distributions ................................... 12 4. Mean Subjective Rank .............................................................................................................. 16 5. Risk ratios and p-values of VMA Patterns ............................................................................... 17 6. Mean ranks for features of the patterns .................................................................................... 18

1
INTRODUCTION Work zone safety is a high priority for transportation agencies and the highway construction industry because of the high frequency of work zone fatalities. The number of such fatalities grew in the United States by nearly 45% between 1997 and 2006, from 693 to 1004 (NWZSIC, 2010). The safety of construction operations has received much attention over the past several years. Efforts to improve safety have also increased substantially, particularly in the wake of a fatal accident in Washington D.C. in 1975 (Mackay and John, 1995). Crash frequency, however, continues to increase, mostly due to increase in highway construction activities. Preventing crashes and reducing the severity of crashes require anticipation of driver reactions to specific situations, which is addressed in this report.
Vehicle mounted attenuators (VMAs) are crash cushions mounted at the rear of vehicles and can reduce the severity of rear-end collisions with construction vehicles in work zones. Humphrey and Sullivan (1991) studied the effectiveness of VMAs and indicated that these devices save about $23,000 per crash and reduce damage to the construction vehicle. The study also showed that injury rates were higher when construction vehicles were not equipped with VMAs. Safety improvements generally can adopt one of two approaches. The first approach focuses on protecting vehicle occupants in the event of a crash whereas the second approach focuses on preventing crashes. The present study addresses the second approach.
The Manual on Uniform Traffic Control Devices (MUTCD) (2003) and the American Association of State Highway and Transportation Officials (AASHTO) Roadside Design Guide (2002) both contain general guidelines for VMAs. Neither publication, however, includes recommendations for striping patterns and/or colors for these devices. The predominant color combinations used by the state Departments of Transportation (DOTs) are yellow and black, orange and white, red and white, and lime green and black in an inverted ‘V’, striped or checkerboard design. Figure 1 shows striping patterns and color combinations mainly used by the DOTs in the United States.
(a)Lime Green and Black Inverted ‘V’ Pattern (b) Red and White Checkerboard Pattern
(c)Yellow and Black Inverted ‘V’ Pattern (d) Orange and White Vertical Stripes Pattern
FIGURE 1. Vehicle mounted attenuator patterns This study evaluates the driver perception of the effectiveness of various striping patterns
and color combinations for VMAs. Of particular concern was the use of an inverted ‘V’ pattern when the following vehicles do not have the option of passing the work vehicle on both sides, e.g. when the work vehicle is on the shoulder but the inverted ‘V’ sign indicates that both sides

2
can be used. The importance of contrast with the truck/vehicle color is also of interest. The results of this study can help state DOTs to select the most effective VMA color combination and striping pattern, thereby contributing to the improvement of safety and operations in work zones on high-speed, high-volume roadways.
Driver perception and behavior can be evaluated by traffic modeling and simulation, and field studies using a driving simulator. Popular microscopic traffic simulation models do not incorporate driver perceptions such as vision, hearing, driver sight identification distance and cannot be used to evaluate the colors and patterns of traffic control devices (TCDs). Field data collection can test a limited number of TCDs. Driving simulator studies, however, permit the study of hazardous driving situations that cannot be safely replicated during field tests. Such studies can be efficient and facilitate the collection of a wide range of data. They are also repeatable, and permit easy and safe replication of numerous scenarios to evaluate subjects’ reaction to multiple TCDs.
A field study carried out on VMAs in New Zealand (Smith, Edwards, O’Neil, and Goluchowski, 2006) reported that flashing strobe lights provided enhanced capabilities over rotating beacons, with at least 11.3% of drivers reacting at distances larger than 984 feet during nighttime. Under day and night conditions, a wide retro-reflective tape around the edges of the arrow board significantly improved drivers’ average recognition distance of the VMA by at least 125 feet. Also, the recognition distance increased at night when the traffic volumes were lower (i.e. approximately 400 vehicles/hour) as compared to recognition distance during the day with higher traffic volumes (i.e. approximately 880 vehicles/hour). The drivers were not observing the far-distance ahead probably because they were more focused on monitoring the activities of other drivers who may be a potential risk to them.
Another field study (Steele and Vavrik, 2009) on driver behavior around lane closures with an aim to improve the safety of moving lane closures found that 94.4% of drivers moved out of the closed lane at more than 500 feet before the start of the taper for a rural test site compared to 86.8% for an urban area. The percentage of vehicles that reached the VMA vehicle within 500 feet was 4.8% and 12.2% for rural and urban areas, respectively.
Studies have also compared the use of different colors. Kamyab and Storm (2001) used a fluorescent yellow-green background with an orange sign and found that this showed an improvement in the contrast between the sign and the orange DOT truck. They conducted a driver survey on the visibility of the sign with and without the fluorescent background. Traffic volumes were measured and data analysis revealed significant decrease in traffic volume within 100 feet for the lane where the truck was present when the fluorescent yellow-green background was used with the sign. Another study by Atchley (2006), however, suggested that fluorescent traffic signs have no advantage over non-fluorescent signs.
The literature reviewed did not offer specific guidelines for selecting VMA color combination or striping patterns. The present research is a first step towards determining effective VMA markings for use in construction zones for different times of the day with drivers from different age groups.
METHODOLOGY A driving simulator was used to evaluate driver perceptions and behavior objectively as well as subjectively. Additionally, a survey of state DOTs evaluated their use of VMAs. This section describes the details of DOT survey, the driving simulator experimental setup, the statistical data

3
analysis conducted to evaluate the driver behavior and perceptions, and the details of the questionnaires used. DOT Survey Fifty state DOTs were contacted and requested to complete the VMA survey on-line. The survey was carried out for six weeks between February and March 2008 and 30 states responded. The survey comprised of five parts: 1) General information related to VMAs, 2) Policy pertaining to VMA usage, 3) VMA striping patterns and colors in use, 4) VMA evaluation and effectiveness, and 5) VMA crash data. The results of the web survey are summarized in the next section. Driving Simulator Study Missouri S&T Driving Simulator A fixed-base driving simulator used for this study comprised of a passenger car, three LCD projectors, a projection screen, and three networked computers with Ethernet connection. The computer that processes the motion of the vehicle was defined as the master; the other two computers were defined as slaves. The passenger car is a Ford Ranger pick-up truck with a speedometer and different types of optical sensors used to measure the steering operation, vehicle position, speed, acceleration/deceleration, and braking. The screen had an arc angle of 54.6°, an arc width of 25 feet and a height of 6.6 feet. The field of view was around 120°.
The resolution of the visual scene generated by the master was 1024×768 pixels, and that for the slaves was 800×1200 pixels; the refresh rate was 30 to 60 Hertz depending on the scene complexity. The system was also equipped to reproduce engine sound. A more detailed description of the system structure, projection system, and the data acquisition process can be found in Wang et al. (2006).
Work Zone Setup and Configuration Work zone scenarios for daytime, dusk and nighttime were developed which replicated a 4-lane rural divided highway. Each scenario included four consecutive work zones on a highway with different VMA markings. The highway was approximately eight miles long; first work zone was setup after 1.5 miles, each work zone was 0.5 miles long and 1.5 miles apart. Figure 2 shows a work zone setup with traffic control devices, two VMA vehicles (with the same markings) , and a construction vehicle on the closed lane. The four VMA markings varied randomly for the participants driving on the virtual highway with work zones.
The virtual work zone environment created for the experiment was set up according to MUTCD (2003) and Missouri DOT specifications for a partial lane closure on a divided highway. These guidelines specified sign spacings, taper lengths, and optional buffer length channelizer spacings for various speed limits, sign heights, and work zone lengths. To replicate a real environment, traffic control devices such as cones, barriers, and traffic signs were placed on the highway. The first 1.5 miles of the freeway had a speed limit of 70 mph indicated by a regulatory speed limit sign at the beginning of the section. Additional traffic signs were placed along the right side of the roadway 500 feet apart, as shown in Figure 2, starting with ‘Road Work Ahead’ warning sign located 1.5 miles at the start of the work zone. The four remaining signs were placed in the following order: speed limit sign ‘45 mph’, ‘Right Lane Closed Ahead,’ another speed limit sign ‘45 mph,’ and then ‘Right Lane Closed Ahead’ again. Each construction zone was 1300 feet in long with barriers on the lane markings. The construction zone consisted of a shadow vehicle with a VMA, a work vehicle with a VMA, and a construction vehicle. These

4
vehicles were separated by a distance of 550 feet. The taper upstream of the vehicles was not used because of two reasons: it would interfere with the visibility of the VMA markings – the cones were in the line of sight of the driver and the VMA markings. Additionally, the driver behavior will be affected by the taper area (cones) instead of the VMA marking which might lead to incorrect results.
FIGURE 2. Work zone configuration
Participants Participants in this study were students, staff and faculty from Missouri S&T, and residents of Rolla, Missouri. One hundred and twenty people were selected to participate in the experiment. Three age categories were selected for this study: younger aged group was 18 to 34 years (sample size (S) = 70, mean (M) = 21.8 years, standard deviation (SD) = 2.0 years), middle aged group was 35 to 64 years (S = 30, M = 45.3, SD = 7.6), and older aged group 65 years and up (S = 20, M = 73.3, SD = 6.8). The gender split was approximately 50/50 for all age groups. Prior to scheduling the experiment, the participants were screened using a questionnaire to inquire if they had a US driver’s license, any health issues that would affect driving, and they do not suffer from motion sickness. All participants had normal or corrected-to-normal vision and none of them reported any form of color deficiency. Most surveyed met the requirements and participated in the experiment. Of the 120 participants, 51 had been driving for more than 15 years, 49 had been driving between 5 and 15 years, and 20 had been driving between 1 and 5 years. All participants had previously encountered VMAs in highway work zones. Experiment The participants were checked before the start of the experiment if they were carrying a valid US driving license with them. Participants who were found without a valid US license were turned away from the experiment. The participants were first given a brief introduction to the driving simulator and advised to adhere to traffic laws and to drive as they would in normal traffic conditions. The participants were also notified that they could quit the experiment at any time in

5
case of motion sickness or discomfort. To familiarize the participants with the driving simulator, the environment, and the instructions, participants first drove through a trial scenario similar to that used in the experiment. Typically, each participant first drove for several minutes during the trial run. After the trial run, each subject drove through the three scenarios: daytime, dusk and nighttime in random order. Also, the four work zones with different VMA patterns appeared in random order and were equally distributed within each scenario. Driver behavior data was collected by various sensors of the driving simulator for every 0.1 seconds.
The markings used in the present study did not incorporate retro-reflective properties. During a visit to Missouri DOT’s maintenance facility, it was observed that the yellow and black inverted ‘V’ pattern did not have retro-reflective properties whereas the red and white checkered board pattern newly bought by the DOT had retro-reflective markings.
Pre- and Post-Experiment Questionnaires All participants were surveyed before and after the driving simulator experiment. The pre-experiment questionnaire inquired about any health issues and consumption of alcohol/drug use during the last 24 hours of the experiment. This was carried out to ensure that drivers were alert and eligible for participation on the day of the experiment.
After the driving simulator experiment, each participant was asked to complete a post-experiment questionnaire. The questionnaire served as the subjective evaluation of the VMA patterns based on the participant’s experience with the driving simulator. The participants were asked to rank the four patterns based on the following criteria: i) visibility, ii) alerting drivers to work zone, iii) capturing the attention of drivers, and iv) color contrast with the VMA vehicle, by different times of the day. Visibility was used as a criterion for evaluation of the VMAs because it is important with regard to specific conditions such as times of the day and the environment. A VMA pattern that is visible from a distance would alert the driver to construction activity downstream, thus reducing the risk of a crash. The pattern that captures the attention of the drivers would cause drivers to notice a work zone and change lanes before approaching the VMA. Alerting drivers to work zone and contrast with the VMA background were used as criteria to make conclusions about the best possible color combinations that contrast with the construction equipment.
The participants were also asked to rank features of individual striping patterns they liked the most. This was carried out to indicate their preference for each marking based on pattern design, color combination, and color contrast using a scale of 1 to 3, with 1 indicating most liked and 3 indicating least liked. The participants were also asked to indicate their overall preference of a pattern and how they interpreted the meaning of some of the features of the markings.
Data Analysis The drivers’ acceleration/deceleration, speed, position and steering angle were the main variables measured during the driving simulator experiment, for use in the objective evaluation. From vehicle positions, the distances from the point of lane change to the VMA on the closed lane were obtained. This distance, called the lane change distance (LCD), was used as a criterion for determining the effectiveness of the VMA patterns. The LCD was measured from the point where the driver began to steer continuously out of the right lane towards the left lane, achieving the maximum steering angle. The drivers were assumed to be responding to the appearance of the VMA pattern in the construction zone. LCD was selected because most DOTs that responded to a survey (Bham et al., 2009) conducted as part of this study, indicated its use to determine the

6
effectiveness of VMAs in work zones. The details of the state DOT survey and the results have been presented elsewhere (Bham et al., 2009) and thus are not repeated here. Further, the study (Bham et al., 2009) found that the speed-reduction identification distance, i.e. the distance from the VMA at which the drivers start decelerating, should not be used to evaluate VMA patterns because drivers reduce their speed in response to advance warning signs.
The driving simulator experiment was set up such that each participant drove through the three scenarios: daytime, dusk and nighttime in random order. During each scenario the drivers were exposed to the four VMA markings in random order. The appropriate statistical design for this experiment was a split-split-plot, with each participant represented as a main-plot with gender and age group playing the role of main-plot factors, the time-of-day acting as the sub-plot factor and the four markings as the sub-sub-plot factor. The aggregate data was unbalanced because the numbers of participants tested for each marking and time-of-day combination were different. This was caused by drivers who did not complete the experiment as they had to leave and the result of data loss due to human error.
Analysis of variance (ANOVA) was carried out to test the statistical significance of gender, age groups, time-of-day, VMA markings, and their interactions on the mean LCD. The test was conducted using the Statistical Analysis System (SAS, 2008) software package. The statistical significance (null hypothesis) of independent variables (factor) or the interactions of two or more variables on the mean LCD was rejected if the p-value was less than or equal to the chosen significance level of 0.05. Because of the unbalanced data, the expected mean squares for the error terms (three error terms in a split-split-plot setup: the main-plot error, the sub-plot error, and the sub-sub-plot error) and those for the corresponding treatment effects did not match exactly under the null hypothesis. As a result of this, each test was carried out manually by computing the error terms for each test based on the estimates of the three variance components associated with the main-plot, sub-plot and sub-sub-plot error terms. The error terms were constructed such that under the null hypothesis the tested effect is zero, the expected mean squares of the tested effect and the corresponding error terms are equal.
Pairwise comparisons of least-square means (LSM) between patterns for each time of day were performed in SAS software. LSM are predicted values, based on the model fitted, across values of a categorical effect where other model factors are held constant by setting them to the least square estimate of their mean. If the experiment is balanced where each combination of factors (i.e., independent variables) is replicated an equal number of times, least square means will be the same as regular sample means. In this experiment, however, equal samples were not available within the factor combinations, therefore sample means were not unbiased estimates of the true population means associated with the treatment combinations and the use of the least- square means was warranted. The least-square means test was conducted by employing the Tukey-Kramer adjustment, which uses the approximation described by Kramer (1956). It was used to accommodate the unbalanced data and provide good control of the Type 1 error rate.
To further analyze the data, a Kolmogorov-Smirnov (KS) test was also conducted for each time of day to ascertain statistically significant difference between the lane-change cumulative frequency distributions for the four VMA patterns. The KS procedure tests the null hypothesis of no significant difference between the LCD cumulative distributions for the four VMA markings by looking at the difference at the point of maximum separation between the distribution curves. This is in contrast to the ANOVA based test described earlier, which looked at the differences between means. A significant difference between the frequency distributions for any two markings for a given time of the day would imply that the lane-change behavior of
7
drivers was different between these markings. Straightforward use of the KS test on the LCD distribution of participants would reduce the power of the test because of the heterogeneity of participant driving styles which would add to the “noise” in the data. The effect of an individual participant’s driving style was eliminated by calculating the dependent variable as the difference between the marking LCD for a participant and the average LCD of that participant for the four markings. This distance was used instead of the actual LCD of the marking for the KS test. The KS test was conducted at 0.05 level of significance.
To supplement the objective evaluation, all participants completed a post-experiment questionnaire for subjective evaluation of the VMA markings. The subjective evaluation served as an opinion poll of the participants regarding the four markings in contrast with measuring the effect of the marking on the actual driving behavior. The results of the subjective evaluation should be carefully interpreted as they represent the perception of the drivers. The analysis of the subjective evaluation was carried out for each time of day as it was found from the objective evaluation that the subjects reacted differently to the patterns at different times of the day. Thus, the mean rank for a particular pattern was calculated by taking the arithmetic mean of the ranks for each time of the day and for each criterion.
A statistical test was also carried out to find the significance of participants’ preference of the markings. It should be noted here that the participants did not choose a preferred marking from among the four but ranked them according to a criterion. Thus, the data from an individual provides information on his/her ranked preference as the first, second, third and the last choice. Further, the ranks for each marking were correlated for an individual. The statistical model that was used to analyze this data can be explained as: first, a participant selected his/her the first choice (rank = 1, the highest rank). Then, among the rest, the next best choice was selected (rank = 2) and so on. The resulting model is sometimes referred to as the exploded logit model, a discussion of which can be found in Allison and Christakis (1994). The likelihood function obtained for this model is exactly the same as the likelihood one would obtain for the stratified Cox regression analysis and thus can be estimated using the PHREG procedure in SAS (2008). In this context, the PHREG procedure estimates the parameters of the model and provides risk ratios of proportions, which are the odds of a marking to be ranked 1 (best) under a particular criterion when compared against a base marking. For analysis of results, the yellow and black inverted ‘V’ pattern was used as the base pattern and the risk ratios for the rest of the markings with respect to it were estimated.
DISCUSSION OF RESULTS DOT Survey Results This section summarizes the responses of the 30 states. The results of the survey are presented in different categories below. VMA Policy The DOTs were inquired about the policy of VMA usage in work zones. Thirty two responses were received. Twenty-four states (77.4%) reported the use of VMAs in work zones as a transportation agency policy; Delaware, reported its use because of state law; six states (19.4%), Rhode Island, Minnesota, Wisconsin, Hawaii, Nebraska, and Massachusetts use VMAs in work zones independent of transportation agency policy or state law. Except Montana, all DOTs, reported the use of VMAs in work zones.

8
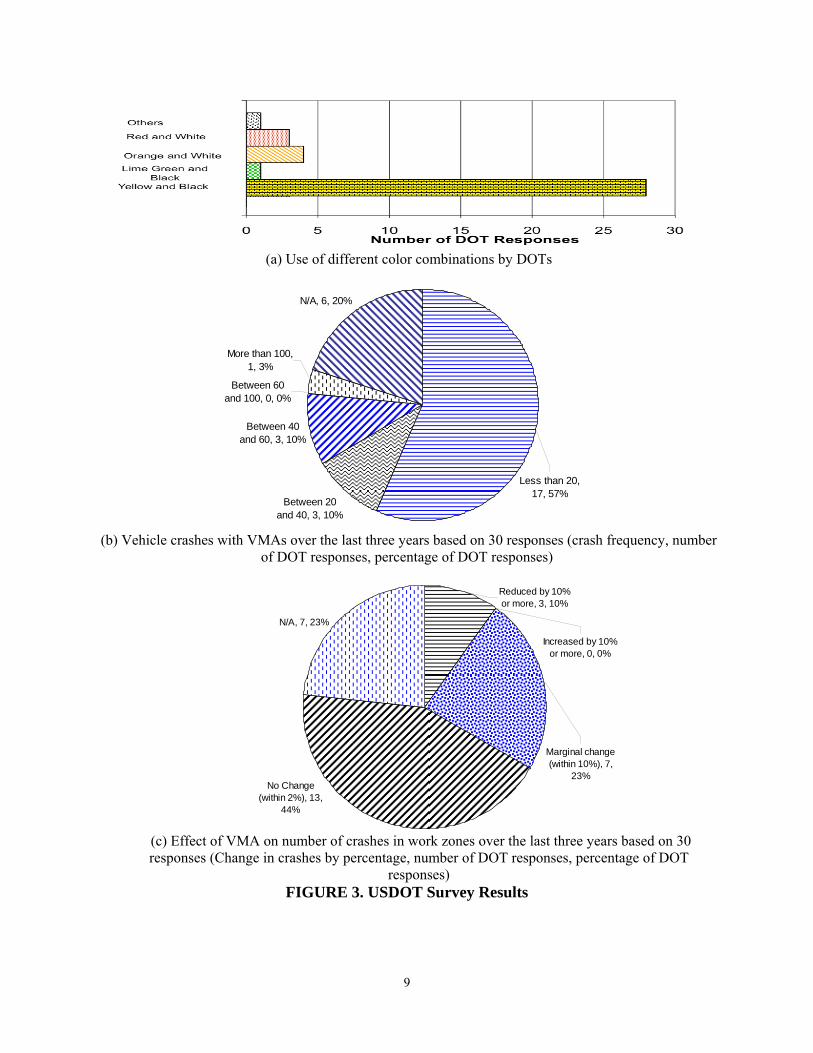
VMA Striping Patterns and Colors The DOTs were surveyed about the different color combinations used with the VMAs. Figure 3(a) graphically presents the DOT’s use of different VMA color combinations. Twenty eight states indicated the use of yellow and black; Washington D.C. uses all four VMA color combinations; Louisiana uses three color combinations; yellow and black, orange and white, and red and white; Kansas uses yellow and black, and orange and white, Texas uses yellow and black, and red and white color combinations; and Florida uses orange and white color combinations. Delaware and Oregon use yellow and black to make the device stand out from orange and white construction equipment. New York uses a yellow and blue color combination to match the colors of their trucks.
The DOTs were also inquired about the type of VMA markings in use. Twenty-seven agencies indicated use of inverted ‘V’ pattern for VMA stripes; Texas and New York use an inverted ‘V’ pattern to indicate that vehicles can pass on either side of the truck; Kansas uses an inverted ‘V’ pattern similar to a Type III barricade; and California indicated use of a stripe pattern from the lower left corner to the upper right corner.
When DOTs were asked about the basis for the selection of VMA colors and patterns, out of the 19 state agencies, 8 use the VMA patterns and colors provided by VMA suppliers and 11 use these colors and patterns to conform to MUTCD guidelines for work zones, warning colors, and object markers.
VMA Evaluation and Effectiveness The agencies were asked if they had tested the patterns and colors used with the VMAs. Only Texas indicated that they had evaluated various colors and striping patterns for VMAs. They found that the red and white inverted ‘V’ pattern was most appropriate for their fleet. Also, the DOTs were asked about the conditions during which the VMAs were used. Six agencies use VMAs in both daytime and nighttime conditions, whereas three agencies use them only during the day. Only two agencies, West Virginia and California, use VMAs during day and nighttimes, and misty/foggy conditions.
The DOTs were also asked if they had evaluated the effectiveness of VMAs in work zones. Washington, Wisconsin, and Hawaii indicated they had used crash data and LCD to determine the effectiveness of using VMAs in work zones. Nine agencies only used crash data as a measure of effectiveness. Rhode Island, Texas, Indiana, and Washington had used the following measures of effectiveness: visibility of VMAs (determined through surveys or the use of videos during which changes in driver behavior were observed), work zone operation and proximity to traffic, workers survival rate after car or truck impacts, and visual assessment under various light conditions. None of the DOTs reported conducting a detailed study to evaluate the effectiveness of VMA striping patterns or color combinations.
9
(a) Use of different color combinations by DOTs
Between 20 and 40, 3, 10%
Between 40 and 60, 3, 10%
Between 60 and 100, 0, 0%
More than 100, 1, 3%
N/A, 6, 20%
Less than 20, 17, 57%
(b) Vehicle crashes with VMAs over the last three years based on 30 responses (crash frequency, number
of DOT responses, percentage of DOT responses)
N/A, 7, 23%
Marginal change (within 10%), 7,
23%
Increased by 10% or more, 0, 0%
No Change (within 2%), 13,
44%
Reduced by 10% or more, 3, 10%
(c) Effect of VMA on number of crashes in work zones over the last three years based on 30 responses (Change in crashes by percentage, number of DOT responses, percentage of DOT
responses) FIGURE 3. USDOT Survey Results

10
VMA Crash Data Figure 3(b) presents the results of the survey about crash frequency and severity with the VMAs in work zones during the last three years. Thirty DOTs responded out of which seventeen agencies (57%) reported fewer than 20 vehicles had crashed into VMAs. Three agencies (10%) reported that 20 to 40 vehicles had crashed into VMAs; three agencies (10%) reported that 40 to 60 vehicles had crashed into VMAs; and one agency (3%) reported more than 100 vehicles had crashed into VMAs; and six agencies (20%) reported no data available. No agencies reported vehicle crashes numbering between 60 and 100. Figure 3(c) summarizes the DOT responses (30) about the effect of VMA usage on the number of crashes in work zones. The DOTs reported a reduction in work zones crashes when VMAs were used compared to crashes without the use of VMAs. Seven agencies (23%) noticed a reduction of less than 10%; three agencies (10%) noticed a 10% reduction; thirteen agencies (44%) noticed almost no change (less than 2%); and seven agencies (23%) reported no data available. No agencies reported an increase in crashes. Most of the agencies indicated that less than 5% crashes involving VMAs were severe. Driving Simulator Study Objective Evaluation Table 1 presents the results of the split-split-plot ANOVA test. The analysis indicated that the variables: Gender, Age group, and the interaction term Time-of-day*Pattern were statistically significant. Age group and Gender showed no significant interaction with other variables or with each other. Their effects on the LCD were, therefore, not evaluated individually. The time-of-day and pattern were evaluated individually because they had significant interaction in their effects on the LCD. TABLE 1: Statistical Results: Main Effects and Interactions
Source DFNUM# DFDEN^ F-ratio Prob > F Gender 1 114 4.30 0.0403
Age group 2 114 6.44 0.0022 Gender*Age group 2 114 0.47 0.6233
Time of day 2 220 105.12 <0.0001Gender*Time of day 2 220 0.59 0.5516
Time of day*Age group 4 220 1.48 0.2070 Gender*Time of day*Age group 4 220 2.40 0.0507
Pattern 3 982 14.59 <0.0001 Gender*Pattern 3 982 1.77 0.1516
Age group*Pattern 6 982 1.55 0.1595 Gender*Age group*Pattern 6 982 0.70 0.6473
Time of day*Pattern 6 982 3.18 0.0043 Gender*Time of day*Pattern 6 982 0.72 0.6343
Time of day*Age group*Pattern 12 982 0.74 0.7144 Gender*Time of day*Age group*Pattern 12 982 0.73 0.7199
# DFNUM = (Number of different groups – 1) ^DFDEN = (Total sample size) – (Number of different groups)

11
The data showed that the average LCD for the older age group for all the markings and times of the day was 1058 feet and this was greater than the LCD of the younger age group drivers (854 feet) and the middle age group (847 feet) drivers. This shows that the older drivers moved out of the closed lane much earlier than the younger and the middle age drivers. The difference in LCD clearly indicates that older drivers were risk averse and perhaps less prone to colliding with the VMA. The interaction between Age group and Pattern was not significant, indicating that the order of effectiveness of the markings was similar in all the age groups. It was also found that the mean LCD for male drivers (848 feet) averaged over all times of the day was shorter than that for female drivers (924 feet). Clearly, female drivers moved out of the closed lane earlier than the male drivers, suggesting that the male drivers were aggressive and more prone to risk taking compared to female drivers. The order of effectiveness of the markings was similar in males and females as the interaction between Gender and Pattern was not significant. The interaction term Gender*Time-of-day*Age-group was found to be very close to being statistically significance (p-value = 0.0507) as seen in Table 1. Since this interaction does not involve Pattern, the primary variable of interest, further investigation of this possibility was not carried out. It should be noted, however, that the nighttime mean LCDs for a combination of Gender and Age group were less than the LCD during dusk and daytime.
TABLE 2: LCD: Mean, Standard Deviation and p-values of LSMEANS test for Patterns during different Times of the Day
Times of Day
Patterns Mean
Standard Deviation
Yellow and black
Lime green
Orange and
white feet p-values
Daytime
Red and white 1147 443 <0.0001 0.0011 0.9971
Orange and white 1110 438 0.0011 0.0493 - Lime green 991 326 0.9977 - 0.0493
Yellow and black 954 346 - 0.9977 0.0011
Dusk
Red and white 1157 471 0.0002 0.1157 0.8499
Orange and white 1093 459 0.1275 0.9872 - Lime green 1047 369 0.8610 - 0.9872
Yellow and black 983 413 - 0.8610 0.1275
Nighttime
Red and white 636 207 1.0000 1.0000 1.0000Orange and white 649 210 0.9976 1.0000 -
Lime green 658 231 0.9877 - 1.0000Yellow and black 611 161 - 0.9877 0.9976
Patterns: Lime green = lime green & black inverted ‘v’, Orange and white = orange & white vertical striped,; Red and white = red & white checkerboard, Yellow and black = yellow & black inverted ‘v’, “-” = not applicable Bold indicate statistically significant at 0.05 level of significance
The significance of the Time-of-day*Pattern interaction suggests that the way subjects
responded to each of the markings changed according to the time of the day. Therefore, comparison of markings with respect to their mean LCDs was conducted separately for each time of day. Table 2 summarizes the mean and standard deviation of LCD for the four markings for each time of the day. Further statistical analysis was conducted to find which markings were significantly different from the others within each time-of-day category. A KS test was also performed to determine if there was

12
a significant difference between the frequency distribution of the LCD associated with each of the markings. The results below are categorized by time of day so they are easier to comprehend. Daytime Conditions From Table 2, for daytime conditions, on average, drivers changed the lane farthest from the work zone when the red and white pattern, 1147 feet, and the orange and white pattern, 1110 feet, were used on the VMA. For the lime green and black pattern, drivers changed lanes on an average of 991 feet from the VMA. The mean LCD of 954 feet for the yellow and black pattern was the lowest.
As stated earlier, the differences between the mean LCD of markings during different times of the day were tested for significance using the least square means. The mean LCD of the red and white pattern was found to be significantly higher than that of the lime green and black pattern and the yellow and black pattern. Similarly, the mean LCD of the orange and white pattern was also significantly greater than that of the lime green and black pattern and the yellow and black pattern. The difference between the mean LCD of the red and white pattern and the orange and white pattern was not found to be statistically significant. Similarly, the difference in mean LCD between the lime green and black pattern and the yellow and black pattern was not significantly different. Thus, the mean LCDs for the red and white checkerboard and the orange and white vertical striped patterns were significantly larger than those of the other patterns for daytime. TABLE 3: Results of Kolmogorov Smirnov Test for the Frequency Distributions
Times of Day Patterns
Yellow and black
Lime green Orange and
white p-values
Daytime
Red and white <.0001 <.0001 0.8824 Orange and white <.0001 <.0001 -
Lime green 0.2961 - - Yellow and black -
Dusk
Red and white <.0001 0.0209 0.4600
Orange and white <.0001 0.2867 - Lime green 0.0209 - -
Yellow and black -
Nighttime
Red and white 0.7905 0.0674 0.2281 Orange and white 0.0476 0.0010 -
Lime green 0.1726 - - Yellow and black -
Patterns: Lime green = lime green & black inverted ‘v’, Orange and white = orange & white vertical striped, Red and white = red & white checkerboard, Yellow and black = yellow & black inverted ‘v’, “-” = not applicable Bold values indicate statistically significant at 0.05 level of significance

13
(a) Daytime
(b) Dusk
(c) Nighttime
FIGURE 4. Lane Change Distance Frequency Histogram and Cumulative Frequency Curves for Different Patterns

14
The KS test for the LCD distributions of the red and white pattern with the lime green and black pattern (p < 0.0001) and with the yellow and black pattern (p < 0.0001) indicated that these distributions were not identical and the differences were statistically significant at the point of maximum separation. Table 3 presents the results of the KS test. In these cases, the red and white checkerboard pattern had higher cumulative frequency of lane changes at the point of maximum vertical separation between the distributions. The test of the cumulative frequency distributions of the orange and white vertical striped pattern with the lime green and black inverted ‘V’ pattern (p < 0.0001), and with the yellow and black inverted ‘V’ pattern (p < 0.0001) also showed a statistically significant difference. This indicates that the driver perceptions in response to the red and white checkerboard pattern and the orange and white vertical striped pattern were significantly better compared to the lime green and black and the yellow and black inverted ‘V’ patterns. Dusk Conditions From Table 2, for dusk conditions, the mean LCDs showed the same trend observed for daytime conditions. The results of the LSM test indicated that there was no significant difference between the mean LCDs of the patterns except that the mean LCD of the red and white checkered board pattern was significantly (p = 0.0002) greater than the mean LCD of the yellow and black inverted ‘V’ pattern.
From Figure 4(b), it can be observed that most of the drivers recognized the construction zone from a distance of more than 400 feet. This can be attributed to better color contrast with the surroundings during dusk conditions. The KS test, Table 3, for the LCD distributions of the red and white pattern with the lime green and black pattern (p = 0.0209) and with the yellow and black pattern (p < 0.0001) indicated that the distributions were not identical at the point of maximum separation. For these cases, the red and white checkerboard pattern had a higher cumulative frequency of lane changes at the point of maximum vertical separation. The test of cumulative frequency distributions of the yellow and black inverted ‘V’ pattern with respect to the lime green and black inverted ‘V’ pattern (p = 0.0209) and to the orange and white vertical striped pattern (p < 0.0001) also showed a significant difference with a lower cumulative frequency of lane changes for the yellow and black inverted ‘V’ pattern at the point of maximum separation. Therefore, driver perception in response to the red and white checkerboard pattern, the orange and white vertical striped pattern, and the lime green and black inverted ‘V’ pattern was better compared to the yellow and black inverted ‘V’ pattern.
Nighttime Conditions
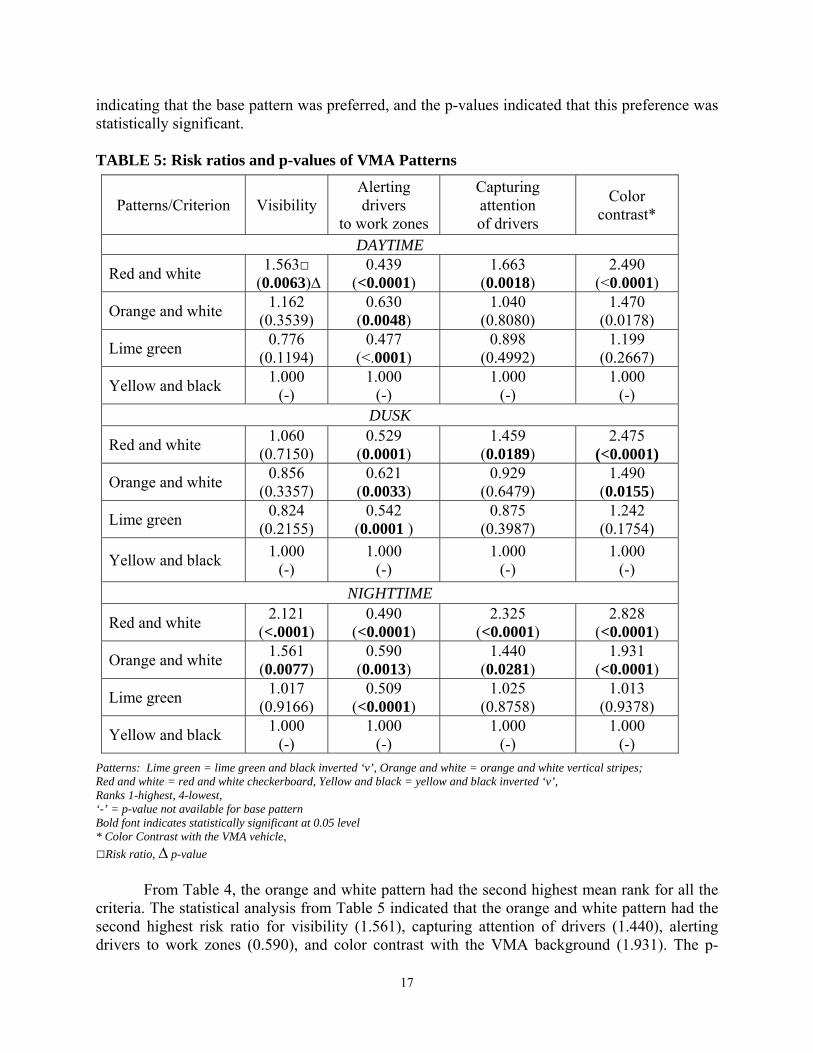
It can be observed from Table 2 that the mean LCDs for the four markings were very similar. No significant difference between the mean LCDs for the four markings was observed. Subjective Evaluation The participant’s preferences indicated by mean ranks of the markings based on the four criteria are presented in Table 4. To statistically test these preferences, statistical analysis was carried out with the yellow and black pattern as the base pattern. The yellow and black pattern was used because it is the most widely used pattern in work zones especially in Missouri. Table 5 presents the results of the statistical analysis. The risk ratio indicated the participants’ preferences of the markings when compared to the yellow and black pattern. The risk ratio for the yellow and black pattern equaled 1.0. The markings with values more than 1.0 were preferred over the yellow and

15
black pattern. Conversely, the markings with risk ratios below 1.0 were less preferred than the yellow and black pattern. Daytime conditions From the mean ranks in Table 4, the participants ranked the red and white checkerboard pattern to be more visible (2.14), captured the attention of drivers (2.09), and contrasted better with the VMA vehicle (1.96) in comparison to the other markings. For the alerting drivers to work zones criterion, the yellow and black pattern had the lowest mean rank (1.98), which indicated that participants found it highly effective. The red and white checkerboard pattern had the highest mean rank (2.87), ranking it as the least effective in alerting drivers to work zones. The risk ratios from the statistical analysis reported in Table 5 shows the odds of selecting a given VMA pattern as the preferred pattern over the yellow and black base pattern. For example, the risk ratio of 1.563 for the red and white pattern in the visibility column indicates that the odds of the participants selecting the red and white checkerboard pattern as the best was 56.3% higher than the selection odds for the base pattern. Clearly the red and white pattern was preferred over other patterns for visibility (risk ratios of 1.563 compared to 1.162, 0.776, and 1.0), capturing the attention (risk ratios of 1.663 compared to 1.040, 0.898, and 1.0), and contrast with the VMA vehicle background (risk ratios of 2.490 compared to 1.470, 1.199, and 1.0). All of these results were statistically significant based on the p-values provided in Table 5. For the alerting the drivers to the work zones criterion, none of the patterns had a risk ratio indicating preference over the yellow and black pattern. The orange and white pattern had a risk ratio of 0.630 while the red and white pattern had a risk ratio of 0.439. Both ratios were less than one depicting that the base pattern was preferred, and the p-values indicated that this preference was statistically significant. The orange and white pattern had the second highest risk ratio for all criteria but it was only statistically significant for the alerting drivers to work zones criterion. Participants showed the least preference for the yellow and black pattern under the color contrast (with the VMA background) criterion. Dusk conditions From Table 4, it can be observed that the red and white checkerboard pattern was more visible (2.36), captured more attention of drivers (2.15), and contrasted better with the VMA vehicle (1.97) in comparison to the other patterns. The risk ratios from the statistical analysis reported in Table 5 showed that the red and white pattern was preferred over other patterns in capturing the attention of drivers (risk ratios of 1.459 compared to 0.929, 0.875 and 1.0) and color contrast (risk ratios of 2.475 compared to 1.490, 1.242 and 1.0). All of these results were statistically significant based on the p-values reported in Table 5. The risk ratio of 1.459 for the red and white pattern in capturing attention of drivers indicated that the odds of the participants selecting the red and white checkerboard pattern as the best was 45.9% higher than the selection odds for the base pattern. Similarly, the risk ratio of 2.475 for the red and white pattern for the color contrast criterion indicated that the odds of the participants selecting the red and white checkerboard pattern as the best was 147.5% higher than the selection odds for the base pattern. For the alerting drivers to work zones criterion, none of the patterns had a risk ratio that indicated that they were preferred over the yellow and black pattern. The orange and white pattern had a risk ratio of 0.621, while the red and white pattern had a risk ratio of 0.529. Both ratios were less than one depicting that the base pattern was preferred, and the p-values indicated that this preference was statistically significant. The orange and white pattern had the second highest risk

16
ratio for the criteria of alerting drivers to work zones (0.621) and color contrast (1.490) and the p-values indicated that this preference was statistically significant. Participants showed the least preference for the yellow and black pattern under the color contrast criterion. TABLE 4: Mean Subjective Rank
Patterns: Lime green = lime green and black inverted ‘v’, Orange and white = orange and white vertical stripes, Red and white = red and white checkerboard, Yellow and black = yellow and black inverted ‘v’, Ranks 1-highest, 4-lowest, Bold: Lowest mean value for the column, Underlined: Highest mean value for the column * Color Contrast with the VMA vehicle
Nighttime conditions Similar to the daytime and dusk conditions, from Table 4, the red and white checkerboard pattern was more visible, captured more attention of drivers, and contrasted better with the VMA background in comparison to the other patterns. The yellow and black pattern again had the lowest mean rank for alerting drivers to work zones and the red and white pattern had the highest mean rank. The risk ratios from the statistical analysis in Table 5 showed that the red and white pattern was preferred over the other patterns for visibility (risk ratios of 2.121 compared to 1.561, 1.017 and 1.0), capturing the attention of drivers (risk ratios of 2.325 compared to 1.440, 1.025 and 1.0) and color contrast (risk ratios of 2.828 compared to 1.931, 1.013 and 1.0). All of these data were statistically significant based on the p-values reported in Table 5. For the alerting drivers to work zones criterion, none of the patterns had a risk ratio that indicated that they were preferred over the yellow and black pattern. The orange and white pattern had a risk ratio of 0.590, while the red and white pattern had a risk ratio of 0.490. Both ratios were less than one
Patterns/Criterion Visibility Alerting drivers
to work zones
Capturing attention of drivers
Color contrast*
DAYTIME Red and white 2.14 2.87 2.09 1.96 Orange and white 2.46 2.46 2.58 2.51 Lime green 2.79 2.69 2.67 2.63 Yellow and black 2.61 1.98 2.66 2.9
DUSK
Red and white 2.36 2.68 2.15 1.97 Orange and white 2.53 2.52 2.61 2.49
Lime green 2.59 2.7 2.63 2.64
Yellow and black 2.52 2.1 2.62 2.9
NIGHTTIME
Red and white 2.08 2.76 1.98 1.92 Orange and white 2.34 2.53 2.46 2.32
Lime green 2.75 2.68 2.74 2.87
Yellow and black 2.82 2.02 2.82 2.9
17
indicating that the base pattern was preferred, and the p-values indicated that this preference was statistically significant. TABLE 5: Risk ratios and p-values of VMA Patterns
Patterns: Lime green = lime green and black inverted ‘v’, Orange and white = orange and white vertical stripes; Red and white = red and white checkerboard, Yellow and black = yellow and black inverted ‘v’, Ranks 1-highest, 4-lowest, ‘-’ = p-value not available for base pattern Bold font indicates statistically significant at 0.05 level * Color Contrast with the VMA vehicle,
□Risk ratio, ∆ p-value
From Table 4, the orange and white pattern had the second highest mean rank for all the criteria. The statistical analysis from Table 5 indicated that the orange and white pattern had the second highest risk ratio for visibility (1.561), capturing attention of drivers (1.440), alerting drivers to work zones (0.590), and color contrast with the VMA background (1.931). The p-
Patterns/Criterion Visibility Alerting drivers
to work zones
Capturing attention of drivers
Color contrast*
DAYTIME
Red and white 1.563□
(0.0063)∆ 0.439
(<0.0001) 1.663
(0.0018) 2.490
(<0.0001)
Orange and white 1.162
(0.3539) 0.630
(0.0048) 1.040
(0.8080) 1.470
(0.0178)
Lime green 0.776
(0.1194) 0.477
(<.0001) 0.898
(0.4992) 1.199
(0.2667)
Yellow and black 1.000
(-) 1.000
(-) 1.000
(-) 1.000
(-) DUSK
Red and white 1.060
(0.7150) 0.529
(0.0001) 1.459
(0.0189) 2.475
(<0.0001)
Orange and white 0.856
(0.3357) 0.621
(0.0033) 0.929
(0.6479) 1.490
(0.0155)
Lime green 0.824
(0.2155) 0.542
(0.0001 ) 0.875
(0.3987) 1.242
(0.1754)
Yellow and black 1.000
(-) 1.000
(-) 1.000
(-) 1.000
(-)
NIGHTTIME
Red and white 2.121
(<.0001) 0.490
(<0.0001) 2.325
(<0.0001) 2.828
(<0.0001)
Orange and white 1.561
(0.0077) 0.590
(0.0013) 1.440
(0.0281) 1.931
(<0.0001)
Lime green 1.017
(0.9166) 0.509
(<0.0001) 1.025
(0.8758) 1.013
(0.9378)
Yellow and black 1.000
(-) 1.000
(-) 1.000
(-) 1.000
(-)

18
values indicated that this preference was statistically significant. Participants showed the least preference for the yellow and black pattern under the criteria of color contrast with the VMA background, visibility and capturing the attention. The subjective evaluation indicated that the yellow and black inverted ‘V’ pattern was most preferred by the participants for alerting drivers to work zones, perhaps because it is the pattern most commonly used in work zones. The yellow and black pattern and the orange and white pattern, which was consistently ranked second behind the yellow and black pattern, are the colors commonly used in work zones in Missouri. The red and white checkerboard pattern was ranked the least effective probably because drivers have seldom been exposed to this pattern in work zones in Missouri. In a recent meeting, a MoDOT official explained that the red and white checkerboard pattern will be implemented in work zones even though it ranks low in this criterion, and the results are expected to improve as drivers become familiar with the pattern. TABLE 6: Mean ranks for features of the patterns
Features\Patterns Red and
white Orange
and whiteLime green
Yellow and black
Pattern Design 2.19 2.18 1.89 1.90 Color Combination 2.00 1.86 2.14 1.90 Color Contrast* 1.82 1.96 1.97 2.21
Patterns: Lime green = lime green and black inverted ‘v’, Orange and white = orange and white vertical stripes, Red and white = red and white checkerboard, Yellow and black = yellow and black inverted ‘v’, Ranks 1-highest, 3-lowest, Bold: Lowest mean value for the column, Underlined: Highest mean value for the column *Color Contrast between different colors of the pattern
To evaluate the overall driver perceptions about the patterns, the color contrast and their combination, the participants were surveyed on the features of each pattern and their preferences about the markings in general. Table 6 presents the results of the survey. Color combination was the most liked feature for the orange and white vertical striped pattern, while color contrast was the most liked for the red and white checkerboard pattern. Color contrast for the yellow and black inverted ‘V’ pattern was the least liked feature. Pattern design was the most liked feature for the lime green and black pattern, while it was the least liked feature for the orange and white pattern and the red and white checkerboard pattern. Note that the mean ranks in Table 6 represent general rankings of the features, not specific to any particular time of the day.
When the subjects were surveyed for the most effective VMA pattern overall, out of the 120 participants surveyed, 40 drivers (33.3%) preferred the red and white checkerboard pattern, 30 (25%) preferred the lime green and black inverted ‘V’ pattern, 29 (24.17%) preferred the yellow and black inverted ‘V’ pattern, and 21 (17.8%) preferred the orange and white vertical striped pattern. Thus, the preference of the red and white checkerboard pattern by most of the participants in this evaluation is consistent with the other subjective evaluation data provided in Table 4 and discussed above. The post-experiment survey in conjunction with the driving simulator study as described revealed interesting results. In initial discussion with MoDOT before the driving simulator study, it was conjectured that the inverted ‘V’ design would provide the direction of lane change and suggest the driver to move out of the closed lane. It was further conjectured that the checkerboard pattern would indicate that the lane is closed without indicating the direction of lane change. When the subjects were surveyed regarding the information provided by the inverted ‘V’ pattern, 98 (81.7%) subjects did not perceive that the inverted ‘V’ design signifies

19
the direction of lane change , 1 (.001%) subject perceived the pattern signifies lane change to the left and 21 (17.5%) perceived that it signifies lane change in either left or right directions. Regarding the checkerboard pattern, 65 (54.2%) subjects stated that it indicates reduction in speed, 29 (24.2%) stated that it indicates coming to a stop, and 26 (21.7%) stated that it does not signify any message. CONCLUSIONS The report presents the results of a study carried out using a driving simulator to evaluate the driver perception of four markings with different striping patterns and color combinations for VMAs used in work zones during daytime, dusk and nighttime for drivers of age 18 and above. The study evaluated the VMA markings using both objective and subjective criteria. The objective evaluation used LCD as the criterion and the variables: gender, age group, time-of-day and pattern. When tested during the daytime for the mean LCDs, the red and white checkerboard pattern and the orange and white vertical striped pattern were found to be more effective compared to the two other patterns evaluated. For the dusk condition, the test indicated that the yellow and black inverted ‘V’ pattern was significantly less effective than the other three patterns. The mean LCD of the red and white checkerboard pattern was the largest; however, the differences between the LCD of this pattern and the LCDs of the orange and white vertical striped pattern and of the lime green and black inverted ‘V’ pattern were not statistically significant. For the nighttime condition, no significant differences in the mean LCDs of the patterns were observed. The KS test results were fairly consistent with these results based on LCD frequency distributions of the patterns.
In terms of subjective evaluation, the data for daytime, dusk and nighttime conditions indicated that the participants’ preferred the red and white checkerboard pattern over the other three patterns for the criteria of visibility, capturing attention of drivers, and color contrast with the VMA background. The participants preferred the yellow and black inverted ‘V’ pattern over other patterns in alerting drivers to work zones, a criterion for which they ranked the red and white checkerboard pattern lowest. This response might be attributed to the fact that the red and white checkerboard pattern is not commonly used in work zones compared to the yellow and black pattern. When surveyed in terms of overall effectiveness among the various markings, the red and white checkerboard pattern was regarded as the most preferred pattern.
From the overall objective and subjective results, it can be inferred that the red and white checkerboard pattern is the most effective pattern for use on VMAs in work zones. VMA patterns should also be evaluated based on differences in heights, flashing patterns of arrows and beacons, and their use in different work zone configurations. It is also suggested that the findings of this study be further investigated in other states before recommendations are made to the Federal Highway Administration to update the guidelines for VMA markings.
RECOMMENDATIONS Based on the results of this study, we recommend the following:
1. The authors recommend the use of red and white checkerboard marking with the VMA. Presently, the drivers are not used to the red and white color combination in the work zones. With regular use of the red and white checkerboard marking, it is expected to increase the rating of alerting the drivers to work zones.

20
2. The present day VMA consists of a pattern which is retro-reflective. Retro reflectivity enhances the visibility at nighttime conditions. Thus, the VMA markings which are retro reflective should be field tested in nighttime conditions.
3. It is also suggested that the findings of this study are further investigated in other states before recommendations are made to update the guidelines for VMA markings.
4. VMA patterns should be evaluated for different heights as their current heights are very similar to the height of cones, which usually make up the taper area and cross the line of sight of drivers.
5. The visibility of VMAs should be studied for different flashing patterns of strobes, rotating beacons, retro-reflective tapes, different intensities of strobe lights to improve the visibility of VMAs during nighttimes, and for different work zone configurations.
6. The VMA patterns should also be evaluated for color deficient drivers.
21
REFERENCES
1. Allison, P.D. and Christakis, N.A., 1994. Logit Models for Sets of Ranked Items. In
Sociological Methodology, ed. P.V. Marsden, Oxford: Basil Blackwell, pp. 199-228. 2. American Association of State Highway and Transportation Officials, 2002. Roadside
Design Guide. 3. Atchley, P., 2006. The effect of fluorescent yellow-green background for vehicle-mounted
work zone signs on attention and eye movements. FHWA Report, http://www.ctre.iastate.edu/smartwz/reports/2006_atchley_fygborder.pdf.
4. Bham, G.H., Leu, M.C., Mathur, D.R., and Javvadi B.S., 2009. Evaluation of Vehicle Mounted Attenuator (VMA) Markings Using a Driving Simulator for Work Zones. Paper No. 09-3795, CD-ROM, 88th Annual Conference of the Transportation Research Board, Washington, D.C.
5. Hawkins, H.G.Jr., Carlson, P.J., and Elmquist, M., 2000. Evaluation of fluorescent Orange signs. Texas Transportation Institute, Report No.TX-00/2962-S, 2000.
6. Humphreys, J.B. and Sullivan, T.D., 1991. Guidelines for the Use of Truck-Mounted Attenuators in Work Zones. Transportation Research Record No. 1304, Washington, DC, pp. 292-302.
7. Kamyab, A., and Storm B., 2001. FYG backing for work zone signs. FHWA Pooled Fund Study, Report.
8. Kramer, C.Y., 1956. Extension of Multiple Range Tests to Group Means with Unequal Sample Sizes. Biometrics, 12, pp. 307-310.
9. Mackay, R.G., and John L.P., 1995. Experience with Truck Mounted Attenuators. Public works, 1995, Vol. 126, No. 11, pp. 44.
10. Manual on Uniform Traffic Control Devices for Streets and Highways, 2003. U.S. Department of Transportation, Federal Highway Administration, Washington D.C.
11. National Work Zone Safety Information Clearinghouse (NWZSIC), 2010, http://www.workzonesafety.org/crash_data/workzone_fatalities.
12. SAS/STAT 9.2 User’s Guide (2008). SAS Institute Inc. 13. Smith, J., Edwards, R., O’Neil, S., and Goluchowski, M., 2006. Best practice for use and
design of truck mounted attenuators (TMA) for New Zealand roads. Land Transport New Zealand Research Report 301, pp. 100.
14. Steele, D.A., and Vavrik, W.R., 2009. Improving the Safety of Moving Lane Closures. Illinois Center for Transportation, ICT-R37-32.
15. Wang, Y., Zhang, E.D., Zhang, W., Leu, M.C., and Zeng, H., 2006. Development of a Low-Cost Driving Simulation System for Safety Study and Training. Driving Simulation Conference Asia/Pacific 2006, Tsukuba, JAPAN, May 31-June 2.

22
APPENDIX A: Screening Questionnaire General & Health Information
Please complete the questionnaire by circling the answers where applicable
1. Do you have a valid driver’s license? a) Yes b) No
2. Which type of driver’s license do you have? a) International b) US c) None
3 Have you been involved in any accident(s) within the past 3 years? a) Yes b) No 4. If yes, please state the number of crash(s) involved in and the type. _________________________________________________________________ _________________________________________________________________
5. Do you have a history of radial keratotomy, [laser] eye surgery, or any other ophthalmic surgeries? a) Yes b) No If yes, which ones? _____________________________________
6. Do you need to wear glasses or contact lenses while driving? a) Yes b) No
7. Are you night blind? a) Yes b) No
8. Are you color blind? a) Yes b) No
9. Do you have any health problems that affect your driving? a) Yes b) No If yes, please state _________________________________________
10. Does driving through work zones increase your stress? a) Yes b) No
11. Do you experience any inner ear, dizziness, vertigo, or balance problems while driving? a) Yes b) No
12. Do you have a history of motion sickness? a) Yes b) No
13. Do you have a history of claustrophobia? a) Yes b) No
14. Are you suffering from any lingering effects of stroke, tumor, head trauma, or infection? a) Yes b) No
15. Do you or have you ever suffered from epileptic seizures? a) Yes b) No
16. Do you have a history of migraines? a) Yes b) No
17. Do you have any problems while driving during night time? a) Yes b) No
Note: Pregnant women are not allowed to participate because of federal regulations since the risk to pregnant women and unborn children is not known.
23
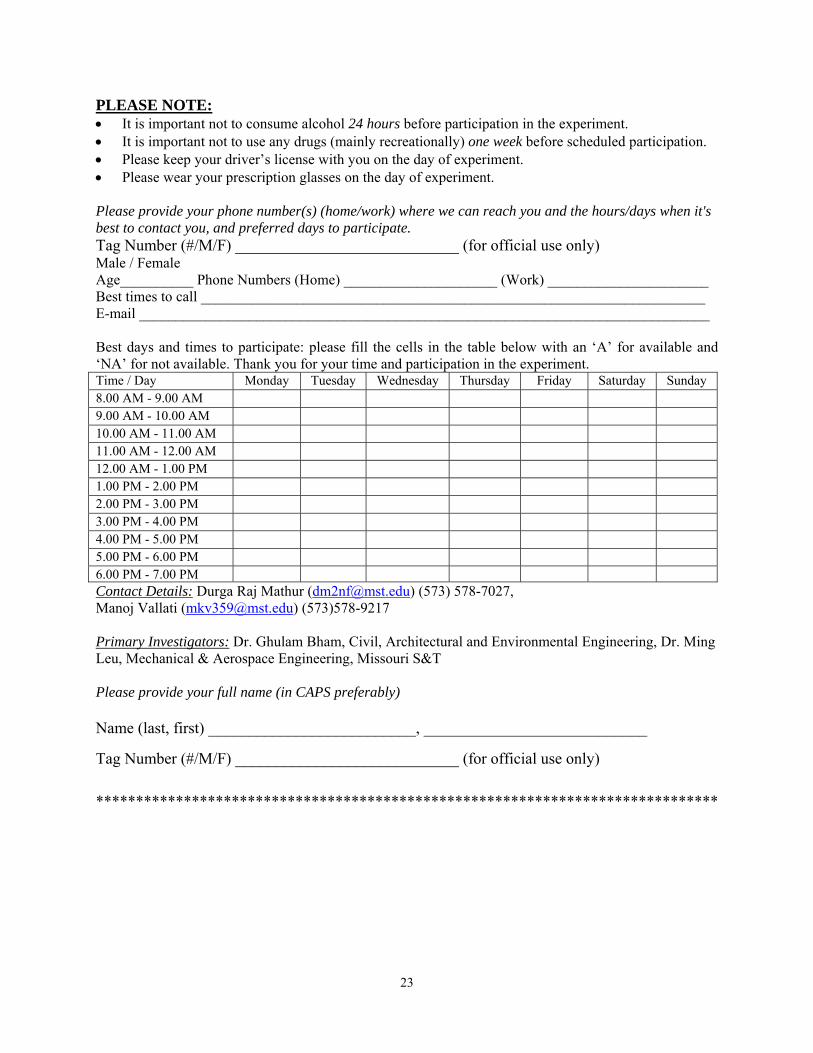
PLEASE NOTE: It is important not to consume alcohol 24 hours before participation in the experiment. It is important not to use any drugs (mainly recreationally) one week before scheduled participation. Please keep your driver’s license with you on the day of experiment. Please wear your prescription glasses on the day of experiment. Please provide your phone number(s) (home/work) where we can reach you and the hours/days when it's best to contact you, and preferred days to participate. Tag Number (#/M/F) ____________________________ (for official use only) Male / Female Age__________ Phone Numbers (Home) _____________________ (Work) ______________________ Best times to call _____________________________________________________________________ E-mail ______________________________________________________________________________ Best days and times to participate: please fill the cells in the table below with an ‘A’ for available and ‘NA’ for not available. Thank you for your time and participation in the experiment. Time / Day Monday Tuesday Wednesday Thursday Friday Saturday Sunday 8.00 AM - 9.00 AM 9.00 AM - 10.00 AM 10.00 AM - 11.00 AM 11.00 AM - 12.00 AM 12.00 AM - 1.00 PM 1.00 PM - 2.00 PM 2.00 PM - 3.00 PM 3.00 PM - 4.00 PM 4.00 PM - 5.00 PM 5.00 PM - 6.00 PM 6.00 PM - 7.00 PM Contact Details: Durga Raj Mathur ([email protected]) (573) 578-7027, Manoj Vallati ([email protected]) (573)578-9217 Primary Investigators: Dr. Ghulam Bham, Civil, Architectural and Environmental Engineering, Dr. Ming Leu, Mechanical & Aerospace Engineering, Missouri S&T Please provide your full name (in CAPS preferably)
Name (last, first) __________________________, ____________________________
Tag Number (#/M/F) ____________________________ (for official use only)
******************************************************************************

24
APPENDIX B: Pre-Driving Questionnaire
1) Did you drink alcohol during the last 24 hours?
Yes No 2) Did you have recreational drugs during the last one week?
Yes No 3) Have you participated in any previous experiment in the Driving Simulator?
Yes No 4) How often do you drive?
Daily Once a week Occasionally 5) For how long have you been driving?
Less than 1yr Between 5-15 yrs Between 1-5 yrs More than 15 yrs
6) During which time of the day do you usually drive? (Mark all those applicable) Dawn Night Dusk Day
7) Have you ever come across a VMA (Vehicle mounted attenuator) as shown below in a work zone?
Yes No
8) Do you drive frequently on Interstate Highways?
Yes No 9) What type of vehicle do you drive most often (check one)?
Motorcycle Passenger Car Pick-Up Truck Sport utility vehicle Van or Minivan Other: ________________
Note: Pregnant women are not allowed to participate because of federal regulations since the risk to pregnant women and unborn children is not known.
FOR OFFICIAL USE Subject Accepted for study __________________ Subject Rejected for study___________________
25
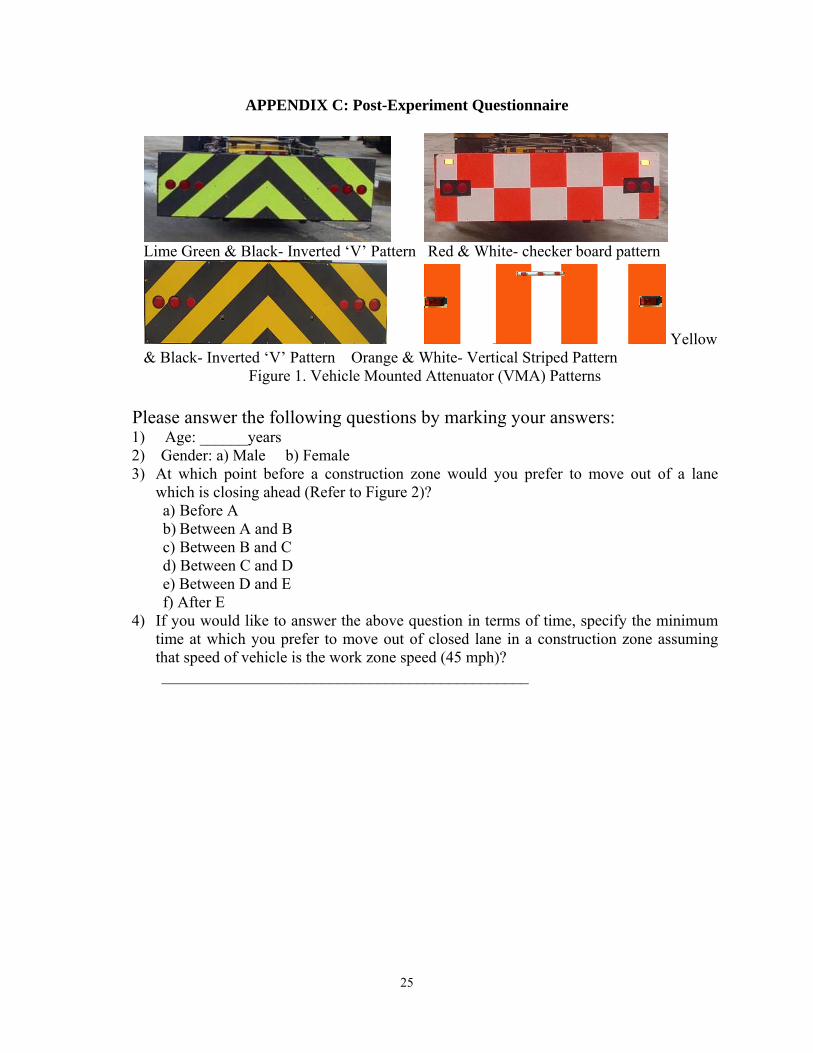
APPENDIX C: Post-Experiment Questionnaire
Lime Green & Black- Inverted ‘V’ Pattern Red & White- checker board pattern
Yellow & Black- Inverted ‘V’ Pattern Orange & White- Vertical Striped Pattern
Figure 1. Vehicle Mounted Attenuator (VMA) Patterns Please answer the following questions by marking your answers: 1) Age: ______years 2) Gender: a) Male b) Female 3) At which point before a construction zone would you prefer to move out of a lane
which is closing ahead (Refer to Figure 2)? a) Before A b) Between A and B c) Between B and C d) Between C and D e) Between D and E f) After E
4) If you would like to answer the above question in terms of time, specify the minimum time at which you prefer to move out of closed lane in a construction zone assuming that speed of vehicle is the work zone speed (45 mph)?
______________________________________________

26
Figure 2. Work Zone Configuration
5) During the experiment, did you change lane(s) because you noticed a particular VMA
pattern (as presented in Figure 1)? a) Yes b) No

27
Rank your answers to the following questions from 1 to 4: (1-very poor, 2-poor, 3-average, 4-good, 5-excellent)
Daytime
6) Rank the following VMA patterns based on their visibility (detection distance) to you: Rank (1 to 4)
Pattern
Inverted ‘V’ (Lime Green
& Black)
Checker board (Red & White)
Inverted ‘V’ (Yellow &
Black)
Vertical Striped
(Orange & White)
7) Rank the following VMA patterns based on their ability to capture your attention:
Rank (1 to 4)
Pattern Inverted ‘V’ (Lime Green
& Black)
Checker board (Red & White)
Inverted ‘V’ (Yellow &
Black)
Vertical Striped
(Orange & White)
8) Rank the following color combinations based on their effectiveness in recognizing the construction zone:
Rank
(1 to 4)
Pattern
Lime Green & Black
Red & White Yellow & Black
Orange & White
9) Rank VMA design patterns based on the color contrast with the vehicle background:
Rank (1 to 4)
Pattern Lime Green
& Black Red & White Yellow &
Black Orange &
White

28
Dusk time
10) Rank the following VMA patterns based on their visibility (detection distance) to you: Rank (1 to 4)
Pattern
Inverted ‘V’ (Lime Green
& Black)
Checker board (Red & White)
Inverted ‘V’ (Yellow &
Black)
Vertical Striped
(Orange & White)
11) Rank the following VMA patterns based on their ability to capture your attention:
Rank (1 to 4)
Pattern
Inverted ‘V’ (Lime Green
& Black)
Checker board (Red & White)
Inverted ‘V’ (Yellow &
Black)
Vertical Striped (Orange &
White)
12) Rank the following color combinations based on their effectiveness in
recognizing the construction zone: Rank (1 to 4)
Pattern
Lime Green & Black
Red & White Yellow & Black
Orange & White
13) Rank VMA design patterns based on the color contrast with the vehicle background:
Rank
(1 to 4)
Color Lime Green Red Yellow Orange

29
Nighttime
14) Rank the following VMA patterns based on their visibility (detection distance) to you: Rank (1 to 4)
Pattern
Inverted ‘V’ (Lime Green
& Black)
Checker board (Red & White)
Inverted ‘V’ (Yellow &
Black)
Vertical Striped (Orange &
White)
15) Rank the following VMA patterns based on their ability to capture your attention:
Rank (1 to 4)
Pattern Inverted ‘V’ (Lime Green
& Black)
Checker board (Red & White)
Inverted ‘V’ (Yellow &
Black)
Vertical Striped
(Orange & White)
16) Rank the following color combinations based on their effectiveness in
recognizing the construction zone: Rank (1 to 4)
Pattern
Lime Green & Black
Red & White Yellow & Black
Orange & White
17) Rank VMA design patterns based on the color contrast with the vehicle background:
18) What message did you get from the checkered board design when you first noticed it? a) Stop b) Reduce the vehicle speed c) None d) Other please specify________________________________________
Rank (1 to 4) Color Lime Green Red Yellow Orange

30
19) Does the inverted “V” pattern indicate the direction of lane change? a) Yes b) No
20) If yes, which direction do you think it specifies? a) Right
b) Left c) Both
21) What did you like most about the following patterns? Please explain. i. Inverted ‘V’ (Lime Green & Black)
Rank (1 to 3)
Feature Pattern Design Color Combination
Color Contrast
Others, please specify______________________________________________
ii. Checkered board (Red & White) Rank (1 to 3)
Feature
Pattern Design Color Combination
Color Contrast
Others, please specify______________________________________________
iii. Inverted ‘V’ (Yellow & Black) Rank (1 to 3)
Feature
Pattern Design Color Combination
Color Contrast
Others, please specify______________________________________________
iv. Vertical Striped (Orange & White) Rank (1 to 3)
Feature
Pattern Design Color Combination
Color Contrast
Others, please specify______________________________________________ 22) Which of the following four VMA patterns do you prefer the most?
a) Inverted ‘V’ (Lime Green & Black) b) Checker board (Red & White) c) Inverted ‘V’ (Yellow & Black) d) Vertical Striped (Orange &White) Please, specify reasons________________________________________________ _________________________________________________________________
23) If you have any comments or suggestions, please mention below.
_________________________________________________________________ _________________________________________________________________ _________________________________________________________________