a fit of the vapours - sump4.com · ... and boiling point determination ... data for the solid and...
TRANSCRIPT

Thermochimica Acta 622 (2015) 44–50
A fit of the vapours$
Duncan M. Price *Edwards Ltd., Kenn Road, Clevedon, N. Somerset BS21 6TH, UK
A R T I C L E I N F O
Article history:Received 27 January 2015Received in revised form 17 April 2015Accepted 28 April 2015Available online 1 May 2015
Keywords:EvaporationLangmuir equationSublimationThermogravimetryVapour pressure
A B S T R A C T
The vapour pressures of materials and the enthalpy changes associated with their sublimation andevaporation are often necessary parameters for many processes. This paper reviews the origins anddevelopment of a method for determining these properties using a conventional thermobalance andsample holders with a modified form of the Langmuir equation. Alternative approaches for datatreatment are discussed, many of which promise to derive the vapour pressure of a material directlyrather than by calibration with reference materials. The applications of non-linear rising temperatureprograms are considered and a protocol for correction of volatilisation rate to take into account thediffusion-limited transfer of material through the stagnant boundary layer above the sample is proposed.
ã 2015 Elsevier B.V. All rights reserved.
Contents lists available at ScienceDirect
Thermochimica Acta
journal homepa ge: www.elsev ier .com/locate / tca
1. Introduction
In 1997, Michael Hawkins and I gave a poster presentation at theannual UK Thermal Analysis Conference held at Oxford Universitydeceptively entitled “Calorimetry of two disperse dyes usingthermogravimetry.” We described a protocol for determining thevapour pressure of substances using a conventional thermobalanceunder an ambient pressure inert atmosphere. This work waspublished in Thermochimica Acta [1] and subsequently adopted,improved upon or criticised by many investigators. This specialedition of the same journal affords an opportunity for me topresent a personal perspective on the subject and its subsequentdevelopment.
The tendency for a substance in the condensed phase (i.e. solidor liquid) to enter the gas phase is described by its vapour pressure.This property is important in a wide variety of applications rangingfrom plant protection to perfumery. In many cases, the volatility ofa substance may be an undesirable facet of its behaviour, especiallyfor processes that take place at elevated temperature, resulting inloss of material via atmospheric dispersal [2,3]. Alternatively, thetransport of volatile materials might be adventitious for transferfrom the point of application to the point of action [4–6]. It is inthese contexts that a study of the sublimation and evaporationbehaviour of several dyes and UV absorbers was carried out inorder to support their suitability for use in a process for producinglight-fast coloured polyester films. The aim of this work was to use
$ Presented at TAC 2014, Ware, UK, 1–2 April 2014.* Corresponding author. Tel.: +44 1275 337167.E-mail address: [email protected] (D.M. Price).
http://dx.doi.org/10.1016/j.tca.2015.04.0300040-6031/ã 2015 Elsevier B.V. All rights reserved.
molecular modelling to estimate physical properties from chemi-cal structure and rank potential candidates based upon, forexample, estimated solubility in the matrix, diffusion coefficients,volatility, etc. It was hoped that computational methods wouldcircumvent the need to do laborious screening experiments andthat it would be possible to select promising additives just byconsulting a catalogue. As a check on this methodology,thermogravimetry was carried out on a series of compounds inorder to determine their volatility.
A survey of the literature disclosed several methods for vapourpressure measurement, ranging from direct determination using amanometer [7], monitoring the gas phase concentration of thevolatile species (by, for example, spectrometry [8,9]), measure-ment of sample volatilisation by vacuum-effusion (Knudsen cell[10,11]) or transpiration techniques [12,13] and boiling pointdetermination under controlled pressure [14,15]. Of particularinterest was a series of papers by Gückel et al. who measured thevolatilisation rates of pesticides at ambient pressure by isothermalthermogravimetry [16–19]. Their initial studies employed athermostatically-housed balance purged with a pre-heated airstream from which they established a double logarithmicrelationship between the rate of amount of substance lost perunit area (expressed as mol h�1 cm�2) and the material’s vapourpressure [16]. For the same gas flow rate, the calibration factorsdepended on measuring temperature [18]. Later work extendedthe temperature range by using a thermobalance which correlatedthe mass loss rate per unit area (g h�1 cm�2) with the vapourpressure over a wide temperature range to derive a similar log–logrelationship [19]. A further refinement incorporated a form ofevolved gas analysis whereby the exhaust from the thermobalancewas passed through a trap and subsequently examined to
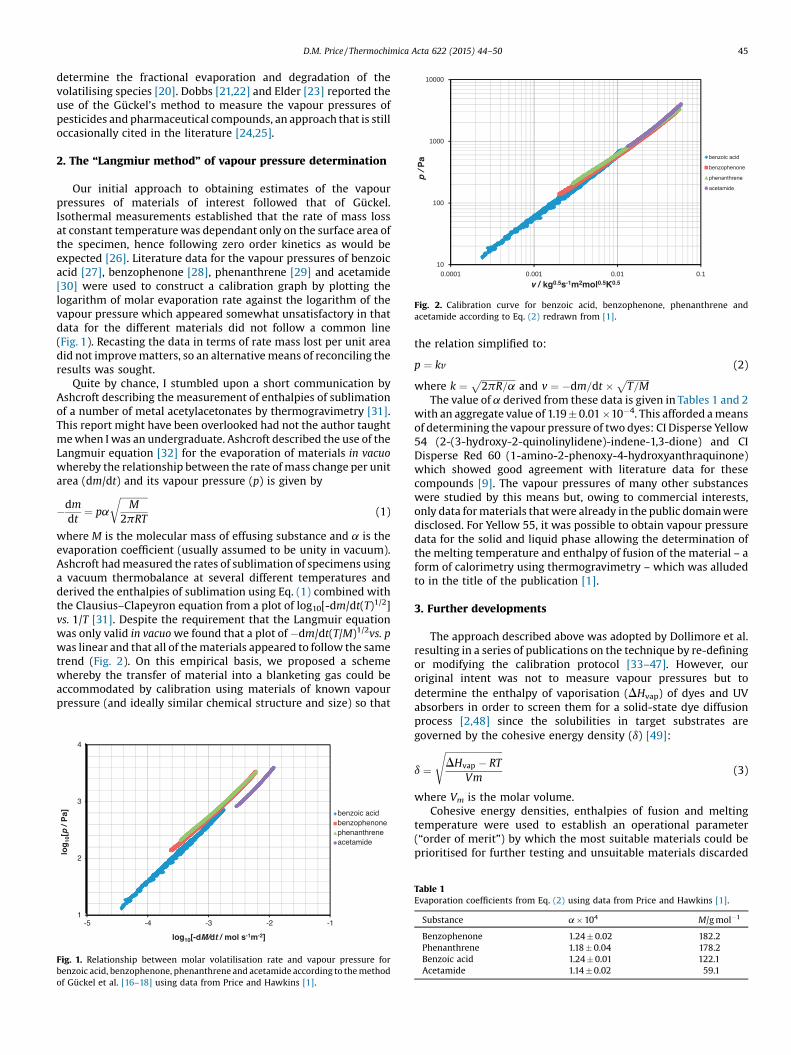
Fig. 2. Calibration curve for benzoic acid, benzophenone, phenanthrene andacetamide according to Eq. (2) redrawn from [1].
D.M. Price / Thermochimica Acta 622 (2015) 44–50 45
determine the fractional evaporation and degradation of thevolatilising species [20]. Dobbs [21,22] and Elder [23] reported theuse of the Gückel’s method to measure the vapour pressures ofpesticides and pharmaceutical compounds, an approach that is stilloccasionally cited in the literature [24,25].
2. The “Langmiur method” of vapour pressure determination
Our initial approach to obtaining estimates of the vapourpressures of materials of interest followed that of Gückel.Isothermal measurements established that the rate of mass lossat constant temperature was dependant only on the surface area ofthe specimen, hence following zero order kinetics as would beexpected [26]. Literature data for the vapour pressures of benzoicacid [27], benzophenone [28], phenanthrene [29] and acetamide[30] were used to construct a calibration graph by plotting thelogarithm of molar evaporation rate against the logarithm of thevapour pressure which appeared somewhat unsatisfactory in thatdata for the different materials did not follow a common line(Fig. 1). Recasting the data in terms of rate mass lost per unit areadid not improve matters, so an alternative means of reconciling theresults was sought.
Quite by chance, I stumbled upon a short communication byAshcroft describing the measurement of enthalpies of sublimationof a number of metal acetylacetonates by thermogravimetry [31].This report might have been overlooked had not the author taughtme when I was an undergraduate. Ashcroft described the use of theLangmuir equation [32] for the evaporation of materials in vacuowhereby the relationship between the rate of mass change per unitarea (dm/dt) and its vapour pressure (p) is given by
�dmdt
¼ pa
ffiffiffiffiffiffiffiffiffiffiffiffiM
2pRT
r(1)
where M is the molecular mass of effusing substance and a is theevaporation coefficient (usually assumed to be unity in vacuum).Ashcroft had measured the rates of sublimation of specimens usinga vacuum thermobalance at several different temperatures andderived the enthalpies of sublimation using Eq. (1) combined withthe Clausius–Clapeyron equation from a plot of log10[-dm/dt(T)1/2]vs. 1/T [31]. Despite the requirement that the Langmuir equationwas only valid in vacuo we found that a plot of �dm/dt(T/M)1/2vs. pwas linear and that all of the materials appeared to follow the sametrend (Fig. 2). On this empirical basis, we proposed a schemewhereby the transfer of material into a blanketing gas could beaccommodated by calibration using materials of known vapourpressure (and ideally similar chemical structure and size) so that
1
2
3
4
-1-2-3-4-5
log
10[p
/ P
a]
log10[-dM/dt / mo l s-1m-2]
benzoic acidbenzophenonephenanthreneacetamide
Fig. 1. Relationship between molar volatilisation rate and vapour pressure forbenzoic acid, benzophenone, phenanthrene and acetamide according to the methodof Gückel et al. [16–18] using data from Price and Hawkins [1].
the relation simplified to:
p ¼ kv (2)
where k ¼ ffiffiffiffiffiffiffiffiffiffiffiffiffiffiffi2pR=a
pand v ¼ �dm=dt � ffiffiffiffiffiffiffiffiffiffi
T=Mp
The value of a derived from these data is given in Tables 1 and 2with an aggregate value of 1.19 � 0.01 �10�4. This afforded a meansof determining the vapour pressure of two dyes: CI Disperse Yellow54 (2-(3-hydroxy-2-quinolinylidene)-indene-1,3-dione) and CIDisperse Red 60 (1-amino-2-phenoxy-4-hydroxyanthraquinone)which showed good agreement with literature data for thesecompounds [9]. The vapour pressures of many other substanceswere studied by this means but, owing to commercial interests,only data for materials that were already in the public domain weredisclosed. For Yellow 55, it was possible to obtain vapour pressuredata for the solid and liquid phase allowing the determination ofthe melting temperature and enthalpy of fusion of the material – aform of calorimetry using thermogravimetry – which was alludedto in the title of the publication [1].
3. Further developments
The approach described above was adopted by Dollimore et al.resulting in a series of publications on the technique by re-definingor modifying the calibration protocol [33–47]. However, ouroriginal intent was not to measure vapour pressures but todetermine the enthalpy of vaporisation (DHvap) of dyes and UVabsorbers in order to screen them for a solid-state dye diffusionprocess [2,48] since the solubilities in target substrates aregoverned by the cohesive energy density (d) [49]:
d ¼ffiffiffiffiffiffiffiffiffiffiffiffiffiffiffiffiffiffiffiffiffiffiffiffiffiDHvap � RT
Vm
s(3)
where Vm is the molar volume.Cohesive energy densities, enthalpies of fusion and melting
temperature were used to establish an operational parameter(“order of merit”) by which the most suitable materials could beprioritised for further testing and unsuitable materials discarded
Table 1Evaporation coefficients from Eq. (2) using data from Price and Hawkins [1].
Substance a � 104 M/g mol�1
Benzophenone 1.24 � 0.02 182.2Phenanthrene 1.18 � 0.04 178.2Benzoic acid 1.24 � 0.01 122.1Acetamide 1.14 � 0.02 59.1
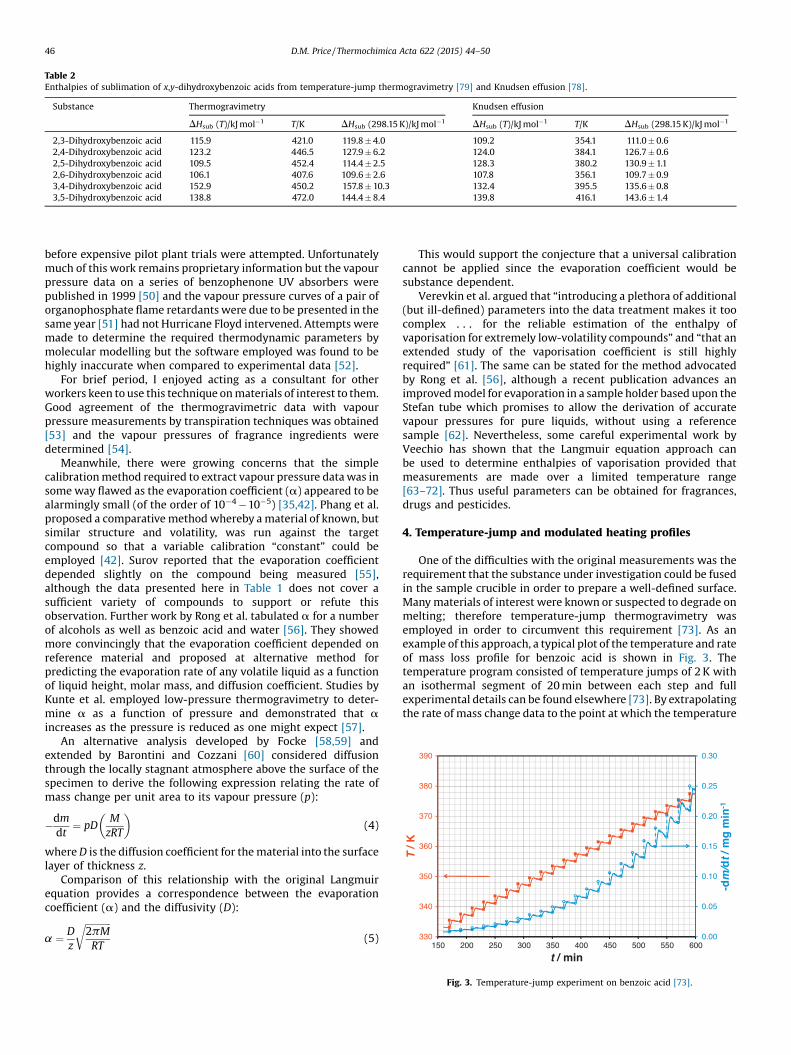
Table 2Enthalpies of sublimation of x,y-dihydroxybenzoic acids from temperature-jump thermogravimetry [79] and Knudsen effusion [78].
Substance Thermogravimetry Knudsen effusion
DHsub (T)/kJ mol�1 T/K DHsub (298.15 K)/kJ mol�1 DHsub (T)/kJ mol�1 T/K DHsub (298.15 K)/kJ mol�1
2,3-Dihydroxybenzoic acid 115.9 421.0 119.8 � 4.0 109.2 354.1 111.0 � 0.62,4-Dihydroxybenzoic acid 123.2 446.5 127.9 � 6.2 124.0 384.1 126.7 � 0.62,5-Dihydroxybenzoic acid 109.5 452.4 114.4 � 2.5 128.3 380.2 130.9 � 1.12,6-Dihydroxybenzoic acid 106.1 407.6 109.6 � 2.6 107.8 356.1 109.7 � 0.93,4-Dihydroxybenzoic acid 152.9 450.2 157.8 � 10.3 132.4 395.5 135.6 � 0.83,5-Dihydroxybenzoic acid 138.8 472.0 144.4 � 8.4 139.8 416.1 143.6 � 1.4
0.00
0.05
0.10
0.15
0.20
0.25
0.30
330
340
350
360
370
380
390
600550500450400350300250200150
-dm
/dt
/ mg
min
-1
T/ K
t / min
46 D.M. Price / Thermochimica Acta 622 (2015) 44–50
before expensive pilot plant trials were attempted. Unfortunatelymuch of this work remains proprietary information but the vapourpressure data on a series of benzophenone UV absorbers werepublished in 1999 [50] and the vapour pressure curves of a pair oforganophosphate flame retardants were due to be presented in thesame year [51] had not Hurricane Floyd intervened. Attempts weremade to determine the required thermodynamic parameters bymolecular modelling but the software employed was found to behighly inaccurate when compared to experimental data [52].
For brief period, I enjoyed acting as a consultant for otherworkers keen to use this technique on materials of interest to them.Good agreement of the thermogravimetric data with vapourpressure measurements by transpiration techniques was obtained[53] and the vapour pressures of fragrance ingredients weredetermined [54].
Meanwhile, there were growing concerns that the simplecalibration method required to extract vapour pressure data was insome way flawed as the evaporation coefficient (a) appeared to bealarmingly small (of the order of 10�4�10�5) [35,42]. Phang et al.proposed a comparative method whereby a material of known, butsimilar structure and volatility, was run against the targetcompound so that a variable calibration “constant” could beemployed [42]. Surov reported that the evaporation coefficientdepended slightly on the compound being measured [55],although the data presented here in Table 1 does not cover asufficient variety of compounds to support or refute thisobservation. Further work by Rong et al. tabulated a for a numberof alcohols as well as benzoic acid and water [56]. They showedmore convincingly that the evaporation coefficient depended onreference material and proposed at alternative method forpredicting the evaporation rate of any volatile liquid as a functionof liquid height, molar mass, and diffusion coefficient. Studies byKunte et al. employed low-pressure thermogravimetry to deter-mine a as a function of pressure and demonstrated that aincreases as the pressure is reduced as one might expect [57].
An alternative analysis developed by Focke [58,59] andextended by Barontini and Cozzani [60] considered diffusionthrough the locally stagnant atmosphere above the surface of thespecimen to derive the following expression relating the rate ofmass change per unit area to its vapour pressure (p):
�dmdt
¼ pDMzRT
� �(4)
where D is the diffusion coefficient for the material into the surfacelayer of thickness z.
Comparison of this relationship with the original Langmuirequation provides a correspondence between the evaporationcoefficient (a) and the diffusivity (D):
a ¼ Dz
ffiffiffiffiffiffiffiffiffiffiffi2pMRT
r(5)
This would support the conjecture that a universal calibrationcannot be applied since the evaporation coefficient would besubstance dependent.
Verevkin et al. argued that “introducing a plethora of additional(but ill-defined) parameters into the data treatment makes it toocomplex . . . for the reliable estimation of the enthalpy ofvaporisation for extremely low-volatility compounds” and “that anextended study of the vaporisation coefficient is still highlyrequired” [61]. The same can be stated for the method advocatedby Rong et al. [56], although a recent publication advances animproved model for evaporation in a sample holder based upon theStefan tube which promises to allow the derivation of accuratevapour pressures for pure liquids, without using a referencesample [62]. Nevertheless, some careful experimental work byVeechio has shown that the Langmuir equation approach canbe used to determine enthalpies of vaporisation provided thatmeasurements are made over a limited temperature range[63–72]. Thus useful parameters can be obtained for fragrances,drugs and pesticides.
4. Temperature-jump and modulated heating profiles
One of the difficulties with the original measurements was therequirement that the substance under investigation could be fusedin the sample crucible in order to prepare a well-defined surface.Many materials of interest were known or suspected to degrade onmelting; therefore temperature-jump thermogravimetry wasemployed in order to circumvent this requirement [73]. As anexample of this approach, a typical plot of the temperature and rateof mass loss profile for benzoic acid is shown in Fig. 3. Thetemperature program consisted of temperature jumps of 2 K withan isothermal segment of 20 min between each step and fullexperimental details can be found elsewhere [73]. By extrapolatingthe rate of mass change data to the point at which the temperature
Fig. 3. Temperature-jump experiment on benzoic acid [73].

0.0
0.5
1.0
1.5
2.0
2.5
3.0
430
450
470
490
510
530
550
180 19 0 20 0 21 0 22 0 23 0 240
[—]
-dm
/dt
/ mg
min
-1
[---
] T
/ K
t / min
Fig. 4. Modulated-temperature thermogravimetry of quinizarin [53].
0.00
0.02
0.04
0.06
0.08
0.10
0.12
0.14
470 48 0 49 0 50 0 51 0 52 0 53 0 540
v/ k
g0.
5s-
1m
-2m
ol0
.5K
0.5
T / K
uncorr ected
corr ected
Fig. 5. Volatilisation rate vs. temperature of quinizarin showing uncorrected andcorrected data.
0.001
0.01
0.1
1
10
100
1000
10000
100000
p/ P
a
TGA
transpiration
D.M. Price / Thermochimica Acta 622 (2015) 44–50 47
was changed the surface area can be assumed to be constant overthis interval [74]. These studies were directed at using easily-measured thermodynamic properties to predict behaviour in (thiscase) Matrix Assisted Laser Desorption Ionisation. We initiallyinvestigated the x,y-dihydroxybenzoic acid isomers, because onlyone isomer, 2,5-dihydroxybenzoic acid (2,5-DHB) was known toact as a UV matrix [75]. The other isomers were very poor as UVmatrices [76]. The enthalpy of sublimation (DHsub) of all the x,y-dihydroxybenzoic acid isomers were investigated to determine ifthis influenced their performance, but it was found that theirsublimation enthalpies were not sufficiently different to rational-ize their performance as UV MALDI matrices. Our data for thesecompounds are given in Table 3 where the original data has beencorrected to 298.15 K using the method of Chickos et al. [77] Laterwork by Monte et al. published the vapour pressures of the samematerials as determined by Knudsen effusion [78]. When theenthalpy of vaporisation is calculated using the Clausius–Clapeyron relation and reduced to 298.15 K by the same methodthen reasonable agreement between both techniques can beobtained.
Modulated-temperature thermogravimetry has also beenexplored as an alternative to linear heating or a series of isothermalsteps [79]. The raw temperature and mass loss profile for the dyequinizarin (1,4-dihydroxyanthraquinone) heated at an underlyinglinear rise of 1 K min�1 with a superimposed 5 K modulation ofperiod 300 s are shown in Fig. 4. These measurements were carriedout in a helium purge of 100 cm3min�1 to ensure close couplingbetween the sample, thermocouple and furnace by virtue of thehigh thermal conductivity of the carrier gas [53,79]. The maximaand minima in �dm/dt coincide with peaks and troughs intemperature suggesting that there is a negligible thermal gradientbetween the thermocouple and sample temperature. When themass loss data are converted into volatisation rate (v) according toEq. (2) and plotted directly against temperature it can be seen thata series of loops are formed as a consequence of changes inevaporation conditions (Fig. 5). For the purposes of reconciling thiseffect, a correction to the effective sample area may be applied asthe specimen evaporates in proportion to the amount of materiallost from the sample holder according to the relation:
AðTÞ ¼ A0 1 � c m0 � mðTÞð Þð Þ (6)
where A0 is the initial surface area defined by the sample holderand A(T) is the effective surface area reduced by an amountproportional to the mass change and a constant (c). For the datashown in figure the optimum value of c was determined byiteration as 0.0032 mg�1 (i.e. �0.3% per milligramme of samplelost). The effect of this correction is also shown in Fig. 5 and the fullvapour pressure curve shown in Fig. 6 was then fitted to Eq. (7) [80]according to the parameters given in Table 3.
Rlnpp0
� �¼ �DG0ðuÞ
uþ DHðuÞ 1
u� 1T
� �
þ DCpðuÞ uT� 1 þ ln
Tu
� �� �(7)
It is a requirement of this method that the sample crucible iscompletely filled with the material to be evaporated so that aninitial starting condition is achieved where A(T) = A0 at m(T) = m0.This correction is consistent with work of Heym et al. who
Table 3Fitting parameters for quinizarin according to Eq. (7).
T/K u/K DG(u)/J mol�1 DH(u)/kJ mol�1 DCp(u)/J K�1mol�1
�470.35 377.82 1595 � 7 105.1 � 0.9 61.5 � 2.0�470.35 508.33 �31790 � 30 81.6 � 0.6 �54.4 � 5.0
modelled the evaporation process in a partially-filled crucibleaccording to a two stage process involving diffusion through astagnant gas phase within the crucible followed by forcedconvection into an undersaturated gas stream [81,82]. Empirically,the correction factor A(T) accommodates the boundary layerthrough which the diffusing molecule must pass before it is carried
0.0001300 350 400 450 500 550 600
T / K
Fig. 6. Vapour pressure curve for quinizarin showing results obtained bytranspiration measurements [53] and revised data from modulated-temperaturethermogravimetry.

60
65
70
75
80
85
90
95
100
340 350 360 370 380 390 400
ΔΔH
/ kJ
mo
l-1
T / K
Fig. 7. Enthalpy of sublimation of benzoic acid obtained from data shown in Fig. 3according to Eq. (8). Dashed line represents literature data from Ref. [27].
-9
-8
-7
-6
-5
-4
0.0026 0.0 027 0.0 028 0.0 029 0.0 030 0.0 031
ln[v
/ kg
0.5 s
-1m
2 mo
l0.5K
0.5 ]
K / T
uncorr ected
corr ected
Fig. 8. Plot of logarithm of volatisation rate of benzoic acid vs. reciprocaltemperature showing improvement in fit by applying a correction to account fordiffusion-limited sublimation.
48 D.M. Price / Thermochimica Acta 622 (2015) 44–50
away in the gas stream. Heym’s work used a simulation based uponknown properties of model organic substances whereas thisexample attempts to determine this directly.
The same principles can be applied to the temperature-jumpdata shown in Fig. 3. A feature of this method is that it seeks to
0
50
100
150
200
250
300
350
0.0140.0120.010.0080.0060.0040.0020
p/ P
a
v / kg0.5s-1m2mol0.5K0.5
uncorr ectedcorr ected
Fig. 9. Plot of uncorrected and corrected benzoic acid sublimation data according toEq. (2).
avoid changes in the sample/atmosphere interaction by using thechange in rate of evaporation at the step in temperature. Thus therates of mass loss, �dm/dt(T1) and �dm/dt(T2), at the point atwhich the temperature jump occurs can be used to calculate theenthalpy of sublimation according to:
DHsub ¼ R ln�dm
dt T1ð ÞffiffiffiffiffiffiT2
pn o�dm
dt T2ð ÞffiffiffiffiffiffiT2
pn o0@
1A
24
35 1
T1� 1T2
� �(8)
A plot of DHsub vs. temperature is shown in Fig. 7 along withvalues calculated from the relationship between its vapourpressure and temperature published by de Kruif and Blok [27].Although this parameter is a weak function of temperature it maybe considered constant over a narrow range. When the volatisationrate v (according to Eq. (2)) for all points taken at the start and endof the isothermal segments between temperature jumps areplotted against reciprocal temperature, there is noticeable curva-ture (Fig. 8). By employing the same correction protocol asdescribed above (Eq. (6)) a closer agreement with linearity can beobtained and the resulting “Langmuir plot” (c.f. Fig. 2) also showsan improved fit (Fig. 9). This correction can, in principle, be appliedto measurements made under linear rising temperature conditionsalthough the use of step-wise or sinusoidal temperature programsprovides the opportunity to validate the method by virtue of thecyclic nature of the rate of temperature rise.
Acknowledgements
The author is grateful to Prof. Stefano Vecchio Ciprioti and Prof.Sergey Verevkin for their invitation to contribute to this specialedition of Thermochimica Acta and for their assistance inpreparing this paper.
References
[1] D.M. Price, M. Hawkins, Calorimetry of two disperse dyes usingthermogravimetry, Thermochim. Acta 315 (1998) 19–24.
[2] V.S. Salvin, The effect of dry heat on disperse dyes, Am. Dyestuff Reptr. 53(1966) 490–501.
[3] J. Durmis, M. Karvaš, P. �Cau9cik, J. Hol9cik, Loss of light stabilisers frompolypropylene, Eur. Polym. J. 11 (1975) 219–222.
[4] E.J. Gorondy, Analysis of the dye transfer mechanism in heat transfer printing,Textile Res. J. 47 (1977) 604–615.
[5] C.J. Hawkyard, The release of disperse dyes from thickener films duringthermal processes, J. Soc. Dyers Colour. 97 (1981) 213–219.
[6] R.B. Chavan, A.K. Jain, The importance of film thickener structure, dye vaporpressure and solubility parameter in sublimation transfer printing, J. Soc.Dyers Colour. 105 (1989) 73–78.
[7] C.G. de Kruif, T. Kuipers, J.C. van Miltenburg, R.C.F. Schaake, G. Stevens, Thevapour pressure of solid and liquid naphthalene, J. Chem. Thermodyn. 13(1981) 1081–1086.
[8] V.V. Karpov, I.V. Krutovskaya, G.N. Rodionova, Vapor pressure and affinity ofdispersed dyes to polyester fibers during transfer thermoprinting, Russ. J. Appl.Chem. 57 (1984) 1252–1255.
[9] W. McDowell, The behaviour of disperse dyes at high temperatures, J. Soc.Dyers Colour. 89 (1973) 177–185.
[10] J. Pfefferkorn, H.G. Wiedemann, Vapour pressure determinations by TG andDTA measurements, Prog. Vacuum Microbal. Tech. 2 (1973) 221–228.
[11] M.A.V. Riberio da Silva, M.J.S. Monte, The construction, testing and use of a newKnudsen effusion apparatus, Thermochim. Acta 171 (1990) 169–183.
[12] K. Nishida, E. Ishihara, T. Osaka, M. Koukitu, Vapour pressures and heats ofsublimation of some disperse dyes, J. Soc. Dyers Colour. 93 (1977) 52–54.
[13] T. Simizu, S. Ohkubo, M. Kimura, I. Tabata, T. Hori, The vapour pressures andheats of sublimation of model disperse dyes, J. Soc. Dyers Colour. 103 (1987)132–137.
[14] M. Casserino, D.R. Belvins, R.N. Sanders, An improved method for measuringvapor pressure by DSC with automated pressure control, Thermochim. Acta284 (1996) 145–152.
[15] J.W. Goodrum, E.M. Siesel, Thermogravimetric analysis for boiling points andvapour pressure, J. Therm. Anal. 44 (1996) 1251–1258.
[16] W. Gückel, G. Synnatschke, R. Rittig, A method for determining the volatility ofactive ingredients used in plant protection, Pest Sci. 4 (1973) 137–147.

D.M. Price / Thermochimica Acta 622 (2015) 44–50 49
[17] W. Gückel, F.R. Rittig, G. Synnatschke, A method for determining the volatilityof active ingredients used in plant protection. II. Applications to formulatedproducts, Pest Sci. 5 (1974) 393–400.
[18] W. Gückel, R. Kästel, J. Lewerenz, G. Synnatschke, A method for determiningthe volatility of active ingredients used in plant protection. Part III: thetemperature relationship between vapour pressure and evaporation rate, PestSci. 13 (1982) 161–168.
[19] W. Gückel, R. Kästel, T. Kröhl, A. Parg, A method for determining the vapourpressure of active ingredients used in crop protection. Part IV. An improvedthermogravimetric determination based on evaporation rate, Pest Sci. 45(1995) 27–31.
[20] T. Kröhl, R. Kästel, W. König, H. Ziegler, H. Köhle, A. Parg, Methods fordetermining the vapour pressure of active ingredients used in crop protection.Part V: thermogravimetry combined with solid phase microextraction (SPME),Pest Sci. 53 (4) (1998) 300–310.
[21] A.J. Dobbs, G.F. Hart, A.H. Parsons, The determination of vapour pressures fromrelative volatilization rates, Chemosphere 13 (1984) 687–692.
[22] A.J. Dobbs, M.R. Cull, Volatilisation of chemicals – relative loss rates and theestimation of vapour pressures, Environ. Pollut. Ser. B: Chem. Phys. 3 (1982)289–298.
[23] J.P. Elder, Sublimation measurements of pharmaceutical compounds byisothermal thermogravimetry, J. Therm. Anal. 49 (1997) 897–905.
[24] M. Xie, T.M. Ziemba, M.B. Maurin, Sublimation characterization and vaporpressure estimation of an HIV non-nucleoside reverse transcriptase inhibitorusing thermogravimetric analysis, AAPS PharmSciTech 4 (2003) 99–108.
[25] J. Oxley, J.L. Smith, J. Brady, S. Naik, Determination of urea nitrate andguanidine nitrate vapor pressures by isothermal thermogravimetry,Propellants Explos. Pyrotech. 35 (2010) 278–283.
[26] D. Dollimore, A breath of fresh air, Thermochim. Acta 340–341 (1999) 19–29.[27] C.G. de Kruif, J.G. Blok, The vapour pressure of benzoic acid, J. Chem.
Thermodyn. 14 (1982) 201–206.[28] C.G. de Kruif, C.H.D. van Ginkel, Torsion-weighing effusion vapour-pressure
measurements on organic compounds, J. Chem. Thermodyn. 9 (1977)725–730.
[29] C.G. de Kruif, Enthalpies of sublimation and vapour pressures of 11 polycyclichydrocarbons, J. Chem. Thermodyn. 12 (1980) 243–248.
[30] H.G.M. De Wit, J.C. van Miltenurg, C.G. de Kruif, Thermodynamic properties ofmolecular organic crystals containing nitrogen, oxygen and sulphur. 1. Vapourpressures and enthalpies of sublimation, J. Chem. Thermodyn. 15 (1983) 651–663.
[31] S.J. Ashcroft, The measurement of enthalpies of sublimation bythermogravimetry, Thermochim. Acta 2 (1971) 512–514.
[32] I. Langmuir, The vapor pressure of metallic tungsten, Phys. Rev. 2 (1913) 329–400.
[33] K. Chatterjee, D. Dollimore, K. Alexander, A thermal analysis study of hydroxybenzoic acid derivatives using rising temperature thermogravimetry, J.Thermal. Anal. Calorim. 63 (2000) 629–639.
[34] K. Chatterjee, D. Dollimore, K. Alexander, A new application for the Antoineequation in formulation development, Int. J. Pharm. 213 (2001) 31–44.
[35] L. Burnham, D. Dollimore, K. Alexander, Calculation of the vapor pressure–temperature relationship using thermogravimetry for the drug allopurinol,Thermochim. Acta 367–368 (2001) 15–22.
[36] L. Shen, K.S. Alexander, D. Dollimore, A thermal analysis study of myristic acid,Thermochim. Acta 367 (2001) 69–74.
[37] P. Phang, D. Dollimore, The calculation of the vapor pressures of antioxidantsover a range of temperatures using thermogravimetry, Thermochim. Acta 367(2001) 263–271.
[38] S.F. Wright, K.A. Alexander, D. Dollimore, The initial thermal characterizationof hair color rinse ingredients – adipic acid, Thermochim. Acta 367 (2001)29–35.
[39] K. Chatterjee, D. Dollimore, K. Alexander, Calculation of vapor pressure curvesfor ethyl propyl, and butyl parabens using thermogravimetry, Instrum. Sci.Technol. 29 (2001) 133–144.
[40] K. Chatterjee, A. Hazra, D. Dollimore, D. Alexander, An evaporation study forphthalic acids – a rapid method for pharmaceutical characterization, J. Pharm.Sci. 91 (2002) 1156–1168.
[41] K. Chatterjee, A. Hazra, D. Dollimore, D. Alexander, Estimating vapor pressurecurves by thermogravimetry: a rapid and convenient method forcharacterization of pharmaceuticals, Eur. J. Pharm. Biopharm. 54 (2002)171–180.
[42] P. Phang, D. Dollimore, S.J. Evans, A comparative method for developing vaporpressure curves based on evaporation data obtained from a simultaneous TG–DTA unit, Thermochim. Acta 392–393 (2002) 119–125.
[43] A. Hazra, D. Dollmore, K. Alexander, Thermal analysis of the evaporation ofcompounds used in aromatherapy using thermogravimetry, Thermochim.Acta 392–393 (2002) 221–229.
[44] D. Menon, D. Dollimore, K.S. Alexander, A TG–DTA study of the sublimation ofnicotinic acid, Thermochim. Acta 392–393 (2002) 237–241.
[45] A.S. Tatavarti, D. Dollimore, K.S. Alexander, A thermogravimetric analysis ofnon-polymeric pharmaceutical plasticizers: kinetic analysis, methodvalidation, and thermal stability evaluation, AAPS PharmSci 4 (2002)231–242.
[46] S.F. Wright, D. Dollimore, J.G. Dunn, K. Alexander, Determination of the vapourpressure curves of adipic acid and triethaolamine using thermogravimetricanalysis, Thermochim. Acta 421 (2004) 25–30.
[47] A. Hazra, K. Alexander, D. Dollimore, A. Riga, Characterization of some essentialoils and their key components: thermoanalytical techniques, J. Thermal Anal.Calorim. 75 (2004) 317–330.
[48] A.T. Stark, P.M. Hadgett, The effect of specific interactions on dye transport inpolymers above the glass transition, Polymer 40 (1999) 4001–4011.
[49] W.C. Ingamells, The Response of Fibres to Dyeing Processes, in: C.L. Bird, W.S.Boston (Eds.), The Theory of Coloration of Textiles, Dyers CompanyPublications Trust: distributed by the Society of Dyers and Colourists,1975, pp. 294–300.
[50] D.M. Price, M. Hawkins, Vapour pressures of hydroxybenzophenone UVabsorbers, Thermochim. Acta 329 (1999) 73–76.
[51] D.M. Price, Vapor pressure determination by thermogravimetry, Proc. 27thNATAS Conference (1999) 524–529.
[52] D.M. Price, Vapor pressure determination by thermogravimetry, Thermochim.Acta 367/368 (2001) 253–262.
[53] D. Hinks, M.I. Rafiq, G.A. Montero, B. Smith, D.M. Price, A comparison of vapourpressure measurements of quinizarin and leuco-quinizarin via transpirationand thermogravimetry, Color. Technol. 119 (2003) 84–90.
[54] P. Irving, Determination of vapour pressures by thermogravimetric analysis,internal report, Quest International (2004).
[55] O.V. Surov, Thermogravimetric method used to determine the saturated vaporpressure in a wide range of values, Russ. J. Appl. Chem. 1 (2009) 42–46.
[56] Y. Rong, C.M. Gregson, A. Parker, J. Chem. Thermodyn. 51 (2012) 25–30.[57] G.V. Kunte, U. Ail, P.K. Ajikumar, A.K. Tyagi, S.A. Shivashankar, A.M. Umarji, Bull.
Mater. Sci. 34 (2011) 1633–1637.[58] W.W. Focke, A revised equation for estimating the vapour pressure of low-
volatility substances from isothermal TG data, J. Thermal Anal. Calorim. 74(2003) 97–107.
[59] N. Pieterse, W.W. Focke, Diffusion-controlled evaporation through a stagnantgas: estimating low vapour pressures from thermogravimetric data,Thermochim. Acta 406 (2003) 191–198.
[60] F. Barontini, V. Cozzani, Assessment of systematic errors in measurement ofvapor pressures by thermogravimetric analysis, Thermochim. Acta 460 (2007)15–21.
[61] S.P. Verevkin, R.V. Ralys, D.H. Zaitsau, V.N. Emel'yanenko, C. Schick, Expressthermo-gravimetric method for the vaporisation enthalpies appraisal for verylow volatile molecular and ionic compounds, Thermochim. Acta 538 (2012)55–62.
[62] A. Parker, R. Babas, Thermogravimetric measurement of evaporation: dataanalysis based on the Stefan tube, Thermochim. Acta 595 (2014) 67–73.
[63] S. Vecchio, A. Catalani, V. Rossi, M. Tomassetti, Thermal analysis study onvaporization of some analgesics. Acetanilide and derivatives, Thermochim.Acta 420 (2004) 99–104.
[64] S. Vecchio, B. Brunetti, Standard sublimation enthalpies of somedichlorophenoxy acids and their methyl esters, J. Chem. Eng. Data 50(2005) 666–672.
[65] S. Vecchio, Standard molar enthalpies and entropies of vaporization for twolow-melting trichlorophenoxy herbicides, J. Thermal Anal. Calorim. 84 (2006)271–278.
[66] S. Vecchio, Contribution of thermal analysis to the description of transportphenomena of pesticides, J. Thermal Anal. Calorim. 87 (2007) 79–83.
[67] S. Vecchio, B. Brunetti, Vapor pressures and standard molar sublimationenthalpies of three 6-methylthio-2,4-di(alkylamino)-1,3,5-triazinederivatives: simetryn, ametryn, and terbutryn, J. Chem. Eng. Data 52 (2007)1585–1594.
[68] S. Vecchio, B. Brunetti, Vapor pressures and standard molar enthalpiesentropies, and Gibbs free energies of sublimation of 2,4- and 3,4-dinitrobenzoic acids, J. Chem. Thermodyn. 41 (2009) 880–887.
[69] S. Vecchio, Vapor pressures and standard molar enthalpies, entropies andGibbs energies of sublimation of two hexachloro herbicides using a TG unit,Thermochim. Acta 499 (2010) 27–33.
[70] S. Vecchio, B. Brunetti, Thermochemical study of 2,4-, 2,6- and 3,4-dihydroxybenzoic acids in the liquid phase using a TG apparatus,Thermochim. Acta 515 (2011) 84–90.
[71] S. Vecchio, B. Brunetti, Vapor pressures standard molar enthalpies, entropiesGibbs energies of sublimation and heat capacities of 2,5- and 3,5-dibromobenzoic acids, Fluid Phase Equilib. 338 (2013) 148–154.
[72] S. Vecchio, Thermogravimetric method for a rapid estimation of vaporpressure and vaporization enthalpies of disubstituted benzoic acids: anattempt to correlate vapor pressures and vaporization enthalpies withstructure, Struct. Chem. 24 (2013) 1821–1827.
[73] D.M. Price, S. Bashir, P.R. Derrick, Sublimation properties of x,y-dihydroxybenzoic acid isomers as model MALDI matrices, Thermochim.Acta 327 (1999) 167–171.
[74] J.H. Flynn, B. Dickens, Steady-state parameter-jump methods and relaxationmethods in thermogravimetry, Thermochim. Acta 15 (1976) 1–16.
[75] K. Strupat, M. Karas, F. Hillenkamp, 2,5-Dihydroxybenzoic acid: a new matrixfor laser desorption-ionization mass spectrometry, Int. J. Mass Spectrom. IonProcesses 111 (1991) 89–102.
[76] M. Mormann, S. Bashir, P.J. Derrick, D. Kuck, Gas-phase basicities of theisomeric dihydroxybenzoic acids and gas-phase acidities of their radicalcations, J. Am. Soc. Mass Spectrom. 11 (2000) 544–552.
[77] J.S. Chickos, S. Hosseini, D.G. Hesse, J.F. Liebman, Heat capacity corrections to astandard state: a comparison of new and some literature methods for organicliquids and solids, Struct. Chem. 4 (1993) 271–278.

50 D.M. Price / Thermochimica Acta 622 (2015) 44–50
[78] M.J.S. Monte, M.V. Gonçalves, M.D.M.C. Ribeiro da Silva, Vapor pressures andenthalpies of combustion of the dihydroxybenzoic acid isomers, J. Chem. Eng.Data 55 (2010) 2246–2251.
[79] D.M. Price, Volatilisation, evaporation and vapour pressure studies using athermobalance, J. Thermal Anal. Calorim. 64 (2001) 315–322.
[80] E.C.W. Clarke, D.N. Glew, Evaluation of thermodynamic functions fromequilibrium constants, Trans. Faraday Soc. 62 (1966) 539–547.
[81] F. Heym, B.J.M. Etzold, C. Kern, A. Jess, An improved method to measure therate of vaporisation and thermal decomposition of high boiling organic andionic liquids by thermogravimetrical analysis, Phys. Chem. Chem. Phys. 12(2010) 12089–12100.
[82] F. Heym, B.J.M. Etzold, C. Kern, A. Jess, Analysis of evaporation and thermaldecomposition of ionic liquids by thermogravimetrical analysis at ambientpressure and high vacuum, Green Chem. 13 (2011) 1453–1466.