a laboratory study of gyres and uplift near the strait of
TRANSCRIPT
JOURNAL OF GEOPHYSICAL RESEARCH, VOL. 90, NO. C4, PAGES 7045-7060, JULY 20, 1985
A Laboratory Study of Gyres and Uplift Near the Strait of Gibraltar
J. A. WHITEHEAD, JR.
Woods Hole Oceanographic Institution, Massachusetts
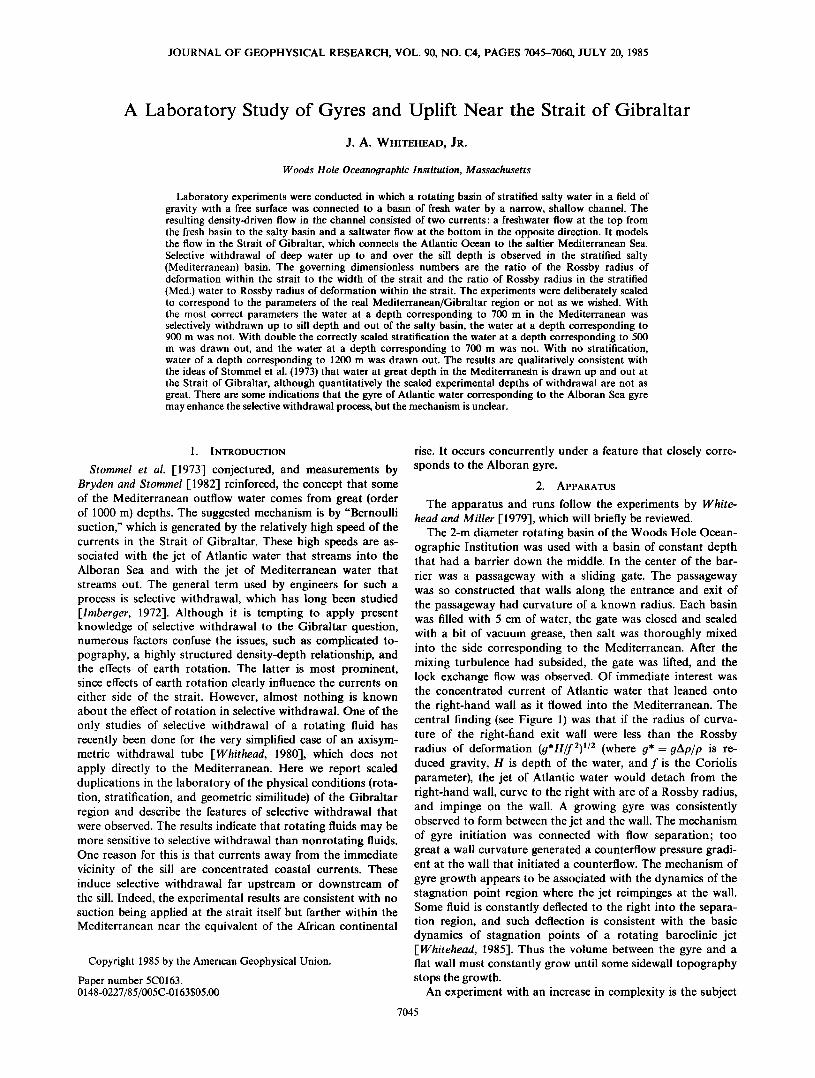
Laboratory experiments were conducted in which a rotating basin of stratified salty water in a field of gravity with a free surface was connected to a basin of fresh water by a narrow, shallow channel. The resulting density-driven flow in the channel consisted of two currents: a freshwater flow at the top from the fresh basin to the salty basin and a saltwater flow at the bottom in the opposite direction. It models the flow in the Strait of Gibraltar, which connects the Atlantic Ocean to the saltier Mediterranean Sea. Selective withdrawal of deep water up to and over the sill depth is observed in the stratified salty (Mediterranean) basin. The governing dimensionless numbers are the ratio of the Rossby radius of deformation within the strait to the width of the strait and the ratio of Rossby radius in the stratified (Med.) water to Rossby radius of deformation within the strait. The experiments were deliberately scaled to correspond to the parameters of the real Mediterranean/Gibraltar region or not as we wished. With the most correct parameters the water at a depth corresponding to 700 m in the Mediterranean was selectively withdrawn up to sill depth and out of the salty basin, the water at a depth corresponding to 900 m was not. With double the correctly scaled stratification the water at a depth corresponding to 500 m was drawn out, and the water at a depth corresponding to 700 m was not. With no stratification, water of a depth corresponding to 1200 m was drawn out. The results are qualitatively consistent with the ideas of Stommel et al. (1973) that water at great depth in the Mediterranean is drawn up and out at the Strait of Gibraltar, although quantitatively the scaled experimental depths of withdrawal are not as great. There are some indications that the gyre of Atlantic water corresponding to the Alboran Sea gyre may enhance the selective withdrawal process, but the mechanism is unclear.
1. INTRODUCTION
Stomrnel et al. [1973] conjectured, and measurements by Bryden and Storereel [1982] reinforced, the concept that some of the Mediterranean outflow water comes from great (order of 1000 m) depths. The suggested mechanism is by "Bernoulli suction," which is generated by the relatively high speed of the currents in the Strait of Gibraltar. These high speeds are as- sociated with the jet of Atlantic water that streams into the Alboran Sea and with the jet of Mediterranean water that streams out. The general term used by engineers for such a process is selective withdrawal, which has long been studied Jimberger, 1972]. Although it is tempting to apply present knowledge of selective withdrawal to the Gibraltar question, numerous factors confuse the issues, such as complicated to- pography, a highly structured density-depth relationship, and the effects of earth rotation. The latter is most prominent, since effects of earth rotation clearly influence the currents on either side of the strait. However, almost nothing is known about the effect of rotation in selective withdrawal. One of the
only studies of selective withdrawal of a rotating fluid has recently been done for the very simplified case of an axisym- metric withdrawal tube [Whithead, 1980], which does not apply directly to the Mediterranean. Here we report scaled duplications in the laboratory of the physical conditions (rota- tion, stratification, and geometric similitude) of the Gibraltar region and describe the features of selective withdrawal that were observed. The results indicate that rotating fluids may be more sensitive to selective withdrawal than nonrotating fluids. One reason for this is that currents away from the immediate vicinity of the sill are concentrated coastal currents. These induce selective withdrawal far upstream or downstream of the sill. Indeed, the experimental results are consistent with no suction being applied at the strait itself but farther within the Mediterranean near the equivalent of the African continental
Copyright 1985 by the American Geophysical Union.
Paper number 5C0163. 0148-0227/85/005C-0163505.00
rise. It occurs concurrently under a feature that closely corre- sponds to the Alboran gyre.
2. APPARATUS
The apparatus and runs follow the experiments by White- head and Miller [1979], which will briefly be reviewed.
The 2-m diameter rotating basin of the Woods Hole Ocean- ographic Institution was used with a basin of constant depth that had a barrier down the middle. In the center of the bar-
rier was a passageway with a sliding gate. The passageway was so constructed that walls along the entrance and exit of the passageway had curvature of a known radius. Each basin was filled with 5 cm of water, the gate was closed and sealed with a bit of vacuum grease, then salt was thoroughly mixed into the side corresponding to the Mediterranean. After the mixing turbulence had subsided, the gate was lifted, and the lock exchange flow was observed. Of immediate interest was the concentrated current of Atlantic water that leaned onto
the right-hand wall as it flowed into the Mediterranean. The central finding (see Figure 1) was that if the radius of curva- ture of the right-hand exit wall were less than the Rossby radius of deformation (g'H/f2) •/2 (where g*= gAp/p is re- duced gravity, H is depth of the water, and f is the Coriolis parameter), the jet of Atlantic water would detach from the right-hand wall, curve to the right with arc of a Rossby radius, and impinge on the wall. A growing gyre was consistently observed to form between the jet and the wall. The mechanism of gyre initiation was connected with flow separation; too great a wall curvature generated a counterflow pressure gradi- ent at the wall that initiated a counterflow. The mechanism of
gyre growth appears to be associated with the dynamics of the stagnation point region where the jet reimpinges at the wall. Some fluid is constantly deflected to the right into the separa- tion region, and such deflection is consistent with the basic dynamics of stagnation points of a rotating baroclinic jet [Whitehead, 1985]. Thus the volume between the gyre and a flat wall must constantly grow until some sidewall topography stops the growth.
An experiment with an increase in complexity is the subject
7045

7046 WHITEHEAD: LABORATORY STUDY OF GYRES AND UPLIFT NEAR GIBRALTAR
:::.; .: .......:•.•.• ....... •.•. .:... •* . •.• ....... ..• :..•. :•.•:... ........ .... •. -...• ..•
:.; '"•'.--'•: •'. ";.*•.'* e•--. • <. '.:..... ...... %;. :-.•:'"' "•. -. '.•.•-"- •: • w "• ........
:•; ':"';*"•L. •* • '•. •.'-:....•:.::.".-..'".' :'.'. :-..'.; ::' ..... •'•.:•-:: ,•:' * • .-. "- .•/:.Y:..--" :•.' :'-". •.' ':...' '-?.:'?--.'. '• ' .•...
;•.. .... :,.. -,./:: ..:•..*•-,::..;::.... :.:::. --...•.;...• -, ,.....•........•.'•..•,• .. ;.../., **-•....- .-....: .:.. •...... :.::s,...., ?......•;. .... ,:;:?::. ,'-"-..-':;¾" ....-.---.:.•},•..:.' ?'•'...•.• ::-a-:::•(':.'--.:.::,,.;-.--•-"..,*•...'. :."v....-.<:..•,:,:. '•,:; :.- • -'•'.-.-..<•:-.•.',:..
:.:: :;c ":" '•s•***:•.,..--: ..•:c',-';'.'"::.--::-...::,-:::-:::"'";':':':-.... .... . :,-%.x?* --*;: ::'"w'"/;:'.'•'.':'::: %-"..•:':'-.-.c'.•- ' * '-• '•:•.•:..:: ..' ;:: '::.,:....•*a;:•:•::;•:** ....... ½-:,.(.:. *;;:•;.•;::':' • ;.-; .... ; ....... : *:•*:'..::c:."•:..:5•: :.; •* '...a..•' .':.'::;:'::.•'*:'-:::.".:-;%..• '.-;:.'...:..:. '.}:.. '_%•..•...•::;:{,,•: ....... :•: '•:•'•1•-;½,:.•,::-,:' * ,:. ,.•,.*;:"*':.: ,.....c.. ,'.....:x..- '.:-':":-' .'--::::.::"?:.•:'%....: "'. * -.. :-'•:'*....*•:;:.:,s:.::.::;•." "::-/{.::.::--:'--':::,-., :--' '•'?x•.% 4 ':c.. •5-- :' .•7•' .::. ,•. ;½:;: .:::;/::::--.'-•:-::':.. * ,.'?:':.::,•:;:•.•,.;: ....... ;:-.... ";'::'.:.;;;':;.•;•,- ..'--5::s..."•.' .:.},.}::-.:' ...;*,":":*•:-:--.-:.'X--:*';:c•-•;•;•.-:::.):.:...' ½7 .... -::. :.' ..'e' :'..' :,•:• ..... •:.
:-'• .
Stommel et al. [1973]) could be obtained. In the new topogra- phy the model of the Strait of Gibraltar was a shallow channel. On each end was a 45 ø deepening shelf break, which increased in depth and width away from the channel to a final basin depth of 24 cm. The Mediterranean and Atlantic basins were made as large as possible. While the basin was rotating, a barrier was inserted through the strait, the Atlantic basin was filled with fresh water, and the Mediterranean was filled with salt-stratified water. The observation commenced when the
barrier was removed.
Since there will be comparisons between flow in the model and geographical basins, a nomenclature that clearly dis- tinguishes the two is vital. When describing the actual geo- graphic region, full spelling will be used; when describing the laboratory analog, a three-letter abbreviation will be used. Hence the laboratory basin corresponding to the Medi- terranean will be called the Med., and likewise Alb. will corre- spond to Alboran Sea (the region of the Mediterranean close to Gibraltar). Gib. will correspond to Gibraltar, Atl. will cor- respond to Atlantic, Spa. will correspond to the coast of Spain, and Afr. will correspond to the coast of Africa. Like- wise, lengths observed in experiments will be reported in centi- meters (cm) and time reported in seconds (s). In the oceano- graphical context, distance and time units will be reported in meters (m), kilometers (km), and days.
The geometry selected, and sketched in Figure 2, consisted of a channel 20 cm long x 5 cm wide separating the Atl. basin from the Med. basin. In contrast to the uniform depth in Whitehead and Miller [1979] the Atl. and Med. basins were 24 cm deep, and the Gib. was 6 cm deep, corresponding to the very reasonable depths of 1200 m and 300 m for the Alboran- Mediterranean Sea complex and the Strait of Gibraltar, re- spectively, using a vertical scale factor of 2 x 10-'L The scal-
Fig. 1. The growth of a gyre after a baroclinic current has sepa- rated from a wall (from the experiments reported in Whitehead and Miller [ 1979]).
of this article. Bottom topography and stratification of the Mediterranean basin have been introduced. The geometry of the sidewalls has also been made to be more realistic with
respect to the real Atlantic-Mediterranean region. It was an- ticipated that new information about the uplift-selective with- drawl mechanism (i.e., the Bernoulli suction hypothesized by
I c I
i i i
!
MœD. •'PA. ATL.
AFI•.
Fig. 2. Sketch of the experimental apparatus, drawn to scale. The short-dashed lines correspond to the change in slope of the modeled Gibraltar sill topography. The double-lined wall is a Plexiglas model wall of Africa. The two rectangles labeled M are mirrors set at 45 ø so that a side view of the flow near the model strait could be obtained. The false bottom for the strait is drawn to scale in the mirrors. The
long double-dashed line is a false African wall, which could be inser- ted to eliminate the Alboran gyre. The long single-dashed line in the mirror is the free surface of the water. The dotted line is the remov-
able dam. The rectangle labeled c is a digital clock.
WHITEHEAD: LABORATORY STUDY OF GYRES m,rD UPLn•r NEAR GmRALTAR 7047
// u //
//
II •
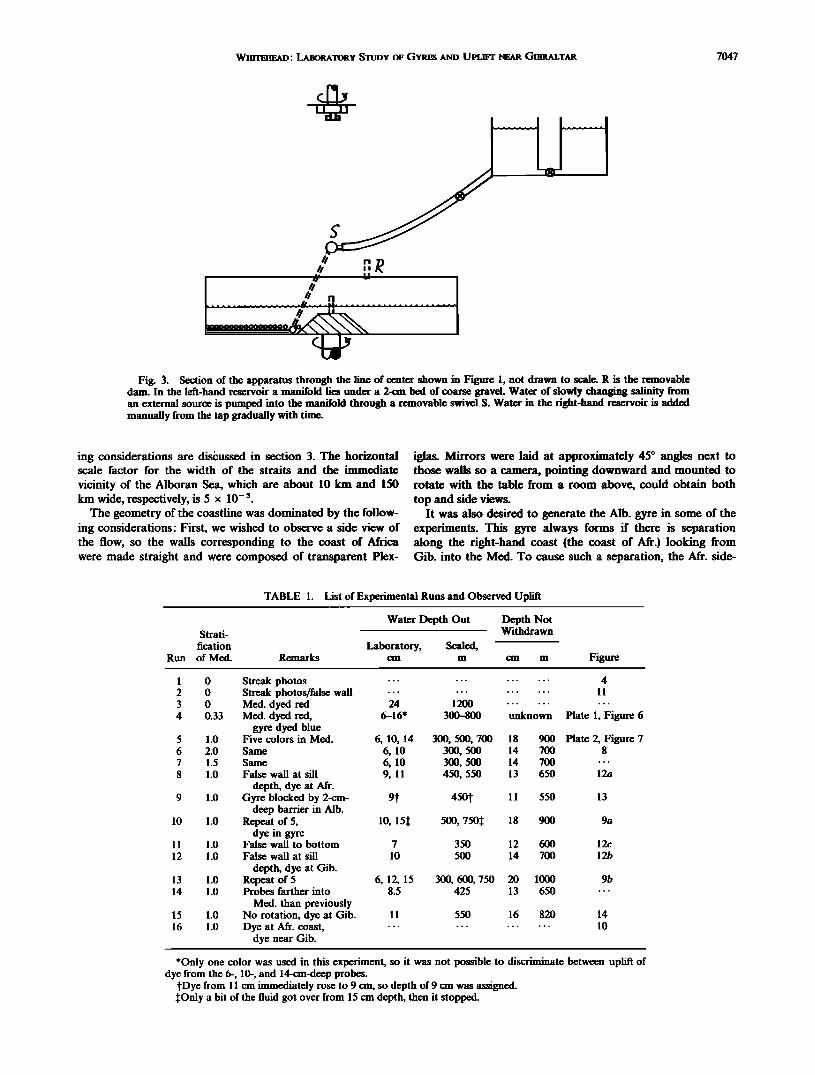
Fig. 3. Section of the apparatus through the line of center shown in Figure 1, not drawn to scale. R is the removable dam. In the left-hand reservoir a manifold lies under a 2-cm bed of coarse gravel. Water of slowly changing salinity from an external source is pumped into the manifold through a removable swivel S. Water in the right-hand reservoir is added manually from the tap gradually with time.
ing considerations are dis/:ussed in section 3. The horizontal scale factor for the width of the straits and the immediate
vicinity of the Alboran Sea, which are about 10 km and 150 km wide, respectively, is 5 x 10- 5.
The geometry of the coastline was dominated by the follow- ing considerations: First, we wished to observe a side view of the flow, so the walls corresponding to the coast of Africa were made straight and were composed of transparent Plex-
iglas. Mirrors were laid at approximately 45 ø angles next to those walls so a camera, pointing downward and mounted to rotate with the table from a room above, could obtain both top and side views.
It was also desired to generate the Alb. gyre in some of the experiments. This gyre always forms if there is separation along the right-hand coast (the coast of Afr.) looking from Gib. into the Med. To cause such a separation, the Afr. side-
TABLE 1. List of Experimental Runs and Observed Uplift
Water Depth Out Depth Not Strati- Withdrawn fication Laboratory, Scaled,
Run of Med. Remarks crn m crn m Figure
1 0 Streak photos ...... 2 0 Streak photos/false wall ...... 3 0 Med. dyed red 24 1200 4 0.33 Med. dyed red, 6-16' 300-800
gyre dyed blue 5 1.0 Five colors in Med. 6, 10, 14 300, 500, 700 6 2.0 Same 6, 10 300, 500 7 1.5 Same 6, 10 300, 500 8 1.0 False wall at sill 9, 11 450, 550
depth, dye at Afr. 9 1.0 Gyre blocked by 2-cm- 9t 450t
deep barrier in Alb. 10 1.0 Repeat of 5, 10, 15•: 500, 750•:
dye in gyrc 11 1.0 False wall to bottom 7 350 12 1.0 False wall at sill 10 500
depth, dye at Gib. 13 1.0 Repeat of 5 6, 12, 15 300, 600, 750 14 1.0 Probes farther into 8.5 425
Med. than previously 15 1.0 No rotation, dye at Gib. 11 550 16 1.0 Dye at Afr. coast, - .....
dye near Gib.
unknown Plate 1, Figure 6
18 900 Plate 2, Figure 7 14 700 8 14 700 ---
13 650 12a
11 550 13
18 900 9a
12 600 12c
14 700 12b
20 1000 9b 13 650 ---
16 820 14
...... 10
*Only one color was used in this experiment, so it was not possible to discriminate between uplil• of dye from the 6-, 10-, and 14-cm-deep probes.
•Dye from 11 cm immediately rose to 9 cm, so depth of 9 cm was assigned. $Only a bit of the fluid got over from 15 cm depth, then it stopped.

7048 WHITEHEAD' LABORATORY STUDY OF GYRES AND UPLIFT NEAR GIBRALTAR
..
ß
?"
Fig. 4. Streak lines from a 6-s time exposure of white pellets floating on water dyed black. The gyre in the Med. gradually grows. In the Atl. side a gyre formed near Por. ("Portugal"). Run number 1 in Table 1'
Time, Scaled Time, Scaled Time, Frame s hours days
a 28 46 1.9 b 78 127 5.3 c 128 209 8.7 d 228 371 15.5 e 278 453 18.9 f 328 535 22.3
WHITEHEAD' LABORATORY STUDY OF GYRF_S AND UPLIFT NEAR GmRA•.TAR 7049
..... ..:•:.•
........ '"4:{'• '-'•'•'• .... "a """"•:•; .•,..•....--.•: .•;½*':*'.•;S•N;•:-,.."½;•*'*'•'•'--•' '""--]•..•,:.-½ '" '•' ..... ":;'"J' :t; '?½½•;" ' ........ .-s:' ............. . ......... -•--'•: ','"•' -"•";s' ?- :-• "' .• :'•' • -• •- •,.. ...... •,•:, Y •, .., .... .., ....
ß (....-..... . .. ½ ........... -...:•.•.• ..•..:•(•'•' .....: ..
..: - .2½:e: .....
.:::• .., : - •:.•7! ......
. ..... / .....
.... ..:...,".-: ?:;.•-?:.i ....... -.-d'.; ',- ........... ....... •- ................... •.. ..%..;•.•.:. .?' .,.• .:%.- ....... ;;•{ ".':i::'•'.•
..•: {•}.:.•i:.::•:::;::i• .:::-......... :;:.::• ............. • ..... ' '•'-'•:. i• .......... ......:.... Y.:. • -:
:•"i:; .... • ":'---R•;• '•' '::'•!:'•"':'"" "'" ............ • ....... "•' "
½ ' ............................ • .... , ..... ..:?..¾•;':'""•;:'•' ...... ., .. , .-.-: ......................... -• .,•:: .... ,----•2½•a..
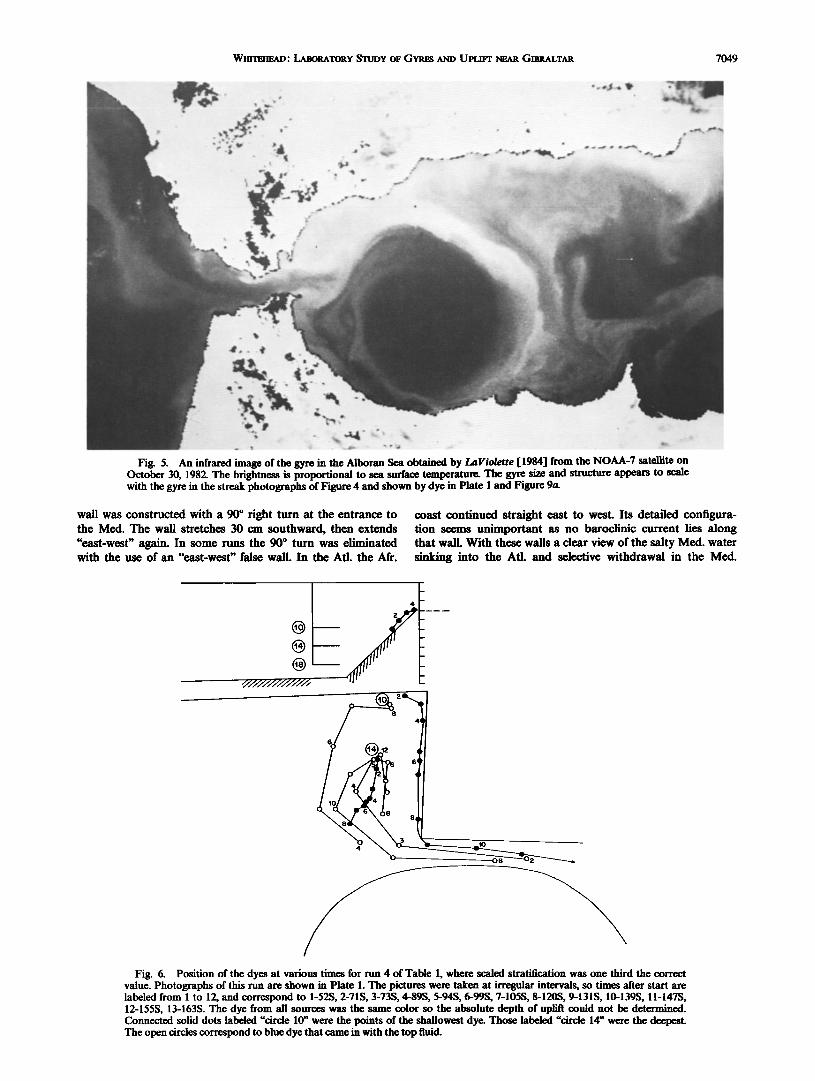
Fig. ½. An infrared image of the gyre in the •boran Sea obtain• by •Fiolette [1984] from the NOAA-? satellite o• Octobr 30, 1982. The brightness is proportional to sea surface tem•rature. •e gyre she and structure ap•ars to scale with the gyre in the streak photographs of Figure 4 and sho• by dye in Plate 1 and Figure 9a.
wall was constructed with a 90 ø right turn at the entrance to the Med. The wall stretches 30 cm southward, then extends "east-west" again. In some runs the 90 ø turn was eliminated with the use of an "east-west" false wall. In the Atl. the Afr.
coast continued straight east to west. Its detailed configura- tion seems unimportant as no baroclinic current lies along that wall. With these walls a clear view of the salty Med. water sinking into the Atl. and selective withdrawal in the Med.
© © e--
Fig. 6. Position of the dyes at various times for run 4 of Table 1, where scaled stratification was one third the correct value. Photographs of this run are shown in Plate 1. The pictures were taken at irregular intervals, so times after start are labeled from 1 to 12, and correspond to 1-52S, 2-71S, 3-73S, 4-89S, 5-94S, 6-99S, 7-105S, 8-120S, 9-131S, 10-139S, 11-147S, 12-155S, 13-163S. The dye from all sources was the same color so the absolute depth of uplift could not be determined. Connected solid dots labeled "circle 10" were the points of the shallowest dye. Those labeled "circle 14" were the deepest. The open circles correspond to blue dye that came in with the top fluid.
7050 Wmx•-mA•- LA•Om*.XOR¾ Sxt•¾ ov Gva•s • UPLift • Gm•XAl•
©
© © @
24
35
47
57
57 74 I
i I I I I I
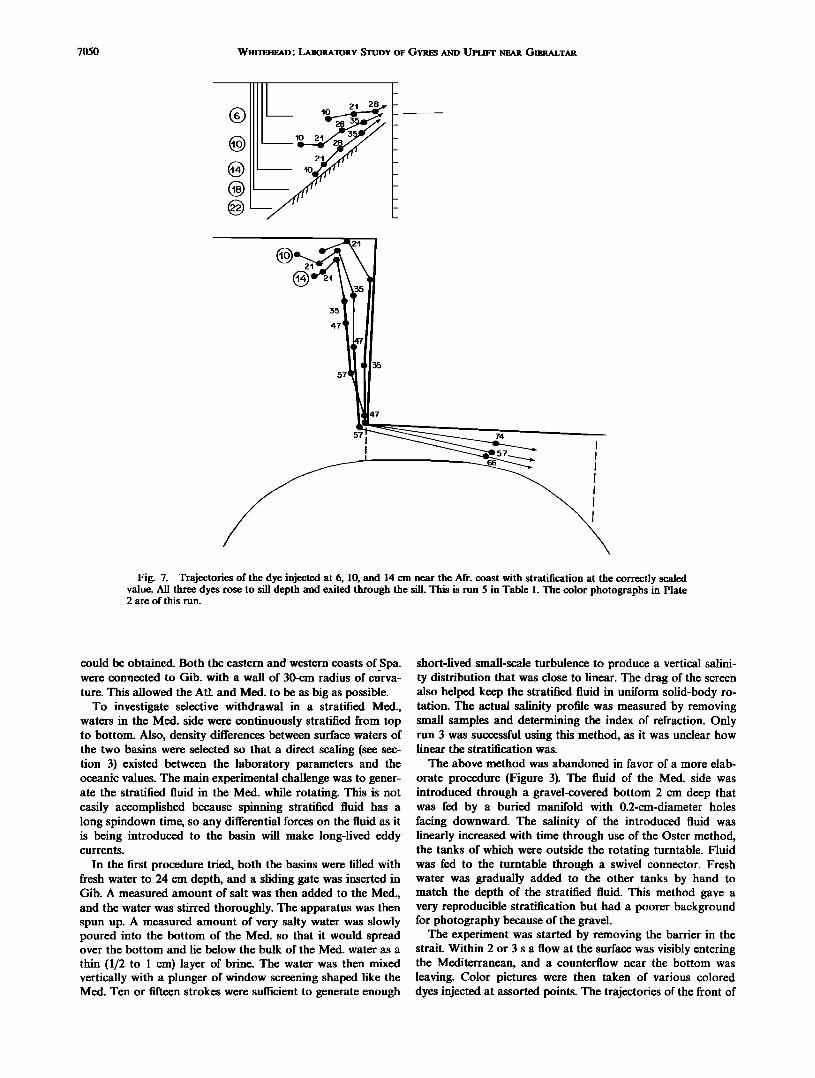
Fig. 7. Trajectories of the dye injected at 6, 10, and 14 cm near the Afr. coast with stratification at the correctly scaled value. All three dyes rose to sill depth and exited through the sill. This is run 5 in Table 1. The color photographs in Plate 2 are of this run.
could be obtained. Both the eastern and western coasts of Spa. _
were connected to Gib. with a wall of 30-cm radius of curva-
ture. This allowed the Atl. and Med. to be as big as possible. To investigate selective withdrawal in a stratified Med.,
waters in the Med. side were continuously stratified from top to bottom. Also, density differences between surface waters of the two basins were selected so that a direct scaling (see sec- tion 3) existed between the laboratory parameters and the oceanic values. The main experimental challenge was to gener- ate the stratified fluid in the Med. while rotating. This is not easily accomplished because spinning stratified fluid has a long spindown time, so any differential forces on the fluid as it is being introduced to the basin will make long-lived eddy currents.
In the first procedure tried, both the basins were filled with fresh water to 24 cm depth, and a sliding gate was inserted in Gib. A measured amount of salt was then added to the Med., and the water was stirred thoroughly. The apparatus was then spun up. A measured amount of very salty water was slowly poured into the bottom of the Med. so that it would spread over the bottom and lie below the bulk of the Med. water as a
thin (1/2 to 1 cm) layer of brine. The water was then mixed vertically with a plunger of window screening shaped like the Med. Ten or fifteen strokes were sufficient to generate enough
short-lived small-scale turbulence to produce a vertical salini- ty distribution that was close to linear. The drag of the screen also helped keep the stratified fluid in uniform solid-body ro- tation. The actual salinity profile was measured by removing small samples and determining the index of refraction. Only run 3 was successful using this method, as it was unclear how linear the stratification was.
The above method was abandoned in favor of a more elab-
orate procedure (Figure 3). The fluid of the Med. side was introduced through a gravel-covered bottom 2 cm deep that was fed by a buried manifold with 0.2-cm-diameter holes facing downward. The salinity of the introduced fluid was linearly increased with time through use of the Oster method, the tanks of which were outside the rotating turntable. Fluid was fed to the turntable through a swivel connector. Fresh water was gradually added to the other tanks by hand to match the depth of the stratified fluid. This method gave a very reproducible stratification but had a poorer background for photography because of the gravel.
The experiment was started by removing the barrier in the strait. Within 2 or 3 s a flow at the surface was visibly entering the Mediterranean, and a counterflow near the bottom was leaving. Color pictures were then taken of various colored dyes injected at assorted points. The trajectories of the front of

WHITEHEAD: LABORATORY STUDY OF GYRES AND UPLIFT NEAR GIBRALTAR 7051
Plate 1. An experimental run in which the Med. was approximately one third the correctly scaled stratification. The camera was mounted above the tank, and the equivalent of Spain (north of the Straits) is toward the bottom of the picture, as in Figure 2. Above the Plexiglas "African" coast in the picture are two mirrors placed at a 45 ø angle: these yield a side view of the Med. (left) and sill and Atl. (right). In order to allow these mirror views to show gravitational force downward, corresponding to down in this page, the photographs were mounted with the equivalent of Spain at the bottom and Africa at the top. Thus geographical north (there is no planetary /5) is at the bottom of this and all subsequent photographs. Reddish-purple dye was injected at depths of 12, 16, and 20 cm (corresponding to 600, 800, and 1000 m) near the wall of Africa, and faint blue dye was injected at the top in the Atl. side of the strait. The blue dye is advected in as the gyre forms, and uplift of deep Med. water can be observed shortly after the gyre has formed. (a) At 71 s (corresponding to 116 hours or 4.8 days) after the gate is opened, uplift of red dye is visible along the southern coast (red arrow). (b) Sometime later, at 139 s (227 hours or 9.4 days) the deep-red-dyed Med. water reaches the strait and leaves the Med. (red arrow). More blue dye was added to the Atl. water, and it still curved to the fight (blue arrow). (c) By 155 s (253 hours or 10.$ days) it is clear that the gyre has filled the Alb. region (blue arrow). Red dye is leaving the strait (red arrows). Run number 4 in Table 1.
7052 WHITEHEAD' LABORATORY STUDY OF GYRES AND UPLIFT NEAR GIBRALTAR
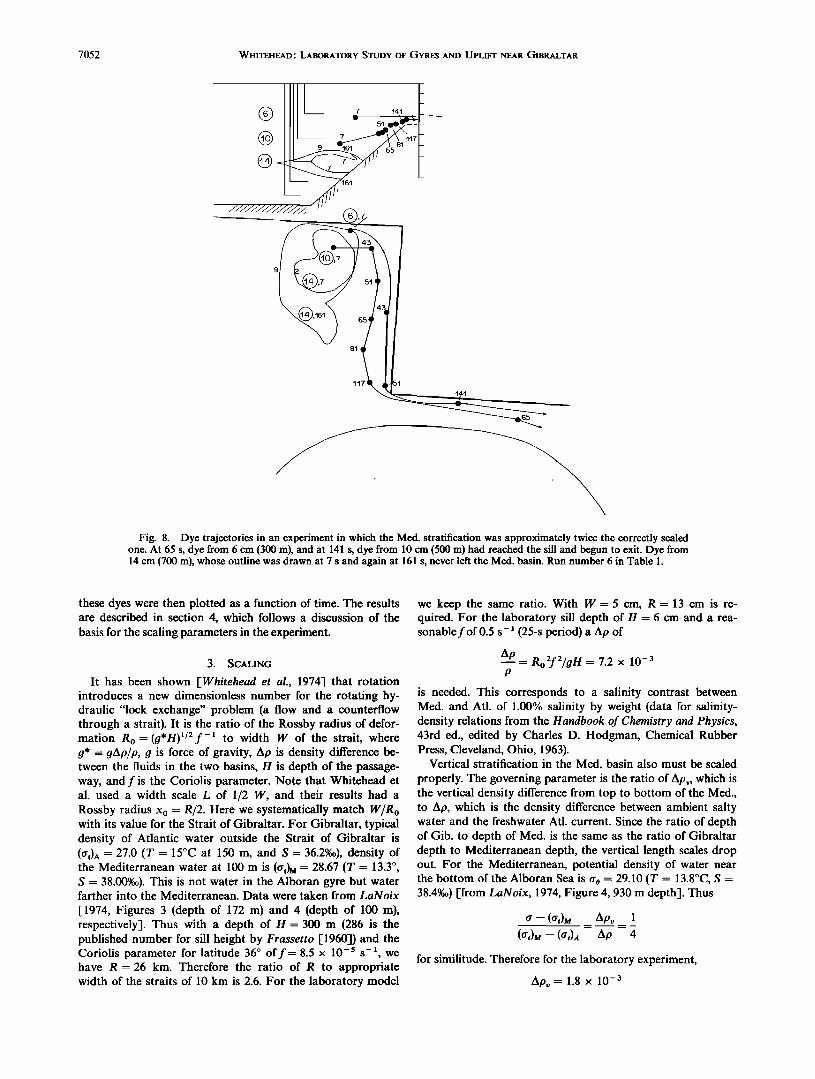
Fig. 8. Dye trajectories in an experiment in which the Med. stratification was approximately twice the correctly scaled one. At 65 s, dye from 6 cm (300 m), and at 141 s, dye from 10 cm (500 m) had reached the sill and begun to exit. Dye from 14 cm (700 m), whose outline was drawn at 7 s and again at 161 s, never left the Med. basin. Run number 6 in Table 1.
these dyes were then plotted as a function of time. The results are described in section 4, which follows a discussion of the basis for the scaling parameters in the experiment.
3. SCALING
It has been shown [Whitehead et al., 1974] that rotation introduces a new dimensionless number for the rotating hy- draulic "lock exchange" problem (a flow and a counterflow through a strait). It is the ratio of the Rossby radius of defor- mation R0 = (g*H)•/2f -• to width W of the strait, where g* = gAp/p, g is force of gravity, Ap is density difference be- tween the fluids in the two basins, H is depth of the passage- way, and f is the Coriolis parameter. Note that Whitehead et al. used a width scale L of 1/2 W, and their results had a Rossby radius x0 = R/2. Here we systematically match W/Ro with its value for the Strait of Gibraltar. For Gibraltar, typical density of Atlantic water outside the Strait of Gibraltar is (at) A = 27.0 (T = 15øC at 150 m, and S = 36.2% o), density of the Mediterranean water at 100 m is (at) M = 28.67 (T = 13.3 ø, S = 38.00%o). This is not water in the Alboran gyre but water farther into the Mediterranean. Data were taken from LaNoix
[1974, Figures 3 (depth of 172 m) and 4 (depth of 100 m), respectively]. Thus with a depth of H = 300 m (286 is the published number for sill height by Frassetto [1960]) and the Coriolis parameter for latitude 36 ø off= 8.5 x 10 -• s-•, we have R = 26 km. Therefore the ratio of R to appropriate width of the straits of 10 km is 2.6. For the laboratory model
we keep the same ratio. With W- 5 cm, R- 13 cm is re- quired. For the laboratory sill depth of H - 6 cm and a rea- sonabler of 0.5 s- • (25-s period) a Ap of
Ap - R02f2/g H = 7.2 x 10- 3
P
is needed. This corresponds to a salinity contrast between Med. and Atl. of 1.00% salinity by weight (data for salinity- density relations from the Handbook of Chemistry and Physics, 43rd ed., edited by Charles D. Hodgman, Chemical Rubber Press, Cleveland, Ohio, 1963).
Vertical stratification in the Med. basin also must be scaled
properly. The governing parameter is the ratio of Apv, which is the vertical density difference from top to bottom of the Med., to Ap, which is the density difference between ambient salty water and the freshwater Atl. current. Since the ratio of depth of Gib. to depth of Med. is the same as the ratio of Gibraltar depth to Mediterranean depth, the vertical length scales drop out. For the Mediterranean, potential density of water near the bottom of the Alboran Sea is ao = 29.10 (T = 13.8øC, S = 38.4%o) [from LaNoix, 1974, Figure 4, 930 m depth]. Thus
a - (at)M Apr 1
(at) • -- (at) A Ap 4
for similitude. Therefore for the laboratory experiment,
Apr = 1.8 x 10 -3

WHITEHEAD: LABORATORY STUDY OF GYRES AND UPLIFT NEAR GIBRALTAR 7053
Plate 2. An experimental run in which the Med. stratification was approximately correct. The dye sources were at depths of 6, 10, 14, 18, and 22 cm below the surface, corresponding to Mediterranean depths of 300, 500, 700, 900, and 1100 m. Each source injected dye of a particular color in a sequence from top to bottom of yellow, red, blue, black, and yellow. (a) At 57 s (93 hours or 3.9 days) the yellow dye from 6 cm (300 m) is leaving the Med., and red dye (red arrow) is almost uplifted out. (b) At 99 s (161 hours or 6.7 days) there is a steady withdrawal and flow of water from a depth of 6, 10, and 14 cm (300, 500, and 700 m) out of the Med. (red arrow). Note the turbulent current (blue arrow) plunging down in the Atl. basin, and going around the right-hand coast of Spain, and the blue-dyed gyre above (also shown in the streak photographs). Run 5 in Table 1.

7054 WHITEHEAD' LABORATORY STUDY OF GYRES AND UPLIFF NEAR GIBRALTAR
Fig. 9a
60 •
11o
120
Fig. 9b
Fig. 9. A repeat of the correctly scaled experiment (Figure 7). (a) Dye was suddenly injected into the incoming Atl. water shortly before 148 s, and the subsequent outlines of the dye traced up to 180 s. (b) A second repeat run to test consistency. Dye from 6, 12, and 15 em depth again was selectively withdrawn, dye from 20 em (outlined at 100 s) was not.

WHITEHEAD: LABORATORY STUDY OF GYRES AND UPLIFT NEAR GIBRALTAR 7055
Fig. 10. Outlines of two patches of dye at four subsequent times: one injected near the coast of Afr. (a column of dye produced by dropping potassium permanganate pellets) and one injected farther into the interior. On the left the solid outline is at 130 s, the dashed at 140 s. On the right the solid is at 150 s, the dashed at 160 s. The side-view mirror was at a different angle than other runs, so note the change in scale.
which corresponds to a salinity change from 1.00% by weight at the top to 1.25% by weight at the bottom. If this scaling is followed, and if selective withdrawal is due to suction from steady inertial currents, we expect the water to be selectively withdrawn from a depth in the Med. whose proportion to the depth of Gib. is the same as the depth of the selective with- drawal of the Mediterranean in proportion to the depth of Gibraltar.
For rotating inertial problems the time scale is f, the Co- riolis parameter. The laboratory experiment has a 25-s period, and this corresponds to a period of earth rotation of 24 hours divided by the sine of 36 ø or 40.8 hours. Thus, 1 s of labora- tory time corresponds to 1.63 hours in the Mediterranean.
4. THE EXPERIMENT
Final experimental runs from which data were taken are summarized in Table 1. Three general classes of experiments were done. In the first runs (1 + 2) the experimental procedure used by Whitehead and Miller [1979] of taking streak photo- graphs of surface pellets in black fluid was duplicated. These demonstrated the existence of a gyre of Atl. water when the coast of Afr. cut north-south and the absence of a gyre when an east-west false wall was present. In the second class (runs 3-7, 10, 13, 14, and 16) the stratification of the Med. was systematically varied to be less than, equal to, or greater than the scaled equivalent of the stratification of the Medi- terranean. The depths below surface for which dyed fluid was pulled up and over the sills are given in the table. In the third class (runs 8, 9, 11, and 12), artificial barriers were emplaced in
such a way as to stop or retard the Alb. gyre and to measure the effect of this on uplift. A small but systematic decrease of uplift was found when the gyre was absent. For runs 4-16, trajectories of the injected dye fronts were determined from the photographs and are shown in Figures 6-10 and 12-14.
Figure 4 shows some of the 6-s time exposures of run 1. To make these photographs, paper pellets were floated on top of the water, and the bottom of the container was painted black. In contrast to experiments by Nor [1978a, b], the jet of Atl. water did not deflect to the left but deflected to the right. As in Whitehead and Miller [1979], this generated a separation point in the Alb. side, and subsequently, the experimental Alb. gyre grew. At 4 min the Atl. water had encircled the Med. and impinged upon the gyre. A sidewall jet encircling the Med. basin and terminating the experiment by impinging on the gyre was familiar to us from previous experiments. Based on this, it was decided that the maximum time for which all subsequent experiments should be run would be 4 min. The features described here--a current initially deflecting to the right, the formation of a gyre, and the growth of an Alb. gyre from 30 s to about 4 min--were completely visible to us for all runs through the occasional use of paper pellets strewn on the surface.
It is useful to compare the gyre of Figure 4 with one infra- red image of the gyre in the Alboran Sea in Figure 5. It is similar to those in LaViolette [1984], and although one of the best images yet, poorer ones do not generally have an image of the gyre missing. In both this laboratory experiment and in the Alboran Sea, the gyres are robust, relatively steady coher- ent circulations that are clearly indicated by circulations of passive markers in the surface waters.
In the next experiments, numbers 3-7 and 10, 13, and 14,

7056 WHITEHEAD' LABORATORY STUDY OF GYRES AND UPLIFT NEAR GIBRALTAR
Fig. 11. Six-second time exposure of white pellets floating on water dyed black in Figure 4, but the Afr. coast continued straight east from the strait. The current went straight into the Med. There was no Alboran gyre formed. In the Atl. side a gyre formed off the west coast, near Por. ("Portugal"). Run number 2 in Table 1.
Time, Scaled Time, Scaled Time, Frame s hours days
a 8 13 0.5
b 58 95 3.9 c 108 176 7.3
d 158 258 10.7 e 208 339 14.1
f 258 421 17.5
WHITEHEAD: LABORATORY STUDY OF GYRES AND UPLIFT NEAR GIBRALTAR 7057
•'///////////////•
FALSE WALL _ __ 6 ½m DE .........
Fig. 12a
Fig. 12b
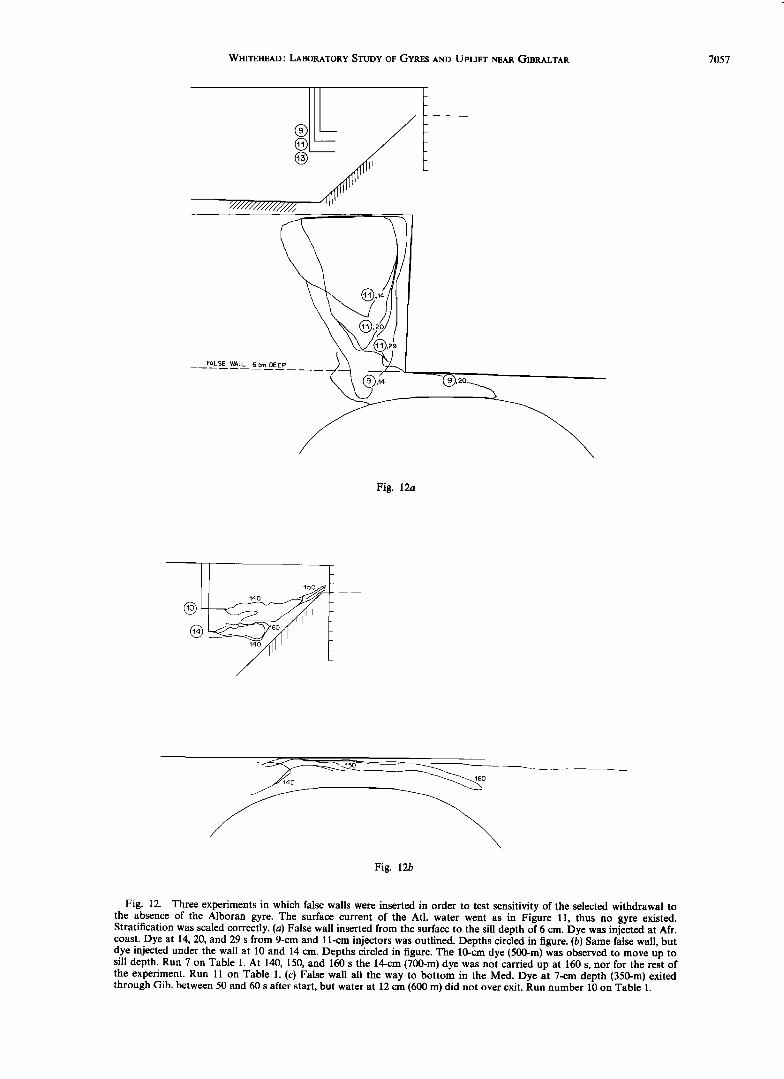
Fig. 12. Three experiments in which false walls were inserted in order to test sensitivity of the selected withdrawal to the absence of the Alboran gyre. The surface current of the Atl. water went as in Figure 11, thus no gyre existed. Stratification was scaled correctly. (a) False wall inserted from the surface to the sill depth of 6 cm. Dye was injected at Afr. coast. Dye at 14, 20, and 29 s from 9-cm and 11-cm injectors was outlined. Depths circled in figure. (b) Same false wall, but dye injected under the wall at 10 and 14 cm. Depths circled in figure. The 10-cm dye (500-m) was observed to move up to sill depth. Run 7 on Table 1. At 140, 150, and 160 s the 14-cm (700-m) dye was not carried up at 160 s, nor for the rest of the experiment. Run 11 on Table 1. (c) False wall all the way to bottom in the Med. Dye at 7-cm depth (350-m) exited through Gib. between 50 and 60 s after start, but water at 12 cm (600 m) did not over exit. Run number 10 on Table 1.

7058 WHITEHEAD: LABORATORY STUDY OF GYRES AND UPLIFT NEAR GIBRALTAR
Fig. 12c
the density differences caused by stratification in the Med. were made to be 0, 8, 25, and 50% of those resulting from the difference in salinity between Med. and Atl. As reviewed in section 3, the 25% stratification corresponds most closely to the actual situation in the Mediterranean. The 8% density difference has one third the stratification of the Medi-
terranean, and the 50% density difference has twice the strati- fication. In order to visualize flows in the interior of the Med., a number of injection tubes were located at different levels. These were fed with a slow supply of dyed salty water, that water being prepared by withdrawing an in situ sample of water after the stratified water is emplaced in the Med., by then dying the sample, and finally by allowing a slow return of the dyed water through the injection tube during the experi- ment. Prior to these runs, the floors were painted white to allow the dyes to be readily visible from above.
Although the complete set of experiments was photo- graphed in color, the photographs are generally not useful for understanding the sequence of events because the time se- quence of the movement of the dye is more useful than the instantaneous position of the dye as revealed by a single pho- tograph. However, two color plates have been included to show the best photographs. Plate 1 shows a sequence of these photographs in which red dye is injected at three depths in the Med., and blue dye is injected at Gib. The blue dye flows into
the Med. and reveals the surface gyre. The scaled stratification is one third of the most correct stratification. It is apparent in the side-view mirror that red dye is substantially uplifted into Gib.
Plate 2 shows what we consider to be the best photograph of the complete flow pattern with the correctly scaled stratifi- cation. The yellow, red, and blue dyes from 6, 10, and 14 cm depth are strongly drawn up and out of Gib.
In all, 388 color slides and 72 black-and-white streak photo- graphs were taken. To analyze them, positions of the forward edge of the dye or outlines of the dye were plotted on a master chart for each of the runs 4-16. The results of all experiments are summarized in Table 1. Ten figures of the dye trajectories, copied directly from the master charts, are presented here. Information about the parameters of the runs and of the re- sults are included in the captions. There are three classes of experiments. In the first (Plates 1 and 2 and Figures 6-9), dye was injected near the coast of Afr. Plate 1 and Figure 6, Plate 2 and Figures 7, 8, and 9 show dye trajectories for runs in which stratification was one third, the same as, and twice the correctly scaled value, respectively. There was clearly the most uplift in the most weakly stratified case, least for the most stratified.
The most important run is run 5 (Plate 2 and Figure 7) with the correct stratification. Uplift from the equivalent of 700 m

WHITEHEAD: LABORATORY STUDY OF GYRES AND UPLIFT NEAR GIBRALTAR 7059
9 54
62
Fig. 13. A run in which there was a small barrier (the dye holder) that visibly exerted drag and hence decreased the strength of the upper gyre. Stratification was scaled correctly. Dye from 9 cm (450 m) was selectively withdrawn, dye from 11 cm (550 m) and 13 cm (650 m) was not. Run 9 on Table 1.
depth was observed, uplift from the equivalent of 900 m depth did not take place. These important observations were con- firmed later by three more runs (10, 12, and 16), which served as reproducibility checks. Their results are shown in Figures 9(a, b) and 10.
For all the runs with the correct scaling, the most dramatic uplift is visible at the coast of Afr. from depths as great as the equivalent of 750 m but less than 900 m. The plume of uplifted water moved up the slope and then across the slope to the channel that served as Gib.
The role of uplift near the Afr. coast is highlighted by Figure 10, in which dye was emplaced close to Gib. (but off- shore, in deep water), and later some pellets of potassium permanganate were dropped near the coast of Afr. The pellets left a vertical columnar cloud of dye whose outline was traced, and the column was clearly lifted up and out. In contrast the patch of dye near but offshore of Gib. was relatively quiet.
The coupling between the surface gyre and the deep Med. water going out appears to be important, but its nature is not yet understood. Dyed water, denoting the gyre, is visible in Plate 1, and its trajectory is shown in Figure 6. Selective with- drawal precedes the arrival of the dyed water, but perhaps it does not precede the first arrival of Atl. water to the coast of Afr. Selective withdrawal occurring nearly simultaneously with the formation of the Alb. gyre is consistent with the data,
but whether the two are completely interrelated is not com- pletely clear.
Because of these questions, further experiments were done in which false walls were emplaced so that the surface gyre was either weaker or nonexistent. In addition, dye was inject- ed at different places. These runs (8, 9, 11, and 12) made it clear that the most dramatic uplift of dye was visible at the coast of Afr. rather than offshore of Gib. and most strongly in conjunction only with the Alb. gyre.
The consequence of a false wall to the Alb. gyre is clear. A false wall was emplaced as shown by the long double-dashed line in Figure 2. A 6-s time-lapse exposure of white particles over a black bottom is given in Figure 11. No gyre was formed, and there was no deflection of the Alb. jet to the left or right. The current went straight into and along the (false) Afr. coast.
Figure 12(a-c) (runs 8, 12, and 11) shows dye trajectories for three false wall experiments. Selective withdrawal was from less than the equivalent of 650, 700, and 600 m, respectively, which is smaller than the 900 m for the experiments without false walls (i.e., with the gyre), but not dramatically so. Figure 13 shows a run in which a barrier decreased the strength of the gyre. Selective withdrawal was from less than 11 cm (550 m). Finally, a run was done with no rotation. Selective with- drawal was from less than 16 cm (800 m) (see Figure 14).

7060 WHITEHEAD: LABORATORY STUDY OF GYRES AND UPLIFT NEAR GIBRALTAR
40
ZO
4O
Fig. 14. Test experiment with no rotation. Dye from 11 cm (550 m) was selectively withdrawn, dye from 16 cm (800 m) and 18 cm (900 m) was not.
5. SUMMARY
Laboratory experiments scaled to duplicate inertial currents exhibit selective withdrawal consistent with that observed in
the Alboran Sea. Uplift is strongest at the Afr. coast, where water was lifted up the sloping topography and then appar- ently flowed along contours of constant depth to Gib. There is evidence that the gyre in the Alb. helped enhance a selective withdrawal of stratified water up to the Strait of Gibraltar. Without the gyre, selective withdrawal was from less than the equivalent of 700 m depth. With the gyre it was greater than 700 m but less than 900 m depth. This is shallower than the depth of 1100 observed by Bryden and Storereel [1982]. Possi- bly tidal and temporal fluctuations in Gibraltar provide ad- ditional forcing of selective withdrawal. Alternatively, the transformation from continuous and complicated ocean strati- fication to two-layer linear laboratory stratification may intro- duce discrepancies of a couple of hundred meters.
In any case the laboratory experiments exhibit to lowest order the behavior of the Gibraltar/Alboran/Mediterranean flows. They are instructive examples of some of the novel effects of inertial hydraulics of rotating stratified fluids.
Acknowled•Trnents. Harry Bryden and Henry Stommel watched many of the experiments and provided useful suggestions. Robert Frazel constructed the apparatus and provided irreplaceable assist- ance. Research was supported by ONR contract N00014-82-C-0019, NR 083-004. This paper is Woods Hole Oceanographic Institution contribution 5596.
REFERENCES
Bryden, H. L., and H. M. Stommel, Origins of the Mediterranean outflow, J. Mar. Res., 40(suppl.), 55-71, 1982.
Frassetto, R., A preliminary survey of the thermal microstructure in the Straits of Gibraltar, Deep-Sea Res., 7(3), 156-162, 1960.
Imberger, J., Two-dimensional sink flow of a stratified fluid contained in a duct, J. Fluid Mech., 53(2), 329-349, 1972.
LaNoix, F., Project Alboran, Etude Hydrologique et Dynamique de la Mer D'Alboran, Rep. 66, NATO, Brussels, Belgium, 1974.
LaViolette, P. E., The advection of submesoscale thermal features in the Alboran Sea gyre, J. Phys. Oceano•Tr., 14(3), 550-565, 1984.
Nof, D., On geostrophic adjustment in sea straits and wide estuaries: Theory and laboratory experiments, 1, One-layer system, J. Phys. Oceano•Tr., 8(4), 690-702, 1978a.
Nof, D., On geostrophic adjustment in sea straits and wide estuaries: Theory and laboratory experiments, 2, Two-layer system, J. Phys. Oceano•Tr., 8(5), 861-872, 1978b.
Stommel, H. M., H. Bryden, and P. Mangelsdorf, Does some of the Mediterranean outflow come from great depth?, Pure Apl. Geo- phys., 105, 874-889, 1973.
Whitehead, John A., Jr., Selective withdrawal of rotating stratified fluid, Dyn. Atrnos. Oceans, 5, 123-135, 1980.
Whitehead, J. A., Jr., The deflection of a baroclinic jet by a wall in a rotating fluid, J. Fluid Mech., in press, 1985.
Whitehead, J. A., Jr., and A. R. Miller, Laboratory simulation of the gyre in the Alboran Sea, J. Geophys. Res., 84(C7), 3733-3742, 1979.
Whitehead, J. A., A. Leetmaa, and R. A. Knox, Rotating hydraulics of strait and sill flows, Geophys. Fluid Dyn., 6, 101-125, 1974.
J. A. Whitehead, Jr., Department of Physical Oceanography, Woods Hole Oceanographic Institution, Woods Hole, MA 02543.
(Received October 15, 1984; accepted January 24, 1985.)