a logical state model of reentrant ventricular activation
TRANSCRIPT

344 IEEE TRANSACTIONS ON BIOMEDICAL ENGINEERING. VOL. 31. NO. 4, APRIL 1990
A Logical State Model of Reentrant Ventricular Activation
MARK RESTIVO, MEMBER, IEEE, WILLIAM CRAELIUS, MEMBER, IEEE, WILLIAM B. GOUGH, AND
NABIL EL-SHERIF
Aktracf-The ventricular surface of the heart was modeled as two- dimensional, 4096 element, network of cells connected logically to each other. An ischemic area was represented by a central core of prolonged refractoriness, distributed into eccentrically-layered elliptical con- tours such that refractoriness declined along varying gradients to the surrounding normal area. Propagation of cardiac action potentials was simulated by five sequential states ranging from activation to inacti- vation. Reentrant activation was induced by premature stimulation of the network and resembled a “figure 8” type reentry seen experimen- tally. Activation patterns of reentry appeared as two propagation wavefronts which traveled around the ends of a continuous line of functional conduction block, merged into a single wavefront, then con- ducted slowly along a retrograde path to reactivate a region proximal to the block. Reentry could be prevented by modifying the distribution of recovery of excitability through stimulation at two strategically lo- cated sites during basic rhythm. Prevention occurred when the second site was situated in an area of prolonged refractoriness, just distal to the line of block. These simulations indicate that reentrant activation is characterized by the formation of long lines of conduction block which occur along a border of steeply graded refractoriness, and ret- rograde slow conduction which occurs along a more shallow refractory gradient. The occurrence of reentry is dependent on: 1) the coupling interval of the premature stimulus, 2) the location of the stimulus rel- ative to the maximum refractory gradient, and 3) the activation se- quence of the basic paced beats. Thus, this paper presents an efficient logical state model of cardiac activation which simulates experimen- tally observed activation patterns of reentry and its prevention.
I . INTRODUCTION N EXPERIMENTAL model of myocardial infarction A has been developed in which reentrant activation can
be studied in an essentially two-dimensional ischemic epicardial conducting surface [ 11, [2]. Mapping studies of this model have shown that the reentrant circuit has a characteristic “figure 8” pattern whereby two wavefronts circulate in opposite directions around two arcs of func- tional conduction block, merge into a slowly conducting wavefront, then divide into two wavefronts upon reacti- vation [ 11-[4]. The electrophysiological substrate of reen- try in this model has been characterized by a spatially nonuniform refractory distribution in which refractoriness increases monotonically towards the infarct core and ap- pears as eccentrically-layered contours on the ventricular surface [3]. Arcs of functional conduction block, which
Manuscript received May 27, 1988; revised July 6 , 1989. This work was supported by the National Institutes Of Health Grant R01-HL36680 and the Veterans Administration Medical Research Funds.
The authors are with Brooklyn Veteran’s Administration and State Uni- versity of New York Health Science Medical Centers, Brooklyn, NY 11209.
IEEE Log Number 8933592.
formed during stimulation at a shortly coupled interval, were found to correlate with contiguous zones of mark- edly prolonged refractoriness [3].
In a preliminary report, we have shown that reentry could be initiated in a two-dimensional sheet of 256 con- ducting elements [5] . Conduction block and reactivation occurred during prematurely stimulated beats between re- gions of dissimilar refractoriness. A computer model of ventricular activation based on the above mentioned ani- mal model of reentry will be presented here. Both the range and spatial distribution of functional electrophys- iological parameters will be derived from available ex- perimental evidence. We will show, using realistic func- tional parameters, activation patterns which are similar in timing and morphology to a variety of experimental ob- servations.
11. THE MODEL Cardiac Activation Algorithm
Cardiac activation was simulated using a logical state algorithm and implemented in Pascal. The basic input pa- rameters consist of: l) spatially distributed refractoriness, 2) propagation delay as a function of activation interval and, 3) programmed stimulation sequence at multiple sites. Output can be displayed as either: 1) a printout of the individual activation times following each activation cycle, 2) an isochronal activation map, or 3) a dynamic activation sequence on a computer graphics terminal.
The model was configured as a 64 x 64 finite element array, in which each element represented a 2 x 2 mm region of cardiac tissue. The dimension of the entire net- work is 12.8 X 12.8 cm. Fig. 1 illustrates the logical connection of eight adjacent neighbors. The state of an element at time t , is a function of the state of the element and its neighbors at time, t - 1 time step, and defined by the following relation:
S(x, Y , t )
= f[S(x, Y , t - I ) , S(x - 1, y - 1, t - l ) ,
qx, y - 1, t - I ) ,
S(x + 1, y - 1, t - l ) , S(x - 1, y , t - 1)
S(x + 1, Y , t - 0, S(x - 1, y + 1, t - l ) , S ( x , y + 1, t - I ) ,
S(x + 1, y + 1, t - l ) ] ( 1 )
001 8-9294/90/0400-0344$01 .OO @ 1990 IEEE

RESTIVO er al..: MODEL OF REENTRANT VENTRICULAR ACTIVATION
A R
345
RR R E C
x - l , Y + 1
\
A R E C R
x - 1 , Y - RR R E C A R
I
x-1 , Y - 1
X , Y + 1
I
' X , Y - +
X , Y - 1
X + l , Y + l
4
b X + 1 , Y
\
X + l , Y - 1
Fig. 1 . Each element communicates with nearest eight neighbors.
where S represents state, x and y define position in the network, and t is time. An internal timer for each element is responsible for updating time dependent changes in state at 100 ps intervals.
There are five sequential logical states for each element which mimic propagation of the cardiac action potential. They are
1) recovered (REC) 2) ready (R) 3 ) phase 0 (Po) 4) absolute refractory (AR) 5 ) relative refractory (RR)
Propagation of an action potential to a neighboring ele- ment occurs during phase 0 if the neighboring element is either recovered or relative refractory. Fig. 2 illustrates the three possible consequences during phase 0. For com- parison, two action potentials are shown below each state sequence.
The top panel illustrates propagation of an action po- tential from cell A to cell B . In this case, cell A is active (Po) at time t when cell B is recovered. At time t + 1, cell B is set to the ready state. During the ready state, a baseline delay period must pass before cell B enters the phase 0 state. For diagonal elements ( [X - 1, Y - 13, [X - 1, Y + 11, [ X + 1, Y - I ] , [X + 1, Y + 11) the duration of the ready state is factored by the square root of 2. Following phase 0, the cell immediately enters the absolute refractory state during which propagation is im- possible. Such a case is illustrated in the middle panel in which conduction block occurred between A and B be- cause cell B was in an absolute refractory state. Following the absolute refractory state, a cell enters the relative re- fractory state. As shown in the lower panel, propagation during this state occurs following an additional delay dur- ing the ready state. The duration of the ready state in- cludes the baseline delay ulus a comuuted uroDagation de-
.
d Po
1 #PO
A R RR R E C
~
I I Y mum propagation delay, obtained from the upper curve,
* PO
A R RR R E C
A R RR
Fig. 2. Possible activation sequences. Top panel: normal conduction. Middle panel: conduction block. Lower panel: conduction with delay.
lay. The computed propagation delay, shown in the lower right panel of Fig. 3 and detailed below, is a linear func- tion of the interval between the last phase 0 of cell B and the onset of phase 0 at cell A .
Maximum propagation delay for each cell during the relative refractory period is a function of its absolute re- fractory period (ARP). The upper right panel of Fig. 3 shows a linear relation exists between delay and refrac- toriness in the region between two selectable points and constant for ARP values outside this range.
The lower right panel of Fig. 3 shows that the maxi-

346 IEEE TRANSACTIONS ON BIOMEDICAL ENGINEERING, VOL. 37, NO. 4, APRIL 1990
> ARP c -
2 Y
X POSITION
X 4
‘1 0
m 3
n 0 Y
’>
e e 4
U
w U
ABSOLUTE REFRACTORY PERIOD (msec)
RELATIVE REFRACTORY PERIOD -1,
0 10 20 30 40 50
TIME FOLLOWING ARP (msec)
Fig. 3 . Activation model parameters. Top left: refractory gradients aiong network midline (see dotted line in lower left panel). Bottom left: ab- solute refractory period pattern. Top right: maximum propagation delay as a function of refractoriness. Bottom right: propagation delay follow- ing absolute refractory period.
occurs at the beginning of the relative refractory period. Propagation delay then decreases linearly with time to a baseline delay value. The duration of the relative refrac- tory period for the simulations shown here was 30-40 ms.
Refractoriness Distribution ARP values are assigned to the elements based on a
two-dimensional spatial function. ARP is arranged as ec- centrically layered ellipsoids as determined by a selection of 1) maximum ARP value (ARP,,,),2) baseline ARP value (ARPbl) in the region surrounding the outermost ARP contour, 3) position (xm, y , ) of ARP,,,, and 4) the maximum and minimum ARP gradients along the hori- zontal midline ( y = y,). The upper left panel of Fig. 3 shows that ARP is a linear function of position at the mid- line. The centroid of each elliptical segment is defined as the midpoint between points of equal ARP, (xl , y m ) and ( x 2 , y m ) . The major and minor axes, a and b, respec- tively, of elliptical contours can also be selected. A rep- resentative ARP pattern, shown in the lower left panel, was defined by the following relations:
ARP = F ( x , y ) = (x - xcy /a2 + ( y - y,.y/b2
where
and xc = (XI + x 2 ) / 2 ( 3 )
Y c = Y m . (4)
Programmed Stimulation Stimulation can be applied at various intervals, at any
number of sites. The stimulation sequence and corre-
sponding sites of stimulation input can be permanently stored as files and retrieved for activation simulations. External stimuli are treated in the same manner by which an action signal is transmitted between adjacent cells. Following detection of an externally applied stimuli, the appropriate elements are tested for present state and the possible propagation sequences are the same as shown in Fig. 2.
111. RESULTS
Initiation of Reentry
Fig. 4 shows premature stimulation of a nonuniform refractory network resulted in a reentrant response. A core of prolonged ARP, arranged in eccentric elliptical con- tours at 20 ms intervals, is shown in the lower left panel of Fig. 4. The maximum value of ARP was 250 ms which decreased rapidly along a 60.0 ms/mm gradient- directly opposite the stimulation site, and more gradually along a 3.33 ms/mm gradient at the lower portion of the map. ARP values in the surrounding “normal” area were 131 ms.
All stimuli were applied from the same site, eight cell units from the top of the map, along the vertical midline. The upper left map shows a basic paced beat S, applied when all elements were completely recovered, resulted in a uniform activation wavefront which propagated at the baseline delay.
A premature stimulus S2 was then applied 150 ms fol- lowing SI . Since this coupling interval was shorter than the longest ARP in the network, portions of the network

RESTIVO rt al. .: MODEL OF REENTRANT VENTRICULAR ACTIVATION 347
5.
R P UP + BLOCK I/ ---
V
Fig. 4. Initiation of reentry by premature stimulation. Sites of stimulation are depicted by solid circles in the activation maps (S,, S 2 , Vi ). Line of conduction block is depicted by heavy line in Sz, Vi and RP + BLOCK maps. Isochrone of reactivation contained within dotted line.
had not recovered excitability from the previous S , beat. Within 23 ms, the premature activation wavefront en- countered a zone of absolute refractory elements forming a continuous line of functional conduction block, depicted by the heavy line in the S2 map. Two activation wave- fronts then proceeded rapidly around the line of block and region of prolonged ARP and merged within 100 ms. A slow activation wavefront, shown by the arrows, then proceeded retrogradely through the region of prolonged ARP, along a shallow ARP gradient. As a result of the propagation delay incurred in this region, the maximum difference in activation time across the line of block was 143 ms, which exceeded the 131 ms refractory period on the proximal side of the line of block. Thus, reactivation, shown by the arrows, occurred proximal to the line of block; the isochrone of reactivation, 161-180 ms, is in- dicated by the dotted contour.
The upper right map VI shows the first unstimulated reentrant response following S,. During this beat and suc- cessive reentrant beats, two wavefronts circulated in op- posite directions around two lines of conduction block in a characteristic “figure 8” pattern.
The lower right panel of Fig. 4 shows the continuous line of functional conduction block from the S2 map sup- terimposed on the ARP distribution. The diffcrence in ARP across the block during the 40 ms isochrone of S2 was 12-120 ms, the largest difference being at the center of the line of block. The line of block ended when the S, activation interval exceeded the ARP of adjacent ele- ments. Slow conduction occurred as the two wavefronts encountered relative refractory regions around the end- points of the line of block.
Window of Inducibility The range of premature coupling intervals which initi-
ate a reentrant response is termed window of inducibility. Fig. 5 shows reentrant responses initiated at SI-S2 inter- vals of 150 and 160 ms and no response at 170 ms. The ARP pattern, shown in the lower right panel, was the same as seen in Fig. 4.
The upper left panel of Fig. 5 (identical to the S, map seen in Fig. 4) shows the formation of a line of conduc- tion block and reactivation following an SI-& interval of 150 ms. Block also occurred within 23 ms following an SI-Sz interval of 160 ms (upper right panel), but S2 con- duction in the region of prolonged ARP was improved relative to the 150 ms interval. Although total activation time was the same, the time of reactivation was delayed and the site of earliest reactivation shifted toward the cen- ter of the line of block. The maximum difference in acti- vation time across the line of block was 134 ms, only 3 ms longer than the expiration of refractoriness. Folkowing an Sl-S2 interval of 170 ms, the length of the line of block and total conduction time were further reduced and reen- try did not occur. Reactivation in this instance was im- possible because the maximum difference in activation time across the line of block was only 119 ms which was 11 ms earlier than expiration of refractoriness on the prox- imal border.
Site of Stimulation The role of stimulus location to the initiation of reentry
was examined by applying stimuli at three locations: op- posite the maximum ARP gradient, opposite the mini-

348 IEEE TRANSACTIONS ON BIOMEDICAL ENGINEERING, VOL. 31, NO. 4, APRIL 1990
I J I
I \
Fig. 5 . Window of inducible reentry.
mum ARP gradient, and at the lateral border of the region of prolonged ARP. The S1-S2 coupling interval for the examples shown in Fig. 6 was 150 ms, applied to an ARP pattern with minimum and maximum ARP gradients of 3.16 ms/mm and 65.0 ms/mm, respectively. For each stimulus location tested, a corresponding recovery time map constructed. Recovery time, or recovery of excita- bility relative to SI activation, is the sum of S1 activation time and ARP for that element and precisely defines the earliest time following S1 that a site may be reactivated.
The top row of Fig. 6 shows activation maps following stimulation opposite the maximum ARP gradient. SI ac- tivation propagated across the maximum refractory gra- dient and down the minimum gradient. For a baseline propagation delay of 1 ms/element, the SI activation gra- dient was 0.5 ms/mm. Therefore, the maximum recovery gradient was 0.5 ms/mm greater than the maximum ARP gradient and 0.5 ms/mm less than the minimum ARP gradient. S, conduction block occurred 23 ms following S2 and the total activation time was 164 ms. The maxi- mum difference in activation time across the line of block was 148 ms; reactivation occurred 139 ms following S2.
The middle row of Fig. 6 shows that reentry did not occur when stimulation was applied opposite the mini- mum ARP gradient. In this case, the S1 activation gra- dient increased the minimum recovery gradient and de- creased the maximum gradient by 0.5 ms/mm. Conduction did not block across from the site of stimu- lation, along the minimum recovery gradient, but slowed considerably compared with the previous example. Total activation time was 18 ms longer than the previous ex- ample, taking 182 ms to activate the last site immediately distal to the block. The activation wavefront reached op- posite site, proximal to the line of block, at 64 ms. This
difference in activation time across the line of block, 118 ms, did not permit reactivation.
Reentry did occur when stimulation was applied at the lateral aspect of the region of prolonged ARP, as shown in the lower row. Since SI propagation was perpendicular to the minimum and maximum refractory gradients, the recovery gradients were the same as the corresponding ARP gradients. The S2 wavefront encountered a line of conduction block within 10 ms. The activation wavefront conducted slowly though the region of prolonged ARP re- sulting in a total activation time of 182 ms. Activation arrived at the site of the maximum refractory gradient at 3 1 ms. The maximum difference in activation time across the line of block was 143.
Prevention of Reentry by Dual S, Stimulation Recovery of excitability during premature excitation
depends on the prior SI activation time and refractoriness. Hence, modification of the S1 activation sequence may influence the likelihood of both conduction block and reentry. The following simulations will illustrate a method whereby proper application of two stimuli during SI can prevent the induction of reentry through a different im- provement in conduction during S,.
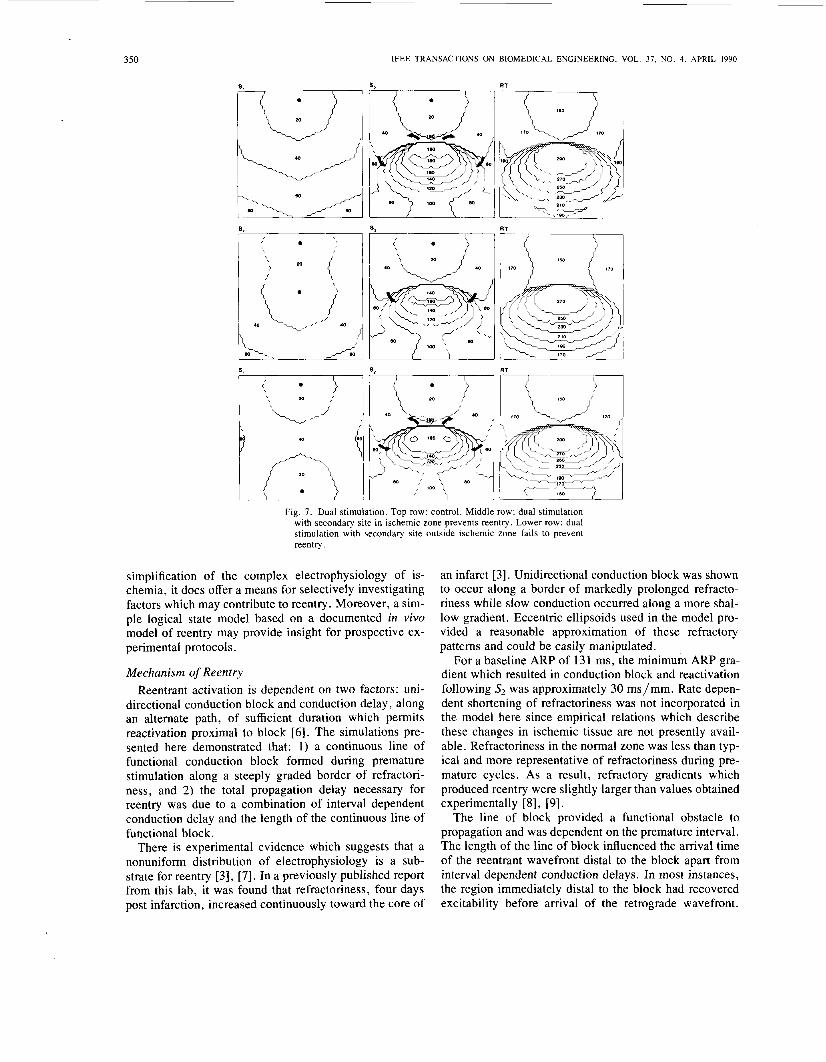
The control sequence is shown in the upper row of Fig. 7, in which reentry was initiated by an S,-S, coupling of 160 ms. The minimum and maximum ARP gradients were 2.7 ms/mm and 59.5 ms/mm, respectively. A line of functional conduction block formed during the 40 ms is- ochrone of S2 and corresponded with the steep recovery time gradient in the control RT map. S, activation at the distal border of the line of block occurred 136 ms follow- ing the initial block. Reactivation occurred 160 ms fol- lowing the S2 stimulus, or 340 ms following SI. The max- imum value of recovery time in the array was 286 ms and the recovery time dispersion was 154 ms.
Simultaneous dual SI stimulation, applied to the same refractory pattern, is shown in the middle row of Fig. 7. The primary, or control site, was identical to control. The secondary SI site was located in a region of prolonged refractoriness. S, stimulation was applied only from the control site, but at the same interval which initiated reen- try during control. Since the S1-S2 interval far exceeded recovery time in the normal zone, the S2 activation se- quence in the normal zone was very similar to control. Block occurred at the same time following S2. However, note that the S2 activation isochrones within the region of prolonged recovery time were less crowded than in con- trol, which indicates an improvement in S2 conduction. Reentry was prevented because activation at the distal border of the line of block was 20 ms earlier than in con- trol.
Dual stimulation reduced the maximum recovery time from 286 to 262 ms and the total dispersion was from 154 to 130 ms. The minimum recovery time value, 132 ms, was the same during control and dual stimulation. Thus, dual stimulation resulted in a differential improvement of recovery time within the network. Since sites within the

RESTIVO er U / . .: MODEL OF REENTRANT VENTRICULAR ACTIVATION 349
I I
R I
S. RT s.
Fig. 6 . Effect of site of stimulation. Top row: stimulation along maximum refractory gradient. Middle row: stimulation along minimum refractory gradient. Lower row: stimulation perpendicular to maximum and mini- mum refractory gradients
normal zone were completely recovered during control, the reduction in recovery time by dual stimulation did not greatly alter S2 activation in that region. Reduced recov- ery time values within the region of prolonged ARP did result in early activation distal to the line to block. There- fore, dual stimulation prevented reentry though a differ- ential reduction in the activation time difference across the line of block.
Successful prevention of reentry by dual stimulation de- pended on the location of the secondary site. The lower row of Fig. 7 shows dual stimulation at an inappropriate site failed to prevent the initiation of reentry. The refrac- tory pattern, primary site, and premature coupling inter- val were identical to the preceding two examples. The secondary site selected was distal to the line of block shown in the control S2 map, but 28 cell units from the initial site of block. The S2 activation wavefront arrived at the distal border 307 ms following SI for an activation time difference across the line of block of 135 ms. This interval was greater than ARP proximal to the line of block and reactivation occurred at the same time as in control.
For this dual stimulation sequence, the recovery time map was modified only slightly from control. The maxi- mum recovery time value was 283 ms only 3 ms shorter
than control. The maximum dispersion in recovery time was 151 ms. Although some improvement in recovery time was seen at the entrance to the retrograde pathway, the recovery time values in those regions during control were shorter than the SI-& interval. Therefore, the re- duction in recovery time of these sites was inconsequen- tial.
IV. DISCUSSION The results of this study demonstrated that reentrant
rhythms could be initiated in a network of finite-dimen- sional cardiac elements. The most basic electrophysiolog- ical parameters which define the cardiac activation pro- cess, conduction velocity and refractoriness, and the spatial distribution of these parameters were sufficient for producing reentrant activation. By using physiologically realistic values of refractoriness and conduction, the re- sultant activation patterns were strikingly similar in both morphology and timing to a variety of results observed experimentally.
The electrophysiological consequences of myocardial ischemia are complex. The model parameters were based only on an understanding of certain factors believed to support reentry. While this computer model is a gross
350 BIOMEDICAL ENGINEERING. VOL. 37. NO. 4. APRIL 1990 IEEE TRANSACTlONS ON
S.
R 1
n I 1 I ,
Fig. 7. Dual stimulation. Top row: control. Middle row: dual stimulation with secondary site in ischemic zone prevents reentry. Lower row: dual stimulation with secondary site outside ischemic zone fails to prevent reentry.
simplification of the complex electrophysiology of is- chemia, it does offer a means for selectively investigating factors which may contribute to reentry. Moreover, a sim- ple logical state model based on a documented in vivo model of reentry may provide insight for prospective ex- perimental protocols.
Mechanism of Reentry Reentrant activation is dependent on two factors: uni-
directional conduction block and conduction delay, along an alternate path, of sufficient duration which permits reactivation proximal to block [6]. The simulations pre- sented here demonstrated that: 1) a continuous line of functional conduction block formed during premature stimulation along a steeply graded border of refractori- ness, and 2) the total propagation delay necessary for reentry was due to a combination of interval dependent conduction delay and the length of the continuous line of functional block.
There is experimental evidence which suggests that a nonuniform distribution of electrophysiology is a sub- strate for reentry [3], [7]. In a previously published report from this lab, it was found that refractoriness, four days post infarction, increased continuously toward the core of
an infarct [3]. Unidirectional conduction block was shown to occur along a border of markedly prolonged refracto- riness while slow conduction occurred along a more shal- low gradient. Eccentric ellipsoids used in the model pro- vided a reasonable approximation of these refractory patterns and could be easily manipulated.
For a baseline ARP of 13 1 ms, the minimum ARP gra- dient which resulted in conduction block and reactivation following S, was approximately 30 ms/mm. Rate depen- dent shortening of refractoriness was not incorporated in the model here since empirical relations which describe these changes in ischemic tissue are not presently avail- able. Refractoriness in the normal zone was less than typ- ical and more representative of refractoriness during pre- mature cycles. As a result, refractory gradients which produced reentry were slightly larger than values obtained experimentally [8], [9].
The line of block provided a functional obstacle to propagation and was dependent on the premature interval. The length of the line of block influenced the arrival time of the reentrant wavefront distal to the block apart from interval dependent conduction delays. In most instances, the region immediately distal to the block had recovered excitability before arrival of the retrograde wavefront.

RESTIVO er al. .: MODEL OF REENTRANT VENTRICULAR ACTIVATION 35 1
Thus, an excitable gap existed within the reentrant cir- cuit.
Very slow nonuniform conduction occurred during the simulations even though the minimum intrinsic conduc- tion velocity was limited to 0.2 m/s . There is evidence which indicates that cardiac activation is not a smooth process but the result of discretely coupled events and at- tributed to the discrete nature of cell to cell coupling [ 101. Very slow conduction occurred in the simulations apart from imposed structural abnormalities but as a result of inhomogeneities in recovery time or tortuous conduction around localized regions of functions conduction block.
In Vivo Correlates Although this finite element model of cardiac activation
simplifies many aspects of cardiac activation, the activa- tion patterns shown in this report correlated with a num- ber of verifiable perturbations of an vivo model of reen- try. These were: 1) window of inducible reentry, 2) effect of stimulus location, and 3 ) prevention of reentry by dual site stimulation.
It is well known that the probability or reentry, induced by programmed electrical stimulation, increases at shorter coupling intervals. Mapping studies have shown that the extent of conduction block increases at shorter intervals [2], [3]. This was also demonstrated in the simulations. Both the extent of conduction block and total propagation delay necessary for reentry occurred within a range of premature intervals.
The site of premature stimulation has been associated with susceptibility to reentry [ l I], 1121. In a preliminary report, the stimulus location relative to a zone of graded refractoriness was shown in influence the likelihood of reentry [12]. As seen in Fig. 6, similar results were sim- ulated by the computer model. Stimulation opposite the region of markedly graded refractoriness resulted in a higher probability of reentry. When premature stimuli were applied opposite the shallow refractory gradient, the line of block did not rotate and still formed along the max- imum refractory gradient. Recovery of excitability, rela- tive to the stimulation site, depends on refractoriness and the SI activation interval. Changes in recovery time gra- dients, relative to the SI site, were also shown to influence premature conduction patterns.
The importance of recovery time distribution was clearly illustrated by dual S , stimulation. Application of a second stimuli during SI altered the sequence of recov- ery encountered during a premature beat. Proper place- ment of the secondary site prevented reentry by reducing the gradient of recovery time across the line of block and reducing the recovery gradient along the slow conducting retrograde pathway. As a result, activation distal to the line of block could occur prior to recovery of excitability proximal to block. Failure at a secondary site distant from the region of reactivation was due to an insufficient re- covery time reduction at the core of the slow conduction pathway.
Similarly, dual SI stimulation has been shown as an ef-
fective method for the prevention of reentry in the is- chemic canine heart [13]. That study showed that the op- timal secondary site should be distal to the line of conduction block, in a region of prolonged refractoriness. Early activation of the appropriate regions prevented reentry by a combination of shifting the site of block, re- ducing the length of the arc or allowing early activation of sites immediately distal to the block.
Computer Modeling of Reentry A number of computer models of cardiac activation
have been employed for better understanding the electri- cal signals recorded from the body surface [14]-[16]. However, few models have been reported which directly address mechanisms of reentry. One of the earliest com- puter models of reentrant activity, specifically atrial fi- brillation, was reported by Moe et al. [17]. This model differs from the one reported here in that refractory pe- riods were distributed randomly. Multiple disorganized activation patterns, or “multiple wavelets, ” believed to simulate the activation patterns of atrial fibrillation, were demonstrated. A later study by Smith et al., which ex- panded on the original Moe model, examined reentry in a simulated ventricle as a function of the statistical dis- persion of refractoriness [ 181. Reentrant patterns of “fig- ure 8” morphology have been simulated in computer model by introducing an artificial U-shaped line of con- duction block at the beginning of the simulation [19]. Continuous reentrant waves circulated around two lines of block occurred when conduction within the U-shaped region was depressed.
Models which incorporate ionic membrane currents and passive intercellular connections have been utilized for studying propagation of the cardiac impulse [20]-[23]. A variety of conduction abnormalities have been simulated with ionic models which may have application in the un- derstanding of reentrant activation. A cellular model of the whole heart which incorporates relevant ionic and structure characteristics of an abnormal electrophysiology may seem appropriate. However, the results from the present report indicate that a large fraction of the heart mass constitute a reentrant circuit. Presently, the dimen- sion of cardiac tissue which can be modeled in multiple dimensions is severely limited by the computational in- tensity of these models. Furthermore, the ionic currents used in these models are based on data from normal car- diac cells.
There has been increasing interest in the relation of an- isotropy in the heart with the genesis of reentry [ lo], [24], [25]. Directional differences in conduction velocity and site of block have been correlated to fiber orientation in normal cardiac muscle. Anisotropy in ischemic myocar- dium has been implicated as a substrate for reentry [25] . Initiation of reentry in the present model was not depen- dent on directional differences in conduction properties. However, anisotropy may have a passive influence on reentry. This topic is currently under investigation [26].

352 IEEE TRANSACTIONS ON BIOMEDICAL ENGINEERING. VOL. 31, NO. 4, APRIL 1990
V. CONCLUSION A logical state model based on properties of a well
characterized experimental preparation can realistically simulate reentry. This model may provide a means for studying the genesis of reentrant dysrhythmias and pos- sible mechanisms of treatment.
REFERENCES [ l ] N. El-Sherif, B. J. Sherlag, R. Lazzara, and R. R. Hope, “Reentrant
ventricular arrhythmias in the late myocardial infarction period. 1. Conduction characteristics in the infarction zone,” Circulation, vol.
[2] R. Mehra, R. H. Zeiler, W. B. Gough, and N. El-Sherif, “Reentrant ventricular arrhythmias in the late myocardial infarction period. 9. Electrophysiologic anatomic correlation of reentrant circuits,” Cir- culation, vol. 67, pp. 11-24, 1983.
[3] W. B. Gough, R. Mehra, M. Restivo, R. H. Zeiler, and N. El-Sherif, “Reentrant ventricular arrhythmias in the late myocardial infarction period in the dog. 13. Correlation of activation and refractory maps,” Circ. Res. , vol. 57, pp. 432-442, 1985.
[4] N. El-Sherif, R. Mehra, W. B. Gough, and R. H. Zeiler, “Reentrant ventricular arrhythmias in the late myocardial infarction period. In- terruption of reentrant circuits by cryothermal techniques,” Circula- tion, vol. 68, pp. 644-656, 1983.
[ 5 ] W. Craelius, M. Restivo, and N. El-Sherif, “Computer simulation of ventricular tachycardia,” presented at Seventh Annu. Conf. Eng. Med. Biol. Soc., 1985, pp. 451-455.
[6] G. R. Mines, “On circulating excitation in heart muscles and their possible relation to tachycardia and fibrillation, ” Trans. Roy. Soc. Can. Ser. 3. Sect. 55, vol. 8, pp. 43-52, 1914.
[7] J. P. Boineau, R. B. Schusser, C. R. Mooney, C. B. Miller, A. C. Wylds, R. D. Hudson, M. J . Borreman, and C. W. Brockus, “Nat- ural and evoked atrial flutter due to circus movement in dogs. Role of abnormal atrial pathways, slow conduction, non-uniform refractory period distribution and premature beats,’’ Amer. J . Cardiol., vol. 45,
[8] M. Restivo, W. B. Gough, and N. El-Sherif, “Correlation of abrupt changes in refractoriness and functional conduction block in the post infarcted canine heart,” J . Amer. Coll. Cardiol, vol. 9, p. 91, 1987.
[9] -, “Role of abrupt changes in refractoriness and fiber orientation in the formation of functional conduction block,” Circulation, vol.
(101 M. S. Spach, W. T. Miller, 111, D. B. Geselowitz, R. C. Barr, J. M. Kootsey, and E. A. Johnson, “The discontinuous nature of propa- gation in normal cardiac muscle. Evidence for recurrent discontinui- ties of intracellular resistance that affect the membrane currents,” Circ. Res. , vol. 48, pp. 39-54, 1981.
[ l l ] W. B. Gough, M. Restivo, V. Kowtha, and N. El-Sherif, “The de- pendence of reentry the site of stimulation in the ischemic canine ven- tricle,” J . Amer. Coll. Cardiol., 1986.
(121 E. L. Michelson, J. L. Spear, and E. N. Moore, “Initiation of sus- tained ventricular tachyarrhythmias in a canine model of chronic my- ocardial infarction. Importance of the site of stimulation,” Circ. , vol. 63, p.776, 1981.
[13] M. Restivo, W. B . Gough, and N. El-Sherif, “Reentrant ventricular arrhythmias in the late myocardial infarction period: prevention of reentry by dual stimulation,” Circulation, vol. 2, pp. 429-444, 1988.
[14] W. T. Miller, 111, and D. B. Geselowitz, “Simulation studies of the heart. 11. Ischemia and infarction,” Circ. Res. , vol. 43, pp. 315-323, 1978.
[15] M. Okajima, T. Fujino, T. Kobayashi, and K. Yamada, “Computer simulation of the propagation process in excitation of the ventricles,” Circ. Res. , vol. 23, pp. 203-211, 1968.
[16] M. Malik, T. Cochrane, and A. J. Camm, “Computer simulation of the cardiac conduction system,” Comput. Biomed. Res., vol. 16, pp.
[17] G . K. Moe, W. C. Rheinboldt, and J . A. Abildskov, “A computer model of atrial fibrillation,” Amer. Heart J . , vol. 67, p. 200, 1964.
[18] J. M. Smith, and R. J. Cohen, “Simple finite element model accounts for wide range of cardiac dysrhythmias,” in Proc. Nut. Acad. Sci.,
5 5 , pp. 686-702, 1977.
pp. 1167-1181, 1980.
76, p. IV-241, 1987.
454-468, 1983.
vol. 81, pp. 233-237, 1984.
[19] P. Auger, P. Lorente, A. Bardou, J . Degonde, and Saumont, “A model of reentry based on the Huyghens construction method,’’ Com- puters in Cardiology, 1984, pp. 467-470.
[20] P. J. Diaz, Y. Rudy, and R. Plonsey, “A model study if the effect of the intercalated discs on discontinuous propagation in cardiac mus- cle,” Adv. Exp. Med. Bio., vol. 161, pp. 79-89, 1983.
[21] F. A. Roberge, A. Vinet, and B. Victom, “Reconstruction of prop- agated electrical activity with a two dimensional model of anisotropic heart muscle,” Circ. Res., vol. 58, pp. 461-475, 1986.
[22] R. C. Barr and R. Plonsey, “Propagation of excitation in idealized anisotropic two-dimensional tissue,” Biophys. J . , vol. 45, pp. 1191- 1202, 1984.
[23] R. W. Joyner, “Mechanisms of unidirectional block in cardiac tis- sue,’’ Biophys. J . , vol. 35, pp. 113-125, 1981.
(241 M. S. Spach, W. T. Miller, 111, P. C. Dolber, J. M. Kootsey, J. R. Sommer, and C. E. Mosher, Jr., “The functional role of structural complexities in the propagation of depolarization in the atrium of the dog. Cardiac conduction disturbances due to discontinuities of effec- tive axial resistivity,” Circ. Res. , vol. 21, pp. 175--191, 1982.
(251 D. A. Richards, G. J. Blake, J . F. Spear, and E. N. Moore, “Elec- trophysiologic substrate for ventricular tachycardia: correlation of properties in vivo and in vitro,” Circulation, vol. 69, pp. 369-381, 1984.
[26] M. Restivo, W. B. Gough, and N. El-Sherif, “Effect of anisotropy and refractoriness in a functional model of reentry,’’ Circulation, vol. 76, p. IV-113, 1987.
Mark Restivo (S’71-M’82) was born in Newark, NJ, in 1956. He received the B.S. degree in elec- trical engineering in 1979 and the Ph.D. degree in biomedical engineering in 1987 from Rutgers University.
He has been a Research Associate at the Brook- lyn Veterans Administration Medical Center since 1983. His research interests include cardiac elec- trophysiology and computer modeling of cardiac arrhythmias.
Dr. Restivo is active in the New York chapter of the IEEE Engineering in Medicine and Biology Society and served as chairman from 1985 to 1987.
William Craelius (M’78) was born in Chicago in 1947. He received the B.S. degree in mechanical analysis and design from the University of 1111- nois, Chicago, in 1969, the M.S. degree in envi- ronmental health engineenng in 1972, and the Ph.D. degree in biomedical engineering In 1975, both from Northwestern University, Evanston, IL.
He did postdoctoral work as an NIH Fellow in Neurosciences at Stanford University from 1975- 1978, and taught Physiology at Lafayette College from 1978-1982. From 1982-1985 he was on the
faculty at the University of Medicine and Dentistry of New Jersey and from 1985-1989 at the State University of New York, Brooklyn, and also served as Director of Computerized Electrocardiography, Veterans’ Administra- tion in Brooklyn. Currently he is Associate Professor of Biomedical En- gineering, Rutgers University, Piscataway, NJ. His research interests in- clude cardiac electrophysiology and membrane ion channels.
RESTIVO er ul. .: MODEL OF REENTRANT VENTRICULAR ACTIVATION 353
William B. Gough received the Ph D. degree in physiology from the University of Pennsylvania, Philadelphia, in 1972
Until 1979, he was an Assistant Professor of Medicine at Hahnemann Medical College in Li- koff Cardiovascular Institute He studied mecha- nisms ot endogenous pacemaker activity in am- phibian and mammalian hearts, including the human heart. Since 1979, he has been a Research Physiologist at the VA Medical Center, Brooklyn, NY, and an Assistant Professor of Medicine at the
SUNY Health Science Center, Brooklyn His research interests have been directed towards the mechanisms of cardiac arrhythmias, occurring post- infarction. In particular, he has studied triggered activity and reentry.
Nabil El-Sherif was born in Cairo, Egypt in 1938. He received the M.B , B.Ch. degree from the University of Cairo School of Medicine in 1959.
He is currently a Professor of Medicine (since 1978) and Physiology (since 1983) at the State University of New York, Health Science Center at Brooklyn and the Director of the Cardiology Division at the Brooklyn Veterans Administration Medical Center (since 1978) He served as the Cardiovascular Progam Specialist with the Vet- erans Administration research progam in 1981-
1984 and was the Acting Associate Chief of Staff for Research and Devel- opment at the Brooklyn VA Medical Center in 1982-1984. HIS major interest is cardiac electrophysiology, especially electrophysiologic mech- anisms of ischemia-related cardiac arrhythmas.