a materiality analysis meeting non- financial reporting...
TRANSCRIPT

IN DEGREE PROJECT ENERGY AND ENVIRONMENT,SECOND CYCLE, 30 CREDITS
, STOCKHOLM SWEDEN 2019
A materiality analysis meeting non-financial reporting requirements
With the combination of analytic hierarchy process and failure mode and effects analysis
ADRIEN DELEBECQUE
KTH ROYAL INSTITUTE OF TECHNOLOGYSCHOOL OF ARCHITECTURE AND THE BUILT ENVIRONMENT

TRITA ABE-MBT-19667
www.kth.se
A materiality analysis meeting non-financial reporting requirements
En väsentlighetsanalys som uppfyller icke-finansiella rapporteringskrav
Keywords: corporate social responsibility, non-financial reporting, materiality analysis, multi-criteria
decision-making
Degree project course: Strategies for sustainable development, Second Cycle
AL250X, 30 credits
Author: Adrien Delebecque
Supervisor: Cecilia Sundberg
Examiner: Cecilia Håkansson
Department of Sustainable Development, Environmental Science and Engineering
School of Architecture and the Built Environment
KTH Royal Institute of Technology

1
Abstract The assessment of the environmental and social impact of companies could be a key lever towards a
more sustainable society. The aim of this report is to develop a quantitative approach based on
multi-criteria decision-making methods for organizations to conduct a corporate social responsibility
materiality analysis. Through a literature review, a knowledge gap was identified on practical
methods to implement a materiality analysis that meet non-financial reporting requirements.
Therefore, the features of such a method were identified and a method combining analytic hierarchy
process and failure modes and effects analysis was offered. The method was then used within a
company in order to illustrate how the method should be applied in practice and to assess its
application. The analytic hierarchy process was used to determine the relative weights of three
criteria: risk, opportunity and influence on stakeholders’ assessments & decisions. Assessment scales
were created for three failure modes and effects analysis indices for the criteria of risk and
opportunity: severity, occurrence and control. A unique value can then be calculated for each
corporate social responsibility issue in order to identify the material ones. The application of the
methodology to a company underlined a few critical factors to be further investigated, in particular
the quantification of the scales used for assessment and the selection of stakeholders.
Keywords: corporate social responsibility, non-financial reporting, materiality analysis, multi-criteria
decision-making
Sammanfatning Bedömningen av företagens miljöpåverkan och sociala effekter kan vara en nyckelhävarm mot ett
hållbart samhälle. Syftet med denna artikel är att utveckla ett kvantitativt tillvägagångssätt baserat
på beslutsfattningsmetoder med flera kriterier för organisationer att utföra en väsentlighetsanalys av
företagets sociala ansvar. Genom en litteraturöversikt identifierades kunskapsgap om praktiska
metoder för att genomföra en väsentlighetsanalys som uppfyller icke-finansiella rapporteringskrav.
Därför identifierades funktionerna i en sådan metod och en metod som kombinerar analytisk
hierarkiprocess och feleffektsanalys erbjuds. Metoden användes sedan inom ett företag för att
illustrera hur metoden bör tillämpas i praktiken och för att bedöma dess tillämpning. Den analytiska
hierarkiprocessen användes för att bestämma de relativa vikterna för tre kriterier: risk, möjlighet och
inflytande på intressenternas bedömningar och beslut. Utvärderingsskalor skapades för tre
feleffektsanalysindex för kriterierna för risk och möjlighet: allvarlighetsgrad, förekomst och kontroll.
Ett unikt värde kan sedan beräknas för varje företags sociala ansvar för att identifiera de materiella.
Tillämpningen av metodologin på ett företag underströk några kritiska faktorer som ska undersökas
ytterligare, särskilt kvantifieringen av skalorna som används för bedömning och urvalet av
intressenter.
Nyckelord: företagets sociala ansvar, icke-finansiella rapportering, väsentlighetsanalys,
beslutsfattande med flera kriterier

2
Table of Contents 1. Introduction ..................................................................................................................................... 4
2. Definition of materiality ...................................................................................................................... 6
2.1. Presentation of materiality analysis ............................................................................................. 6
2.1.1. Topics in materiality analysis ................................................................................................. 7
2.1.2. Material topic ........................................................................................................................ 8
2.2. Presentation of the Non-Financial Reporting Directive ............................................................... 9
2.2.1. Example of France ............................................................................................................... 10
2.2.2. Example of Sweden ............................................................................................................. 10
2.3. Linking materiality analysis and NFRD ........................................................................................ 11
2.4. Key points to remember ............................................................................................................. 11
3. Literature review and requirements of the methodology ................................................................ 12
3.1. Methodology of the literature review ........................................................................................ 12
3.2. Literature review ........................................................................................................................ 12
4. Methods ............................................................................................................................................ 15
4.1. Presentation of AHP and FMEA .................................................................................................. 15
4.2. Framework of the methodology ................................................................................................ 17
4.3. Predefining stakes ...................................................................................................................... 17
4.4. Identifying stakeholders ............................................................................................................. 18
4.5. Consulting stakeholders ............................................................................................................. 18
4.5.1. Weighting the criteria with AHP .......................................................................................... 18
4.5.2. Assessing consistency of judgement ................................................................................... 19
4.5.3. Interviewing stakeholders ................................................................................................... 20
4.6. Analyzing and plotting results .................................................................................................... 24
4.6.1. Plotting results ..................................................................................................................... 24
4.6.2. Calculating the unique value ............................................................................................... 24
4.6.3. Optional: setting a threshold ............................................................................................... 24
4.7. Identifying material stakes ......................................................................................................... 24
4.8. Application to a company ........................................................................................................... 25
4.8.1. Presentation of the company .................................................................................................. 25
4.8.2. List of stakes ............................................................................................................................ 25
4.8.3. List of stakeholders .................................................................................................................. 28
5. Results and consequences for decisions ........................................................................................... 29
6. Discussion .......................................................................................................................................... 37
7. Conclusion ......................................................................................................................................... 42
References ............................................................................................................................................. 43

3
Appendix ................................................................................................................................................ 47

4
1. Introduction Through their activity and business ecosystem, companies are major players of the economy, bound
to favorably or unfavorably impact society’s efforts towards sustainability, that is the ability of the
society to meet the needs of the present without compromising the ability of future generations to
meet their own needs (World Commission On Environment and Development, 1987).
In order to show their commitment to stakeholders, more and more organizations have adopted
sustainability reporting (Hsu et al., 2013; Jain and Islam, 2016) and communicate about their
economic, environmental, and/or social impacts, for purposes of transparence and accountability
(Hess, 2007). As an organization cannot communicate about all its stakes, a tool is required to decide
about which information to report on. Moreover, this choice is intertwined with the integration of
sustainability within the business strategy as a company is expected to communicate about its most
relevant issues in terms of sustainability implications and allocate its resources and efforts
accordingly (Khan et al., 2016). This approach is called a materiality analysis and it is the bedrock of
sustainability reporting (Eccles et al., 2014): organizations must include the stakes that are material
for their activity.
Even though performing a materiality analysis is not legally mandatory for a large number of
organizations around the world, more and more companies must meet regulatory obligations
regarding non-financial reporting. In particular, the European Non-Financial Reporting Directive
(NFRD) (2014/95/EU) requires large companies to report on several sustainability issues. Over the
past few years, this directive has been translated into the national legislations of EU countries. For
example, in France, some companies are subject to the Statement on Extra-Financial Performance
translating the NFRD into French law in article L225-102 of Commercial Code. This statement is based
on the relevance of information to be published and the presentation of companies’ extra-financial
performance regarding its major corporate social responsibility (CSR) risks.
According to the recognized international standard for CSR, ISO 26 000, CSR is the
“responsibility of an organization for the impacts of its decisions and activities on society and the
environment, through transparent and ethical behavior that:
- contributes to sustainable development, including health and the welfare of society,
- takes into account the expectations of stakeholders,
- is in compliance with applicable law and consistent with international norms of behavior,
- is integrated throughout the organization and practiced in its relationships”.
To date, few papers offer practical methods to identify the most relevant sustainability issues for an
organization and its stakeholders (Bellantuono et al., 2016; Calabrese et al., 2017; Hsu et al., 2013).
The aim of this report is to develop a quantitative approach based on multi-criteria decision-making
(MCDM) methods for organizations to conduct a CSR materiality analysis. In order to achieve this
aim, a definition of materiality will be drawn from several international frameworks and the NFRD.
The requirements of a relevant quantitative approach will be investigated through a literature
review. Then, a method using analytic hierarchy process, a MCDM method based on pairwise
comparisons, and failure mode and effects analysis, a risk management method based on
assessment scales, will be offered. Finally, the application of the method to a French company will
enable an evaluation of its practical use.

5
Definitions - risk (ISO, 2018)
According to ISO 31000, risk is the “effect of uncertainty on objectives” and an effect is a positive or
negative deviation from what is expected.
Risk is often expressed in terms of a combination of the consequences (or severity) of an event and
the associated likelihood (or probability) of occurrence.
In this paper, as it considered in the NFRD and in common speech, a risk means a negative effect
whereas an opportunity means a positive effect.
- risk analysis (ISO, 2018)
According to ISO 31000, risk analysis is the “process to comprehend the nature of risk and to
determine the level of risk”.

6
2. Definition of materiality 2.1. Presentation of materiality analysis In order to identify the most important CSR stakes of its activity, a company can carry out a
materiality analysis. It is a prioritization process used to decide about which stakes really matter (i.e.
which ones are the most material) and which ones should be addressed first. It is made up of five
steps (inspired by Deloitte, 2018): the identification and definition of stakes, the identification of
stakeholders, the consultation of those, the analysis of results and the identification of the material
stakes (Figure 1).
Figure 1: Materiality analysis framework, inspired by Deloitte (2018) (the main steps were taken from this source)
In order to identify a material topic, a precise definition is required. In particular, the topics to be
covered, the boundaries and the point of the view of the materiality must be defined. For lack of a
consensus and a definitive definition, the main international frameworks bring out a few differences
regarding these questions, as detailed below.
The two most used sources of this section are the ISO 26 000 standard for CSR and the guidelines
published by the Global Reporting Initiative (GRI). GRI is a multistakeholder non-profit Amsterdam-
based organization (Fonseca et al., 2014) which publishes the most popular set of voluntary
guidelines for sustainability reporting and has become the de facto standard in many sectors (Roca
and Searcy, 2012; Skouloudis et al., 2009). Nevertheless, it must be underlined that there are many
1. Predefining stakes
32. Identifying stakeholders
3. Consulting stakeholders
4. Analyzing and plotting results
5. Identifying material stakes
7
other frameworks (e.g. UN Global Compact, UN’s SDGs, SASB) and their number keeps increasing
(Siew, 2015).
2.1.1. Topics in materiality analysis
The stakes to put under scrutiny for a materiality analysis are encompassed by the guidelines about
CSR approaches. According to the ISO 26 000 standard, the topics to be covered within a CSR
approach are the decisions and activities of the company that have consequences on stakeholders
and sustainable development (a stakeholder being an individual or group having an interest in the
decisions and activities of the company).
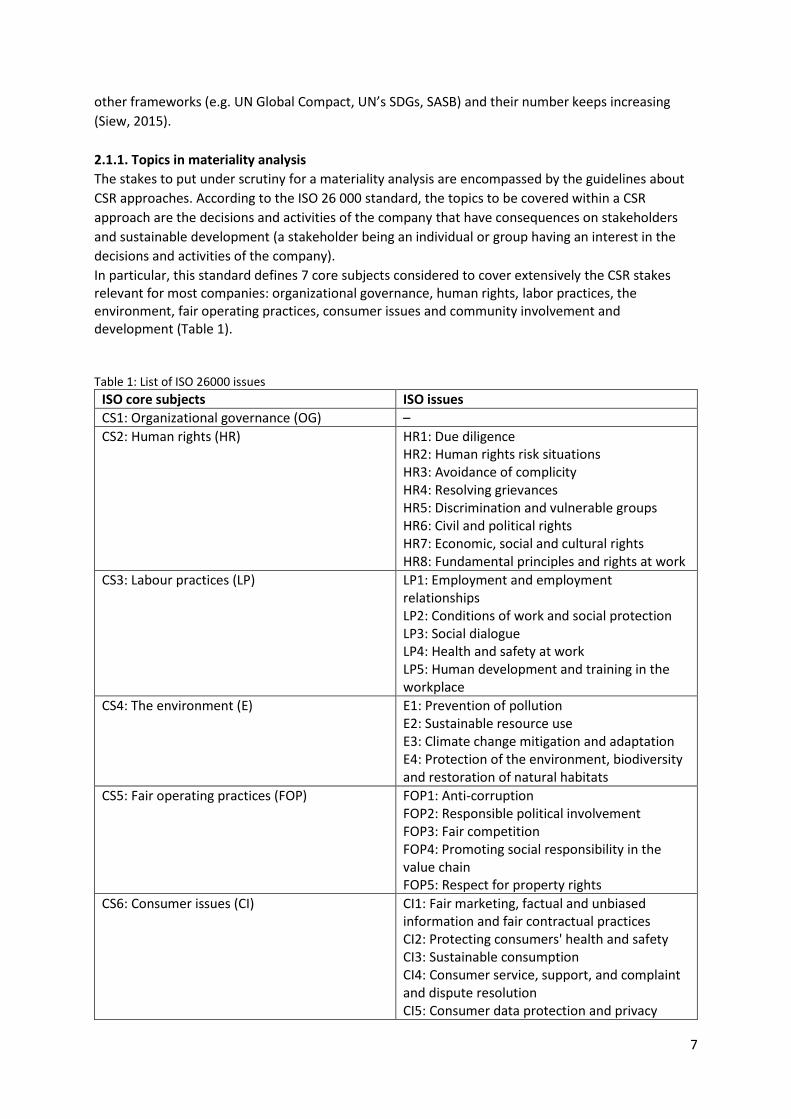
In particular, this standard defines 7 core subjects considered to cover extensively the CSR stakes relevant for most companies: organizational governance, human rights, labor practices, the environment, fair operating practices, consumer issues and community involvement and development (Table 1). Table 1: List of ISO 26000 issues
ISO core subjects ISO issues
CS1: Organizational governance (OG) –
CS2: Human rights (HR) HR1: Due diligence HR2: Human rights risk situations HR3: Avoidance of complicity HR4: Resolving grievances HR5: Discrimination and vulnerable groups HR6: Civil and political rights HR7: Economic, social and cultural rights HR8: Fundamental principles and rights at work
CS3: Labour practices (LP) LP1: Employment and employment relationships LP2: Conditions of work and social protection LP3: Social dialogue LP4: Health and safety at work LP5: Human development and training in the workplace
CS4: The environment (E) E1: Prevention of pollution E2: Sustainable resource use E3: Climate change mitigation and adaptation E4: Protection of the environment, biodiversity and restoration of natural habitats
CS5: Fair operating practices (FOP) FOP1: Anti-corruption FOP2: Responsible political involvement FOP3: Fair competition FOP4: Promoting social responsibility in the value chain FOP5: Respect for property rights
CS6: Consumer issues (CI) CI1: Fair marketing, factual and unbiased information and fair contractual practices CI2: Protecting consumers' health and safety CI3: Sustainable consumption CI4: Consumer service, support, and complaint and dispute resolution CI5: Consumer data protection and privacy

8
CI6: Access to essential services CI7: Education and awareness
CS7: Community involvement and development (CID)
CID1: Community involvement CID2: Education and culture CID3: Employment creation and skills development CID4: Technology development and access CID5: Wealth and income creation CID6: Health CID7: Social investment
Likewise, the GRI standards suggest a list of potential materials topics through the three categories of
sustainability: economic (GRI 200), environmental (GRI 300) and social (GRI 400) (GRI-Global
Reporting Initiative, 2016a) (Appendix 1: List of GRI topics).
2.1.2. Material topic
In the finance field, materiality means a threshold for influencing the economic decisions of those
using an organization’s financial statements, investors in particular (Messier et al., 2005). Therefore,
it is logical to find definitions of materiality centered about value creation within reporting guidelines
with a holistic view, as for the International Integrated Reporting Council (IIRC) guiding principles,
which define it as “matters that substantively affect the organization’s ability to create value over the
short, medium and long term” (IIRC, 2013). The effect of a matter is then evaluated by its magnitude
and its likelihood of occurrence.
Likewise, the American framework published by the Sustainability Accounting Standards Board
(SASB) uses the definition given by the U.S. Supreme Court in 1976: information is material if there is
“a substantial likelihood that the disclosure of the omitted fact would have been viewed by a
reasonable investor as having significantly altered the ‘total mix’ of information made available
(SASB, 2017; US Supreme Court, 1976).
Regarding sustainability reporting, a material topic can be defined as “a topic (an economic,
environmental or social subject) reflecting the organization’s significant economic, environmental,
and social impacts or substantively influencing the assessments and decisions of stakeholders”
(GRI-Global Reporting Initiative, 2016a). In particular, an impact refers to “effects on the economy,
the environment, and/or society (positive or negative)”, while it does not focus on impacts on the
organization though it can be related to it (GRI-Global Reporting Initiative, 2016a).
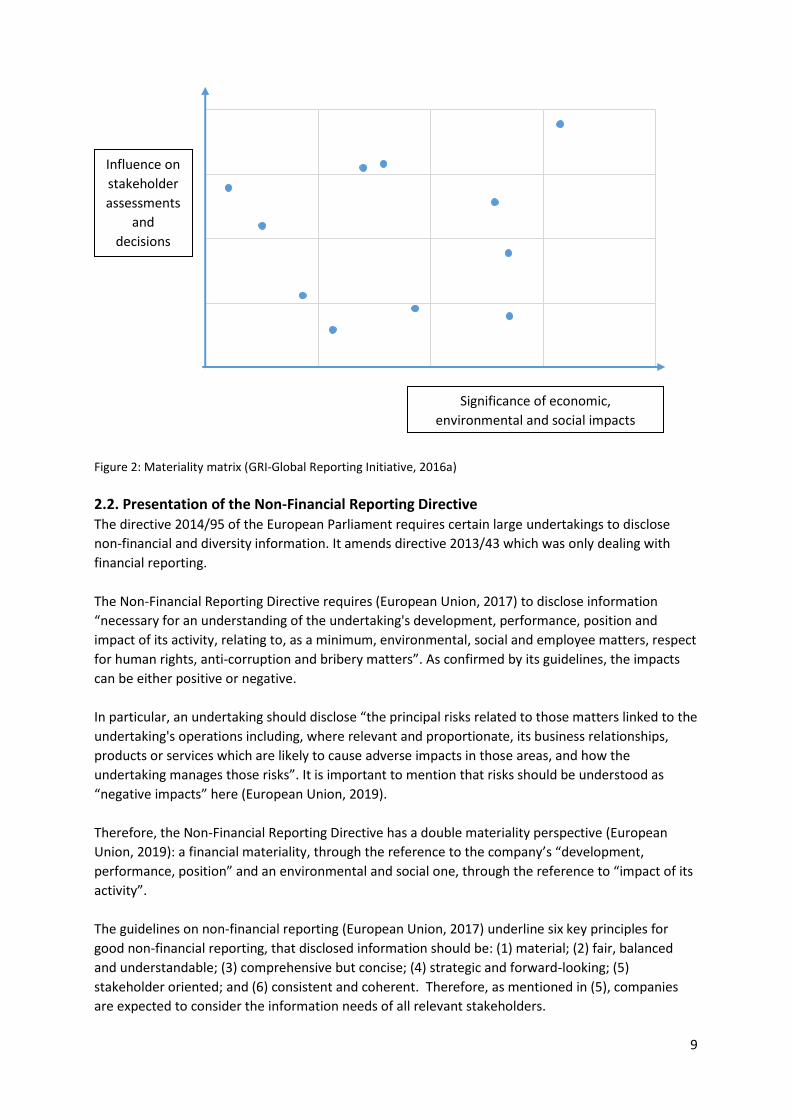
Therefore, assessing whether a topic is material requires considering two dimensions. They form the
axes of a materiality matrix which is a common visual representation for the prioritization of topics
(Figure 2). The GRI standards ask that companies disclose the boundary of the material topic, i.e. “a
description of where the impacts occur for a material topic, and the organization’s involvement with
those impacts” (GRI-Global Reporting Initiative, 2016a).
9
Figure 2: Materiality matrix (GRI-Global Reporting Initiative, 2016a)
2.2. Presentation of the Non-Financial Reporting Directive The directive 2014/95 of the European Parliament requires certain large undertakings to disclose
non-financial and diversity information. It amends directive 2013/43 which was only dealing with
financial reporting.
The Non-Financial Reporting Directive requires (European Union, 2017) to disclose information
“necessary for an understanding of the undertaking's development, performance, position and
impact of its activity, relating to, as a minimum, environmental, social and employee matters, respect
for human rights, anti-corruption and bribery matters”. As confirmed by its guidelines, the impacts
can be either positive or negative.
In particular, an undertaking should disclose “the principal risks related to those matters linked to the
undertaking's operations including, where relevant and proportionate, its business relationships,
products or services which are likely to cause adverse impacts in those areas, and how the
undertaking manages those risks”. It is important to mention that risks should be understood as
“negative impacts” here (European Union, 2019).
Therefore, the Non-Financial Reporting Directive has a double materiality perspective (European
Union, 2019): a financial materiality, through the reference to the company’s “development,
performance, position” and an environmental and social one, through the reference to “impact of its
activity”.
The guidelines on non-financial reporting (European Union, 2017) underline six key principles for
good non-financial reporting, that disclosed information should be: (1) material; (2) fair, balanced
and understandable; (3) comprehensive but concise; (4) strategic and forward-looking; (5)
stakeholder oriented; and (6) consistent and coherent. Therefore, as mentioned in (5), companies
are expected to consider the information needs of all relevant stakeholders.
Significance of economic,
environmental and social impacts
Influence on
stakeholder
assessments
and
decisions

10
2.2.1. Example of France
The NFRD is transcribed into French national law by means of article L225-102 of Commercial Code
(Table 2).
Table 2: NFRD requirements in France
Company Scope 2 of these criteria must be met: 1. Over 500 employees 2. PIEs (Public Interest Entities): listed companies, credit institutions and insurance providers (with a société anonyme legal form) with - Net turnover over EUR 40 million; or - Balance sheet total over EUR 20 million 3. Non-listed sociétés anonymes (a French legal form) and non-listed investment funds with - Net turnover over EUR 100 million
Matters • Environmental performance • Social and employee matters • Human rights performance • Corruption and anti-bribery matters
Report features • A description of the undertaking’s business model • Company policies relating to non-financial matters, and the outcomes of those policies • Principal risks related to non-financial matters and business activities • Any non-financial KPIs which are used
2.2.2. Example of Sweden
In Sweden, the NFRD is transposed to national legislation through the Annual Accounts Act (Års-
redovisningslagen) (Table 3).
Table 3: NFRD requirements in Sweden
Company Scope All companies meeting these criteria: 1. Over 250 employees 2. - Net turnover: over SEK 350 million; or - Balance sheet total: over SEK 175 million
Matters • Environmental • Social and employee matters • Respect for human rights • Anti-corruption and bribery matters
Report features • A description of the undertaking’s business model • Company policies relating to non-financial matters, and the outcomes of those policies • Principal risks related to non-financial

11
matters and business activities • Any non-financial KPIs which are used • An explanation of the sums indicated in the financial statement which are relevant to corporate social responsibility
Worth noting, Sweden has chosen strict standards by applying its rules to all types of companies with
over 250 employees (compared to a threshold of 500 employees and a focus on public interest
entities for most European countries) (GRI-Global Reporting Initiative, 2017).
2.3. Linking materiality analysis and NFRD The NFRD states that undertakings subject to the directive may rely on international frameworks for
their materiality analysis, and mention the Global Reporting Initiative, among other recognized
international frameworks (European Union, 2017).
The GRI have pondered on the double materiality perspective introduced by the NFRD and have
concluded that there is a high degree of overlap between the topics considered environmentally and
socially material by reporting organizations, and those considered material by investors, i.e.
financially material (GRI-Global Reporting Initiative, 2016b). Investors are indeed often considered to
be important stakeholders and themselves consider it important what matters to non-financial
stakeholders.
Regarding a more direct comparison between the NFRD and the GRI standards, the GSSB (Global
Sustainability Standards Board) has issued a linkage table between the two frameworks, assuring that
they are both compatible (GRI-Global Reporting Initiative, 2017).
2.4. Key points to remember The consultation document on the update of the non-binding guidelines on non-financial reporting of
2019 (European Union, 2019) has eventually acknowledged the double-definition of materiality in
sustainability reporting: a financial perspective, directly inherited from its use in the finance field,
and an environmental and social perspective, more closely related to the ISO 26 000 standard’s
definition of CSR. It is consistent with the materiality definition of the GRI standards and both
frameworks, NFRD and GRI, acknowledge the importance of taking into account stakeholders, which
brings a third dimension: the influence of a topic on stakeholders’ assessments & decisions.
The GRI standards ask to disclose both positive and negative impacts (GRI-Global Reporting Initiative,
2016a), whereas the NFRD asks as well to disclose information about topics with either a positive or
negative impact but with a specific focus on (negative) risks related to these topics (European Union,
2017).

12
3. Literature review and requirements of the methodology 3.1. Methodology of the literature review To define the requirements of the materiality analysis methodology, a literature review was
conducted.
At first, to perform this literature review in a systematic way, some keywords were defined
“materiality analysis”, “sustainability reporting”, “sustainability assessment”. The KTH primo
database was used in the process of searching relevant literature. After that a knowledge gap was
identified, the snowball method was applied in order to find more literature about the subject, in
particular from the few papers dealing with quantitative methods for assessing materiality
(Bellantuono et al., 2016; Calabrese et al., 2016; Hsu et al., 2013).
3.2. Literature review The existing literature about sustainability reporting stresses its role, and by extension the role of
materiality analysis, as a way to address sustainability issues in a relevant way and integrate CSR into
the company’s strategy. As discussed by Porter and Kramer (2007), a company must not invest in
sustainability without a strategic approach, as it risks dealing with activities not related to its core
business. Porter and Kramer (2007) argue that CSR is not only a way to improve brand image, but
also a way to foster innovation, competitive advantage, and sustainability in the long term. Indeed,
many papers argue also that the integration into companies’ strategies is crucial to achieve
competitiveness in the long term, and wellbeing of employees, stakeholders and society in general
(Engert et al., 2016; Scherrer et al., 2007). It has been reported in the past that sustainability was
difficult to integrate within strategy (Vandaele and Decouttere, 2011), resulting in sustainability
strategies not aligned with the business ones (Ahmed and Sundaram, 2012). That is why Engert et al.
(2016) underlines that research should focus on how to integrate corporate sustainability into
strategic management in practice.
Moreover, as recommended by most international frameworks, having a stakeholder-oriented
sustainability approach can improve company’s performance (Michelon et al., 2013). Therefore, the
creation of practical methods to address expectations and perceptions of stakeholders is needed
(Cairns et al., 2016). Companies’ stakeholders may notably include suppliers, internal staff, such as
employees and workers, customers, including shareholders, investors, and consumers, NGOs and
local and regional communities. It is important to highlight that these groups are not all equally
salient and could be classified depending on their power, urgency and legitimacy as suggested by
Mitchell et al. (1997). Engaging stakeholders is also a way to align performance with sustainability
(Bellantuono et al., 2016) and it can prevent the major risk in non-financial reporting of corporate
managers publishing only what they consider important information. A study of sustainability reports
on large-scale mining conflicts revealed a low quality of data on contentious issues even though the
mining companies thought the data reported was comprehensive and accurate (Murguía and
Böhling, 2013). These different factors demonstrate the relevance of the third dimension of
materiality previously discussed, i.e. the influence on stakeholders’ assessments and decisions, both
as a way to improve company’s performance and to engage stakeholders by having them contribute
to the decision-making process.
Besides, all companies need to address their most relevant sustainability issues, even SMEs which
tend to have less resources and greater constraints on capabilities. These companies must also be
able to overcome the limitations they face in order to gain competitive advantage from such

13
opportunities (Brammer et al., 2012). A sustainability reporting approach which would be compatible
with these limitations is still to be created in the field (Battisti and Perry, 2011; Baumann-Pauly et al.,
2013).
A relevant approach would also have to tackle the high subjectivity of the process. Based on human
judgement, the approach would have to avoid biases of personal opinions, expectations and
experiences (Zhou, 2012) and successfully deal with uncertainty and vagueness inherent to decision-
making problems (Yan and Ma, 2015).
Regarding existing practical approaches of carrying out a materiality analysis, the guidelines and
international frameworks do not provide specific directions whereas research on quantitative
methods for assessing materiality is scarce (Bellantuono et al., 2016; Calabrese et al., 2017; Hsu et
al., 2013). Moreover, the few existing studies do not deal effectively with the issues of subjectivity
and there is a lack of methods addressing the issue of SMEs’ shortage of human, temporal and
financial resources as evoked in Calabrese et al. (2016).
Because of the need for the engagement of the stakeholders in a materiality analysis and the
observed limitations of the literature, the offered approach in this paper will use decision-science
methodologies and be based on multi-criteria decision-making (MCDM) methods. This family of
techniques aim at making judgements on a defined and finite set of alternatives over a set of
decision criteria. The decision-makers have to provide their preferences on each alternative with
respect to each attribute, using a scale of judgement which can be expressed in many different ways,
from numerical values to verbal labels. Previous research suggests that this kind of methods can
tackle the multidimensionality and subjectivity of sustainability decision-making problems (Cinelli et
al., 2014; Ishizaka and Siraj, 2018; Merad et al., 2013).
In the literature, three papers have recently offered quantitative methods to carry out a materiality
analysis based on MCDM methods. An approach based on a fuzzy Analytic Hierarchy Process (AHP) is
offered by Calabrese et al. (2017). This sophisticated method ranks ISO core subjects through the
representation and assessment of linguistic judgements by triangular fuzzy numbers. The relative
weight of issues depends on their relative significance to the different activities of the company: firm
infrastructure, HR management, technology development and procurement. While this method
involves stakeholders in decision-making and establishes a prioritization of several sustainability
issues, it requires a high number of pair-wise comparisons and therefore considerable time efforts.
The application of the method presented in the paper uses the seven ISO core subjects because of
that whereas they are only broad categories of sustainability and a relevant and comprehensive
materiality analysis has to be more profound and deal with the 36 ISO issues (see Table 1).
Another paper presents a method based on the failure modes and effects analysis (FMEA) combined
with analytic network process (ANP) (Hsu et al., 2013). The evaluation criteria are occurrence,
severity and detection on a five-point scale and their relative weight are calculated through pairwise
comparisons. Occurrence values are defined as the percentage of concerned stakeholders. Severity
values are defined as the severity of effects on strategic engagement objective. Detection values are
defined as the level of stakeholder concerns. Given the low number of criteria for this method, a
pairwise comparison is easy to implement but this approach does not deal with the salience of
stakeholders and consistency of their judgement. Moreover, the interpretation of the criteria of
FMEA, i.e. occurrence, severity and detection, is not motivated whereas it appears as an
operationalization problem worthy of discussion. In particular, Hsu et al. (2013) do not justify how

14
the interpretations of occurrence and detection enable to assess what they are supposed to
represent in the real world: respectively, probability of failure and probability of not detecting a
failure. Also, the paper does not provide any method to set threshold in order to identify the most
material topics.
Bellantuono et al. (2016) offer a multi-attribute group decision method based on the assessment of
sustainability issues on a verbal labels scale and the pairwise comparison of these labels to handle
subjectivity of stakeholders. It also suggests to prioritize stakeholders based on their salience for the
different sustainability dimensions, i.e. economic, environmental and social. Nevertheless, the
calibration of verbal labels may require a lot of pairwise comparison depending on the number of
scales used. If the analysis is based on few criteria, this method is well-suited as it sets thresholds and
checks consistency of judgements of stakeholders.
Drawing from this literature review, the requirements of the materiality analysis are summarized in
Table 4.
Table 4: Requirements of the materiality analysis
Requirement Definition
• Acknowledging the multidimensionality of materiality
The method should adopt the double-definition of materiality: financial and environmental/social.
• Being in accordance with the NFRD and its guidelines
The method should respect the directions of the NFRD and follow the guidelines published to improve the relevancy of methods. In particular, the method should enable to focus specifically on risks.
• Engaging stakeholders
The method should take into account stakeholders’ expectations and assess the influence of a topic on their assessments and decisions.
• Enabling accentuating specific stakeholders’ opinions
The method should enable to balance the views of different stakeholders, as some of them may be more knowledgeable and relevant regarding specific topics.
• Handling subjectivity of individuals and checking for consistency of judgement
The method should deal with ambiguity and uncertainty that may inescapably affect stakeholders’ perceptions.
• Resulting in a simple visual representation, like a materiality matrix
The method should result in a visual representation enabling any reader to easily understand the results of the analysis and its conclusions.
• As a prioritization tool, enabling setting materiality thresholds
The materiality and risk analyses are ultimately prioritization and selection tools and should therefore enable to set thresholds in order to identify material topics.
• Making trade-offs between accuracy and efforts
Efforts required by the method should be low enough to facilitate its implementation. It will particularly be beneficial for small companies which usually have limited time and resources to devote to reporting activities.

15
4. Methods In response to the scarcity of academic research, this report offers a method to conduct a materiality
analysis meeting the requirements presented in Table 4. The proposed method will use both analytic
hierarchy process (AHP) and failure modes and effects analysis (FMEA), as MCDM methods enable
comparing alternatives according to qualitative and quantitative criteria seem appropriate for
materiality analysis (Mardani et al., 2015b).
In this method, AHP is used to determine the relative weights of the three criteria related to
materiality analysis, as described in section 1: risk, opportunity and influence on stakeholders’
assessments & decisions. After defining a preliminary list of stakes, selected stakeholders are
consulted through the use of assessment scales in order to evaluate three FMEA indices for the
criteria of risk and opportunity: severity, occurrence and control. A unique value is then calculated
for each corporate social responsibility issue in order to identify the material ones.
This method was then applied to a French large-sized company in order to evaluate its practical use
and investigate areas for improvement.
4.1. Presentation of AHP and FMEA AHP aims to divide a complex decision problem in a hierarchy of smaller sub-problems (Saaty, 2008,
1980). AHP is the most used MCDM method in the literature and the use of such methods in the
sustainability field is common (Mardani et al., 2015a).
Through a set of pairwise comparisons, criteria are weighted at all the levels of the hierarchy (Figure
3). In a full AHP hierarchy, for each criterion, a score is then assigned to each alternative through
pairwise comparisons again. Eventually, the criteria weights and the option scores are combined to
determine a global score for each alternative, and then a ranking.
Figure 3: AHP hierarchy with two levels of criteria and 3 alternatives (not represented) (example inspired from Saaty and Vargas, 2012).
For example, if the goal is to buy a house, a simple AHP hierarchy could take into account 3 criteria:
the price of the house, the renovation costs, and the size (see Figure 4 with 3 alternatives).

16
Figure 4: Simple AHP hierarchy for buying a house with 3 criteria and 3 alternatives
The use of AHP is motivated by the fact that the criteria and alternatives are strongly interrelated in
sustainability decision-making problems (Calabrese et al., 2017) and such method foster decision-
makers to consider all elements of the decision problem and their interactions (Hajkowicz et al.,
2000; Konidari and Mavrakis, 2006). Moreover, MCDM methods using direct rating of alternatives
and criteria require less efforts, but the AHP evaluation should be more precise as decision-makers
assess two elements at a time (Ishizaka and Siraj, 2018).
As visible in 3.4.1, for a full AHP hierarchy with m criteria and n alternatives, the number of pairwise
comparisons required is m(m-1)/2 for the criteria and m*n(n-1)/2 for the alternatives. Given the fact
that the stakes selection is usually made up of more than 20 stakes, a combination of AHP for
weighting criteria and FMEA for assessing stakes will be used.
FMEA is a framework tool used to measure the risk of failures in systems and is currently utilized in many industries, e.g. automotive, aerospace and electronic industries, during the design stage of a product (Stamatis, 1995). It is also used in the context of risk management (Mohamed and Robinson, 2010) and from this perspective, “failure mode” must be understood as a “risk” as suggested in(Project Management Institute, 2013). The choice of FMEA is motivated by the NFRD requiring to focus specifically on (negative) risks and by its use in the literature for similar methods (Hsu et al., 2013). FMEA traditionally uses three indicators: occurrence (i.e. probability of failure), severity and detection (i.e. probability of not detecting a failure). However, as argued by many scholars (Bowles, 2003; Carbone and Tippett, 2015), the use of “detection” can be misleading and here it will be replaced by “control”. It is defined as “the ability of the risk response strategy to detect and control the root causes before they lead to the occurrence of the risk event, and to control the effect given the occurrence of the risk event” as suggested by Mohamed and Robinson (2010).

17
4.2. Framework of the methodology The methodology is made up of five steps: (1) Predefining stakes, (2) Identifying stakeholders, (3) Consulting stakeholders, (4) Analyzing and plotting results and (5) Identifying the material stakes. Steps 3 and 4 can be split in several sub-steps as seen in Figure 5. The following descriptions of steps 1 and 2 do not aim at comprehensively exploring these topics but only at presenting them.
Figure 5: Methodology framework within the materiality analysis framework
4.3. Predefining stakes The first step of the methodology involves creating a preliminary list of the stakes relevant to the organization’s activity. In accordance with the multidimensionality of materiality, all the sustainability topics that may cover the organization’s economic, environmental or social impact, or have an impact on the organization’s activity, or influence stakeholders’ assessments and decisions should be listed. To do so, several sources of information can be used:
- Internal documents of the organization - International frameworks (ISO 26 000 standard, GRI standards, NFRD, SASB, UN Global
Compact, etc.) - Media review regarding the organization and its sector - Comparison to other organizations of the sector
More specifically, as suggested by Bellantuono et al. (2016), an organization can usually use a broad list of stakes provided by an international framework like the ISO 26 000 standard or the GRI standards (see Table 1 and Appendix 1: List of GRI topicsErreur ! Source du renvoi introuvable.) and complement it with other stakes that are specific to the organization.

18
4.4. Identifying stakeholders The involvement of stakeholders is one of the core parts of CSR and the influence of sustainability topics on stakeholders’ assessments and decisions is one of the dimensions of the materiality analysis. The organization must identify the stakeholders to interview so they can evaluate to which extent they are influenced by the preliminary identified topics. Since the stakeholders are not equally relevant, the organization can prioritize them. Several frameworks can be used: for example, stakeholders can be distinguished between primary and secondary (Clarkson, 1995), or their salience can be assessed with three criteria, urgency, power and legitimacy (Mitchell et al., 1997). Moreover, a materiality analysis can be used as one of the first steps for stakeholder engagement. This process refers to the practices that a company uses to actively involve stakeholders in its activities (Friedman and Miles, 2006). For more information about stakeholder theory and engagement, see Freeman (2010) and Friedman and Miles (2006) and the AA1000 Stakeholder Engagement Standard (AccountAbility, 2018).
4.5. Consulting stakeholders 4.5.1. Weighting the criteria with AHP
As discussed in section 1., three criteria have to be considered: risks, opportunities and the influence
on assessments and decisions of stakeholders (summarized roughly as “Influence on stakeholders” in
figures). The hierarchy is represented Figure 6.
Figure 6: AHP network of materiality analysis
The first step of the AHP is to set up a pairwise comparison matrix A. If m is the number of criteria
considered, A is a m*m matrix. ajk represents the importance of the jth criterion relative to the kth
criterion. ajk and akj satisfy the following constraint: 𝑎𝑗𝑘 . 𝑎𝑘𝑗 = 1 (1)
The equation represents the fact that the importance of the jth criterion relative to the kth is the
inverse of the importance of the kth criterion relative to the jth.
Of course, ajj = 1, for all j.
The relative importance is measured according to a numerical scale from 1 to 9, the fundamental
scale from Saaty, 1980 (Table 5).

19
Table 5: Fundamental scale of judgement (Saaty, 1980)
Intensity of importance on an absolute scale
Definition Explanation
1 Equal importance Two activities contribute equally to the
objective
3 Moderate importance of one over another
Experience and judgement slightly favor one activity over another
5 Essential or strong importance
Experience and judgement strongly favor one activity over another
7 Very strong importance
An activity is strongly favored, and its dominance is demonstrated in practice
9 Extreme importance The evidence favoring one activity over
another is of the highest possible order of affirmation
2, 4, 6, 8 Intermediate values between the two adjacent judegments
When compromise is needed
Then, the normalized matrix Anorm is computed as:
�̅�𝑗𝑘 =𝑎𝑗𝑘
∑ 𝑎𝑙𝑘𝑚𝑙=1
(2)
The criteria weight vector w is built by averaging on each row of Anorm:
𝑤𝑗 =∑ �̅�𝑗𝑙
𝑚𝑙=1
𝑚 (3)
In the case of group decision-making, there are two ways to proceed: consensus vote and individual
judgements (Saaty, 1989). If individual judgements are used, geometric mean is recommended in
order to compute the group judgement (Saaty, 1989).
4.5.2. Assessing consistency of judgement
A comparison matrix A is said to be consistent if, for all i, j and k: 𝑎𝑖𝑗 . 𝑎𝑗𝑘 = 𝑎𝑖𝑘 (4)
In order to understand this notion of consistency, an example with three generic criteria A, B and C
can be used. If B is evaluated 3 to 1 compared to A, and A is evaluated 5 to 1 compared to C, and if
the judgement is perfectly consistent, B shall be evaluated as 15 to 1.
Saaty (1980) proved that a consistent matrix has its largest eigenvalue equal to the number of
criteria: 𝜆𝑚𝑎𝑥 = 𝑚 (5)
As the method is based on human judgement, a Consistency Index (CI) is defined and compared to
index based on randomly generated reciprocal matrix, the Random Consistency Index (RI).
𝐶𝐼 = 𝜆𝑚𝑎𝑥−𝑚
𝑚−1 (6)
Using Table 6, the Consistency Ratio (CR) is computed as:
𝐶𝑅 =𝐶𝐼
𝑅𝐼 (7)
20
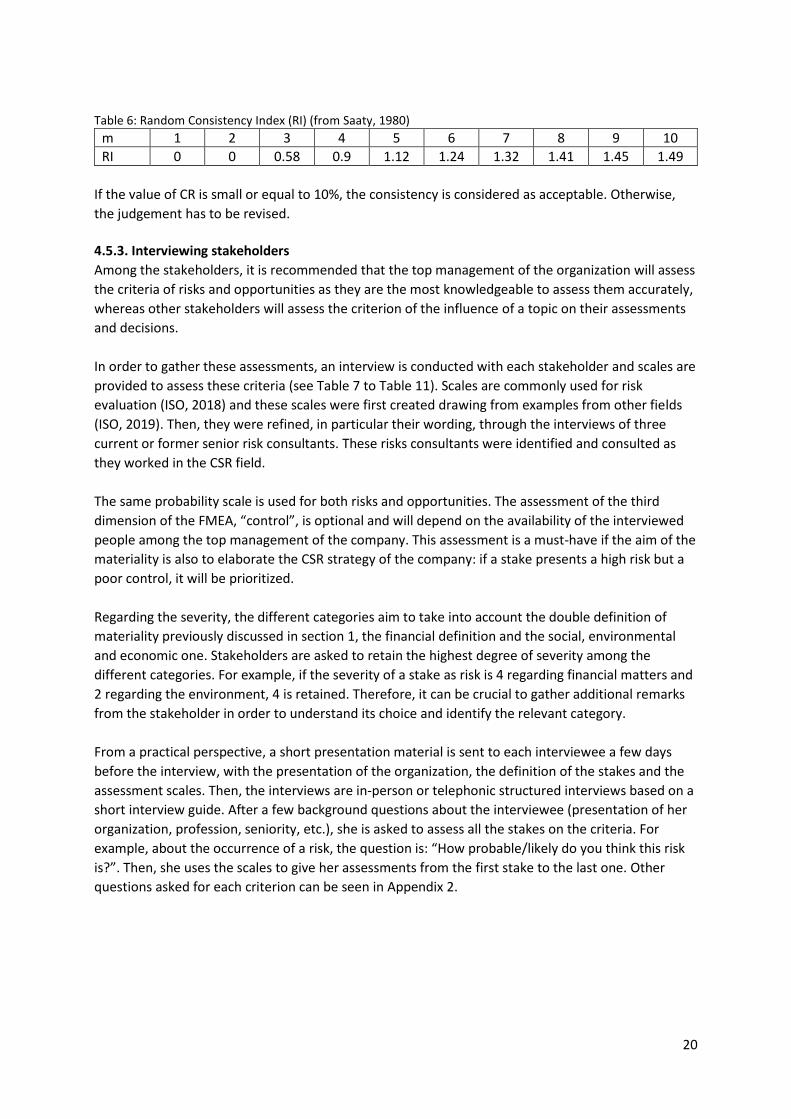
Table 6: Random Consistency Index (RI) (from Saaty, 1980)
m 1 2 3 4 5 6 7 8 9 10
RI 0 0 0.58 0.9 1.12 1.24 1.32 1.41 1.45 1.49
If the value of CR is small or equal to 10%, the consistency is considered as acceptable. Otherwise,
the judgement has to be revised.
4.5.3. Interviewing stakeholders
Among the stakeholders, it is recommended that the top management of the organization will assess
the criteria of risks and opportunities as they are the most knowledgeable to assess them accurately,
whereas other stakeholders will assess the criterion of the influence of a topic on their assessments
and decisions.
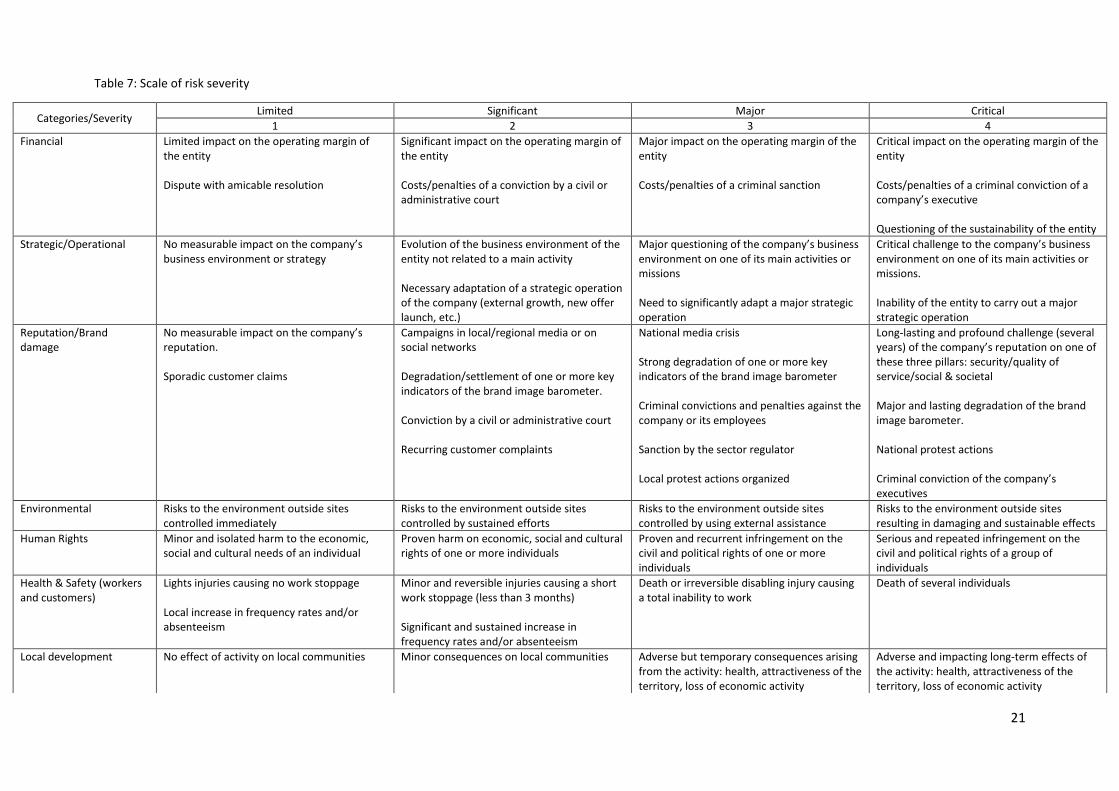
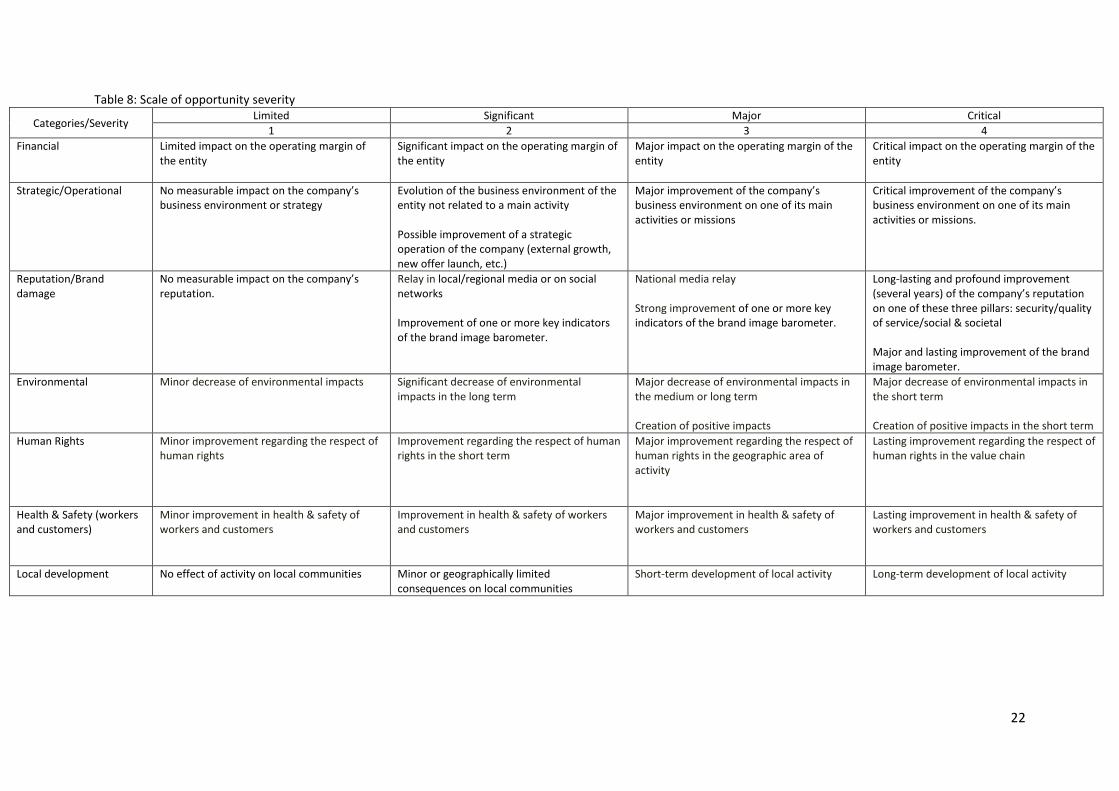
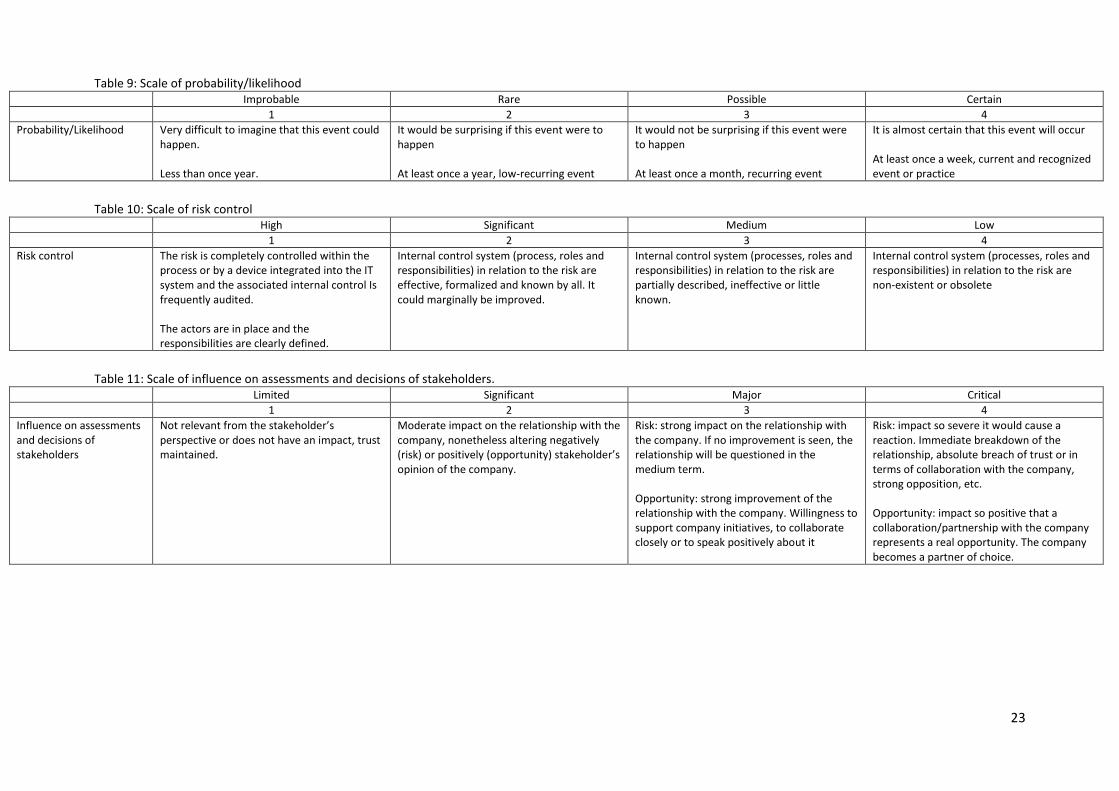
In order to gather these assessments, an interview is conducted with each stakeholder and scales are
provided to assess these criteria (see Table 7 to Table 11). Scales are commonly used for risk
evaluation (ISO, 2018) and these scales were first created drawing from examples from other fields
(ISO, 2019). Then, they were refined, in particular their wording, through the interviews of three
current or former senior risk consultants. These risks consultants were identified and consulted as
they worked in the CSR field.
The same probability scale is used for both risks and opportunities. The assessment of the third
dimension of the FMEA, “control”, is optional and will depend on the availability of the interviewed
people among the top management of the company. This assessment is a must-have if the aim of the
materiality is also to elaborate the CSR strategy of the company: if a stake presents a high risk but a
poor control, it will be prioritized.
Regarding the severity, the different categories aim to take into account the double definition of
materiality previously discussed in section 1, the financial definition and the social, environmental
and economic one. Stakeholders are asked to retain the highest degree of severity among the
different categories. For example, if the severity of a stake as risk is 4 regarding financial matters and
2 regarding the environment, 4 is retained. Therefore, it can be crucial to gather additional remarks
from the stakeholder in order to understand its choice and identify the relevant category.
From a practical perspective, a short presentation material is sent to each interviewee a few days
before the interview, with the presentation of the organization, the definition of the stakes and the
assessment scales. Then, the interviews are in-person or telephonic structured interviews based on a
short interview guide. After a few background questions about the interviewee (presentation of her
organization, profession, seniority, etc.), she is asked to assess all the stakes on the criteria. For
example, about the occurrence of a risk, the question is: “How probable/likely do you think this risk
is?”. Then, she uses the scales to give her assessments from the first stake to the last one. Other
questions asked for each criterion can be seen in Appendix 2.
21
Table 7: Scale of risk severity
Categories/Severity Limited Significant Major Critical
1 2 3 4
Financial Limited impact on the operating margin of the entity Dispute with amicable resolution
Significant impact on the operating margin of the entity Costs/penalties of a conviction by a civil or administrative court
Major impact on the operating margin of the entity Costs/penalties of a criminal sanction
Critical impact on the operating margin of the entity Costs/penalties of a criminal conviction of a company’s executive Questioning of the sustainability of the entity
Strategic/Operational No measurable impact on the company’s business environment or strategy
Evolution of the business environment of the entity not related to a main activity Necessary adaptation of a strategic operation of the company (external growth, new offer launch, etc.)
Major questioning of the company’s business environment on one of its main activities or missions Need to significantly adapt a major strategic operation
Critical challenge to the company’s business environment on one of its main activities or missions. Inability of the entity to carry out a major strategic operation
Reputation/Brand damage
No measurable impact on the company’s reputation. Sporadic customer claims
Campaigns in local/regional media or on social networks Degradation/settlement of one or more key indicators of the brand image barometer. Conviction by a civil or administrative court Recurring customer complaints
National media crisis Strong degradation of one or more key indicators of the brand image barometer Criminal convictions and penalties against the company or its employees Sanction by the sector regulator Local protest actions organized
Long-lasting and profound challenge (several years) of the company’s reputation on one of these three pillars: security/quality of service/social & societal Major and lasting degradation of the brand image barometer. National protest actions Criminal conviction of the company’s executives
Environmental Risks to the environment outside sites controlled immediately
Risks to the environment outside sites controlled by sustained efforts
Risks to the environment outside sites controlled by using external assistance
Risks to the environment outside sites resulting in damaging and sustainable effects
Human Rights Minor and isolated harm to the economic, social and cultural needs of an individual
Proven harm on economic, social and cultural rights of one or more individuals
Proven and recurrent infringement on the civil and political rights of one or more individuals
Serious and repeated infringement on the civil and political rights of a group of individuals
Health & Safety (workers and customers)
Lights injuries causing no work stoppage Local increase in frequency rates and/or absenteeism
Minor and reversible injuries causing a short work stoppage (less than 3 months) Significant and sustained increase in frequency rates and/or absenteeism
Death or irreversible disabling injury causing a total inability to work
Death of several individuals
Local development No effect of activity on local communities Minor consequences on local communities Adverse but temporary consequences arising from the activity: health, attractiveness of the territory, loss of economic activity
Adverse and impacting long-term effects of the activity: health, attractiveness of the territory, loss of economic activity
22
Table 8: Scale of opportunity severity
Categories/Severity Limited Significant Major Critical
1 2 3 4
Financial Limited impact on the operating margin of the entity
Significant impact on the operating margin of the entity
Major impact on the operating margin of the entity
Critical impact on the operating margin of the entity
Strategic/Operational No measurable impact on the company’s business environment or strategy
Evolution of the business environment of the entity not related to a main activity Possible improvement of a strategic operation of the company (external growth, new offer launch, etc.)
Major improvement of the company’s business environment on one of its main activities or missions
Critical improvement of the company’s business environment on one of its main activities or missions.
Reputation/Brand damage
No measurable impact on the company’s reputation.
Relay in local/regional media or on social networks Improvement of one or more key indicators of the brand image barometer.
National media relay Strong improvement of one or more key indicators of the brand image barometer.
Long-lasting and profound improvement (several years) of the company’s reputation on one of these three pillars: security/quality of service/social & societal Major and lasting improvement of the brand image barometer.
Environmental Minor decrease of environmental impacts Significant decrease of environmental impacts in the long term
Major decrease of environmental impacts in the medium or long term Creation of positive impacts
Major decrease of environmental impacts in the short term Creation of positive impacts in the short term
Human Rights Minor improvement regarding the respect of human rights
Improvement regarding the respect of human rights in the short term
Major improvement regarding the respect of human rights in the geographic area of activity
Lasting improvement regarding the respect of human rights in the value chain
Health & Safety (workers and customers)
Minor improvement in health & safety of workers and customers
Improvement in health & safety of workers and customers
Major improvement in health & safety of workers and customers
Lasting improvement in health & safety of workers and customers
Local development No effect of activity on local communities Minor or geographically limited consequences on local communities
Short-term development of local activity
Long-term development of local activity
23
Table 9: Scale of probability/likelihood Improbable Rare Possible Certain
1 2 3 4
Probability/Likelihood Very difficult to imagine that this event could happen. Less than once year.
It would be surprising if this event were to happen At least once a year, low-recurring event
It would not be surprising if this event were to happen At least once a month, recurring event
It is almost certain that this event will occur At least once a week, current and recognized event or practice
Table 10: Scale of risk control
High Significant Medium Low
1 2 3 4
Risk control The risk is completely controlled within the process or by a device integrated into the IT system and the associated internal control Is frequently audited. The actors are in place and the responsibilities are clearly defined.
Internal control system (process, roles and responsibilities) in relation to the risk are effective, formalized and known by all. It could marginally be improved.
Internal control system (processes, roles and responsibilities) in relation to the risk are partially described, ineffective or little known.
Internal control system (processes, roles and responsibilities) in relation to the risk are non-existent or obsolete
Table 11: Scale of influence on assessments and decisions of stakeholders.
Limited Significant Major Critical
1 2 3 4
Influence on assessments and decisions of stakeholders
Not relevant from the stakeholder’s perspective or does not have an impact, trust maintained.
Moderate impact on the relationship with the company, nonetheless altering negatively (risk) or positively (opportunity) stakeholder’s opinion of the company.
Risk: strong impact on the relationship with the company. If no improvement is seen, the relationship will be questioned in the medium term. Opportunity: strong improvement of the relationship with the company. Willingness to support company initiatives, to collaborate closely or to speak positively about it
Risk: impact so severe it would cause a reaction. Immediate breakdown of the relationship, absolute breach of trust or in terms of collaboration with the company, strong opposition, etc. Opportunity: impact so positive that a collaboration/partnership with the company represents a real opportunity. The company becomes a partner of choice.

24
4.6. Analyzing and plotting results 4.6.1. Plotting results
Following the interviews, data is aggregated through the use of arithmetic mean and risk and
opportunity are computed as the addition of severity and probability as suggested by Solomon et al.
(2017), then divided by 2 in order to stay within a scale of 1 to 4.
Among the possible plot of data, three are most relevant in a NFRD perspective: risk severity vs. risk
probability or risk vs. influence on stakeholders as they can already enable to identify the risks to
report more specifically, and also opportunity vs. influence on stakeholders as the most material of
these stakes must also be reported.
4.6.2. Calculating the unique value
In order to compute a unique value for each stake, a score matrix S is defined as Sij being the score of
the ith stake regarding the jth criterion. S is therefore a n*m matrix.
The unique value is given by: 𝑣 = 𝑆. 𝑤 (8)
4.6.3. Optional: setting a threshold
A method based on a global score of 3 for all criteria is suggested in order to identify a specific
threshold and therefore the material stakes. Nevertheless, it is important to underline that this
decision ultimately depends on the company’s strategy and aims and can hardly be boiled down to a
division in two of the list of stakes. Such determination requires also to focus on qualitative analysis
(Hsu et al., 2013).
A common practice is analyzing the values in Pareto fashion by choosing the “Top “X” issues” of the
list. The X-value is a random choice: it could be 5, 10 or 15. This makes the decision-making
problematic (Bluvband and Grabov, 2009). A suggested solution (Bluvband and Grabov, 2009) is to
compare the unique value to a hypothetical stake scored as 3 for all criteria, therefore considered as
a “major” risk or opportunity.
Therefore, the threshold could be defined as: 𝑡 = [3|3|3]. 𝑤 (9)
4.7. Identifying material stakes Eventually, through the ranking of the stakes and the definition of a threshold, the organization can identify its material stakes.

25
4.8. Application to a company
4.8.1. Presentation of the company The method was applied to a food processing company operating in more than a dozen countries and
employing several thousand workers. With the approval of the two CSR managers, a list of stakes was
created and refined. Then, interviews were conducted with employees acknowledged as “experts” of
their area and with external stakeholders, in person when possible and otherwise by telephone. This
company was not specifically chosen but the opportunity to conduct this materiality analysis
presented itself to the author of this report.
It was decided not to take in account the salience of stakeholders and not to assess the “control”
criteria, for reasons of simplicity.
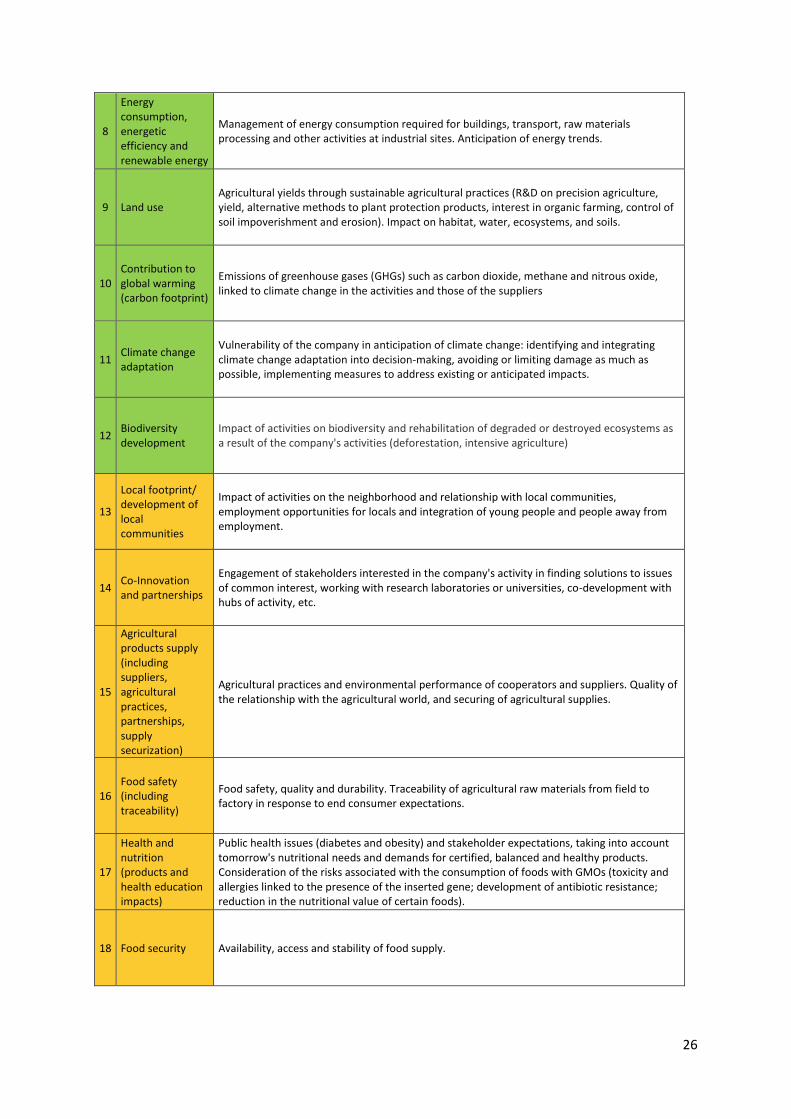
4.8.2. List of stakes Using the sources of information in 3.2, as well as the OECD/FAO document on “Guidance for
Responsible Agricultural Supply Chains” (OCDE/FAO, 2016), a list of stakes was identified for the
company, organized in four categories: governance (grey), environment (green), societal (yellow) and
social (red) (Table 12).
Table 12: List of identified stakes for the company
1 Accountability / Transparency
Risk management and action in response to concerns (of employees or collaborating organizations), confidential and protective alert mechanism for the whistleblower in the event of an incident. Transparency on dysfunctions and on the management of the activities, and on the remuneration of managers.
2 Compliance Compliance to legislations in the countries of commercial activity.
3 Water pollution / Waste waters
Treatment of wastewater and decrease of substance from water discharge (pesticides).
4 Waste management
Production and sorting of waste, recycling, reuse, etc.
5 Noise, air and soil pollution
Noise and odor pollution, air and soil pollution, in particular linked to the use of pesticides, and any other form of pollution specific to the company's industrial and agricultural activity.
6
Water consumption, water supply according to local constraints
Quantity of water consumed from an industrial and agricultural point of view, including its availability, and the needs of the populations in a given territory. Water recycling, in particular by reintroducing water used in the agricultural production process (fertilization, irrigation) and processing.
7
Raw materials consumption, use efficiency/ Food waste / Circular economy
Consumption of raw materials and their efficient use1
26
8
Energy consumption, energetic efficiency and renewable energy
Management of energy consumption required for buildings, transport, raw materials processing and other activities at industrial sites. Anticipation of energy trends.
9 Land use Agricultural yields through sustainable agricultural practices (R&D on precision agriculture, yield, alternative methods to plant protection products, interest in organic farming, control of soil impoverishment and erosion). Impact on habitat, water, ecosystems, and soils.
10 Contribution to global warming (carbon footprint)
Emissions of greenhouse gases (GHGs) such as carbon dioxide, methane and nitrous oxide, linked to climate change in the activities and those of the suppliers
11 Climate change adaptation
Vulnerability of the company in anticipation of climate change: identifying and integrating climate change adaptation into decision-making, avoiding or limiting damage as much as possible, implementing measures to address existing or anticipated impacts.
12 Biodiversity development
Impact of activities on biodiversity and rehabilitation of degraded or destroyed ecosystems as a result of the company's activities (deforestation, intensive agriculture)
13
Local footprint/ development of local communities
Impact of activities on the neighborhood and relationship with local communities, employment opportunities for locals and integration of young people and people away from employment.
14 Co-Innovation and partnerships
Engagement of stakeholders interested in the company's activity in finding solutions to issues of common interest, working with research laboratories or universities, co-development with hubs of activity, etc.
15
Agricultural products supply (including suppliers, agricultural practices, partnerships, supply securization)
Agricultural practices and environmental performance of cooperators and suppliers. Quality of the relationship with the agricultural world, and securing of agricultural supplies.
16 Food safety (including traceability)
Food safety, quality and durability. Traceability of agricultural raw materials from field to factory in response to end consumer expectations.
17
Health and nutrition (products and health education impacts)
Public health issues (diabetes and obesity) and stakeholder expectations, taking into account tomorrow's nutritional needs and demands for certified, balanced and healthy products. Consideration of the risks associated with the consumption of foods with GMOs (toxicity and allergies linked to the presence of the inserted gene; development of antibiotic resistance; reduction in the nutritional value of certain foods).
18 Food security Availability, access and stability of food supply.

27
19
Innovation and adaptation to consumption patterns (clients and customers)
Development of innovative products and solutions to meet tomorrow's nutritional needs. Anticipating market developments and food trends.
20 Corruption Practices of corruption and extortion and conflicts of interest in our activities, among the subcontractors and in any other entity with which commercial or political/administrative relations has been established.
21 Marketing and communication
Responsible marketing and communication practices throughout the product portfolio: reliability of marketing messages regarding nutrition/health and the origin of raw materials.
22 Products labelling Reliable and clear information to consumers about the list of ingredients and nutritional information on packaging.
23 Cyber security / Data protection
Management of strategic information for the company, personal data of employees and customers, attacks (intrusion attempts, viruses, unsolicited e-mails, etc.). Insider trading.
24 Diversity and discrimination
Discriminatory practices in employment and occupation, in particular on the grounds of sex, disability, family situation, sexual orientation, age, political opinions, religious beliefs, trade union activity, racial, social, cultural or national origin. Promotion of the diversity of profiles. Promoting women's access to managerial and executive positions and equal pay.
25 Living wages
Compliance of wages and other forms of remuneration with national legislation, regulations or collective agreements, and at least adapted to the needs of workers and their families. Taking into account the general level of wages in the country, the cost of living and social security benefits in wage setting, negotiated with workers or their representatives.
26 Working conditions
Impact of the activity on well-being at work and on the working environment, working hours, rest and holiday periods, work/life balance. Practices in corporate discipline and social protection. Effects of income reduction in the event of work accident, illness, maternity, paternity, ageing or incapacity.
27
Social dialog (information, consultation and negotiations with workers and trade unions)
Negotiation, consultation and exchange of information between representatives of governments, employers and workers on matters of common interest. Elections of workers' representatives by the members of their trade union or by the relevant workers.
28 Workers’ health and safety
Safety of employees and subcontractors in the workplace (agricultural and production sites), protection of physical health, including exposure to phytosanitary products, and mental health.
29 Human capital development
Employee career management, individual development, marketability and internal promotion
30 Attractivity to talents
Retention of talent to enable continuous improvement, transmission of knowledge and skills.
28
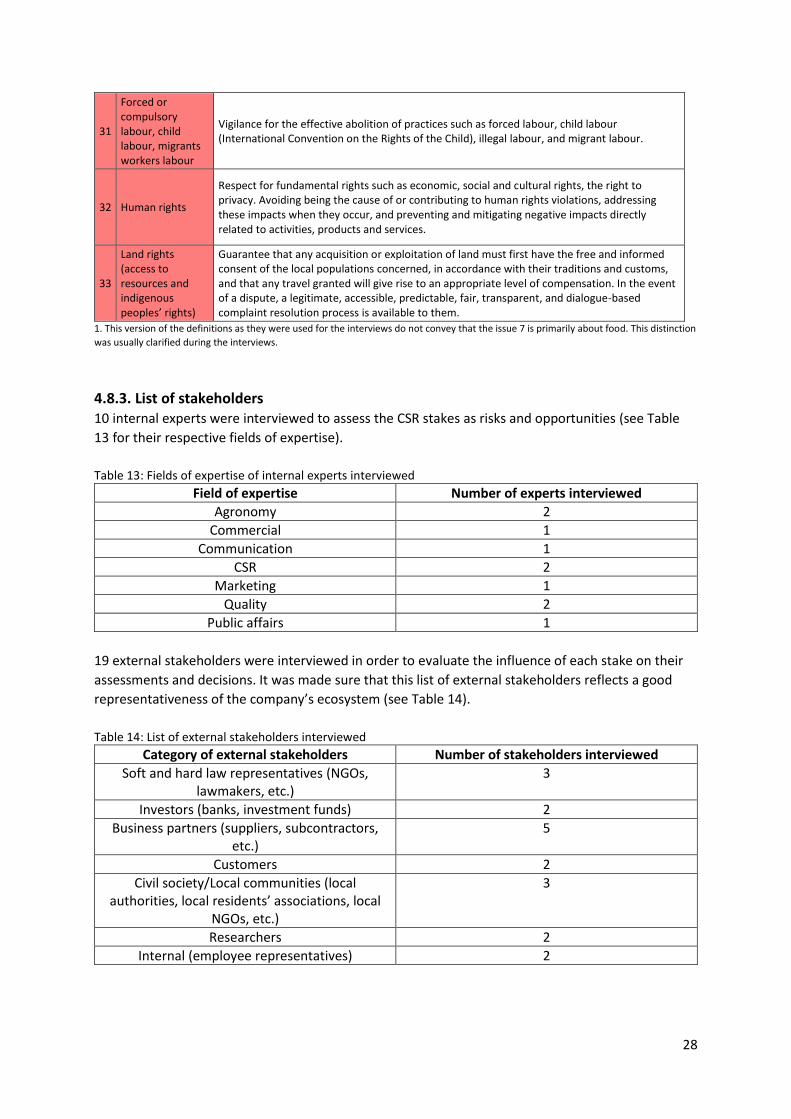
31
Forced or compulsory labour, child labour, migrants workers labour
Vigilance for the effective abolition of practices such as forced labour, child labour (International Convention on the Rights of the Child), illegal labour, and migrant labour.
32 Human rights
Respect for fundamental rights such as economic, social and cultural rights, the right to privacy. Avoiding being the cause of or contributing to human rights violations, addressing these impacts when they occur, and preventing and mitigating negative impacts directly related to activities, products and services.
33
Land rights (access to resources and indigenous peoples’ rights)
Guarantee that any acquisition or exploitation of land must first have the free and informed consent of the local populations concerned, in accordance with their traditions and customs, and that any travel granted will give rise to an appropriate level of compensation. In the event of a dispute, a legitimate, accessible, predictable, fair, transparent, and dialogue-based complaint resolution process is available to them.
1. This version of the definitions as they were used for the interviews do not convey that the issue 7 is primarily about food. This distinction
was usually clarified during the interviews.
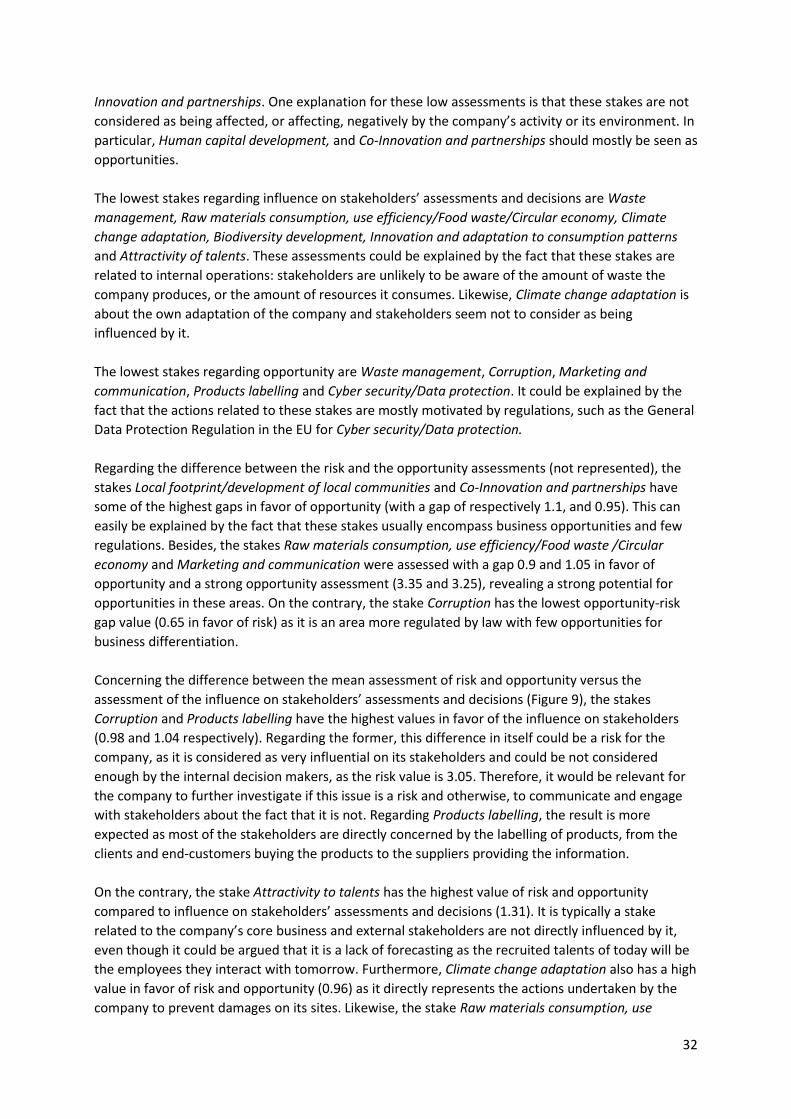
4.8.3. List of stakeholders 10 internal experts were interviewed to assess the CSR stakes as risks and opportunities (see Table
13 for their respective fields of expertise).
Table 13: Fields of expertise of internal experts interviewed
Field of expertise Number of experts interviewed
Agronomy 2
Commercial 1
Communication 1
CSR 2
Marketing 1
Quality 2
Public affairs 1
19 external stakeholders were interviewed in order to evaluate the influence of each stake on their
assessments and decisions. It was made sure that this list of external stakeholders reflects a good
representativeness of the company’s ecosystem (see Table 14).
Table 14: List of external stakeholders interviewed
Category of external stakeholders Number of stakeholders interviewed
Soft and hard law representatives (NGOs, lawmakers, etc.)
3
Investors (banks, investment funds) 2
Business partners (suppliers, subcontractors, etc.)
5
Customers 2
Civil society/Local communities (local authorities, local residents’ associations, local
NGOs, etc.)
3
Researchers 2
Internal (employee representatives) 2

29
5. Results and consequences for decisions The two CSR managers of the company performed the AHP assessment between the criteria. The
corresponding matrices can be seen in Appendix 3 and Appendix 4 and the consolidated and
normalized matrices are shown in Table 15 and Table 16.
Table 15: Consolidated AHP matrix (2 digits)
Risk Opportunity Influence on stakeholder
Risk 1 5.92 4.47
Opportunity 0.17 1 0.41
Influence on stakeholder
0.22 2.45 1
Using (2), the normalized consolidated AHP matrix is represented Table 16.
Table 16: Normalized consolidated AHP matrix (2 digits)
Risk Opportunity Influence on stakeholder
Risk 0.72 0.63 0.76
Opportunity 0.12 0.11 0.07
Influence on stakeholder
0.16 0.26 0.17
Using (3), the criteria weight vector is equal to:
𝑤 = [0.7030.0990.197
]
The criteria weight vector reveals a strong aversion to risks from the two CSR managers interviewed,
the weight of the risk being much more important than the ones of the other criteria combined (70%
vs. 30%). Moreover, the influence on stakeholders’ assessments and decisions is considered as twice
as important as the opportunity criterion (20% vs. 10%).
This distribution can be explained by a vision of CSR as a constraint and another source of risks for an
organization. Moreover, as revealed by the interviews, it is often much more difficult to anticipate
opportunities than risks, potentially because a risk vision is reactive whereas an opportunity vision is
proactive.
Using (6) and (7), the primary eigenvalue and the consistency index and ratio are equal to:
𝜆 = 3.069
𝐶𝐼 = 0.0347
𝐶𝑅 = 5.97 < 10%
The quantitative results of the interviews can be seen in Appendix 5 and in FiguresFigure 7 to Figure
9.
The consistency ratio is inferior to 10%, meaning that the judgements were indeed consistent.

30
Figure 7: Risk vs. Influence on stakeholders’ assessments and decisions
Figure 8: Opportunity vs. Influence on stakeholders’ assessments and decisions

31
Figure 9: Mean (Risk;Opportunity) vs. Influence on stakeholders’ assessments and decisions
Figures Figure 7 to Figure 9 are useful to look at the disparities between the assessments for a
specific stake. If a stake is close to the diagonal, it means that both X and Y values are close to each
other and there is harmony between both assessments by stakeholders. On the contrary, if a stake is
far from the diagonal, it means that there is disharmony between both assessments.
Figure 7 shows that the stakes Forced or compulsory labour, child labour, migrants workers labour,
and Human rights, are equally considered as representing a high risk and being influential on
stakeholders’ assessments and decisions. On the other hand, Corruption and Workers’ health and
safety are highly assessed but higher as a risk for the former and higher as being influential on
stakeholders’ assessments and decisions for the latter.
Figure 8 shows that the stakes Accountability/Transparency, Living wages, Workers’ health and
safety, Forced or compulsory labour, child labour, migrants workers labour, Human rights and Land
rights are evaluated as a high opportunity as well as being very influential on stakeholders’
assessments and decisions. On the other hand, Contribution to global warming, Health and nutrition
and Marketing and communication, are highly assessed but higher as an opportunity. On the
contrary, Compliance, Water pollution/Waste waters, Noise, air and soils pollutions, Food safety,
Corruption, Products labelling and Diversity and discrimination are also highly assessed but higher as
being influential on stakeholders’ assessments and decisions.
Inevitably, Figure 9 shows that the stakes Workers’ health and safety, Forced or compulsory labour,
child labour, migrants workers labour, and Human rights, are equally considered as representing a
high risk/opportunity and being influential on stakeholders’ assessments and decisions.
The lowest stakes regarding risk are Waste management, Biodiversity development, Local
footprint/development of local communities, Products labelling, Human capital development, and Co-
32
Innovation and partnerships. One explanation for these low assessments is that these stakes are not
considered as being affected, or affecting, negatively by the company’s activity or its environment. In
particular, Human capital development, and Co-Innovation and partnerships should mostly be seen as
opportunities.
The lowest stakes regarding influence on stakeholders’ assessments and decisions are Waste
management, Raw materials consumption, use efficiency/Food waste/Circular economy, Climate
change adaptation, Biodiversity development, Innovation and adaptation to consumption patterns
and Attractivity of talents. These assessments could be explained by the fact that these stakes are
related to internal operations: stakeholders are unlikely to be aware of the amount of waste the
company produces, or the amount of resources it consumes. Likewise, Climate change adaptation is
about the own adaptation of the company and stakeholders seem not to consider as being
influenced by it.
The lowest stakes regarding opportunity are Waste management, Corruption, Marketing and
communication, Products labelling and Cyber security/Data protection. It could be explained by the
fact that the actions related to these stakes are mostly motivated by regulations, such as the General
Data Protection Regulation in the EU for Cyber security/Data protection.
Regarding the difference between the risk and the opportunity assessments (not represented), the
stakes Local footprint/development of local communities and Co-Innovation and partnerships have
some of the highest gaps in favor of opportunity (with a gap of respectively 1.1, and 0.95). This can
easily be explained by the fact that these stakes usually encompass business opportunities and few
regulations. Besides, the stakes Raw materials consumption, use efficiency/Food waste /Circular
economy and Marketing and communication were assessed with a gap 0.9 and 1.05 in favor of
opportunity and a strong opportunity assessment (3.35 and 3.25), revealing a strong potential for
opportunities in these areas. On the contrary, the stake Corruption has the lowest opportunity-risk
gap value (0.65 in favor of risk) as it is an area more regulated by law with few opportunities for
business differentiation.
Concerning the difference between the mean assessment of risk and opportunity versus the
assessment of the influence on stakeholders’ assessments and decisions (Figure 9), the stakes
Corruption and Products labelling have the highest values in favor of the influence on stakeholders
(0.98 and 1.04 respectively). Regarding the former, this difference in itself could be a risk for the
company, as it is considered as very influential on its stakeholders and could be not considered
enough by the internal decision makers, as the risk value is 3.05. Therefore, it would be relevant for
the company to further investigate if this issue is a risk and otherwise, to communicate and engage
with stakeholders about the fact that it is not. Regarding Products labelling, the result is more
expected as most of the stakeholders are directly concerned by the labelling of products, from the
clients and end-customers buying the products to the suppliers providing the information.
On the contrary, the stake Attractivity to talents has the highest value of risk and opportunity
compared to influence on stakeholders’ assessments and decisions (1.31). It is typically a stake
related to the company’s core business and external stakeholders are not directly influenced by it,
even though it could be argued that it is a lack of forecasting as the recruited talents of today will be
the employees they interact with tomorrow. Furthermore, Climate change adaptation also has a high
value in favor of risk and opportunity (0.96) as it directly represents the actions undertaken by the
company to prevent damages on its sites. Likewise, the stake Raw materials consumption, use

33
efficiency/Food waste /Circular economy can be analyzed in the same way, stakeholders may not be
influenced by the opportunities in this area as they are considered mostly economical.
With (8), the unique value can eventually be computed (see Table 17).
Table 17: Unique value of stakes and associated rank
Unique value
Rank
1 Accountability / Transparency 2.972 10
2 Compliance 2.860 15
3 Water pollution / Waste waters 2.950 11
4 Waste management 1.992 33
5 Noise, air and soil pollution 2.783 18
6 Water consumption, water supply according to local constraints 2.902 12
7 Raw materials consumption, use efficiency/ Food waste / Circular economy 2.500 24
8 Energy consumption, energetic efficiency and renewable energy 2.984 7
9 Land use 2.570 23
10 Contribution to global warming (carbon footprint) 3.145 4
11 Climate change adaptation 2.981 8
12 Biodiversity development 2.088 31
13 Local footprint/ development of local communities 2.202 30
14 Co-Innovation and partnerships 2.306 28
15 Agricultural products supply (including suppliers, agricultural practices, partnerships, supply securization)
3.059 6
16 Food safety (including traceability) 2.974 9
17 Health and nutrition (products and health education impacts) 2.862 14
18 Food security 2.779 19
19 Innovation and adaptation to consumption patterns (clients and customers) 2.495 25
20 Corruption 3.115 5
21 Marketing and communication 2.463 26
22 Products labelling 2.047 32
23 Cyber security / Data protection 2.743 22
24 Diversity and discrimination 2.754 20
25 Living wages 2.750 21
26 Working conditions 2.800 16
27 Social dialog (information, consultation and negotiations with workers and trade unions)
2.381 27
28 Workers’ health and safety 3.492 1
29 Human capital development 2.213 29
30 Attractivity to talents 2.881 13
31 Forced or compulsory labour, child labour, migrants workers labour 3.234 3
32 Human rights 3.454 2
33 Land rights (access to resources and indigenous peoples’ rights) 2.787 17
The stakes can therefore be represented in descending order (Figure 10).
Through the computation of the unique value, the highest stakes belong to the social category and
are related to basic rights (Figure 10 and Table 17): Worker’s health and safety (3.492), Human rights
(3.454) and Forced or compulsory labour, child labour, migrants workers labour (3.234). The following
stakes are the Contribution to global warming (3.145), and two societal stakes, Corruption (3.115)
and Agricultural products supply (3.059), the latter being directly related to the core business of the
company.

34
The lowest stakes are Waste management (1.992), Products labelling (2.047), Biodiversity
development (2.088), Local footprint/development of local communities (2.202) and Human capital
development (2.213).
Regarding the consequences for decisions, the values of the twenty-two first stakes being close (with
an average gap of 0.036 between two successive stakes), setting a threshold was not obvious.
From a non-financial reporting perspective, it is required to focus specifically on the stakes
considered as risks. In order to make sure that those stakes were taken into account in the list of
material stakes, a new weight vector was defined without the opportunity criterion:
𝑤𝑅𝑖𝑠𝑘/𝑆𝐻 = [0.7810.219
]
The resulting table comparing the ranks of the stakes with the unique value and this new weight
vector can be seen in Appendix 6.
In agreement with the two CSR managers of the company, the threshold was set at 2.8 in order to
balance the will of tackling all of the most important stakes and avoiding having a list of material
stakes too long. As seen in Appendix 6, the sixteen most material stakes are taken into account in this
list, regardless of the weight vector used.
Thus, the select stakes are (in order): Workers’ health and safety, Human rights, Forced or
compulsory labour/child labour/migrants workers labour, Contribution to global warming,
Corruption, Agricultural products supply, Energy consumption, energetic efficiency and renewable
energy, Climate change adaptation, Food safety (including traceability), Accountability/Transparency,
Water pollution/waste waters, Water consumption, water supply according to local constraints,
Attractivity to talents, Health and nutrition, Compliance, Working conditions.
In the final list of material stakes, there are therefore 2 stakes related to the governance, 5 related to
the environment, 4 societal stakes and eventually 5 social stakes. In the governance category, all of
the stakes were defined as material. In the environmental category, the material stakes are linked to
climate change, through the carbon footprint of the company, the consumption of energy and the
measures the company takes to adapt to future consequences. The stakes related to water, both its
consumption and its pollution, were also defined as material. In the societal category, the stakes
related to the supply chain were selected, including the safety and the traceability of the food. The
health impacts of the food were also considered as material, as well as the practices of corruption. In
the social category, all the stakes broadly related to human rights and working conditions were
considered as material, with the addition of the stake related to the retention and attraction of
talents.
Following this analysis, the company will then have to report on these issues, in agreement with the
NFRD guidelines. If the company wants to use these results to guide its CSR strategy, it will have then
to look for ways of improvement and of seizing opportunities. In particular, the company will first
have to check if the risk and opportunity assessments are representative of the reality: the
assessments express a perception which could have been influenced by several factors.
Recommended practices for giving structure to a CSR strategy are beyond the scope of this report.

35
Figure 10: Unique value of stakes ranked in descending order
1,5
2,0
2,5
3,0
3,5
Un
iqu
e va
lue

36
In order to assess the impacts of the AHP part of the method, three other scenarios are considered
(summarized in Table 18). In the first one, all criteria are equally weighted, simulating the absence of
the AHP from the method. The two other scenarios consider that the highest weight value (around
70%) is attributed to another criterion whereas the other two criteria are equally weighted.
Table 18: Weight vectors of the scenarios
Original judgement
Scenario 1 Scenario 2 Scenario 3
Risk 0.703 0.33 0.15 0.15
Opportunity 0.099 0.33 0.70 0.15
Influence on SH 0.197 0.33 0.15 0.70
The results and the changes in ranks can be seen in Appendix 7.
Regarding the first scenario, the range of rank changes goes from -14 to +10 and the mean (absolute)
change is 3.42. Considering the fact that there are 33 stakes, not using AHP, which corresponds to
the first scenario, would have resulted in a mean rank change of 10.4%. From the sixteen stakes
identified as material, 4 would then have been excluded: Water consumption, water supply according
to local constraints, Energy consumption, energetic efficiency and renewable energy, Climate change
adaptation and Working conditions. They would have been replaced by: Food security, Diversity and
discrimination, Living wages, and Land rights (access to resources and indigenous peoples’ rights).
However, in that scenario, and considering the same threshold of 2.8, 3 of the excluded stakes would
have been included nevertheless (Water consumption, water supply according to local constraints,
Climate change adaptation, and Working conditions) and another one added: Noise, air and soil
pollution. It is worth noting that in this scenario, environmental issues face a severe drop.
For the second scenario, the range of rank changes goes from -22 to +17 and the mean (absolute)
change is 6.45. The largest changes of ranks are Corruption (-22), Energy consumption, energetic
efficiency and renewable energy (-19) and Marketing and communication (+17). For the third
scenario, the range of rank changes goes from -22 to +12 and the mean (absolute) change is 6.12.
The largest changes of ranks are Climate change adaptation (-22), Attractivity to talents (-19) and
Energy consumption, energetic efficiency and renewable energy (-17). The largest increase is Land
rights (+12).
As the second and third scenarios favor one criteria over the others, the changes can actually be
forecast from Figures Figure 7 to Figure 9: the largest changes match the largest disharmonies. The
extent of the changes in all scenarios underlines the influence of the AHP part of the methodology:
the weighting of the criteria is a major step which will heavily affect the results.

37
6. Discussion The aim of this report was to develop a quantitative approach to conduct a CSR materiality analysis in
response to a knowledge gap. Therefore, a method using AHP and FMEA was developed. This
method was then applied to a company. This application enabled to identify the material topics of
the company and it also enabled to evaluate the practical use of the method.
In particular, it can be acknowledged that most of necessary features of the method, defined in
section 2, were met:
- The method respects the multidimensionality of materiality, presented in section 1, and it is
in accordance with the NFRD guidelines, by adopting the double-definition of materiality:
financial and environmental/social and using the three criteria of risk, opportunity and
influence on stakeholders’ assessments & decisions. These three criteria are assessed during
the step 3.3 by stakeholders through interviews.
- This method is an engagement tool of stakeholders by interviewing them for the assessment
of the criteria. The stakeholders are interviewed during the step 3.3.
- Even though it was not used for the presented application, the method allows to accentuate
specific stakeholders’ opinions by weighing their assessments. This weighting can be done
before the step 3.3.
- Through the use of assessment scales, the method attempts to deal with the ambiguity and
uncertainty of subjectivity. This subject will be discussed herein below. The method
successfully checks for consistency of judgement in the AHP part through the computation of
the consistency ratio. This check is done during the step 3.2.
- The method does result in a simple visual representation by plotting the results and ranking
the issues according to the unique value of assessment, enabling any reader to easily
understand the conclusions of the analysis. The results are plotted during the steps 4.1 and
4.2.
- The unique value enables to set a materiality threshold even though this threshold remains
to be decided by the company performing the materiality analysis. This threshold is set
during the step 4.3.
- As presented through the application of the method, its implementation may not require a
lot of time and resources compared to other existing methods, thanks to a trade-off between
accuracy and efforts.
The feature of compromising between accuracy and efforts results in stakeholders being asked to
assess the CSR issues on one or two criteria. Based on the interviews conducted, this act usually
requires a span of concentration of almost one hour. Even though it is a factor of the number of CSR
issues, this effort is much lower than other methods requiring stakeholders to do pairwise
comparisons between issues, resulting in much more assessments (Calabrese et al., 2017, for
example). It can be considered that, for a given stake, 7 assessments are required for our method. If
n stakes must be assessed, there are therefore 7*n assessments to be made. Using pairwise
comparisons, even with only 1 criteria, it would require n*(n-1)/2 comparisons. A quick computation
(Table 19) shows that if n>15, the method presented requires less assessments. Once again, it is
supposed here that the pairwise comparisons are made for only 1 criteria. If 2 criteria are used, as
early as n=9, the method presented require less assessments (63 vs. 72).

38
Table 19: Comparisons of assessments required between methods
Number of stakes Method presented Pairwise comparisons,
with 1 criteria
9 63 36
10 70 45
11 77 55
12 84 66
13 91 78
14 98 91
15 105 105
16 112 120
17 119 136
18 126 153
19 133 171
20 140 190
21 147 210
22 154 231
23 161 253
24 168 276
25 175 300
26 182 325
27 189 351
28 196 378
29 203 406
30 210 435
Other methods using pairwise comparisons of a verbal scale (Bellantuono et al., 2016) require a
similar but slightly higher effort from stakeholders compared to the method presented, as 10
additional assessments are required for setting up a 5-point scale. This number must be then
multiplied by the number of scales used.
The trade-off between accuracy and efforts is motivated by facilitating the implementation of the
method, especially for SMEs which may not have enough resources and time to devote to a
materiality analysis, as mentioned in section 2. The developed method does not require any specific
skill and it is comprehensively described within the pages of this report. Therefore, it is believed that
this method can be applied by SMEs with little time and resources and can be the stepping stone of
implementing a CSR approach. From a practical perspective, a spreadsheet tool could be developed,
by a federation of companies for example, in order to save the resources allotted to the aggregation
and plot of the results. In compensation, it could enable the federation to collect data on common
material topics across its members.
From the papers included in the literature review, none of them openly considered the CSR issues as
opportunities. Even though this criterion was harder to assess by some stakeholders, as they had
difficulties to anticipate such a scenario, it can be relevant to underline this aspect of CSR. Indeed,
CSR is usually seen as a cost factor and companies’ approaches are influenced by their business
39
imperatives rather than a wider commitment to sustainability (Jones et al., 2016). Therefore,
underlining the possibility of creating value could be a lever of engagement.
Regarding the relevancy of the method, it can be hard to assess it since there is no perfect answer as
to which stakes are material. The feedback gathered informally at the end of the interviews was
really positive and the interviewed stakeholders saw this as a relevant engagement lever.
Nevertheless, the preparation for interviews is a crucial step. Both internal and external stakeholders
may not be totally honest, for different reasons, and it is important to assert them that their
assessments and comments are confidential. Likewise, it is in the interest of the company that they
speak their mind. Therefore, the question of the interviews being conducted internally raise the
question of trust among employees, especially if the interviewer and the interviewee are linked
hierarchically. It may be relevant to review literature suggested in section 3.4 about stakeholder
theory and stakeholder engagement, namely Freeman (2010), Friedman and Miles (2006) and the
AA1000 Stakeholder Engagement Standard (AccountAbility, 2018), in order to reduce uncertainty
linked to this step.
Regarding the handling of subjectivity of individuals, it must be acknowledged that the assessment
scales do not enable to assert that they successfully reduce the ambiguity and uncertainty of
subjective judgements. Even though some papers argue against using scales for risk assessment
(Hubbard and Evans, 2010), no other methods seem to be used in the materiality analysis literature.
As some methods attempt to reduce the ambiguity due to the vocabulary used by performing
pairwise comparisons of a verbal assessment scale (Bellantuono et al., 2016), it would be notably
recommended to increase the quantification of the scales, i.e. using numbers to distinguish between
the different grades. An idea would be to try to assess the economic value for the society of the risks
and opportunities, which will require further research. It cannot be easily done for all the categories
of risk/opportunity severity but an example would be to use the economic valuation of ecosystem
services lost/preserved due to the company’s activity for the environmental category. Another
example would be to use the economic value of life for the health and safety category.
Moreover, further research into the factors influencing the assessment of a stakeholder is required.
There is a lot of uncertainty regarding the consistency of the assessment of a stakeholder over time.
Factors like the mood of the interviewee, the time of the day or even recent news stories may heavily
influence the individual perceptions and create biases. Even if the individual assessments are bound
to be affected by current trends and the personal experience of the stakeholder, it should be
consistent from month to month. Further research would enable to reach such goal by enabling to
control or take into account the factors influencing the assessment of a stakeholder.
Another potential weakness of the method is the fact that the potential dependence between the
criteria is not taken into account. Indeed, it can be argued that the three criteria are interdependent:
for example, a stake can be considered as an opportunity because it is influential on stakeholders’
decisions and assessments. However, the AHP does not consider this dependence (Chung et al.,
2005). Further investigation would be needed to look at the reality of these dependencies. If it is
found that they have to be taken into account, a different multi-criteria decision-making method may
have to be used. For example, Saaty (1980) introduced a specific approach to deal with such
interdependencies, called analytic network process (ANP). It enables to incorporate dependencies
and feedback through a hierarchical decision network and represent these interactions (Figure 11).

40
Figure 11: ANP network with interdependencies between the criteria of the second level
It is also important to highlight the fact the first step related to the predefinition of the stakes is
fundamental. If a stake is not selected within this first list, it will never be considered as material.
Even if it is relevant to keep this list as short as possible, in order to decrease the number of
assessments required (see Table 19), it must still contain every potential CSR stake affected by, or
affecting, the company’s activity. The first interviews can be used to make sure that every relevant
stake has been included in the list, by asking directly stakeholders if there is no stake missing
according to them.
Besides, additional research would be necessary to further test the methodology. It would notably be
relevant to address the specific features of companies that influence the outcomes of a materiality.
For example, the influence of the size of the company, its sector or its geographical area would be
worth investigating in future research. Nowadays, more and more associations of companies try to
provide a reference list of material stakes to their members, in order to simplify the implementation
of a strategic CSR approach. Understanding the influence of the previously mentioned features could
enable to tailor such a list to each company, in particular for the companies lacking resources like
SMEs. It would also decrease the uncertainty of selecting the preliminary list of CSR issues, which is
currently more based on personal knowledge and intuition rather than strict codified instructions. It
is worth noting that this step could actually already include a consultation of stakeholders in the form
of an open discussion in order “to consider the information needs of all relevant stakeholders” as
stated by the NFRD guidelines (European Union, 2017).
Moreover, a company could want to gather assessments from hundreds, or even thousands of
stakeholders, so as to take a broad view. A quantitative online survey could then be used. In this
case, it is important to provide information as unequivocal as possible. In particular, the definitions of
the issues and the scales would have to be refined. It was common during interviews to be asked
about the distinction between two issues or two grades of a scale. Such information could not be
provided in the case of an online survey. It would be recommended to carry out some tests on some
volunteer stakeholders before sending the survey to all the stakeholders.
Besides, the application of the method revealed the importance of the selection of stakeholders. Not
everyone is able to assess all the different fields that CSR encompasses. Even though the CSR
managers of the company where the method was applied did not want to assess the salience of the
stakeholders, it would be relevant to do so, in particular depending on each CSR category of the list

41
of stakes. A salience assessment method easy to implement would need to be used in order to keep
the trade-off between accuracy and efforts.
The issue of creating specific rules of setting a threshold is still open as the threshold remains to be
decided by the company. Having rules normalizing this decision would enable more comparability
between companies and would simplify the choice of the material topics. During the application of
the method, a specific focus on the criteria of risk and influence on stakeholders’ assessments and
decisions, as recommended by the NFRD guidelines, led to setting a threshold which would appoint
topics as “material” through either the lens of two or three criteria. This decision is not backed by
any scientific research and further review of the literature is necessary, potentially from other fields.
Taking a step back, it is eventually important to highlight the fact that the methodology and the CSR
materiality analysis in itself only deal with individual perceptions. Even though the methodology
follows the NFRD guidelines, it remains a stakeholder dialogue practice. The assessments collected
for the risk and opportunity criteria may not reflect the reality. An in-depth inspection usually follows
a materiality analysis and the latter here serves as a resource allocation tool, by only inspecting the
stakes rated the highest. Once again, interviewing the right stakeholders, i.e. the ones who have the
knowledge of delivering an assessment reflecting reality, may reduce the need for an inspection.
More generally, further investigation into sustainability assessment may lead to ways of
improvement for the method or the broader framework and approach it belongs to.

42
7. Conclusion The aim of this report was to develop a quantitative approach to conduct a CSR materiality analysis in
response to a knowledge gap observed through a literature review. Therefore, the characteristics of
such approach were identified and, drawing from MCDM methods, a method combining AHP and
FMEA was developed. Assessment scales were created for the FMEA indices. The application of the
method to a food processing company enabled to underline its relevancy.
The use of scales was motivated by the avoidance of pairwise comparisons that can be found in other
approaches but which drastically increase the number of assessments required by a stakeholder. As
this number is kept low in this approach, it may enable any company, even SMEs, to easily
implement it despite their limitations. Nevertheless, the application of the method highlighted a few
suggestions of improvement. In order to decrease the uncertainty and ambiguity arising from
subjective judgements, further research would be necessary to increase the quantification of the
scales. Besides, the selection and weighing of stakeholders should also be investigated, so as to find a
salience assessment method compatible with the trade-off between accuracy and efforts. Likewise,
the setting of a threshold requires a broader literature review to potentially identify specific rules.
From a wider point of view, in the future, it would be useful to perform other applications of this
method in order to refine its methodology. In particular, the application to different companies of
different fields and different geographical areas would enable to assess the influence of these
factors.
Eventually, companies are increasingly under the public’s scrutiny and the creation of a methodology
participates in enhancing the codification of the materiality analysis, one of the key steps of
sustainability reporting. It improves the reliability of sustainability reports and their compatibility to
other reports, as well as mitigates the risk of ineffective CSR communication.

43
References AccountAbility, 2018. AA1000 Stakeholder Engagement Standard [WWW Document]. URL
https://www.accountability.org/standards/ Ahmed, M.D., Sundaram, D., 2012. Sustainability modelling and reporting: From roadmap to
implementation. Decis. Support Syst. 53, 611–624. https://doi.org/10.1016/j.dss.2012.02.004 Battisti, M., Perry, M., 2011. Walking the talk? Environmental responsibility from the perspective of
small-business owners. Corp. Soc. Responsib. Environ. Manag. 18, 172–185. https://doi.org/10.1002/csr.266
Baumann-Pauly, D., Wickert, C., Spence, L.J., Scherer, A.G., 2013. Organizing Corporate Social Responsibility in Small and Large Firms: Size Matters. J. Bus. Ethics 115, 693–705. https://doi.org/10.1007/s10551-013-1827-7
Bellantuono, N., Pontrandolfo, P., Scozzi, B., 2016. Capturing the Stakeholders’ View in Sustainability Reporting: A Novel Approach. Sustainability 8, 379. https://doi.org/10.3390/su8040379
Bluvband, Z., Grabov, P., 2009. Failure analysis of FMEA, in: 2009 Annual Reliability and Maintainability Symposium. Presented at the 2009 Annual Reliability and Maintainability Symposium, pp. 344–347. https://doi.org/10.1109/RAMS.2009.4914700
Bowles, J.B., 2003. An Assessment of RPN Prioritization in a Failure Modes Effects and Criticality Analysis. Presented at the Journal of the IEST, pp. 380–386. https://doi.org/10.1109/RAMS.2003.1182019
Brammer, S., Hoejmose, S., Marchant, K., 2012. Environmental Management in SMEs in the UK: Practices, Pressures and Perceived Benefits. Bus. Strategy Environ. 21, 423–434. https://doi.org/10.1002/bse.717
Cairns, G., Goodwin, P., Wright, G., 2016. A decision-analysis-based framework for analysing stakeholder behaviour in scenario planning. Eur. J. Oper. Res. 249, 1050–1062. https://doi.org/10.1016/j.ejor.2015.07.033
Calabrese, A., Costa, R., Ghiron, N.L., Menichini, T., 2017. Materiality Analysis in Sustainability Reporting: A Method for Making it Work in Practice. Eur. J. Sustain. Dev. 6, 439-447–447.
Calabrese, A., Costa, R., Levialdi, N., Menichini, T., 2016. A fuzzy analytic hierarchy process method to support materiality assessment in sustainability reporting. J. Clean. Prod. 121, 248–264. https://doi.org/10.1016/j.jclepro.2015.12.005
Carbone, T.A., Tippett, D.D., 2015. Project Risk Management Using the Project Risk FMEA. Eng. Manag. J. 16. https://doi.org/10.1080/10429247.2004.11415263
Chung, S.-H., Lee, A., Pearn, W.L., 2005. Analytic network process (ANP) approach for product mix planning in semiconductor fabricator. Int. J. Prod. Econ. 96, 15–36. https://doi.org/10.1016/j.ijpe.2004.02.006
Cinelli, M., Coles, S.R., Kirwan, K., 2014. Analysis of the potentials of multi criteria decision analysis methods to conduct sustainability assessment. Ecol. Indic. 46, 138–148. https://doi.org/10.1016/j.ecolind.2014.06.011
Clarkson, M.B.E., 1995. A Stakeholder Framework for Analyzing and Evaluating Corporate Social Performance. Acad. Manage. Rev. 20, 92–117. https://doi.org/10.2307/258888
Deloitte, 2018. Running your materiality process : A ‘how to’ guide [WWW Document]. URL http://www.cepi.org/system/files/public/documents/publications/sustainability/2018/CEPI_Sustainability%20Materiality_%20How%20to%20guide_23%2005%2018.pdf
Eccles, R.G., Krzus, M.P., Ribot, S., 2014. The Integrated Reporting Movement: Meaning, Momentum, Motives, and Materiality, 1 edition. ed. Wiley, Hoboken, New Jersey.
Engert, S., Rauter, R., Baumgartner, R.J., 2016. Exploring the integration of corporate sustainability into strategic management: a literature review. J. Clean. Prod. 112, 2833–2850. https://doi.org/10.1016/j.jclepro.2015.08.031
European Union, 2019. Consultation Document on The Update Of The Non-Binding Guidelines On Non-Financial Reporting.
European Union, 2017. Guidelines on non-financial reporting.
44
Fonseca, A., Louise McAllister, M., Fitzpatrick, P., 2014. Sustainability Reporting among Mining Corporations: A Constructive Critique of the GRI Approach. J. Clean. Prod. 84. https://doi.org/10.1016/j.jclepro.2012.11.050
Freeman, R.E., 2010. Strategic Management: A Stakeholder Approach. Cambridge University Press. Friedman, A.L., Miles, S., 2006. Stakeholders: Theory and Practice. Oxford University Press. GRI-Global Reporting Initiative, 2017. Linking the GRI Standards and the European Directive on non-
financial and diversity disclosure. GRI-Global Reporting Initiative, 2016. GRI 101:Foundation. Available at: www.globalreporting.org GRI-Global Reporting Initiative, 2016b. Defining Materiality: What Matters to Reporters and
Investors. Hajkowicz, S.A., McDonald, G.T., Smith, P.N., 2000. An evaluation of multiple objective decision
support weighting techniques in natural resource management. J. Environ. Plan. Manag. 43, 505–518.
Hess, D., 2007. Social Reporting and New Governance Regulation: The Prospects of Achieving Corporate Accountability Through Transparency. Bus. Ethics Q. 17, 453–476. https://doi.org/10.5840/beq200717348
Hsu, C.-W., Lee, W.-H., Chao, W.-C., 2013. Materiality analysis model in sustainability reporting: a case study at Lite-On Technology Corporation. J. Clean. Prod. 57, 142–151. https://doi.org/10.1016/j.jclepro.2013.05.040
Hubbard, D., Evans, D., 2010. Problems with scoring methods and ordinal scales in risk assessment. IBM J. Res. Dev. 54, 2:1-2:10. https://doi.org/10.1147/JRD.2010.2042914
IIRC, 2013. International <IR> Framework | Integrated Reporting [WWW Document]. URL http://integratedreporting.org/resource/international-ir-framework/ (accessed 6.23.19).
Ishizaka, A., Siraj, S., 2018. Are multi-criteria decision-making tools useful? An experimental comparative study of three methods. Eur. J. Oper. Res. 264, 462–471. https://doi.org/10.1016/j.ejor.2017.05.041
ISO, 2019. ISO 31010 Risk management — Risk assessment techniques. ISO, 2018. ISO 31000 Risk management. Jain, A., Islam, M.A., 2016. The rise of GRI: A social contagion epidemic, in: Proceedings of the Ninth
Asia-Pacific Conference on Global Business, Economics, Finance and Banking. Presented at the Proceedings of the Ninth Asia-Pacific Conference on Global Business, Economics, Finance and Banking, Best Western Grand Hotel, Hong Kong, p. Paper ID: HK619.
Jones, P., Comfort, D., Hillier, D., 2016. Materiality in corporate sustainability reporting within UK retailing. J. Public Aff. 16, 81–90. https://doi.org/10.1002/pa.1570
Khan, M., Serafeim, G., Yoon, A., 2016. Corporate Sustainability: First Evidence on Materiality (SSRN Scholarly Paper No. ID 2575912). Social Science Research Network, Rochester, NY.
Konidari, P., Mavrakis, D., 2006. Multi‐criteria evaluation of climate policy interactions. J. Multi‐Criteria Decis. Anal. 14, 35–53. https://doi.org/10.1002/mcda.399
Mardani, A., Jusoh, A., Nor, K., Khalifah, Z., Zakuan, N., Valipour, A., 2015a. Multiple Criteria Decision Making Techniques and Its Applications– A Review of the Literature from 2000 to 2014. Ekon. Istraživanja Econ. Res. 28. https://doi.org/10.1080/1331677X.2015.1075139
Mardani, A., Jusoh, A., Zavadskas, E.K., 2015b. Fuzzy multiple criteria decision-making techniques and applications – Two decades review from 1994 to 2014. Expert Syst. Appl. 42, 4126–4148. https://doi.org/10.1016/j.eswa.2015.01.003
Merad, M., Dechy, N., Serir, L., Grabisch, M., Marcel, F., 2013. Using a multi-criteria decision aid methodology to implement sustainable development principles within an organization. Eur. J. Oper. Res. 224, 603–613. https://doi.org/10.1016/j.ejor.2012.08.019
Messier, W.F., Martinov‐Bennie, N., Eilifsen, A., 2005. A Review and Integration of Empirical Research on Materiality: Two Decades Later. Audit. J. Pract. Theory 24, 153–187. https://doi.org/10.2308/aud.2005.24.2.153

45
Michelon, G., Boesso, G., Kumar, K., 2013. Examining the Link between Strategic Corporate Social Responsibility and Company Performance: An Analysis of the Best Corporate Citizens. Corp. Soc. Responsib. Environ. Manag. 20, 81–94. https://doi.org/10.1002/csr.1278
Mitchell, R.K., Agle, B.R., Wood, D.J., 1997. Toward a Theory of Stakeholder Identification and Salience: Defining the Principle of Who and What Really Counts. Acad. Manage. Rev. 22, 853–886. https://doi.org/10.2307/259247
Mohamed, A., Robinson, F.A., 2010. Risk Management in the Construction Industry Using Combined Fuzzy FMEA and Fuzzy AHP. J. Constr. Eng. Manag. 136, 1028–1036. https://doi.org/10.1061/(ASCE)CO.1943-7862.0000210
Murguía, D.I., Böhling, K., 2013. Sustainability reporting on large-scale mining conflicts: the case of Bajo de la Alumbrera, Argentina. J. Clean. Prod. 41, 202–209. https://doi.org/10.1016/j.jclepro.2012.10.012
OCDE/FAO, 2016. OECD-FAO Guidance for Responsible Agricultural Supply Chains. Porter, M.E., Kramer, M.R., 2007. Strategy and Society: The Link Between Competitive Advantage and
Corporate Social Responsibility. Harv. Bus. Rev. 84, 78–92, 163. Project Management Institute, 2013. A Guide to the Project Management Body of Knowledge:
PMBOK Guide, 5th ed. ed. Project Management Institute, Newtown Square, Pennsylvania. Roca, L.C., Searcy, C., 2012. An analysis of indicators disclosed in corporate sustainability reports. J.
Clean. Prod. 20, 103–118. https://doi.org/10.1016/j.jclepro.2011.08.002 Saaty, T.L., 2008. Decision making with the analytic hierarchy process. Int. J. Serv. Sci. 1, 83.
https://doi.org/10.1504/IJSSCI.2008.017590 Saaty, T.L., 1989. Group Decision Making and the AHP, in: Golden, B.L., Wasil, E.A., Harker, P.T. (Eds.),
The Analytic Hierarchy Process: Applications and Studies. Springer Berlin Heidelberg, Berlin, Heidelberg, pp. 59–67. https://doi.org/10.1007/978-3-642-50244-6_4
Saaty, T.L., 1980. The Analytic Hierarchy Process: Planning, Priority Setting, Resource Allocation. McGraw-Hill, New York ; London.
Saaty, T.L., Vargas, L.G., 2012. The Seven Pillars of the Analytic Hierarchy Process, in: Saaty, T.L., Vargas, L.G. (Eds.), Models, Methods, Concepts & Applications of the Analytic Hierarchy Process, International Series in Operations Research & Management Science. Springer US, Boston, MA, pp. 23–40. https://doi.org/10.1007/978-1-4614-3597-6_2
SASB, 2017. SASB Conceptual Framework [WWW Document]. URL https://www.sasb.org/wp-content/uploads/2019/05/SASB-Conceptual-Framework.pdf
Scherrer, Y., Daub, C.-H., Burger, P., 2007. Toward integrating sustainability into business strategy. Bus. Strategy Environ. 16, 459–460. https://doi.org/10.1002/bse.594
Siew, R.Y.J., 2015. A review of corporate sustainability reporting tools (SRTs). J. Environ. Manage. 164, 180–195. https://doi.org/10.1016/j.jenvman.2015.09.010
Skouloudis, A., Evangelinos, K., Kourmousis, F., 2009. Development of an Evaluation Methodology for Triple Bottom Line Reports Using International Standards on Reporting. Environ. Manage. 44, 298–311. https://doi.org/10.1007/s00267-009-9305-9
Solomon, J.D., Vallero, D., Benson, K., 2017. Evaluating risk: A revisit of the scales, measurement theory, and statistical analysis controversy, in: 2017 Annual Reliability and Maintainability Symposium (RAMS). Presented at the 2017 Annual Reliability and Maintainability Symposium (RAMS), pp. 1–6. https://doi.org/10.1109/RAM.2017.7889729
Stamatis, D.H., 1995. Failure Mode and Effect Analysis: FMEA from Theory to Execution. ASQC Quality Press.
US Supreme Court, 1976. TSC Industries, Inc. v. Northway, Inc., 426 U.S. 438 (1976) [WWW Document]. Justia Law. URL https://supreme.justia.com/cases/federal/us/426/438/ (accessed 6.23.19).
Vandaele, N., Decouttere, C., 2011. Sustainable R&D Portfolio Assessment. Decis. Support Syst. 54. https://doi.org/10.2139/ssrn.1974873
World Commission On Environment and Development, 1987. Our Common Future, 1 edition. ed. Oxford University Press, Oxford ; New York.
46
Yan, H.-B., Ma, T., 2015. A group decision-making approach to uncertain quality function deployment based on fuzzy preference relation and fuzzy majority. Eur. J. Oper. Res. 241, 815–829. https://doi.org/10.1016/j.ejor.2014.09.017
Zhou, Y., 2012. Materiality approach in sustainability reporting: applications, dilemmas, and challenges. Proc. 1st World Sustain. Forum.

47
Appendix Appendix 1: List of GRI topics GRI Topic GRI disclosures
201: Economic Performance 201-1 Direct economic value generated and distributed 201-2 Financial implications and other risks and opportunities due to climate change 201-3 Defined benefit plan obligations and other retirement plans 201-4 Financial assistance received from government
202: Market Presence 202-1 Ratios of standard entry level wage by gender compared to local minimum wage 202-2 Proportion of senior management hired from the local community
203: Indirect Economic Impacts 203-1 Infrastructure investments and services supported 203-2 Significant indirect economic impacts
204: Procurement Practices 204-1 Proportion of spending on local suppliers
205: Anti-corruption 205-1 Operations assessed for risks related to corruption 205-2 Communication and training about anti-corruption policies and procedures 205-3 Confirmed incidents of corruption and actions taken
206: Anti-competitive Behavior 206-1 Legal actions for anti-competitive behavior, anti-trust, and monopoly practices
301: Materials 301-1 Materials used by weight or volume 301-2 Recycled input materials used 301-3 Reclaimed products and their packaging materials
302: Energy 302-1 Energy consumption within the organization 302-2 Energy consumption outside of the organization 302-3 Energy intensity 302-4 Reduction of energy consumption 302-5 Reductions in energy requirements of products and services
303: Water and Effluents 303-1 Interactions with water as a shared resource 303-2 Management of water discharge-related impacts 303-3 Water withdrawal 303-4 Water discharge 303-5 Water consumption
304: Biodiversity 304-1 Operational sites owned, leased, managed in, or adjacent to, protected areas and areas of high biodiversity value outside protected areas 304-2 Significant impacts of activities, products, and services on biodiversity 304-3 Habitats protected or restored 304-4 IUCN Red List species and national conservation list species with habitats in areas affected by operations
305: Emissions 305-1 Direct (Scope 1) GHG emissions 305-2 Energy indirect (Scope 2) GHG emissions 305-3 Other indirect (Scope 3) GHG emissions 305-4 GHG emissions intensity 305-5 Reduction of GHG emissions 305-6 Emissions of ozone-depleting substances (ODS) 305-7 Nitrogen oxides (NOX), sulfur oxides (SOX), and other significant air emissions
306: Effluents and Waste 306-1 Water discharge by quality and destination 306-2 Waste by type and disposal method 306-3 Significant spills 306-4 Transport of hazardous waste
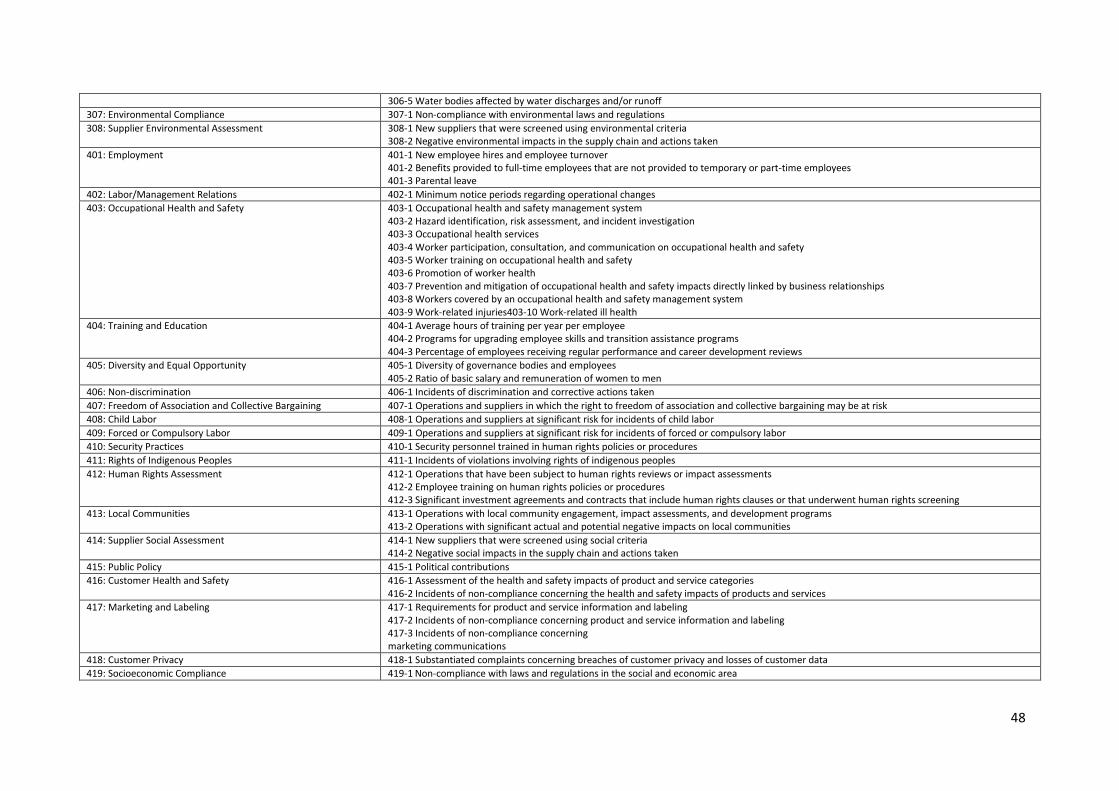
48
306-5 Water bodies affected by water discharges and/or runoff
307: Environmental Compliance 307-1 Non-compliance with environmental laws and regulations
308: Supplier Environmental Assessment 308-1 New suppliers that were screened using environmental criteria 308-2 Negative environmental impacts in the supply chain and actions taken
401: Employment 401-1 New employee hires and employee turnover 401-2 Benefits provided to full-time employees that are not provided to temporary or part-time employees 401-3 Parental leave
402: Labor/Management Relations 402-1 Minimum notice periods regarding operational changes
403: Occupational Health and Safety 403-1 Occupational health and safety management system 403-2 Hazard identification, risk assessment, and incident investigation 403-3 Occupational health services 403-4 Worker participation, consultation, and communication on occupational health and safety 403-5 Worker training on occupational health and safety 403-6 Promotion of worker health 403-7 Prevention and mitigation of occupational health and safety impacts directly linked by business relationships 403-8 Workers covered by an occupational health and safety management system 403-9 Work-related injuries403-10 Work-related ill health
404: Training and Education 404-1 Average hours of training per year per employee 404-2 Programs for upgrading employee skills and transition assistance programs 404-3 Percentage of employees receiving regular performance and career development reviews
405: Diversity and Equal Opportunity 405-1 Diversity of governance bodies and employees 405-2 Ratio of basic salary and remuneration of women to men
406: Non-discrimination 406-1 Incidents of discrimination and corrective actions taken
407: Freedom of Association and Collective Bargaining 407-1 Operations and suppliers in which the right to freedom of association and collective bargaining may be at risk
408: Child Labor 408-1 Operations and suppliers at significant risk for incidents of child labor
409: Forced or Compulsory Labor 409-1 Operations and suppliers at significant risk for incidents of forced or compulsory labor
410: Security Practices 410-1 Security personnel trained in human rights policies or procedures
411: Rights of Indigenous Peoples 411-1 Incidents of violations involving rights of indigenous peoples
412: Human Rights Assessment 412-1 Operations that have been subject to human rights reviews or impact assessments 412-2 Employee training on human rights policies or procedures 412-3 Significant investment agreements and contracts that include human rights clauses or that underwent human rights screening
413: Local Communities 413-1 Operations with local community engagement, impact assessments, and development programs 413-2 Operations with significant actual and potential negative impacts on local communities
414: Supplier Social Assessment 414-1 New suppliers that were screened using social criteria 414-2 Negative social impacts in the supply chain and actions taken
415: Public Policy 415-1 Political contributions
416: Customer Health and Safety 416-1 Assessment of the health and safety impacts of product and service categories 416-2 Incidents of non-compliance concerning the health and safety impacts of products and services
417: Marketing and Labeling 417-1 Requirements for product and service information and labeling 417-2 Incidents of non-compliance concerning product and service information and labeling 417-3 Incidents of non-compliance concerning marketing communications
418: Customer Privacy 418-1 Substantiated complaints concerning breaches of customer privacy and losses of customer data
419: Socioeconomic Compliance 419-1 Non-compliance with laws and regulations in the social and economic area

49
Appendix 2: Examples of questions asked during the interviews, for each criteria
Risk/opportunity occurrence: How probable/likely do you think this risk/opportunity is?
Risk/opportunity severity: How severe/important would be the consequences of this
risk/opportunity if it did happen?
Risk/opportunity control: How well-controlled do you think the causes and the consequences of this
risk/opportunity are?
Influence on stakeholders’ assessments and decisions: How influential do you think is this stake on
stakeholders’ assessments and decisions? Appendix 3: AHP matrix for CSR manager 1
Risk Opportunity Influence on stakeholder
Risk 1 7 5
Opportunity 1/7 1 1/3
Influence on stakeholder
1/5 3 1
𝐶𝑅1 = 6.77% < 10%
Appendix 4: AHP matrix for CSR manager 2
Risk Opportunity Influence on stakeholder
Risk 1 5 4
Opportunity 1/5 1 1/2
Influence on stakeholder
1/4 2 1
𝐶𝑅2 = 2.57% < 10%

50
Appendix 5: Quantitative results from interviews
Risk Opportunity Mean
Risk/Opp Influence
on SH
Severity Likelihood Risk
criterion Severity Likelihood
Opportunity criterion
1 Accountability / Transparency 3.1 2.7 2.9 3.7 3 3.35 3.125 3.04
2 Compliance 3.1 2.4 2.75 3.1 2.4 2.75 2.75 3.31
3 Water pollution / Waste waters 3.1 2.8 2.95 3.2 2.5 2.85 2.9 3.00
4 Waste management 1.3 2.2 1.75 2.7 2.2 2.45 2.1 2.63
5 Noise, air and soil pollution 2.4 3.1 2.75 2.3 3.5 2.9 2.825 2.84
6 Water consumption, water supply according to local constraints 2.75 3.1 2.925 2.8 2.6 2.7 2.813 2.92
7 Raw materials consumption, use efficiency/ Food waste / Circular economy 2.7 2.2 2.45 3.5 3.2 3.35 2.9 2.25
8 Energy consumption, energetic efficiency and renewable energy 3.3 3 3.15 2.8 2.5 2.65 2.9 2.56
9 Land use 2.1 2.8 2.45 2.5 3.3 2.9 2.675 2.83
10 Contribution to global warming (carbon footprint) 3.3 3.2 3.25 3.3 3.2 3.25 3.25 2.72
11 Climate change adaptation 3.3 3.1 3.2 3.2 2.9 3.05 3.125 2.17
12 Biodiversity development 2.1 1.8 1.95 2.3 2.7 2.5 2.225 2.38
13 Local footprint/ development of local communities 1.6 2.2 1.9 3.8 2.2 3 2.45 2.88
14 Co-Innovation and partnerships 2.3 1.9 2.1 3.5 2.6 3.05 2.575 2.67
15 Agricultural products supply (including suppliers, agricultural practices, partnerships, supply securization)
3.3 3 3.15 2.8 2.9 2.85 3 2.84
16 Food safety (including traceability) 3.3 2.6 2.95 3.1 2.4 2.75 2.85 3.17
17 Health and nutrition (products and health education impacts) 2.4 3.2 2.8 3.8 3.2 3.5 3.15 2.76
18 Food security 2.4 2.9 2.65 3.2 3.3 3.25 2.95 3.00
19 Innovation and adaptation to consumption patterns (clients and customers) 2.7 2.2 2.45 3.3 2.6 2.95 2.7 2.43
20 Corruption 3.7 2.4 3.05 2.5 2.3 2.4 2.725 3.71
21 Marketing and communication 1.8 2.7 2.25 3.2 3.4 3.3 2.775 2.80
22 Products labelling 1.33 2.2 1.765 2.5 1.8 2.15 1.958 3.00
23 Cyber security / Data protection 3.3 2.3 2.8 2.7 2.1 2.4 2.6 2.71
24 Diversity and discrimination 2.8 2.5 2.65 3.1 2.5 2.8 2.725 3.10
25 Living wages 2.3 2.9 2.6 2.9 3.3 3.1 2.85 3.11
26 Working conditions 3 2.6 2.8 3.3 2.5 2.9 2.85 2.75
27 Social dialog (information, consultation and negotiations with workers and trade unions)
2.8 1.7 2.25 2.8 2.5 2.65 2.45 2.71
28 Workers’ health and safety 3.8 3.3 3.55 3.7 3.25 3.475 3.513 3.29
29 Human capital development 1.8 2.3 2.05 2.7 1.9 2.3 2.175 2.75
30 Attractivity to talents 2.6 3.4 3 3.8 3.6 3.7 3.35 2.04
31 Forced or compulsory labour, child labour, migrants workers labour 3.5 2.8 3.15 2.8 3.4 3.1 3.125 3.60
32 Human rights 3.8 3.1 3.45 3.6 3.1 3.35 3.4 3.52
33 Land rights (access to resources and indigenous peoples’ rights) 2.8 2.3 2.55 3.4 2.7 3.05 2.8 3.50
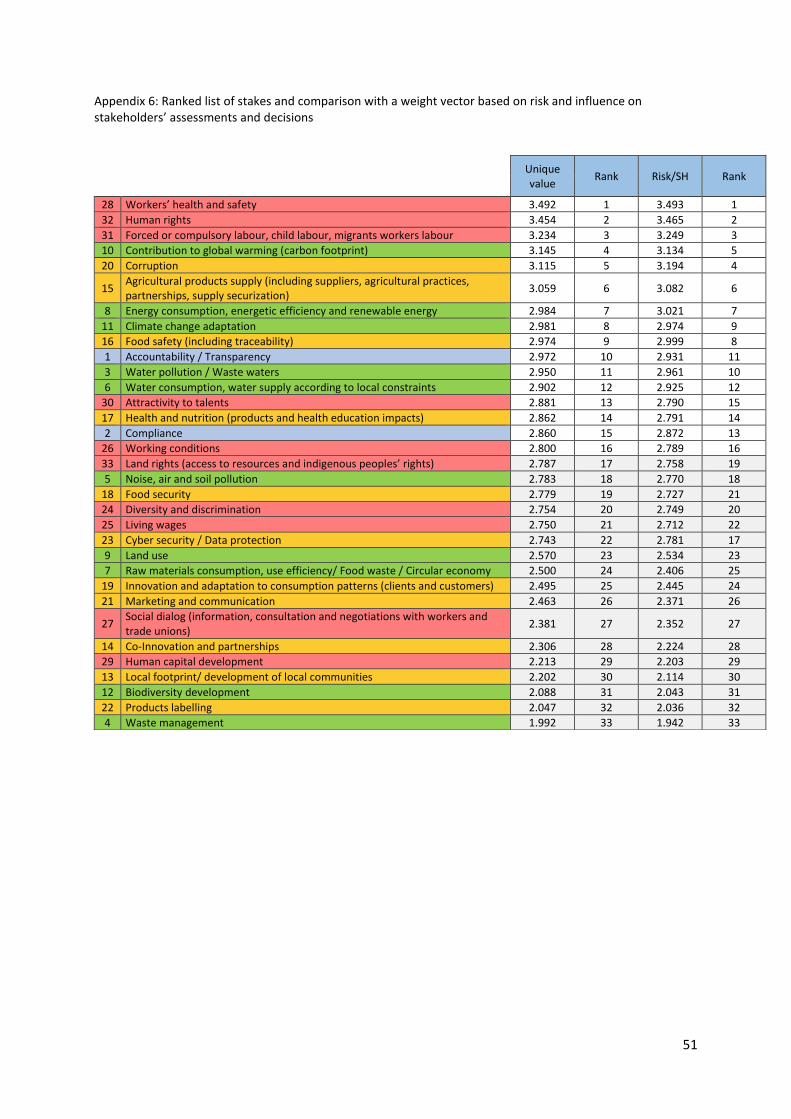
51
Appendix 6: Ranked list of stakes and comparison with a weight vector based on risk and influence on stakeholders’ assessments and decisions
Unique value
Rank Risk/SH Rank
28 Workers’ health and safety 3.492 1 3.493 1
32 Human rights 3.454 2 3.465 2
31 Forced or compulsory labour, child labour, migrants workers labour 3.234 3 3.249 3
10 Contribution to global warming (carbon footprint) 3.145 4 3.134 5
20 Corruption 3.115 5 3.194 4
15 Agricultural products supply (including suppliers, agricultural practices, partnerships, supply securization)
3.059 6 3.082 6
8 Energy consumption, energetic efficiency and renewable energy 2.984 7 3.021 7
11 Climate change adaptation 2.981 8 2.974 9
16 Food safety (including traceability) 2.974 9 2.999 8
1 Accountability / Transparency 2.972 10 2.931 11
3 Water pollution / Waste waters 2.950 11 2.961 10
6 Water consumption, water supply according to local constraints 2.902 12 2.925 12
30 Attractivity to talents 2.881 13 2.790 15
17 Health and nutrition (products and health education impacts) 2.862 14 2.791 14
2 Compliance 2.860 15 2.872 13
26 Working conditions 2.800 16 2.789 16
33 Land rights (access to resources and indigenous peoples’ rights) 2.787 17 2.758 19
5 Noise, air and soil pollution 2.783 18 2.770 18
18 Food security 2.779 19 2.727 21
24 Diversity and discrimination 2.754 20 2.749 20
25 Living wages 2.750 21 2.712 22
23 Cyber security / Data protection 2.743 22 2.781 17
9 Land use 2.570 23 2.534 23
7 Raw materials consumption, use efficiency/ Food waste / Circular economy 2.500 24 2.406 25
19 Innovation and adaptation to consumption patterns (clients and customers) 2.495 25 2.445 24
21 Marketing and communication 2.463 26 2.371 26
27 Social dialog (information, consultation and negotiations with workers and trade unions)
2.381 27 2.352 27
14 Co-Innovation and partnerships 2.306 28 2.224 28
29 Human capital development 2.213 29 2.203 29
13 Local footprint/ development of local communities 2.202 30 2.114 30
12 Biodiversity development 2.088 31 2.043 31
22 Products labelling 2.047 32 2.036 32
4 Waste management 1.992 33 1.942 33

52
Appendix 7: Unique value of stakes with different scenarios
Original
judgement - Unique
value
Rank Scenario 1 – Unique
value Rank Changes
Scenario 2 – Unique
value Rank Changes
Scenario 3 – Unique
value Rank Changes
1 Accountability / Transparency 2.972 10 3.097 4 6 3.236 5 5 3.066 8 2
2 Compliance 2.860 15 2.936 13 2 2.834 20 -5 3.140 6 9
3 Water pollution / Waste waters 2.950 11 2.933 14 -3 2.888 15 -4 2.970 12 -1
4 Waste management 1.992 33 2.275 32 1 2.371 31 2 2.468 29 4
5 Noise, air and soil pollution 2.783 18 2.830 18 0 2.869 16 2 2.836 17 1
6 Water consumption, water supply according to local constraints 2.902 12 2.849 17 -5 2.767 25 -13 2.890 13 -1
7 Raw materials consumption, use efficiency/ Food waste / Circular economy
2.500 24 2.683 24 0 3.050 10 14 2.445 31 -7
8 Energy consumption, energetic efficiency and renewable energy 2.984 7 2.787 21 -14 2.712 26 -19 2.662 24 -17
9 Land use 2.570 23 2.728 23 0 2.823 21 2 2.786 19 4
10 Contribution to global warming (carbon footprint) 3.145 4 3.073 5 -1 3.171 7 -3 2.879 15 -11
11 Climate change adaptation 2.981 8 2.806 20 -12 2.940 13 -5 2.454 30 -22
12 Biodiversity development 2.088 31 2.275 32 -1 2.399 30 1 2.330 33 -2
13 Local footprint/ development of local communities 2.202 30 2.592 28 2 2.816 23 7 2.748 21 9
14 Co-Innovation and partnerships 2.306 28 2.606 27 1 2.850 18 10 2.639 25 3
15 Agricultural products supply (including suppliers, agricultural practices, partnerships, supply securization)
3.059 6 2.947 11 -5 2.894 14 -8 2.888 14 -8
16 Food safety (including traceability) 2.974 9 2.958 10 -1 2.844 19 -10 3.077 7 2
17 Health and nutrition (products and health education impacts) 2.862 14 3.020 8 6 3.284 4 10 2.877 16 -2
18 Food security 2.779 19 2.967 9 10 3.123 8 11 2.985 11 8
19 Innovation and adaptation to consumption patterns (clients and customers)
2.495 25 2.610 26 -1 2.797 24 1 2.510 28 -3
20 Corruption 3.115 5 3.053 6 -1 2.694 27 -22 3.413 3 2
21 Marketing and communication 2.463 26 2.783 22 4 3.068 9 17 2.793 18 8
22 Products labelling 2.047 32 2.305 31 1 2.220 33 -1 2.687 22 10
23 Cyber security / Data protection 2.743 22 2.638 25 -3 2.507 29 -7 2.680 23 -1
24 Diversity and discrimination 2.754 20 2.850 16 4 2.823 21 -1 2.988 10 10
25 Living wages 2.750 21 2.937 12 9 3.027 12 9 3.033 9 12
26 Working conditions 2.800 16 2.817 19 -3 2.863 17 -1 2.780 20 -4
27 Social dialog (information, consultation and negotiations with workers and trade unions)
2.381 27 2.538 29 -2 2.600 28 -1 2.635 26 1
28 Workers’ health and safety 3.492 1 3.439 2 -1 3.459 1 0 3.358 4 -3
29 Human capital development 2.213 29 2.367 30 -1 2.330 32 -3 2.578 27 2
30 Attractivity to talents 2.881 13 2.914 15 -2 3.347 3 10 2.435 32 -19
31 Forced or compulsory labour, child labour, migrants workers labour 3.234 3 3.283 3 0 3.183 6 -3 3.458 2 1
32 Human rights 3.454 2 3.440 1 1 3.391 2 0 3.484 1 1
33 Land rights (access to resources and indigenous peoples’ rights) 2.787 17 3.033 7 10 3.043 11 6 3.290 5 12