a method of sampling a finished semisolid ... in vitro testing of semisolid dosage forms has become...
TRANSCRIPT

A METHOD OF SAMPLING A FINISHED SEMISOLID
DOSAGE FORM
by
CHANDRA DEMONA BROWN
(Under the direction of Dr. Anthony C. Capomacchia)
ABSTRACT
Several methods for removing samples from finished semisolid dosage forms are in current use. Sampling methods for semisolids vary among industry, but no standard method exists. These methods are tailored to specific formulations and manufacturers. This creates the possibility for differences in the determination of in vitro release specification, batch variability and stability profiles. The present study evaluates a standard method that will minimize variability in sampling, which will enhance the performance testing of semisolids.
INDEX WORDS: Hydrocortisone, Finished Semisolid, Sampling method, HPLC

A METHOD OF SAMPLING A FINISHED SEMISOLID DOSAGE FORM
by
CHANDRA DEMONA BROWN
B.S., Fort Valley State University, 1998
A Thesis Submitted to the Graduate Faculty of The University of Georgia in Partial
Fulfillment of the Requirements for the Degree
MASTER OF SCIENCE
ATHENS, GEORGIA
2002

© 2002
Chandra Demona Brown
All Rights Reserved

A METHOD OF SAMPLING A FINISHED SEMISOLID
DOSAGE FORM
by
CHANDRA DEMONA BROWN
Approved:
Major Professor: Dr. Anthony Capomacchia
Committee: Dr. Stuart Feldman Dr. Phillip Greenspan
Electronic Version Approved:
Gordhan L. Patel Dean of the Graduate School The University of Georgia August 2002

DEDICATION I humbly dedicate this manuscript to God from whom all blessings flow. I lovingly
dedicate this manuscript to the memory of my father, McArthur Brown. He truly gave
his life and unconditional love to the pursuit of academic excellence. This is also
dedicated to my mother, Darlene Brown, and my brother Nicholas Anthony Brown, for
their tireless and effortless acts of support, understanding, and encouragement. Your
shoulders may now rest! God’s richest blessings are yours is my continued prayer.
iv

ACKNOWLEDGEMENTS
I would like to thank my major professor, Dr. Tony Capomacchia, for his tremendous
support, patience, and encouragement. I would also like to thank Saundra Granade for
her advisement in the process of completing the research for this manuscript. Thank you
to my committee members, Dr. Phillip Greenspan, Dr. Stuart Feldman and Dr. James
Price for their service and assistance. I am forever indebted to Marcel Mincey, my
fiancé, for his tremendous support and encouragement throughout my graduate school
experience. Thank you for believing in my abilities and in me. Thanks to my friends, old
and new, for making the graduate school experience one that I will not soon forget.
v

TABLE OF CONTENTS
Page
ACKNOWLEDGEMENTS……………………………………………………………….v
INTRODUCTION…………………………………………….…………………..1
LITERATURE REVIW………………………………………………………….. 4
EXPERIMENTAL METHOD AND PROTOCOL……………………………….8
RESULTS AND DISCUSSION…………..……………………………………..20
SUMMARY AND CONCULSIONS……………………………………………31
APPENDIX………………………………………………………………………………32
REFERENCES…………………………………………………………………………..34
vi

INTRODUCTION
In vitro testing of semisolid dosage forms has become an important topic. It has
been suggested that there should be a standard in vitro testing method for semisolids as
there is for some solid dosage forms. In the manufacturing of semisolids, the in vitro
release test can show changes in formulation composition and/or manufacturing
processes. There are now guidelines which outline the necessary steps that
manufacturers should take when changes are made to the composition or processing of
semisolids known as Scale-Up and Post-Approval Changes in Semisolids (SUPAC-SS).
However, there is no specific accompanying method to test semisolids. One reason is
because in vitro testing is a part of the master batch record of a product that is
formulation and manufacturer dependent. This makes it difficult to make comparisons
between different formulations of the same active ingredient. Given this, there is not
much literature on the subject of standard in vitro testing. While there are many
parameters involved in testing semisolids, the present study focuses on removing the
finished semisolid product from its packaging. It is important that the tested sample is
representative of the finished product; whether it is homogeneous or not.
The Food and Drug Administration is the governmental agency that is responsible
for regulating all aspects of a pharmaceutical dosage form. These regulations can be
found mostly in the Federal Food Drug and Cosmetic Act (FFDC Act). It is thought that
complete compliance will equal better products and less recalls. In recent years, there has
been an emergence of the idea of total quality control in the pharmaceutical industry.

2
This can be attributed to costly drug recalls. The FFDC Act contains Current Good
Manufacturing Practices (cGMPs) for Finished Pharmaceuticals. These procedures
describe the minimum requirements under which pharmaceutical products should be
manufactured. Employees are required to attend workshops, seminars and training
sessions highlighting these guidelines. Therefore, those who are trained and/or exposed
to cGMPs and other FDA requirements are valuable assets to the pharmaceutical
industry.
Good Manufacturing Practices makes students knowledgeable of guidelines and
mannerisms in an industrial setting. It is an effective tool for ensuring accurate and
meaningful results. Documentation, validation and calibration are the most important
practices in a graduate research laboratory. Other practices should be incorporated based
on the nature and specification of the product being tested. In the current project, a non-
destructive method was developed for sampling a finished semisolid dosage with a white
petrolatum base using current Good Manufacturing Practices in a graduate research
laboratory setting.
The objective of this study is to compare three sampling methods using cGMPs.
Two of these methods are currently used in industry. One method involves splitting the
tube open with a knife or razor and removing the sample with a spatula. The second
method is to remove the contents in three equal amounts using applied pressure. Samples
are taken from the removed portions. The third method is an in-house, non-destructive
method. This method utilizes a plastic syringe and Teflon tubing to aspirate the ointment
out of its container. The amount of hydrocortisone removed from each sample will be
compared and analyzed.
3
An additional study is outlined in the appendix. The goal of the research was to
evaluate the intestinal transport and uptake of specific drugs and nutrients in the presence
of intestinal infection. Caco-2 cells were used as the in vitro model. It has been widely
used for intestinal transport studies. Studies also show that the intestinal infection
giardiasis adheres to Caco-2 cells. Zidovudine was chosen as a drug to be evaluated due
to its use for Acquired Immune Deficiency Syndrome.

4
LITERATURE REVIEW
In vitro testing of semisolid formulations has been a topic of discussion in recent
years. It has become an issue due to the content uniformity, dosage specifications and
batch-to-batch uniformity of the formulation. It is important to the researcher to be able
to attest to the formulation’s homogeneity, identification, purity and uniformity. This is
especially important in finished dosage forms. It is the last opportunity to correct
problems and misconceptions before the consumer is presented with the final product.
Final blend uniformity is a key concern for tablets and capsules. (4) The literature
describes a technique that involves sampling from the bin/hopper along with final product
testing. This is known as a Validation Sampling Plan (VSP). It has a statistical basis and
includes a sampling scheme. The VSP was compared with the USP method for blend
uniformity. The USP method for testing Solid Oral Dosage Forms (SODFs) tests the
content uniformity by randomly selecting samples at unit dose levels. If these samples
come from a well-blended mixture, then the test may be used as final acceptability
criteria for uniformity. It was found that the probability of acceptances for VSP is higher
than the USP method. Some have suggested that in vitro testing of semisolids should be
similar to that of solid oral dosage forms. (5-8)
The use of in vitro tests for semisolids serves most of the same purposes as in
solid oral dosage forms. One of its purposes is to reveal information about the release
characteristics of a product. Shah et al. (7) describes an automated method utilizing a
diffusion cell system and HPLC analysis that successfully detected differences in

5
manufacturing and concentration of hydrocortisone formulations. A similar study was
done using triamcinolone acetonide (11). Both studies indicate the ability of this
procedure to be used for quality assurance purposes. In a study that further attests to the
reproducibility and ruggedness of the in vitro release testing, Shah et al. was able to
predict differences in release rates due to particle size of betamethasone valerate. (8)
Using simulated data, Zatz (9) points out the importance of determining the correct
membrane and receptor medium. The diffusion cell system becomes less sensitive when
resistance to drug transport is increased. Release testing of semisolids involves using a
diffusion cell and some type of synthetic membrane. A unit dose of the preparation is
placed on the cell and covered by the membrane that has been saturated with the
appropriate receptor medium. The receptor chamber is filled with medium. Samples are
removed from chambers at appropriate time intervals.
In 1999, the Food and Drug Administration and the American Association of
Pharmaceutical Scientists (AAPS) published a report that described findings from their
co-sponsored workshop about how release testing might be implemented in light of the
then new FDA SUPAC guidance. (12) The group concluded “In vitro release is generally
formulation dependent and therefore should not be used to compare similar formulations
of different manufacturers. The meaningful use of the release test is for showing that the
fundamental properties of formulation of given content and manufacturing method have
essentially been maintained following a SUPAC-SS defined Level 2 change.” The group
also came to the consensus that “No universal release testing procedure nor universal test
conditions exist. Rather, the release test must be tailored to a formulation. Suitable test
conditions can usually be developed.”

6
In all of the literature reviewed, quality control has been a major concern. Quality
control tests such as identification, assay, homogeneity and/or viscosity, specific gravity
and particle size determination do not provide adequate information about release
properties or effects brought on by changes in processing or manufacturing. These
changes directly affect the performance of the finished dosage forms. (5) The
experiments done in the literature were mostly performed on finished semisolid dosage
forms. However, only two mentioned or gave consideration to the location or procedure
by which the samples were taken. Carbo et al. (5) outlines steps useful in developing and
validating in vitro release methods for semisolid drug products using Terazol 3. Terazol
3 is a vaginal cream that contains 0.8% terconazole. For testing lot-to-lot uniformity
samples were taken from the top, middle and bottom of 11 lots tested and n=3. For lot
variability, 1 lot was tested (n=3). Other quality assurance tests were performed to gather
more information about the formulation. A pH solubility profile was used to select a
receptor medium. A modified Franz Diffusion Cell was used for the release test and
analyzed with HPLC. The effect of occlusion was tested. Occlusion is the covering of
the diffusion cell with a moderately impermeable barrier. The method was validated by
determining drug concentration, formulation viscosity and drug particle size. Given this
outline, the researchers concluded that in vitro testing along with other quality assurance
tests could be used to determine quality and consistency in finished semisolid products.
The second report (6), Orr et al. explored dosage uniformity of commercially available
hydrocortisone ointment formulations. The article points out the need for appropriate
unit dosing. Unit dosing is assaying an amount of ointment that would normally be
exposed to the body at one time. A technique called mid-streaming was used to sample

7
ointment. In this procedure, the ointment is extruded from its tube in a long stream onto
a glass slab. The stream was measured. 5 mg samples were removed from the central
portion of the stream (n=50). These samples were used to determine drug content
uniformity. It was found that there was some variation in these samples when assayed.
This was concluded to be partially due to inadequate mixing and the formation of
agglomerates in the ointment. This is not unlikely when dealing with small doses of
active ingredient in bulk. Both of these problems can be addressed in quality control and
good manufacturing practices.
Hydrocortisone ointment was used as the test product due to its stability (8) and
commercial availability. Over a period of 2 years, the release profile of a commercially
available 2.5% hydrocortisone ointment formulation did not change (R). The HPLC
analysis of hydrocortisone with other active ingredients and alone has been well defined
in the literature (13-19) and by USP (20). Hydrocortisone is an anti-inflammatory
corticosteriod with many applications. It is widely used in this country. The formulation
used in this project was Cortizone-10 (Pfizer).
The current research proposes that more consideration to this part of semisolid
testing will lead to more representative quality control testing. Since batch records for
manufactured pharmaceuticals are not made public, the actual finished product testing
that would take place in a manufacturing facility was simulated. All equipment used was
validated and calibrated as needed. SOPs were in place and were followed as written.
Specific protocols were written for this project based on USP monographs and
regulations. The protocols were revised and approved as needed.

8
EXPERIMENTAL METHOD AND PROTOCOL
Materials
The materials used in this study were obtained by the named commercial supplies
and used without further purification. Standard Hydrocortisone RS from Sigma;
Standard Prednisone RS from Sigma Chemicals, Chloroform from Sigma; Methanol and
Acetonitrile from Fisher, Fair Lawn, NJ. All solvents were HPLC grade. Double-
distilled, de-ionized water was used throughout the studies. Cortizone-10 was purchased
over the counter.
Instrument
The Waters HPLC 2690 Chromatographic system, 996 Photodiode Array
Detector equipped with a C18 Bondapak column was used for analysis. The instrument
was qualified and calibrated prior to use.
Ointment Sampling
Three sampling methods were compared in this study. A protocol was written
and approved prior to studies. Protocol # 031102-1 was used to carry out the three
sampling methods. Data was recorded on corresponding data sheets.
Analysis of Hydrocortisone Ointment
High-Performance Liquid Chromatography was used to evaluate each sampling
method. Protocols were written and approved prior to analysis. Protocols # 031102-2
and 031102-21 were used. Data was recorded on corresponding data sheets.

9
Viscosity
Semisolid viscosity was determined to add scope to the present study. A protocol
was written and approved prior to determination. Protocol # 031102-3 was used. Data
was recorded on corresponding data sheets.
Protocols
Below are the protocols used for the experiments carried out in these studies.
Protocol # 031102-0
A Method for Sampling Finished Semisolid Dosage Forms Objective: To perform testing on various lots of hydrocortisone ointment, utilizing a new sampling technique for product in tube Scope: Three lots of 1% Hydrocortisone Ointment consisting of 3 units per lot of product Materials: 5cc Syringe 3/16 inch hypodermic tubing Spatula Razor blade Procedure:
1.0. Each lot Hydrocortisone will be sampled per Protocol # 031102-1, “Standard Sampling Protocol for Ointments”
2.0. Each lot of Hydrocortisone will be tested per Protocol # 031102-2, “Hydrocortisone Ointment Analysis by HPLC” for analysis of hydrocortisone
3.0. Each lot of Hydrocortisone will be tested per Protocol #031102-3, “Measuring Viscosity” for viscosity range
Data:
1.0. Data will be collected on attached forms. 2.0. Data will be evaluated and summarized in final report.

10
Protocol # 031102-01 Revised: June 17, 2002
A Method for Sampling Finished Semisolid Dosage Forms Objective: To perform testing on one lot of hydrocortisone ointment, utilizing a new sampling technique for product in tube Scope: Three units of one lot of 1% Hydrocortisone Ointment Materials: 3 units of commercially purchased Cortizone-10 having the same lot number Protocol# 031102-1, Protocol# 031102-2/031102-21, Protocol# 031102-3 Procedure:
1.0. The lot of Hydrocortisone will be sampled per Protocol # 031102-1, “Standard Sampling Protocol for Ointments”
2.0.The lot of Hydrocortisone will be tested per Protocol # 031102-2 and Protocol # 031102-21 “Hydrocortisone Ointment Analysis by HPLC” fo r analysis of hydrocortisone
3.0.The lot of Hydrocortisone will be tested per Protocol #031102-3, “Measuring Viscosity” for viscosity range
Data:
1.0.Data wil be collected on attached forms. 2.0.Data will be evaluated and summarized in final report.

11
Protocol# 031102-1
Standard Sampling Protocol for Ointments
Objective: Evaluate various sampling methods for semisolid drug products contained in ointment tubes. Scope: Viscosity
The sampling method will cover semisolid drug products formulated with white petrolatum that are packaged in ointment tubes.
Materials: 5cc plastic syringe, 3/16” I.D. hypodermic tubing, metal spatula, razor blade Analysis: Protocol # 031102-2/031102-21 to analyze drug content of each sample obtained from ointment tube. Procedure: 1.0. Semisolid sample removal from ointment tube using applied pressure
1.1.Remove three equal portions from the ointment tube by applying pressure to the end of the tube. 1.2.Weigh out specified test quantity on tared weighing vessel after separation. 1.3.Prepare the three samples for analysis by appropriate test method. 1.4.Analyze the three samples.
2.0. Semisolid sample removal from ointment tube by splitting tube
2.1 Lay tube flat on an even surface. 2.2 Make a cut in the center of the tube using a razor blade. The cut should extend
the length of the tube. 2.3 At the top of the tube, make another cut by holding the razor to the right of the
first opening. This angle should go from the tip of the first cut to the edge of the tube. Repeat on the other side. This should form a flap that may be peeled to the side revealing ½ tube contents.
2.4 Repeat above steps for the bottom of the tube. 2.5 Remove test quantities using a small spatula from the top, middle and bottom of
the tube. 2.6 Weigh on tared weighing vessel. 2.7 Prepare samples for analysis by appropriate test method. 2.8 Analyze the three samples
3.0. Semisolid sample removal from ointment tube using a non-destructive sample removal process
3.1 Using the sampling device, collect the sample by removing the tube orifice with a razor blade.
Note: If the tube orifice is large enough to insert sampling device, the orifice may not need to be removed.
3.2 Insert sampling device into tube until the top of the tube contents is reached.

12
3.3 Aspirate test quantity. 3.4 Weigh on tared weighing vessel. 3.5 Repeat steps 2-4 for collection of samples from the middle and bottom of the
tube. 3.6 Prepare samples for analysis by appropriate test method. 3.7 Analyze the three samples.

13
Protocol # 031102-2
Hydrocortisone Ointment Analysis by HPLC
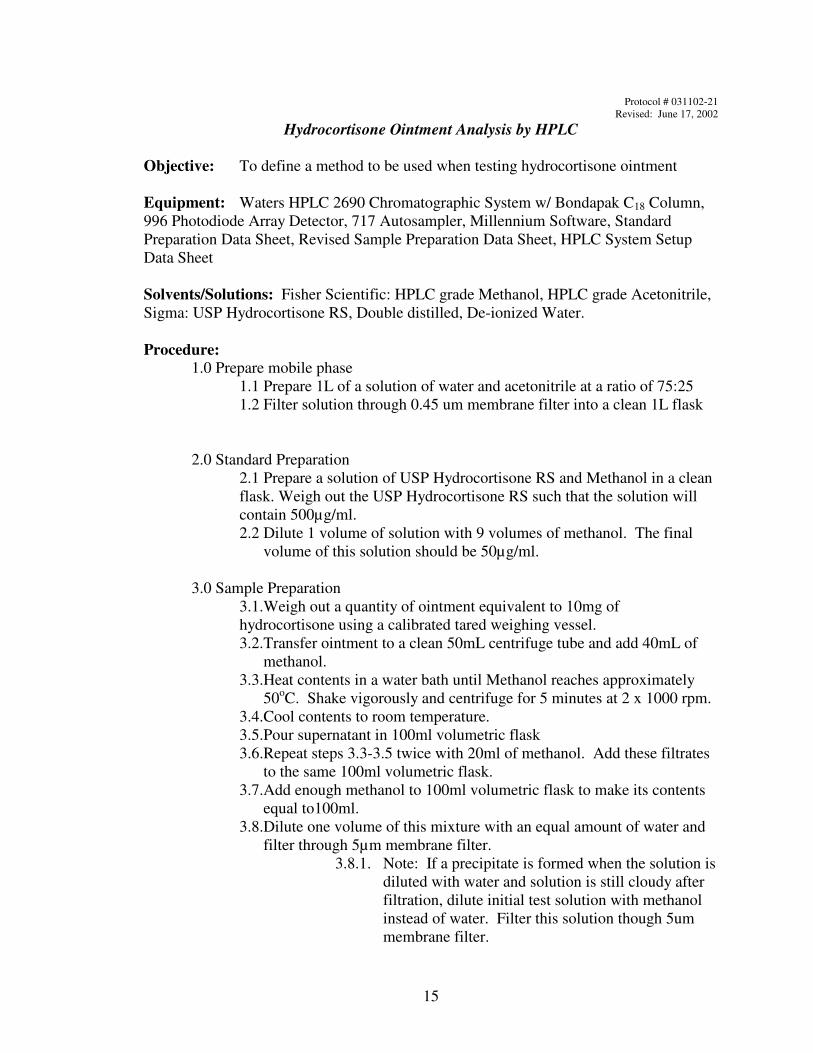
Objective: To define a method to be used when testing hydrocortisone ointment Equipment: Waters HPLC 2690 Chromatographic System w/ Bondapak C18 Column, 996 Photodiode Array Detector, 717 Autosampler, Millennium Software, Standard Preparation Data Sheet, Revised Sample Preparation Data Sheet, HPLC System Setup Data Sheet Solvents/Solutions: Fisher Scientific: HPLC grade Methanol, HPLC grade Acetonitrile, Sigma: USP Hydrocortisone RS, Double distilled, de-ionized Water. Procedure:
1.0 Prepare mobile phase. 1.1 Prepare 1L of a solution of water and acetonitrile at a ratio of 75:25 1.2 Filter solution with vacuum into a clean 1L flask
2.0 Standard Preparation.
2.1 Prepare a solution of USP Hydrocortisone RS and Methanol in a clean flask. Weigh out the USP Hydrocortisone RS such that the solution will contain 500µg/ml.
2.2 Dilute 1 volume of solution with 9 volumes of methanol. The final volume of this solution should be 50µg/ml.
3.0 Sample Preparation
3.1 Weigh out a quantity of ointment equivalent to 10mg of hydrocortisone using a calibrated, tared weighing vessel.
3.2 Transfer ointment to a clean 150mL beaker and add 40mL of methanol.
3.3 Heat contents on a steam bath while stirring. Stir until the ointment is melted and evenly dispersed.
3.4 Cool contents to room temperature. 3.5 Filter mixture through glass wool into 100ml volumetric flask 3.6 Repeat steps 3.3-3.5 twice with 20ml of methanol. Add these filtrates
to the same 100ml volumetric flask. 3.7 Add enough methanol to 100ml volumetric flask to make its contents
equal to100ml. 3.8 Dilute one volume of this mixture with an equal amount of water and
filter through 5µm membrane filter. 3.8.1 Note: If a precipitate is formed when the solution is diluted
with water and solution is still cloudy after filtration, dilute initial test solution with methanol instead of water. Filter this solution though 5um membrane filter.
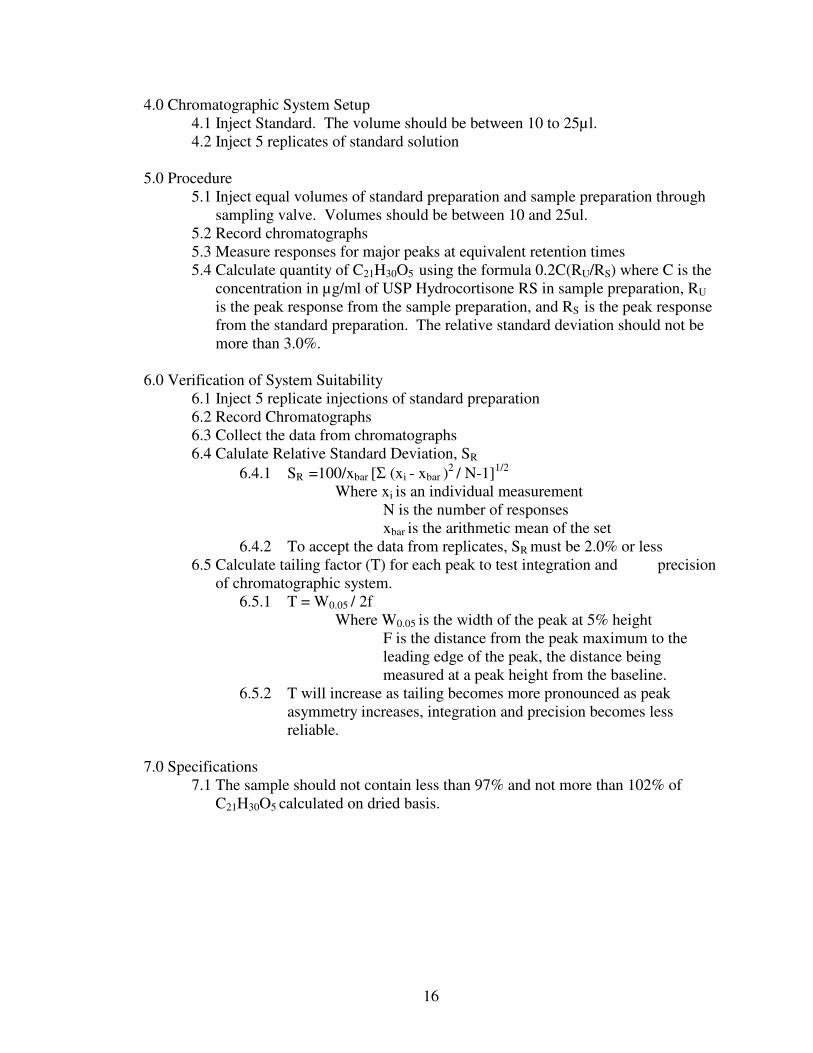
4.0 Chromatographic System Setup
4.1 Inject Standard. The volume should be between 10 to 25µl.

14
4.2 Inject 5 replicates of standard solution
5.0 Procedure 5.1 Inject equal volumes of standard preparation and sample preparation
through sampling valve. Volumes should be between 10 and 25ul. 5.2 Record chromatographs 5.3 Measure responses for major peaks at equivalent retention times 5.4 Calculate quantity of C21H30O5 using the formula 0.2C(RU/RS) where
C is the concentration in µg/ml of USP Hydrocortisone RS in sample preparation, RU is the peak response from the sample preparation, and RS is the peak response from the standard preparation. The relative standard deviation should not be more than 3.0%.
6.0 Verification of System Suitability
6.1 Inject 5 replicate injections of standard preparation 6.2 Record Chromatographs 6.3 Collect the data from chromatographs 6.4 Calulate Relative Standard Deviation, SR
6.4.1 SR =100/xbar [Σ (xi - xbar )2 / N-1]1/2 Where xi is an individual measurement N is the number of responses xbar is the arithmetic mean of the set
6.4.2 To accept the data from replicates, SR must be 2.0% or less 6.5 Calculate tailing factor (T) for each peak to test integration and
precision of chromatographic system. 6.5.1 T = W0.05 / 2f
Where W0.05 is the width of the peak at 5% height F is the distance from the peak maximum to the leading edge of the peak, the distance being measured at a peak height from the baseline.
6.5.2 T will increase as tailing becomes more pronounced as peak asymmetry increases, integration and precision becomes less reliable.
7.0 Specifications
7.1 The sample should not contain less than 97% and not more than 102% of C21H30O5 calculated on dried basis.
15
Protocol # 031102-21 Revised: June 17, 2002
Hydrocortisone Ointment Analysis by HPLC
Objective: To define a method to be used when testing hydrocortisone ointment Equipment: Waters HPLC 2690 Chromatographic System w/ Bondapak C18 Column, 996 Photodiode Array Detector, 717 Autosampler, Millennium Software, Standard Preparation Data Sheet, Revised Sample Preparation Data Sheet, HPLC System Setup Data Sheet Solvents/Solutions: Fisher Scientific: HPLC grade Methanol, HPLC grade Acetonitrile, Sigma: USP Hydrocortisone RS, Double distilled, De-ionized Water. Procedure:
1.0 Prepare mobile phase 1.1 Prepare 1L of a solution of water and acetonitrile at a ratio of 75:25 1.2 Filter solution through 0.45 um membrane filter into a clean 1L flask
2.0 Standard Preparation 2.1 Prepare a solution of USP Hydrocortisone RS and Methanol in a clean flask. Weigh out the USP Hydrocortisone RS such that the solution will contain 500µg/ml. 2.2 Dilute 1 volume of solution with 9 volumes of methanol. The final
volume of this solution should be 50µg/ml.
3.0 Sample Preparation 3.1.Weigh out a quantity of ointment equivalent to 10mg of hydrocortisone using a calibrated tared weighing vessel. 3.2.Transfer ointment to a clean 50mL centrifuge tube and add 40mL of
methanol. 3.3.Heat contents in a water bath until Methanol reaches approximately
50oC. Shake vigorously and centrifuge for 5 minutes at 2 x 1000 rpm. 3.4.Cool contents to room temperature. 3.5.Pour supernatant in 100ml volumetric flask 3.6.Repeat steps 3.3-3.5 twice with 20ml of methanol. Add these filtrates
to the same 100ml volumetric flask. 3.7.Add enough methanol to 100ml volumetric flask to make its contents
equal to100ml. 3.8.Dilute one volume of this mixture with an equal amount of water and
filter through 5µm membrane filter. 3.8.1. Note: If a precipitate is formed when the solution is
diluted with water and solution is still cloudy after filtration, dilute initial test solution with methanol instead of water. Filter this solution though 5um membrane filter.
16
4.0 Chromatographic System Setup 4.1 Inject Standard. The volume should be between 10 to 25µl. 4.2 Inject 5 replicates of standard solution
5.0 Procedure
5.1 Inject equal volumes of standard preparation and sample preparation through sampling valve. Volumes should be between 10 and 25ul.
5.2 Record chromatographs 5.3 Measure responses for major peaks at equivalent retention times 5.4 Calculate quantity of C21H30O5 using the formula 0.2C(RU/RS) where C is the
concentration in µg/ml of USP Hydrocortisone RS in sample preparation, RU
is the peak response from the sample preparation, and RS is the peak response from the standard preparation. The relative standard deviation should not be more than 3.0%.
6.0 Verification of System Suitability
6.1 Inject 5 replicate injections of standard preparation 6.2 Record Chromatographs 6.3 Collect the data from chromatographs 6.4 Calulate Relative Standard Deviation, SR
6.4.1 SR =100/xbar [Σ (xi - xbar )2 / N-1]1/2 Where xi is an individual measurement N is the number of responses xbar is the arithmetic mean of the set
6.4.2 To accept the data from replicates, SR must be 2.0% or less 6.5 Calculate tailing factor (T) for each peak to test integration and precision
of chromatographic system. 6.5.1 T = W0.05 / 2f
Where W0.05 is the width of the peak at 5% height F is the distance from the peak maximum to the leading edge of the peak, the distance being measured at a peak height from the baseline.
6.5.2 T will increase as tailing becomes more pronounced as peak asymmetry increases, integration and precision becomes less reliable.
7.0 Specifications 7.1 The sample should not contain less than 97% and not more than 102% of
C21H30O5 calculated on dried basis.
17
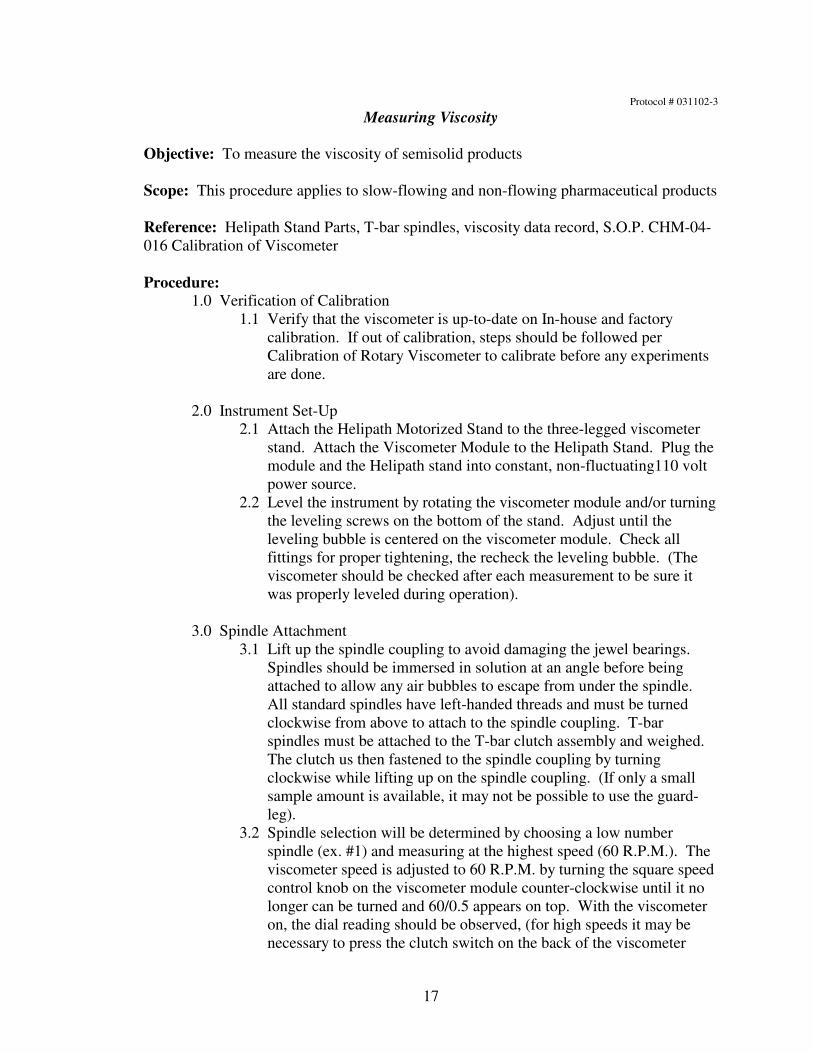
Protocol # 031102-3
Measuring Viscosity
Objective: To measure the viscosity of semisolid products Scope: This procedure applies to slow-flowing and non-flowing pharmaceutical products Reference: Helipath Stand Parts, T-bar spindles, viscosity data record, S.O.P. CHM-04-016 Calibration of Viscometer Procedure:
1.0 Verification of Calibration 1.1 Verify that the viscometer is up-to-date on In-house and factory
calibration. If out of calibration, steps should be followed per Calibration of Rotary Viscometer to calibrate before any experiments are done.
2.0 Instrument Set-Up
2.1 Attach the Helipath Motorized Stand to the three-legged viscometer stand. Attach the Viscometer Module to the Helipath Stand. Plug the module and the Helipath stand into constant, non-fluctuating110 volt power source.
2.2 Level the instrument by rotating the viscometer module and/or turning the leveling screws on the bottom of the stand. Adjust until the leveling bubble is centered on the viscometer module. Check all fittings for proper tightening, the recheck the leveling bubble. (The viscometer should be checked after each measurement to be sure it was properly leveled during operation).
3.0 Spindle Attachment
3.1 Lift up the spindle coupling to avoid damaging the jewel bearings. Spindles should be immersed in solution at an angle before being attached to allow any air bubbles to escape from under the spindle. All standard spindles have left-handed threads and must be turned clockwise from above to attach to the spindle coupling. T-bar spindles must be attached to the T-bar clutch assembly and weighed. The clutch us then fastened to the spindle coupling by turning clockwise while lifting up on the spindle coupling. (If only a small sample amount is available, it may not be possible to use the guard-leg).
3.2 Spindle selection will be determined by choosing a low number spindle (ex. #1) and measuring at the highest speed (60 R.P.M.). The viscometer speed is adjusted to 60 R.P.M. by turning the square speed control knob on the viscometer module counter-clockwise until it no longer can be turned and 60/0.5 appears on top. With the viscometer on, the dial reading should be observed, (for high speeds it may be necessary to press the clutch switch on the back of the viscometer

18
while simultaneously turning the viscometer off, in order to view the dial reading. If the reading is above 100 it will be necessary to repeat the above at a lower operating speed until a reading below 100 can be obtained. If this cannot be done with a spindle (ex. #2). (Remember that the accuracy of readings improves as the reading approaches 100).
4.0 Recording Data
4.1 The following information must be documented for all samples measuring in order to provide accurate and reproducible viscosity results. This information will be recorded on a copy fo the Viscosity Data Record.
(A) Product/Raw Material Identification (B) Item # (C) Control # (D) Date/Time (E) Spindle # (F) Speed/RPM (G) Guard Leg Used (yes/no) (H) U.S.P. method used
(I) Temp. of Sample (J) Distance between T-bar stops:_____cm
(K) Container type/size and sample volume (L)Dial Reading (Note: readings should be taken until at least three consecutive dial readings that are within 1.5 units, on the viscometer scale, of one another). After approx. 5 revs:___(0-100) After approx. 20 revs: ___ (0-100) After approx. 10 revs:__(0-100) After approx.25 revs: ___(0-100) After approx. 15 revs:___(0-100) After approx. 30 revs:___(0-100)
5.0 T-Bar Spindle Data Measuring 5.1 Before beginning measurement with T-bar spindles, it will be
necessary to measure the distance from the top to the bottom of the sample container. The upper and lower stops form the Helipath stand should be set at ¼ the total distance of the sample container from the top and bottom of the container. This will allow the T-bar to raise and lower through half sample in the container. The distance between the stops should be measured and recorded along with the other pertinent information. The motorized Helipath stand should be turned on at the same time as the viscometer, all readings should be recorded the same as for standard spindles.
6.0 Calculation of Viscosity
6.1 After several consistent readings have been recorded the data should be converted to centipoises by the equation below and the Factor obtained from the spindle factor finder (Attachment 3: for T-bar spindles). Unless otherwise specified in the U.S.P. for a specific product, data should be averaged for three readings where the

19
measurements seem most consistent. For materials displaying Non-Newtonian Behavior, it may be necessary to pick a specific time point, spindle # and speed at which to record data in the future. The viscosity may be figured form the calculation below. Record the result along with all other pertinent data.
(Factor) X (Viscometer Reading) = Sample Viscosity @ approx._______Revolutions Example : Standard Spindle # 4 Speed/R.P.M.: 3 Factor = 2000 (from standard spindles) (2000) X (94) = 188,000 cP Actual Viscosity The upper and lower range for a liquid with a known target viscosity should be
Calculated as follows, unless otherwise stated in the current U.S.P. for that specific excipient/active/or finished product.
(+/- (Factor + 1% of the Target Viscosity) + Actual Viscosity = Range in cP
7.0 Sample Cleaning/Storage 7.1 When all measurements are finished, the viscometer should be raised
and the guard-leg and the spindle carefully removed. Both should be cleaned with soap and water, every precaution should be taken not to drop or bend the pieces. Both should be rinsed with methanol after cleaning and then immediately dried with a clean cloth or KimWipe. Then return the spindle(s) to its storage case.
8.0 Results
8.1 Following these guidelines will ensure that all viscosity measurements are conducted in a systematic and scientific manner.

20
RESULTS AND DISCUSSION Standard Sampling Method for Ointments
A calibration curve (Figure 1) was generated by data from injections of the
standard solution. Two injections for each concentration (100, 500, and 1000 ug/ml)
were analyzed under the same HPLC conditions as the ointment to be tested.
It is cited that industrial practices include semisolid sample removal using applied
pressure and splitting the tube. The concern about these sampling techniques is that a
representative unit dose may not be removed. There is a possibility for disturbing the
contents, as they would be normally presented to the consumer. When the tube was split
open, it was found that the ointment does not fill the entire tube. Approximately 4 inches
from the bottom of the tube was empty. It is also rather difficult to remove the ointment
from the very top of the tube due to its shape. Using the applied pressure presents the
opportunity to “mix” the contents once they are removed. When performing this method,
the measurements of the tube taken during the splitting method were taken into
consideration. The non-destructive method allows the contents to stay in tact as sampling
is performed. The tubing selected fits snugly into the orifice of the tube. The syringe is
attached to the other end of the tubing to supply the amount of vacuum needed to remove
the ointment. When performing the non-destructive method, air in the tube presents a
problem when removing the bottom portion of the tube.
Table 1 summarizes the materials that were explored for use for a non-destructive
removal method. Modifications to (3) led to the apparatus used for this study. It was
determined that a plastic syringe and hypodermic tubing was a cost-efficient and

21
convenient method to remove ointment from its packaging without disturbing the
contents. The size of the tubing was adjusted based upon the size of the orifice of the
tube. For example, a 28g tube of 1% Hydrocortisone Ointment, 3/16 I.D. hypodermic
tubing attached to a 5cc syringe provided adequate vacuum.
Hydrocortisone Ointment Analysis by HPLC
In Table 2, Three different lots were used to explore lot-to-lot variability. The
three sampling methods were used to evaluate each lot, n=1. Although the non-
destructive method (ND) yielded the lowest relative standard deviation, all values were
unacceptably high. It was determined that the relative standard deviation (RSD) should
be less than 15%. After performing a z-test, Table 2-1 was generated. Lot # 2401381
was excluded and the RSD for ND was less than 15%. This made the test method
acceptable, but the other two methods still yielded high RSD. At this point, consideration
was given to adding an internal standard and improving the sample extraction method.
However, the USP Prednisone assay was not compatible with the current method. In
order to preserve the current method, improving the extraction method was explored.
Figure 2 shows a typical chromatograph containing hydrocortisone, which would have
been distorted with the introduction of an internal standard.
The sample preparation method was improved by ensuring the methanol for each
sample was heated to the same temperature and exposed to the steam bath for the same
amount of time. The methanol was allowed to reach a temperature of 50-55oC. Each
sample was stirred over a steam bath for approximately 2 minutes for the first extraction
and approximately 1-1.5 minutes for subsequent extractions. Sample preparation was

22
also performed using centrifuge tubes rather than beakers. The centrifuge tubes allowed
the mixture to be shaken vigorously to form an emulsion. In Table 3, extraction was
evaluated using the two different extraction methods. The method that utilizes
centrifuging the samples was thought to extract more hydrocortisone because of the
formation of the emulsion upon heating and shaking. However, test results reveal a 2- to
3- fold difference between the two methods. It should be noted that when plastic
centrifuge tubes were used, hydrocortisone was not recovered When using glass
centrifuge tubes, the hydrocortisone concentration was higher.
Lot # 2401502 was used to compare the test sampling methods within a lot, n=3.
Table 4 summarizes the analysis. The RSD for all parameters was below 15% and were
acceptable. For peak area, which is indicative of extraction, all test methods yielded a
rather wide range of values. ND yielded the lowest range and the lowest RSD but were
not statistically significant.
Viscosity
The scope of the project was based on viscosity values for white petrolatum alone.

23
Figure 1.Standard Curve
y = 462.72x + 586.02R2 = 0.9999
0
50000
100000
150000
200000
250000
300000
350000
400000
450000
500000
0 200 400 600 800 1000 1200
Amount
Are
a

24
Table 1. Possible Materials for Non-destructive Sampling Method
*Device used for non-destructive method I.D. was increased to attain higher volume and add more vacuum
Materials Methods Results Possible Problems
1 18 gauge needle + 3ml syringe
-Suction from orifice -w/ top removed
-Unable to aspirate -Negligible amount aspirated
Bore too small, more force needed
2 Beveled point needle+ 1cc syringe
-Suction from orifice -Puncturing tube
-Unable to aspirate
Bore too small
*3 3/8 I.D. hypodermic tubing w/ lure lock+5cc syringe
-Suction from orifice -w/ top removed
-Able to aspirate, however, limited volume attained
Air pockets in ointment, lack of vacuum
5 5cc syringe - Suction from orifice -w/ top removed
-Unable to aspirate --no volume
Too large to fit snugly into orifice, more force needed
6 50 ml Finntip® syringe
-Suction from orifice
-Negligible amount aspirated
Too large to fit snugly into orifice, air pockets

25
*SP- Tube Splitting method *AP-Applied pressure method *ND-Non-destructive method *SD-Standard Deviation *RSD-Relative Standard Deviation
Table 2. Lot-to-Lot Variability Study
Peak Area (mm2)
Lot # SP AP ND Mean SD
2401406 0.94 1.01 0.85 0.933333 0.080208
2402023 1.29 1.62 1.04 1.316667 0.290918
2401381 0.59 0.49 0.67 0.583333 0.090185
Variation Among Methods Peak Area (mm2)
Lot # SP AP ND
2401406 0.94 1.01 0.85
2401381 0.59 0.49 0.67
2402023 1.29 1.62 1.04
Mean 0.94 1.04 0.853333
SD 0.35 0.565597 0.185023
RSD (in%) 37.23 54.8 21.76

26
Table 2-1. Variability Among Methods Study
(Peak Area in mm2)
Lot # SP AP ND 2401406 0.94 1.01 0.85 2402023 1.29 1.62 1.04 2401381 0.59 0.49 0.67
Mean 1.115 1.315 0.945
SD 0.247487 0.431335 0.13435 RSD 21.52 32.70 13.76
*SP- Tube Splitting method *AP-Applied pressure method *ND-Non-destructive method *SD-Standard Deviation
*RSD-Relative Standard Deviation

27
Figure 2. Hydrocortisone Chromatograph

28
Table 3. Sampling Method Study
Lot # 2401502 SP AP ND Average Weight (g) Top 1.0013 1.0029 1.0016 Middle 1.0011 1.0014 1.0015 Bottom 1.0008 1.0004 1.0013 Mean 1.001067 1.001567 1.001467 Std. Dev. 0.000205 0.001027 0.000125 RSD (in%) 0.02 0.1 0.01 Peak Height (AU) Top 0.100702 0.107556 0.11045 Middle 0.112928 0.122356 0.11822 Bottom 0.124831 0.10669 0.107669 Mean 0.11282 0.112201 0.112113 Std. Dev. 0.009851 0.008805 0.005469 RSD (in%) 8.73 7.85 4.89 Peak Area (AU) Top 1.98 2.05 2.17 Middle 2.22 2.33 2.32 Bottom 2.45 2.04 2.06 Mean 2.216667 2.14 2.183333 Std. Dev. 0.191891 0.134412 0.106562 RSD (in%) 8.65 6.28 4.88 Concentration (mg/ml) Top 4.27 4.44 4.94 Middle 4.79 5.03 5.02 Bottom 5.29 4.41 4.45 Mean 4.783333 4.626667 4.803333 Std. Dev. 0.41644 0.285463 0.25197 RSD(in %) 8.706061 6.169941 5.245732

29
Figure3. RSD Comparison for Methods
0
1
2
3
4
5
6
7
8
9
10
Tube S
plittin
g
Applie
d Pres
sure
Non-D
estruc
tive
Methods
% R
elat
ive
Stan
dard
Dev
iatio
n
RSD (in%) weight
RSD (in%) (height)
RSD (in%)(Area)
RSD(in %) (concentration)

30
Table 4. Extraction Method Comparison
Method Extraction Peak Area (AU) Concentration (mg/mL) SP Centrfuge 854134 1.84 AP Centrifuge 773081 1.67 ND Centrifuge 568786 1.23 SP Beaker 2095597 4.53 AP Beaker 2142361 4.63 ND Beaker 2152218 4.65

31
SUMMARY AND CONCLUSIONS
The purpose of this study was to examine possible standard sampling techniques
for finished semisolid formulations. A standard sampling technique will improve in vitro
studies and help achieve total quality control. All three methods gave some variability.
This can be attributed to the extraction technique used in the USP method. It is vague
and left great room for error.
The non-destructive method is comparable to the currently used methods. It
yields a constant extraction rate. This sampling technique allows for accurate weight
measurements and a contaminant-free sampling environment. The possibility of external
contamination is absent because the tubing snugly fits into the orifice of the tube. There
is no mixing or cross contamination of samples due to the aspiration this method
provides. Because of the economical nature of the products involved, his technique can
be easily incorporated into various in vitro test procedures for finished semisolids.

APPENDIX
An in vitro model to predict intestinal absorption in the presence of intestinal infections
Intestinal infections caused by parasites are among the most common infections in the
world. It is estimated that as many as 3.5 billion people are infected with intestinal
parasite and that 450 million show symptoms, of which the majority are children.
Intestianl infections caused by parasites are prevalent in all parts of the worlds and are
regarded as a serious public health problem.
Giardia lamblia is the most common intestinal parasite. Giardiasis is the disease
caused by this one-celled parasite. Two forms of giardia exist: the cyst form and the
trophozoite form. Giardia cysts can cause infection if ingested. After ingestion
excytation may occur to form trophozoites, which cause disease. Giardiasis can easily be
transmitted through fecal contamination of food and/or water. It hs been recognized as
the most frequently occurring waterborne disease in the United States. Since there are
frequent outbreaks in nurseries and daycare centers, children are most likely to be
infected with the disease. Symptoms range from mild to severe cases of diarrhea to
intestinal malabsoprtion. Malabsorption can lead to other health problems if not properly
addressed. (27)
To explore the effect of giardia on the uptake and transport of some nutrients and
drugs, an in vitro model will be used to examine the influence of infection on intestinal
absorption.

Caco-2 cells are derived from human colonic adenocarcinoma. This cell line
exhibits morphological and functional similarities to intestinal epithelial cells. The cells
form tight junctions and express many brush border enzymes. Many active transport
systems that are normally found in small intestinal cells have been characterized in Caco-
2 cells. Because of this and its unusually high differentiation, Caco-2 cells have been
successfully used to examine intestinal transport mechanism and permeability
characteristics of drugs and other substances.(24, 26)
The trophozoite form of giardia lamblia has been used successfully in vitro to
study anti-giardial compounds and mechanisms of drug interaction. There is evidence
that supports the adherence and multiplication of giardia parasites to the Caco-2 cell line.
This model of infection will be tested in Caco-2 cell culture by examining the uptake and
transport of selected drugs and nutrients. (25, 28)
One of the drugs that will be evaluated is 3’azido-3’deoxythymidine, which is
commonly known as AZT. It is nucleoside analogue reverse transcriptase inhibitors. It is
sold as Retrovir ® by GlaxoSmithKlein and generically as Zidovudine. AZT was
approved for the treatment of AIDS in 1987. AIDS has become a widespread epidemic
that has affected the lives of millions of people in the United States.
AIDS patients can suffer from wasting syndrome. The symptoms are similar to
those seen in giardiasis. Therefore, this model will give some insight on how AZT is
transported during these symptoms. The model will also give insight on the transport of
nutrients and other common drugs taken by children who could be possibly exposed to
disease.

REFERENCES
1. S.H. Willig. Good Manufacturing Practices for Pharmaceuticals, A Plan for
Total Quality Control from Manufacturer to Consumer. Fifth Edition. Marcel
Dekker, Inc. 270 Madison Avenue, New York, New York 10016., 2001.J.
2. S.B. Roy, S. Watson. GMP Compliance, Productivity and Quality: Achieving
synergy in Healthcare Manufacturing. SUPAC and Regulatory
Consequences:The Balancing Act. Interpharm Press, Inc. 1358 Busch
Parkway, Buffalo Grove, IL 60089. 157-198 (1989).
3. A. Kwong, D.R. Timms, K. Chiu. GMP Compliance, Productivity and
Quality: Achieving synergy in Healthcare Manufacturing. Process and
Equipment Optimization: Getting the Combination Right. Interpharm Press,
Inc. 1358 Busch Parkway, Buffalo Grove, IL 60089. 73-111 (1989). J.M.
4. J.M. Geoffrey, D. LeBlond, R. Poska, D. Brinker, A. Hsu. Unit Dose
Sampling and Final Product Performance. Drug Dev. And Ind. Pharm.
27:731-743 (2001).
5. M. Carbo, T.W. Schultz, G.K. Wong, G. Van Buskirk. Development and
Validation of In Vitro Release Testing Methods for Semisolid Formulations.
Pharm. Tech. 112-128 (1993).
6. N.A. Orr, E.A. Hill, J.F. Smith. Dosage Uniformity in Hydrocortisone
Ointment B.P. J.Pharm. Pharmacol. 32:766-772 (1980).

7. V.P. Shah, J. Elkins, J. Hanus, C. Noorizadeh, J.P. Skelly. In Vitro Release of
Hydrocortisone from Topical Preparations and Automated Procedure. Pharm.
Res. 8:55-59 (1991).
8. V. Shah, J.S. Elkins, R.L. Williams. In Vitro Release Measurement for
Topical Glucocorticoid Creams. Pharmacopeial Forum. 19:5048-5054
(1993).
9. J.L. Zatz. Drug Release from Semisolids: Effect of Membrane Permeability
on Sensitivity to Product Parameters. Pharm. Res. 2:787-789 (1995).
10. V.P. Shah, J.S. Elkins, R.L. Williams. Evaluation of the Test System Used for
In Vitro Release of Drugs and Topical Dermatological Drug Products. Pharm.
Dev. Tech. 4:377-386 (1999).
11. P. Rege, V.D. Vilivalam, C.C. Collins. Development in Release Testing of
Topical Dosage Forms: Use of the Enhancer Cell TM with automated
sampling. J. Pharm. Biomed. Anal. 17:1225-1233 (1998).
12. G. Flynn, V. Shah, S.N. Tenjarla, M. Carbo, D. DeMagistris, T.G. Feldman,
T.J. Franz, D.R. Miran, D. M. Pearce, J.A. Sequeira, J. Swarbrick, J.C.T.
Wang, A. Yacobi, J.L. Zatz. Pharm. Res. 16:1325-1330 (1999).
13. Paesen, E. Roets, J. Hoogmartens. Study of the Stability of Erythromycin in a
Hydrophilic Crème Basis by Liquid Chromatography. J. Pharm. Biomed.
Anal. 17:53-56 (1998).
14. A. R. lea, J.M. Kennedy, G.K.-C. Low. Analysis of Hydrocortisone Acetate
Ointments and Creams by High-Performance Liquid Chromatography. J.
Chromatogr. 198:41-47 (1980).

15. A. Rego, B. Nelson. Simultaneous Determination of Hydrocortisone and
Benzyl Alcohol in Pharmaceutical Formulations by Reversed-Phase High-
Pressure Liquid Chromatography. J. Pharm. Sci. 71:1219-1223 (1982).
16. J.P. Swann. The 1941 Sulfathiazole Disaser and the Birth of Good
Manufacturing Practices. Pharm. Hist. 40:16-25 (1999).
17. M.J. Walters, W.E. Dunbar. High-Performance Liquid Chromatographic
Analysis of Hydrocortisone Drug Substance, Tablets, and Enema. J. Pharms
Sci. 71:446-451.
18. K.-W. Phoon, C. Stubley. Rapid Method for the Simultaneous Analysis of
Hydrocortisone and Clioquinol in Topical Preparations by Hihg-Performance
Liquid Chromatography. J. Chromatogr 246:297-303 (1982).
19. M.D. Smith. Kinetic Study of USP Blue Tetraolium Assay with
Methylpednisolone, Hydrocortisone and their Hemisuccinate Esters by high-
Pressure Liquid chromatography. J. Pharm Sci. 69:960-964 (1980).
20. F.W. Ezzedeen, S.J. Stohs, A.N. Masoud. High-Performance Liquid
Chromatographic Analysis of Iodochlorihydroxyquin and Hydrocortisone in
Ointments and Creams. J. Pharm. Sci. 72:1036-1039 (1983).
21. B.B. Barry. Dermatological Formulations:Percutaneous Absorption. Marcel
Dekker, Inc. 270 Madison Avenue, New York, New York 10016., 1983.
22. J.W. Munson. Pharmaceutical Analysis: Modern Methods Part B.High-
Performance Liquid Chromatography: Theory, Instrumentation and
Pharmaceutical Applications. Marcel Dekker, Inc. 270 Madison Avenue, new
York, New York 10016. , 15-154 (1984).

23. K.A. Yoon, D.J. Burgess. Effect of Nonionic Surfactant on Transport of
Model Drugs in Emulsions. Pharm. Res. 13:433-438 (1996).
24. Y. He, I.R. Sanderson, W.A. Walker. Uptake, Transport and Metabolism of
Exogenous Nucleosides in Intestinal Epithelial Cell Cultures. J. Nutr.
124:1942-1949 (1994).
25. P.H. Katelaris, A. Naeem, M.J.G. Farthing. Attachment of G. Lamblia
Trophozoites to a Cultured Human Intestinal Cell Line. Gut 37:512-518
(1995).
26. A.J. Shaw. Epithelial Cell Culture: A Practical Approach. IRL Press at Oxford
University Press, Oxford, New York, (1996).
27. R.C.A. Thompson, J.A. Reynolds, A.J. Lymberg. Giardia: From Molecule to
Disease. CAB International, 1994.
28. L. Favennec, C. Choncillion, D. Meillet, D. Magne, J. Savel, D. Raichvarg,
J.G. Gobert. Adherence and Multiplication of Giardia intestinalis on Human
Enterocyte-like Differentiated Cells In Vitro. Parasitol Res 76:581-584
(1990).