a methodology to benchmark flexible payload architectures
TRANSCRIPT
HAL Id: hal-02530973https://hal-univ-rennes1.archives-ouvertes.fr/hal-02530973
Submitted on 7 Apr 2020
HAL is a multi-disciplinary open accessarchive for the deposit and dissemination of sci-entific research documents, whether they are pub-lished or not. The documents may come fromteaching and research institutions in France orabroad, or from public or private research centers.
L’archive ouverte pluridisciplinaire HAL, estdestinée au dépôt et à la diffusion de documentsscientifiques de niveau recherche, publiés ou non,émanant des établissements d’enseignement et derecherche français ou étrangers, des laboratoirespublics ou privés.
Distributed under a Creative Commons Attribution| 4.0 International License
A methodology to benchmark flexible payloadarchitectures in a megaconstellation use case
Florian Vidal, Hervé Legay, George Goussetis, Maria Vigueras, SegoleneTubau, Jean-Didier Gayrard
To cite this version:Florian Vidal, Hervé Legay, George Goussetis, Maria Vigueras, Segolene Tubau, et al.. A methodologyto benchmark flexible payload architectures in a megaconstellation use case. International Journal ofSatellite Communications and Networking, Wiley, 2021, 39 (1), pp.29-46. �10.1002/sat.1344�. �hal-02530973�
Received: 18 September 2019 Revised: 20 December 2019 Accepted: 11 February 2020
DOI: 10.1002/sat.1344
S P E C I A L I S S U E P A P E R
A methodology to benchmark flexible payload architectures ina megaconstellation use case
Florian Vidal1 Hervé Legay1 George Goussetis2 Maria Garcia Vigueras3
Ségolène Tubau1 Jean-Didier Gayrard1
1Thales Alenia Space, BP 1187, 31037,
Toulouse Cedex 1, France2Institute of Sensors, Signals & Systems,
Heriot-Watt University, Edinburgh, United
Kingdom3IETR Laboratory, INSA Rennes, 20 Avenue
des Buttes de Coesmes, 35700 Rennes, France
Correspondence
Florian Vidal, Thales Alenia Space, BP 1187,
31037 Toulouse Cedex 1, France.
Email: [email protected]
Funding information
H2020 Marie Skłodowska-Curie Actions,
Grant/Award Number:
MSCA-ITN-2016-722840
Summary
This paper proposes a methodology to benchmark satellite payload architectures and find the
optimal trade-offs between high flexibility and low complexity. High flexibility would enable
the satellite to adapt to various distributions of user terminals on the ground and fulfill the
data rate demand of these users. Besides, low complexity is required to keep satellite networks
competitive in the context of emerging 5G networks. To estimate the flexibility of a payload, an
indicator to characterize the non-uniformity of user distributions is proposed. Each benchmarked
payload may be characterized by a graph relating the throughput to this parameter further
denoted 𝜇. The payload provides the same throughput trends for different scenarios of user
distributions with the same 𝜇 parameter. As a consequence, the average capacity of the system
may be estimated by (a) calculating the probability distribution of 𝜇 over the orbit and (b)
integrating the throughput based on this payload response. It thus results in a straightforward
way for benchmarking payloads directly on an estimation of the averaged capacity, accounting
for the user distribution over the earth. A simulation platform has been developed to characterize
the payload throughput including the implementation of a resource allocation algorithm that
accounts for constraints of various payloads. Using this definition and the developed tool, we
benchmark a bent-pipe architecture, a beam hopping architecture and a hybrid beam-steering
architecture for a LEO megaconstellation use case. The methodology showcases the interest for
investigating different payload architectures depending on realistic traffic scenario analysis.
KEYWORDS
hybrid beamforming, LEO, megaconstellation, multibeam, payload, resource allocation
1 INTRODUCTION
Traditional satellite telecommunication networks are based on GEO satellites and offer either mobile or fixed services that exploit the wide
coverage offered by satellite platforms.1 These services are based on broadcast, multicast, or unicast. Broadcast is used for radio or TV services,
whereas multicast and unicast are more utilized for data services, mobile communications, and broadband internet and multimedia services.2
Broadband services require high data rates per user terminal and consequently wide frequency bands and high Equivalent Isotropic Radiated
Power (EIRP) to close the link budget. To meet this challenge, satellites implement antenna architectures based on multibeam coverages with
high antenna directivities to ensure the EIRP requirements and frequency reuse to increase the aggregated frequency bandwidth available.3
Considering satellites in a 5G environment, other constraints such as latency, wide coverage and reliability. In this context, LEO satellite
megaconstellations bring promising advantages compared with GEO satellites:
• The round-trip time latency for a GEO satellite is 500 milliseconds because of the 36 000 km path between the satellite and Earth, which is
far from the 1-millisecond objective of 5G.4 This requirement is crucial for real time health monitoring or finance transactions for example.4
For a satellite at 1200-km altitude, this round-trip latency is reduced to 16 milliseconds, which makes them a more viable solution than
GEO satellite for applications requiring low latency.
This is an open access article under the terms of the Creative Commons Attribution License, which permits use, distribution and reproduction in any medium, provided
the original work is properly cited.
© 2020 The Authors. International Journal of Satellite Communications and Networking published by John Wiley & Sons, Ltd.
Int J Satell Commun Network. 2020;1–18. wileyonlinelibrary.com/journal/sat 1
2 VIDAL ET AL.
• A constellation of non-GEO satellites may, in the case of a polar orbit for example, offer a seamless quality of service even at the Earth
poles, which is more challenging for GEO satellites because of low user elevations at these latitudes.
• The high number of satellites in megaconstellations makes the loss of a satellite not critical for the complete system (graceful degradation
of the service). Moreover, spare satellites may be placed in orbit in case of failure at low cost compared with the overall system CAPEX.
The previous points emphasize that LEO megaconstellations seem to be a competitive solution to support 5G networks. LEO satellites
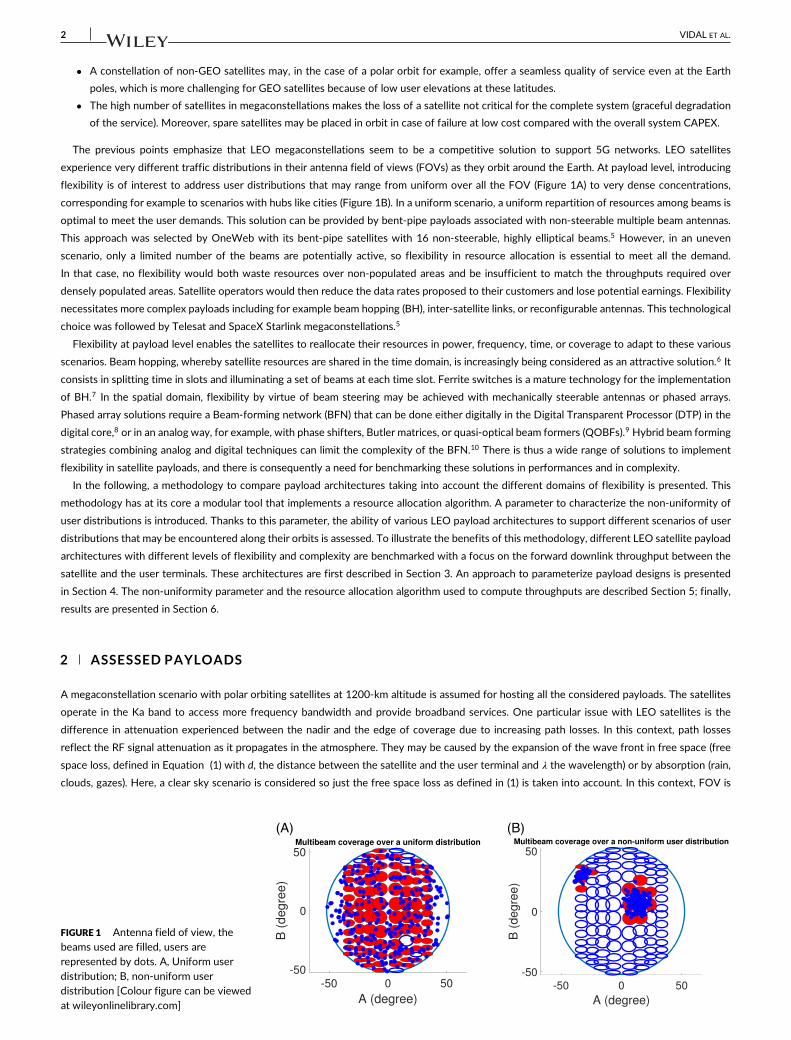
experience very different traffic distributions in their antenna field of views (FOVs) as they orbit around the Earth. At payload level, introducing
flexibility is of interest to address user distributions that may range from uniform over all the FOV (Figure 1A) to very dense concentrations,
corresponding for example to scenarios with hubs like cities (Figure 1B). In a uniform scenario, a uniform repartition of resources among beams is
optimal to meet the user demands. This solution can be provided by bent-pipe payloads associated with non-steerable multiple beam antennas.
This approach was selected by OneWeb with its bent-pipe satellites with 16 non-steerable, highly elliptical beams.5 However, in an uneven
scenario, only a limited number of the beams are potentially active, so flexibility in resource allocation is essential to meet all the demand.
In that case, no flexibility would both waste resources over non-populated areas and be insufficient to match the throughputs required over
densely populated areas. Satellite operators would then reduce the data rates proposed to their customers and lose potential earnings. Flexibility
necessitates more complex payloads including for example beam hopping (BH), inter-satellite links, or reconfigurable antennas. This technological
choice was followed by Telesat and SpaceX Starlink megaconstellations.5
Flexibility at payload level enables the satellites to reallocate their resources in power, frequency, time, or coverage to adapt to these various
scenarios. Beam hopping, whereby satellite resources are shared in the time domain, is increasingly being considered as an attractive solution.6 It
consists in splitting time in slots and illuminating a set of beams at each time slot. Ferrite switches is a mature technology for the implementation
of BH.7 In the spatial domain, flexibility by virtue of beam steering may be achieved with mechanically steerable antennas or phased arrays.
Phased array solutions require a Beam-forming network (BFN) that can be done either digitally in the Digital Transparent Processor (DTP) in the
digital core,8 or in an analog way, for example, with phase shifters, Butler matrices, or quasi-optical beam formers (QOBFs).9 Hybrid beam forming
strategies combining analog and digital techniques can limit the complexity of the BFN.10 There is thus a wide range of solutions to implement
flexibility in satellite payloads, and there is consequently a need for benchmarking these solutions in performances and in complexity.
In the following, a methodology to compare payload architectures taking into account the different domains of flexibility is presented. This
methodology has at its core a modular tool that implements a resource allocation algorithm. A parameter to characterize the non-uniformity of
user distributions is introduced. Thanks to this parameter, the ability of various LEO payload architectures to support different scenarios of user
distributions that may be encountered along their orbits is assessed. To illustrate the benefits of this methodology, different LEO satellite payload
architectures with different levels of flexibility and complexity are benchmarked with a focus on the forward downlink throughput between the
satellite and the user terminals. These architectures are first described in Section 3. An approach to parameterize payload designs is presented
in Section 4. The non-uniformity parameter and the resource allocation algorithm used to compute throughputs are described Section 5; finally,
results are presented in Section 6.
2 ASSESSED PAYLOADS
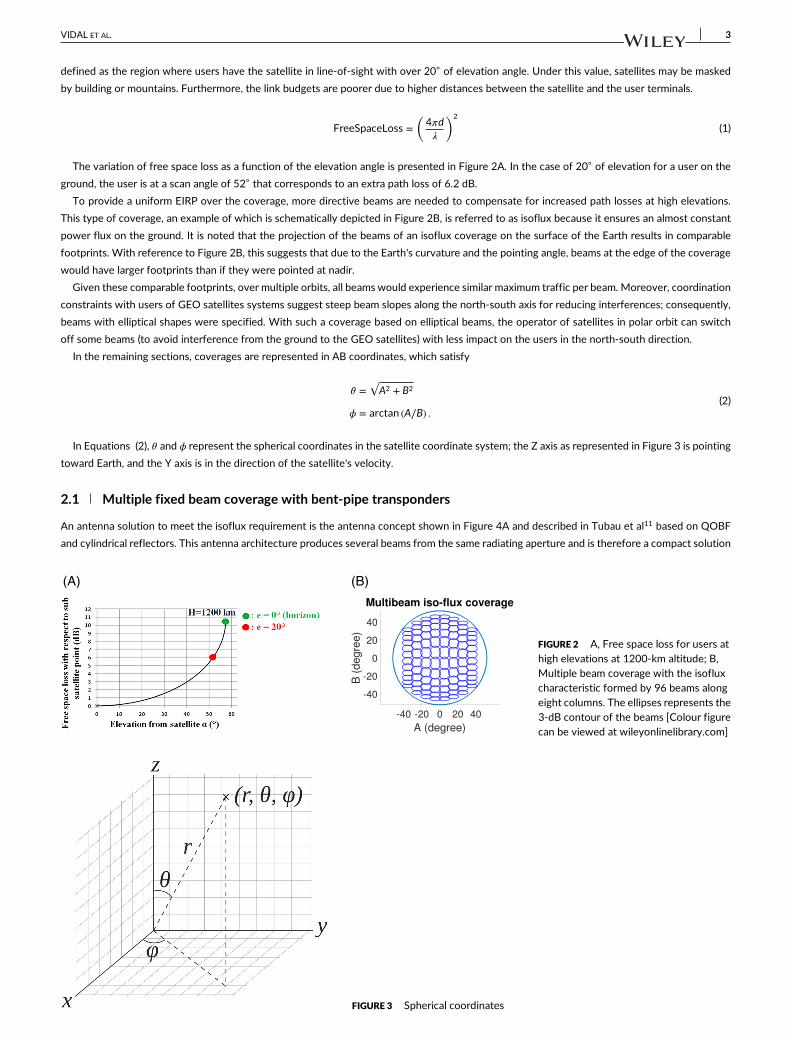
A megaconstellation scenario with polar orbiting satellites at 1200-km altitude is assumed for hosting all the considered payloads. The satellites
operate in the Ka band to access more frequency bandwidth and provide broadband services. One particular issue with LEO satellites is the
difference in attenuation experienced between the nadir and the edge of coverage due to increasing path losses. In this context, path losses
reflect the RF signal attenuation as it propagates in the atmosphere. They may be caused by the expansion of the wave front in free space (free
space loss, defined in Equation (1) with d, the distance between the satellite and the user terminal and 𝜆 the wavelength) or by absorption (rain,
clouds, gazes). Here, a clear sky scenario is considered so just the free space loss as defined in (1) is taken into account. In this context, FOV is
FIGURE 1 Antenna field of view, thebeams used are filled, users arerepresented by dots. A, Uniform userdistribution; B, non-uniform userdistribution [Colour figure can be viewedat wileyonlinelibrary.com]
VIDAL ET AL. 3
defined as the region where users have the satellite in line-of-sight with over 20◦ of elevation angle. Under this value, satellites may be masked
by building or mountains. Furthermore, the link budgets are poorer due to higher distances between the satellite and the user terminals.
FreeSpaceLoss =(
4𝜋d𝜆
)2
(1)
The variation of free space loss as a function of the elevation angle is presented in Figure 2A. In the case of 20◦ of elevation for a user on the
ground, the user is at a scan angle of 52◦ that corresponds to an extra path loss of 6.2 dB.
To provide a uniform EIRP over the coverage, more directive beams are needed to compensate for increased path losses at high elevations.
This type of coverage, an example of which is schematically depicted in Figure 2B, is referred to as isoflux because it ensures an almost constant
power flux on the ground. It is noted that the projection of the beams of an isoflux coverage on the surface of the Earth results in comparable
footprints. With reference to Figure 2B, this suggests that due to the Earth's curvature and the pointing angle, beams at the edge of the coverage
would have larger footprints than if they were pointed at nadir.
Given these comparable footprints, over multiple orbits, all beams would experience similar maximum traffic per beam. Moreover, coordination
constraints with users of GEO satellites systems suggest steep beam slopes along the north-south axis for reducing interferences; consequently,
beams with elliptical shapes were specified. With such a coverage based on elliptical beams, the operator of satellites in polar orbit can switch
off some beams (to avoid interference from the ground to the GEO satellites) with less impact on the users in the north-south direction.
In the remaining sections, coverages are represented in AB coordinates, which satisfy
𝜃 =√
A2 + B2
𝜙 = arctan (A∕B) .(2)
In Equations (2), 𝜃 and 𝜙 represent the spherical coordinates in the satellite coordinate system; the Z axis as represented in Figure 3 is pointing
toward Earth, and the Y axis is in the direction of the satellite's velocity.
2.1 Multiple fixed beam coverage with bent-pipe transponders
An antenna solution to meet the isoflux requirement is the antenna concept shown in Figure 4A and described in Tubau et al11 based on QOBF
and cylindrical reflectors. This antenna architecture produces several beams from the same radiating aperture and is therefore a compact solution
FIGURE 2 A, Free space loss for users athigh elevations at 1200-km altitude; B,Multiple beam coverage with the isofluxcharacteristic formed by 96 beams alongeight columns. The ellipses represents the3-dB contour of the beams [Colour figurecan be viewed at wileyonlinelibrary.com]
FIGURE 3 Spherical coordinates
4 VIDAL ET AL.
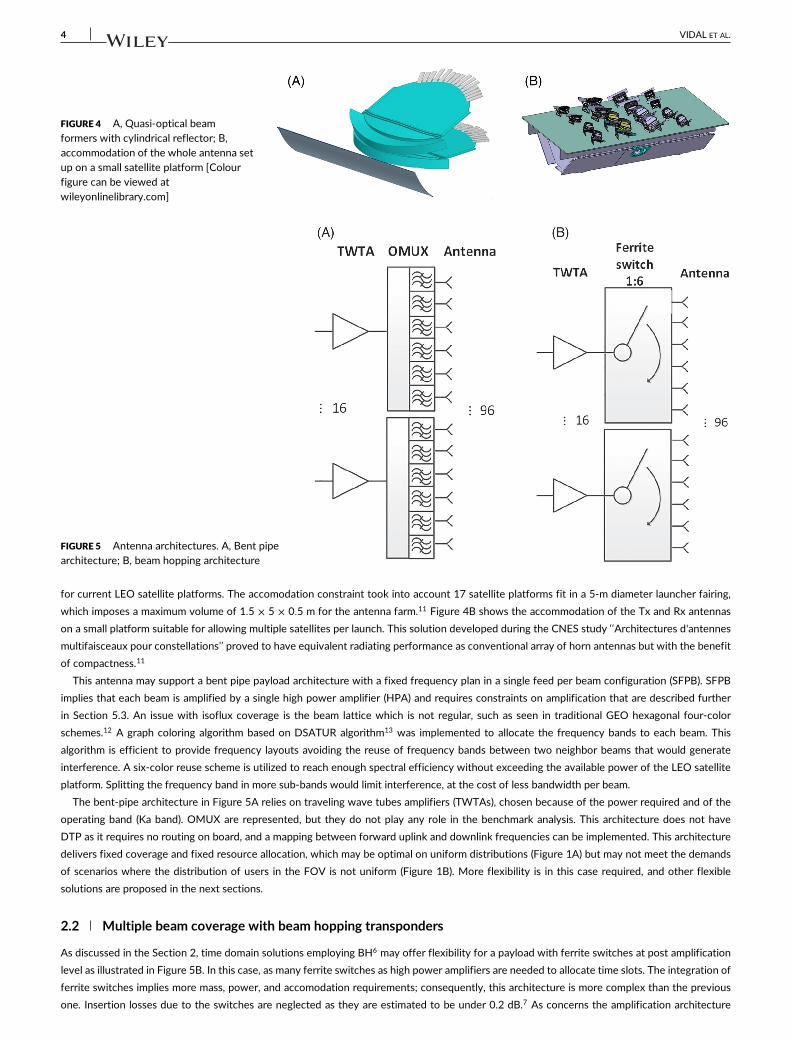
FIGURE 4 A, Quasi-optical beamformers with cylindrical reflector; B,accommodation of the whole antenna setup on a small satellite platform [Colourfigure can be viewed atwileyonlinelibrary.com]
FIGURE 5 Antenna architectures. A, Bent pipearchitecture; B, beam hopping architecture
for current LEO satellite platforms. The accomodation constraint took into account 17 satellite platforms fit in a 5-m diameter launcher fairing,
which imposes a maximum volume of 1.5 × 5 × 0.5 m for the antenna farm.11 Figure 4B shows the accommodation of the Tx and Rx antennas
on a small platform suitable for allowing multiple satellites per launch. This solution developed during the CNES study ‘‘Architectures d'antennes
multifaisceaux pour constellations’’ proved to have equivalent radiating performance as conventional array of horn antennas but with the benefit
of compactness.11
This antenna may support a bent pipe payload architecture with a fixed frequency plan in a single feed per beam configuration (SFPB). SFPB
implies that each beam is amplified by a single high power amplifier (HPA) and requires constraints on amplification that are described further
in Section 5.3. An issue with isoflux coverage is the beam lattice which is not regular, such as seen in traditional GEO hexagonal four-color
schemes.12 A graph coloring algorithm based on DSATUR algorithm13 was implemented to allocate the frequency bands to each beam. This
algorithm is efficient to provide frequency layouts avoiding the reuse of frequency bands between two neighbor beams that would generate
interference. A six-color reuse scheme is utilized to reach enough spectral efficiency without exceeding the available power of the LEO satellite
platform. Splitting the frequency band in more sub-bands would limit interference, at the cost of less bandwidth per beam.
The bent-pipe architecture in Figure 5A relies on traveling wave tubes amplifiers (TWTAs), chosen because of the power required and of the
operating band (Ka band). OMUX are represented, but they do not play any role in the benchmark analysis. This architecture does not have
DTP as it requires no routing on board, and a mapping between forward uplink and downlink frequencies can be implemented. This architecture
delivers fixed coverage and fixed resource allocation, which may be optimal on uniform distributions (Figure 1A) but may not meet the demands
of scenarios where the distribution of users in the FOV is not uniform (Figure 1B). More flexibility is in this case required, and other flexible
solutions are proposed in the next sections.
2.2 Multiple beam coverage with beam hopping transponders
As discussed in the Section 2, time domain solutions employing BH6 may offer flexibility for a payload with ferrite switches at post amplification
level as illustrated in Figure 5B. In this case, as many ferrite switches as high power amplifiers are needed to allocate time slots. The integration of
ferrite switches implies more mass, power, and accomodation requirements; consequently, this architecture is more complex than the previous
one. Insertion losses due to the switches are neglected as they are estimated to be under 0.2 dB.7 As concerns the amplification architecture
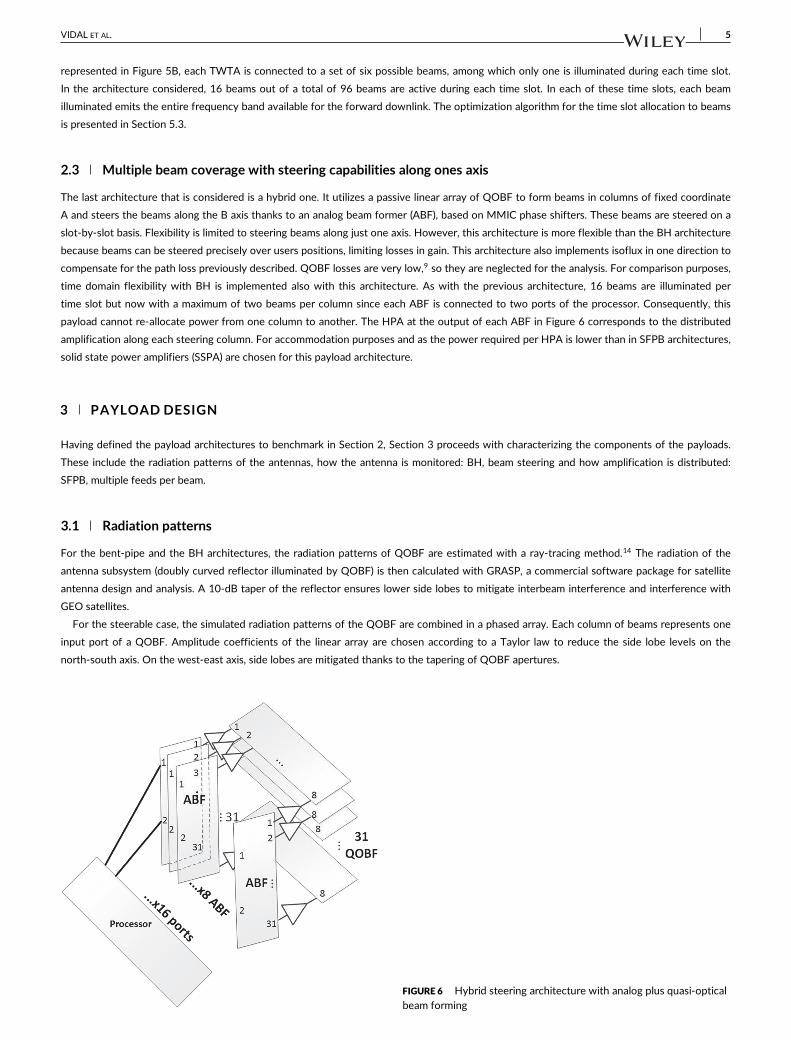
VIDAL ET AL. 5
represented in Figure 5B, each TWTA is connected to a set of six possible beams, among which only one is illuminated during each time slot.
In the architecture considered, 16 beams out of a total of 96 beams are active during each time slot. In each of these time slots, each beam
illuminated emits the entire frequency band available for the forward downlink. The optimization algorithm for the time slot allocation to beams
is presented in Section 5.3.
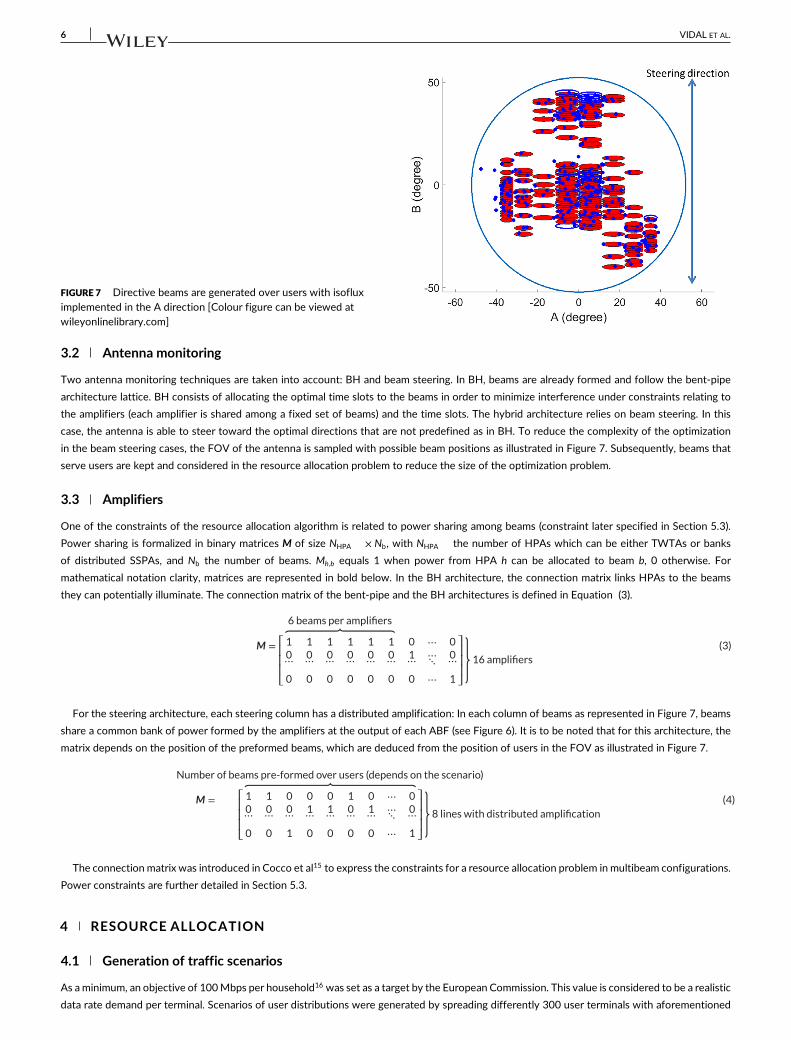
2.3 Multiple beam coverage with steering capabilities along ones axis
The last architecture that is considered is a hybrid one. It utilizes a passive linear array of QOBF to form beams in columns of fixed coordinate
A and steers the beams along the B axis thanks to an analog beam former (ABF), based on MMIC phase shifters. These beams are steered on a
slot-by-slot basis. Flexibility is limited to steering beams along just one axis. However, this architecture is more flexible than the BH architecture
because beams can be steered precisely over users positions, limiting losses in gain. This architecture also implements isoflux in one direction to
compensate for the path loss previously described. QOBF losses are very low,9 so they are neglected for the analysis. For comparison purposes,
time domain flexibility with BH is implemented also with this architecture. As with the previous architecture, 16 beams are illuminated per
time slot but now with a maximum of two beams per column since each ABF is connected to two ports of the processor. Consequently, this
payload cannot re-allocate power from one column to another. The HPA at the output of each ABF in Figure 6 corresponds to the distributed
amplification along each steering column. For accommodation purposes and as the power required per HPA is lower than in SFPB architectures,
solid state power amplifiers (SSPA) are chosen for this payload architecture.
3 PAYLOAD DESIGN
Having defined the payload architectures to benchmark in Section 2, Section 3 proceeds with characterizing the components of the payloads.
These include the radiation patterns of the antennas, how the antenna is monitored: BH, beam steering and how amplification is distributed:
SFPB, multiple feeds per beam.
3.1 Radiation patterns
For the bent-pipe and the BH architectures, the radiation patterns of QOBF are estimated with a ray-tracing method.14 The radiation of the
antenna subsystem (doubly curved reflector illuminated by QOBF) is then calculated with GRASP, a commercial software package for satellite
antenna design and analysis. A 10-dB taper of the reflector ensures lower side lobes to mitigate interbeam interference and interference with
GEO satellites.
For the steerable case, the simulated radiation patterns of the QOBF are combined in a phased array. Each column of beams represents one
input port of a QOBF. Amplitude coefficients of the linear array are chosen according to a Taylor law to reduce the side lobe levels on the
north-south axis. On the west-east axis, side lobes are mitigated thanks to the tapering of QOBF apertures.
FIGURE 6 Hybrid steering architecture with analog plus quasi-opticalbeam forming
6 VIDAL ET AL.
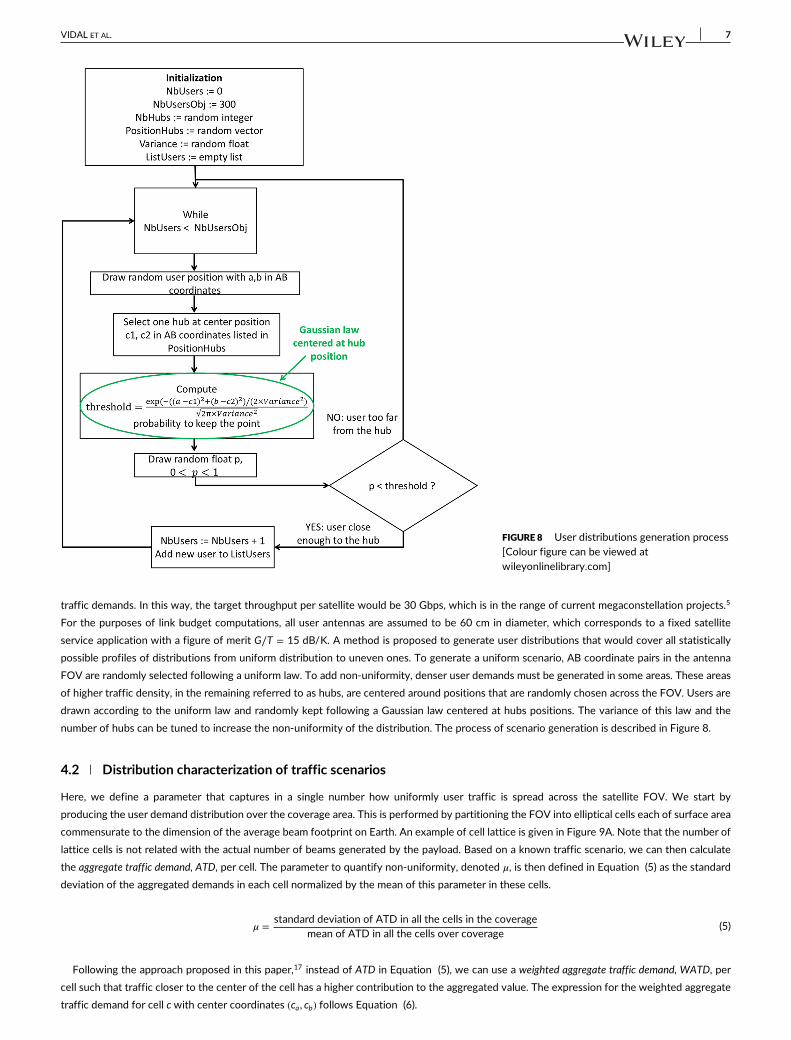
FIGURE 7 Directive beams are generated over users with isofluximplemented in the A direction [Colour figure can be viewed atwileyonlinelibrary.com]
3.2 Antenna monitoring
Two antenna monitoring techniques are taken into account: BH and beam steering. In BH, beams are already formed and follow the bent-pipe
architecture lattice. BH consists of allocating the optimal time slots to the beams in order to minimize interference under constraints relating to
the amplifiers (each amplifier is shared among a fixed set of beams) and the time slots. The hybrid architecture relies on beam steering. In this
case, the antenna is able to steer toward the optimal directions that are not predefined as in BH. To reduce the complexity of the optimization
in the beam steering cases, the FOV of the antenna is sampled with possible beam positions as illustrated in Figure 7. Subsequently, beams that
serve users are kept and considered in the resource allocation problem to reduce the size of the optimization problem.
3.3 Amplifiers
One of the constraints of the resource allocation algorithm is related to power sharing among beams (constraint later specified in Section 5.3).
Power sharing is formalized in binary matrices M of size NHPA × Nb, with NHPA the number of HPAs which can be either TWTAs or banks
of distributed SSPAs, and Nb the number of beams. Mh,b equals 1 when power from HPA h can be allocated to beam b, 0 otherwise. For
mathematical notation clarity, matrices are represented in bold below. In the BH architecture, the connection matrix links HPAs to the beams
they can potentially illuminate. The connection matrix of the bent-pipe and the BH architectures is defined in Equation (3).
For the steering architecture, each steering column has a distributed amplification: In each column of beams as represented in Figure 7, beams
share a common bank of power formed by the amplifiers at the output of each ABF (see Figure 6). It is to be noted that for this architecture, the
matrix depends on the position of the preformed beams, which are deduced from the position of users in the FOV as illustrated in Figure 7.
The connection matrix was introduced in Cocco et al15 to express the constraints for a resource allocation problem in multibeam configurations.
Power constraints are further detailed in Section 5.3.
4 RESOURCE ALLOCATION
4.1 Generation of traffic scenarios
As a minimum, an objective of 100 Mbps per household16 was set as a target by the European Commission. This value is considered to be a realistic
data rate demand per terminal. Scenarios of user distributions were generated by spreading differently 300 user terminals with aforementioned
VIDAL ET AL. 7
FIGURE 8 User distributions generation process[Colour figure can be viewed atwileyonlinelibrary.com]
traffic demands. In this way, the target throughput per satellite would be 30 Gbps, which is in the range of current megaconstellation projects.5
For the purposes of link budget computations, all user antennas are assumed to be 60 cm in diameter, which corresponds to a fixed satellite
service application with a figure of merit G∕T = 15 dB/K. A method is proposed to generate user distributions that would cover all statistically
possible profiles of distributions from uniform distribution to uneven ones. To generate a uniform scenario, AB coordinate pairs in the antenna
FOV are randomly selected following a uniform law. To add non-uniformity, denser user demands must be generated in some areas. These areas
of higher traffic density, in the remaining referred to as hubs, are centered around positions that are randomly chosen across the FOV. Users are
drawn according to the uniform law and randomly kept following a Gaussian law centered at hubs positions. The variance of this law and the
number of hubs can be tuned to increase the non-uniformity of the distribution. The process of scenario generation is described in Figure 8.
4.2 Distribution characterization of traffic scenarios
Here, we define a parameter that captures in a single number how uniformly user traffic is spread across the satellite FOV. We start by
producing the user demand distribution over the coverage area. This is performed by partitioning the FOV into elliptical cells each of surface area
commensurate to the dimension of the average beam footprint on Earth. An example of cell lattice is given in Figure 9A. Note that the number of
lattice cells is not related with the actual number of beams generated by the payload. Based on a known traffic scenario, we can then calculate
the aggregate traffic demand, ATD, per cell. The parameter to quantify non-uniformity, denoted 𝜇, is then defined in Equation (5) as the standard
deviation of the aggregated demands in each cell normalized by the mean of this parameter in these cells.
𝜇 = standard deviation of ATD in all the cells in the coveragemean of ATD in all the cells over coverage
(5)
Following the approach proposed in this paper,17 instead of ATD in Equation (5), we can use a weighted aggregate traffic demand, WATD, per
cell such that traffic closer to the center of the cell has a higher contribution to the aggregated value. The expression for the weighted aggregate
traffic demand for cell c with center coordinates (ca, cb) follows Equation (6).
8 VIDAL ET AL.
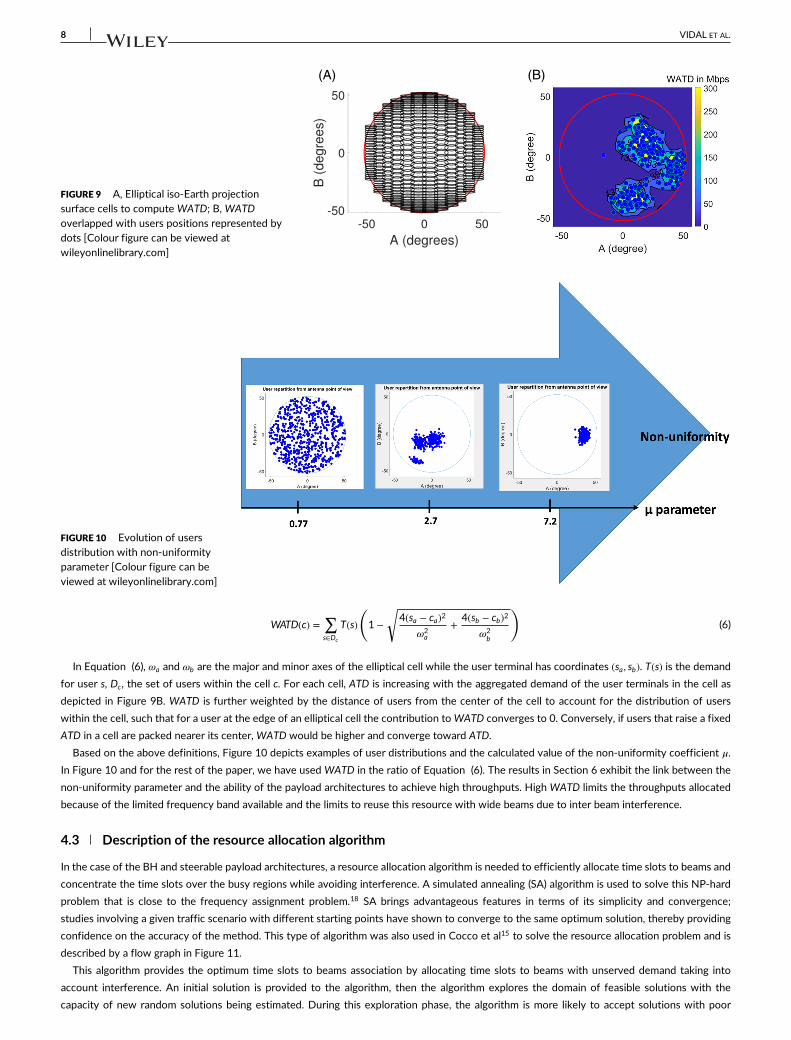
FIGURE 9 A, Elliptical iso-Earth projectionsurface cells to compute WATD; B, WATDoverlapped with users positions represented bydots [Colour figure can be viewed atwileyonlinelibrary.com]
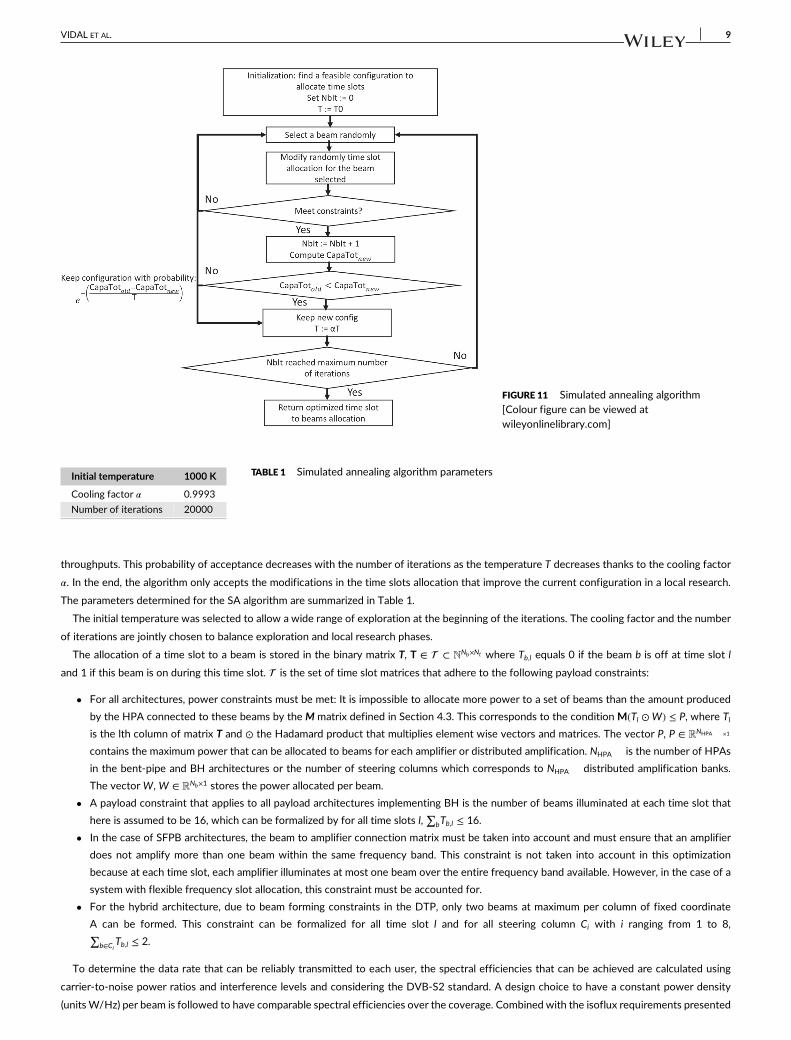
FIGURE 10 Evolution of usersdistribution with non-uniformityparameter [Colour figure can beviewed at wileyonlinelibrary.com]
WATD(c) =∑s∈Dc
T(s)
(1 −
√4(sa − ca)2
𝜔2a
+ 4(sb − cb)2
𝜔2b
)(6)
In Equation (6), 𝜔a and 𝜔b are the major and minor axes of the elliptical cell while the user terminal has coordinates (sa, sb). T(s) is the demand
for user s, Dc, the set of users within the cell c. For each cell, ATD is increasing with the aggregated demand of the user terminals in the cell as
depicted in Figure 9B. WATD is further weighted by the distance of users from the center of the cell to account for the distribution of users
within the cell, such that for a user at the edge of an elliptical cell the contribution to WATD converges to 0. Conversely, if users that raise a fixed
ATD in a cell are packed nearer its center, WATD would be higher and converge toward ATD.
Based on the above definitions, Figure 10 depicts examples of user distributions and the calculated value of the non-uniformity coefficient 𝜇.
In Figure 10 and for the rest of the paper, we have used WATD in the ratio of Equation (6). The results in Section 6 exhibit the link between the
non-uniformity parameter and the ability of the payload architectures to achieve high throughputs. High WATD limits the throughputs allocated
because of the limited frequency band available and the limits to reuse this resource with wide beams due to inter beam interference.
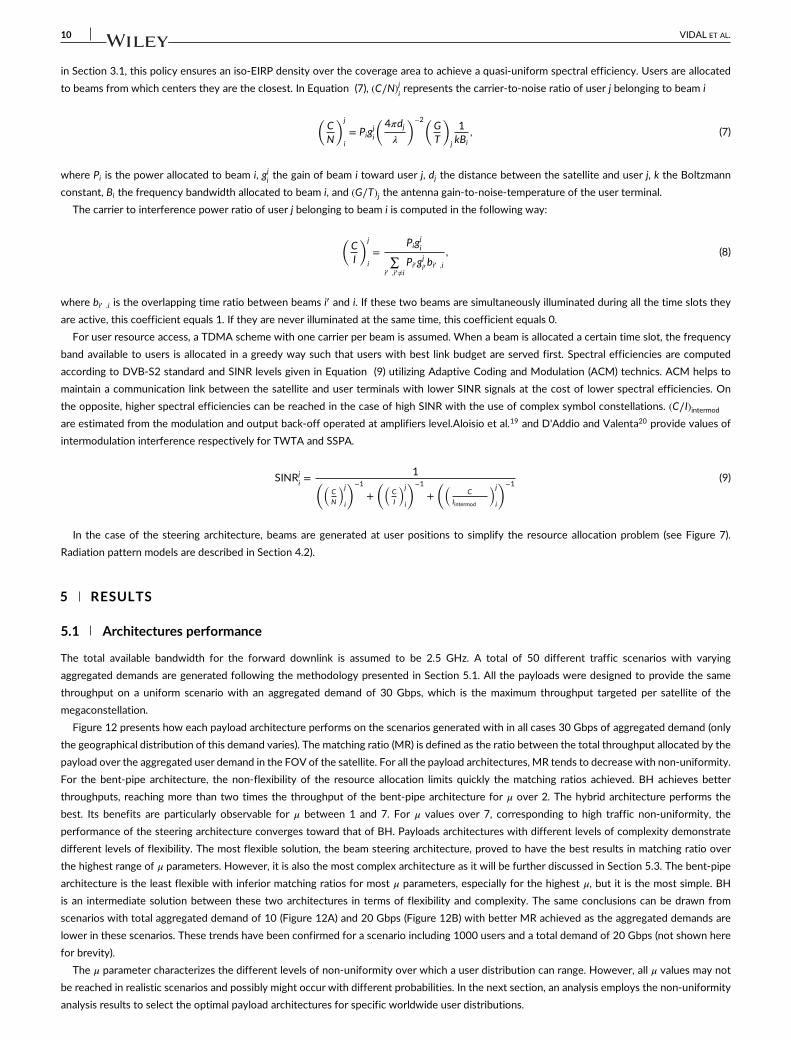
4.3 Description of the resource allocation algorithm
In the case of the BH and steerable payload architectures, a resource allocation algorithm is needed to efficiently allocate time slots to beams and
concentrate the time slots over the busy regions while avoiding interference. A simulated annealing (SA) algorithm is used to solve this NP-hard
problem that is close to the frequency assignment problem.18 SA brings advantageous features in terms of its simplicity and convergence;
studies involving a given traffic scenario with different starting points have shown to converge to the same optimum solution, thereby providing
confidence on the accuracy of the method. This type of algorithm was also used in Cocco et al15 to solve the resource allocation problem and is
described by a flow graph in Figure 11.
This algorithm provides the optimum time slots to beams association by allocating time slots to beams with unserved demand taking into
account interference. An initial solution is provided to the algorithm, then the algorithm explores the domain of feasible solutions with the
capacity of new random solutions being estimated. During this exploration phase, the algorithm is more likely to accept solutions with poor
VIDAL ET AL. 9
FIGURE 11 Simulated annealing algorithm[Colour figure can be viewed atwileyonlinelibrary.com]
Initial temperature 1000 K
Cooling factor 𝛼 0.9993
Number of iterations 20000
TABLE 1 Simulated annealing algorithm parameters
throughputs. This probability of acceptance decreases with the number of iterations as the temperature T decreases thanks to the cooling factor
𝛼. In the end, the algorithm only accepts the modifications in the time slots allocation that improve the current configuration in a local research.
The parameters determined for the SA algorithm are summarized in Table 1.
The initial temperature was selected to allow a wide range of exploration at the beginning of the iterations. The cooling factor and the number
of iterations are jointly chosen to balance exploration and local research phases.
The allocation of a time slot to a beam is stored in the binary matrix T, T ∈ ⊂ NNb×Nt where Tb,l equals 0 if the beam b is off at time slot l
and 1 if this beam is on during this time slot. is the set of time slot matrices that adhere to the following payload constraints:
• For all architectures, power constraints must be met: It is impossible to allocate more power to a set of beams than the amount produced
by the HPA connected to these beams by the M matrix defined in Section 4.3. This corresponds to the condition M(Tl ⊙ W) ≤ P, where Tl
is the lth column of matrix T and ⊙ the Hadamard product that multiplies element wise vectors and matrices. The vector P, P ∈ RNHPA ×1
contains the maximum power that can be allocated to beams for each amplifier or distributed amplification. NHPA is the number of HPAs
in the bent-pipe and BH architectures or the number of steering columns which corresponds to NHPA distributed amplification banks.
The vector W, W ∈ RNb×1 stores the power allocated per beam.
• A payload constraint that applies to all payload architectures implementing BH is the number of beams illuminated at each time slot that
here is assumed to be 16, which can be formalized by for all time slots l,∑
bTb,l ≤ 16.
• In the case of SFPB architectures, the beam to amplifier connection matrix must be taken into account and must ensure that an amplifier
does not amplify more than one beam within the same frequency band. This constraint is not taken into account in this optimization
because at each time slot, each amplifier illuminates at most one beam over the entire frequency band available. However, in the case of a
system with flexible frequency slot allocation, this constraint must be accounted for.
• For the hybrid architecture, due to beam forming constraints in the DTP, only two beams at maximum per column of fixed coordinate
A can be formed. This constraint can be formalized for all time slot l and for all steering column Ci with i ranging from 1 to 8,∑b∈Ci
Tb,l ≤ 2.
To determine the data rate that can be reliably transmitted to each user, the spectral efficiencies that can be achieved are calculated using
carrier-to-noise power ratios and interference levels and considering the DVB-S2 standard. A design choice to have a constant power density
(units W/Hz) per beam is followed to have comparable spectral efficiencies over the coverage. Combined with the isoflux requirements presented
10 VIDAL ET AL.
in Section 3.1, this policy ensures an iso-EIRP density over the coverage area to achieve a quasi-uniform spectral efficiency. Users are allocated
to beams from which centers they are the closest. In Equation (7), (C∕N)ji
represents the carrier-to-noise ratio of user j belonging to beam i
(CN
)j
i
= Pigji
(4𝜋dj
𝜆
)−2(GT
)j
1kBi
, (7)
where Pi is the power allocated to beam i, gji
the gain of beam i toward user j, dj the distance between the satellite and user j, k the Boltzmann
constant, Bi the frequency bandwidth allocated to beam i, and (G∕T)j the antenna gain-to-noise-temperature of the user terminal.
The carrier to interference power ratio of user j belonging to beam i is computed in the following way:
(CI
)j
i
=Pig
ji∑
i′ ,i′≠iPi′ g
ji′
bi′ ,i
, (8)
where bi′ ,i is the overlapping time ratio between beams i′ and i. If these two beams are simultaneously illuminated during all the time slots they
are active, this coefficient equals 1. If they are never illuminated at the same time, this coefficient equals 0.
For user resource access, a TDMA scheme with one carrier per beam is assumed. When a beam is allocated a certain time slot, the frequency
band available to users is allocated in a greedy way such that users with best link budget are served first. Spectral efficiencies are computed
according to DVB-S2 standard and SINR levels given in Equation (9) utilizing Adaptive Coding and Modulation (ACM) technics. ACM helps to
maintain a communication link between the satellite and user terminals with lower SINR signals at the cost of lower spectral efficiencies. On
the opposite, higher spectral efficiencies can be reached in the case of high SINR with the use of complex symbol constellations. (C∕I)intermod
are estimated from the modulation and output back-off operated at amplifiers level.Aloisio et al.19 and D'Addio and Valenta20 provide values of
intermodulation interference respectively for TWTA and SSPA.
SINRji= 1((
CN
)j
i
)−1
+((
CI
)j
i
)−1
+((
CIintermod
)j
i
)−1(9)
In the case of the steering architecture, beams are generated at user positions to simplify the resource allocation problem (see Figure 7).
Radiation pattern models are described in Section 4.2).
5 RESULTS
5.1 Architectures performance
The total available bandwidth for the forward downlink is assumed to be 2.5 GHz. A total of 50 different traffic scenarios with varying
aggregated demands are generated following the methodology presented in Section 5.1. All the payloads were designed to provide the same
throughput on a uniform scenario with an aggregated demand of 30 Gbps, which is the maximum throughput targeted per satellite of the
megaconstellation.
Figure 12 presents how each payload architecture performs on the scenarios generated with in all cases 30 Gbps of aggregated demand (only
the geographical distribution of this demand varies). The matching ratio (MR) is defined as the ratio between the total throughput allocated by the
payload over the aggregated user demand in the FOV of the satellite. For all the payload architectures, MR tends to decrease with non-uniformity.
For the bent-pipe architecture, the non-flexibility of the resource allocation limits quickly the matching ratios achieved. BH achieves better
throughputs, reaching more than two times the throughput of the bent-pipe architecture for 𝜇 over 2. The hybrid architecture performs the
best. Its benefits are particularly observable for 𝜇 between 1 and 7. For 𝜇 values over 7, corresponding to high traffic non-uniformity, the
performance of the steering architecture converges toward that of BH. Payloads architectures with different levels of complexity demonstrate
different levels of flexibility. The most flexible solution, the beam steering architecture, proved to have the best results in matching ratio over
the highest range of 𝜇 parameters. However, it is also the most complex architecture as it will be further discussed in Section 5.3. The bent-pipe
architecture is the least flexible with inferior matching ratios for most 𝜇 parameters, especially for the highest 𝜇, but it is the most simple. BH
is an intermediate solution between these two architectures in terms of flexibility and complexity. The same conclusions can be drawn from
scenarios with total aggregated demand of 10 (Figure 12A) and 20 Gbps (Figure 12B) with better MR achieved as the aggregated demands are
lower in these scenarios. These trends have been confirmed for a scenario including 1000 users and a total demand of 20 Gbps (not shown here
for brevity).
The 𝜇 parameter characterizes the different levels of non-uniformity over which a user distribution can range. However, all 𝜇 values may not
be reached in realistic scenarios and possibly might occur with different probabilities. In the next section, an analysis employs the non-uniformity
analysis results to select the optimal payload architectures for specific worldwide user distributions.
VIDAL ET AL. 11
FIGURE 12 Variation of matching ratioachieved by the payload architectureswith non-uniformity A, total demand of10 Gbps; B, total demand of 20 Gbps; C,total demand of 30 Gbps [Colour figurecan be viewed at wileyonlinelibrary.com]
5.2 Analysis on an orbit with a realistic traffic
In the actual case of a LEO satellite, estimating the throughput at each orbital position is a costly process as the SA algorithm should be run over
one or more complete orbits for each payload architecture considered. An analytical approach is proposed in this section to quickly benchmark
payload architectures for specific traffic scenarios. A simple model of MR, as a function of the aggregated demand and non-uniformity, is
proposed. A statistical overall capacity achieved by each architecture over two polar orbits is deduced from the models and permits one to
determine the best architecture for two different realistic scenarios of users' worldwide distributions. Polar orbits were chosen to achieve global
coverage of Earth. These types of orbits are planned to be used by the OneWeb and Telesat megaconstellations.5
MR functions are modeled with one parameter 𝜇0 defined in Equation (10). This function is chosen because as 𝜇 approaches 0 (uniformity),
the MR converges to 1 (all the user demand is met). 𝜇 was squared to reflect the fact that above a certain non-uniformity, MR decreases more
slowly. As 𝜇0 grows, the MR decreases more rapidly.
MRmodel (𝜇) = 1 − exp
(−𝜇0
𝜇2
)(10)
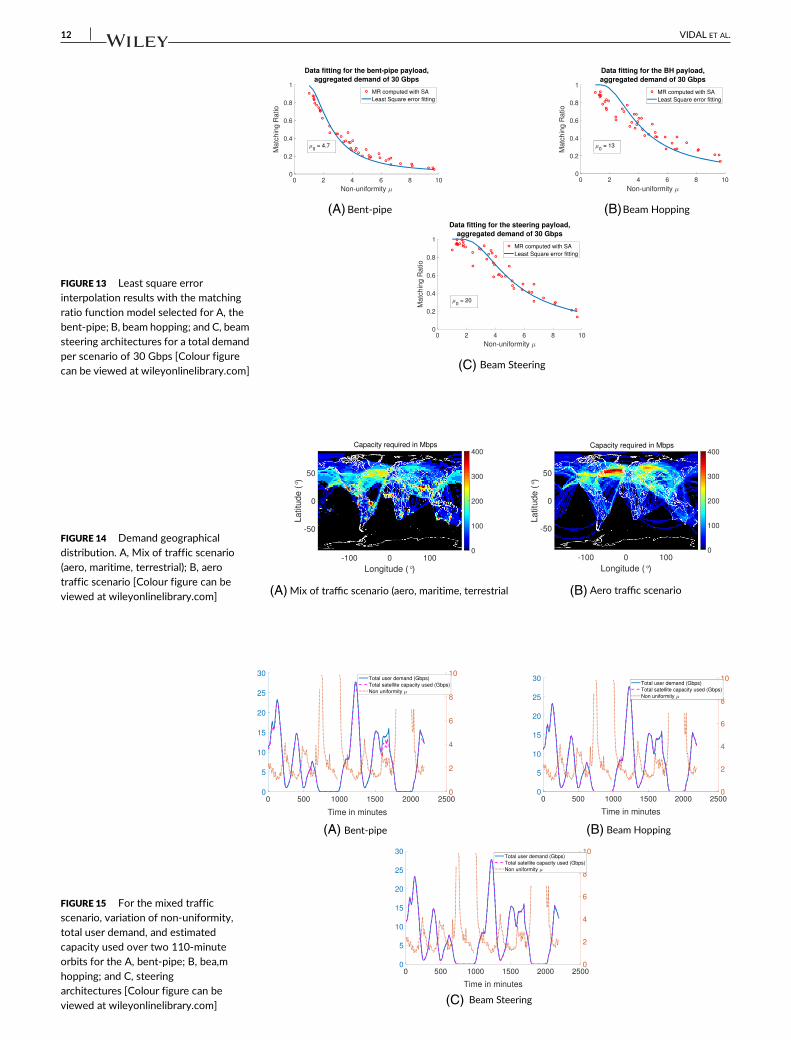
𝜇0 is higher for the steering architecture, showing its greater flexibility compared with the other solutions (see Figure 13 for the results at
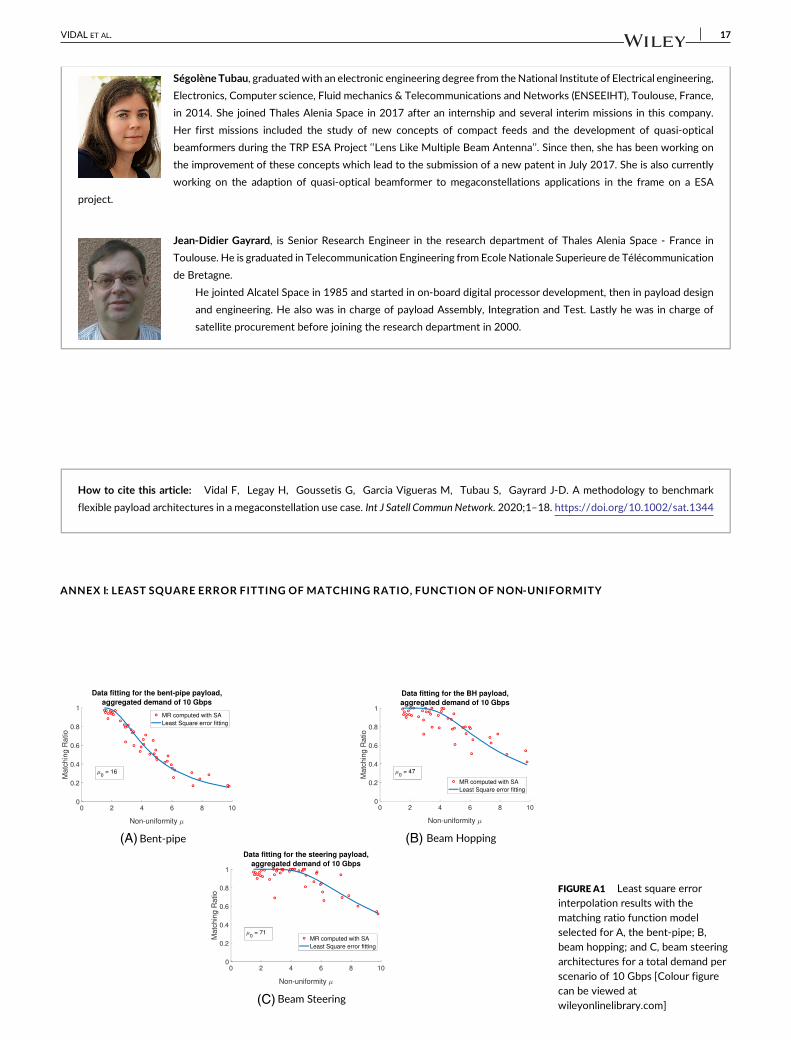
30 Gbps; the results for other values of aggregated demands are included in Annex I, Figure A1 and Figure A2). BH is the second architecture
with higher 𝜇0 and the least flexible bent-pipe architecture has the lowest 𝜇0 parameter.
𝜇0 values are computed with the least square method, which consists of minimizing the sum of the squares of the residuals ri = MRi−MRmodel (𝜇i), with, i = 1, ...n, where n is the number of user distribution scenarios, here 50; 𝜇i are the non-uniformities of each user distributions generated,
computed with the method described in Section 5.2. MRi is the associated matching ratio computed with SA and MRmodel the function expressed
in Equation (10).
A payload benchmark study based on the non-uniformity of realistic traffic issued from a commercial forecast analysis is next presented. These
data are derived from the ESA study Next Generation High Data Rate Trunking Systems21 in the framework of an ARTES Future Program. The
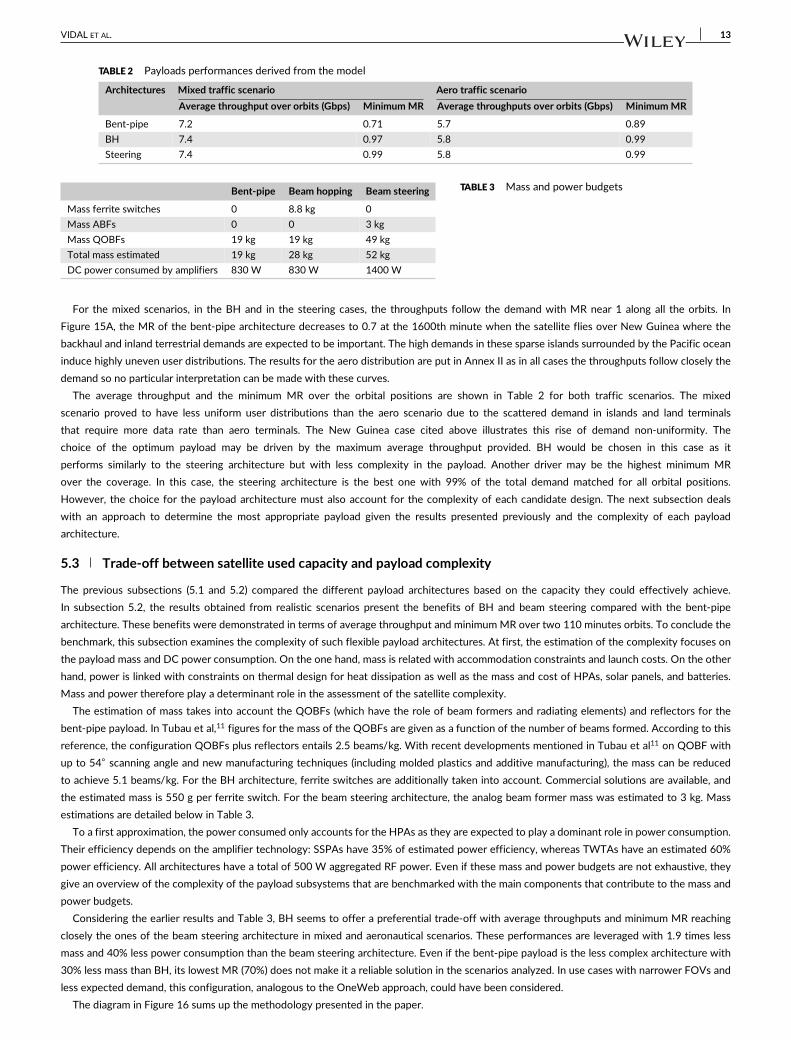
first traffic profile contains a mix of data for aeronautical, maritime, and terrestrial markets exhibited in Figure 14A. The other traffic profile is
only based on the aeronautical data of this study (see Figure 14B). The scenarios are adapted such that the maximum demand in the satellite
FOV never exceeds 30 Gbps throughput for which the payloads were initially designed.
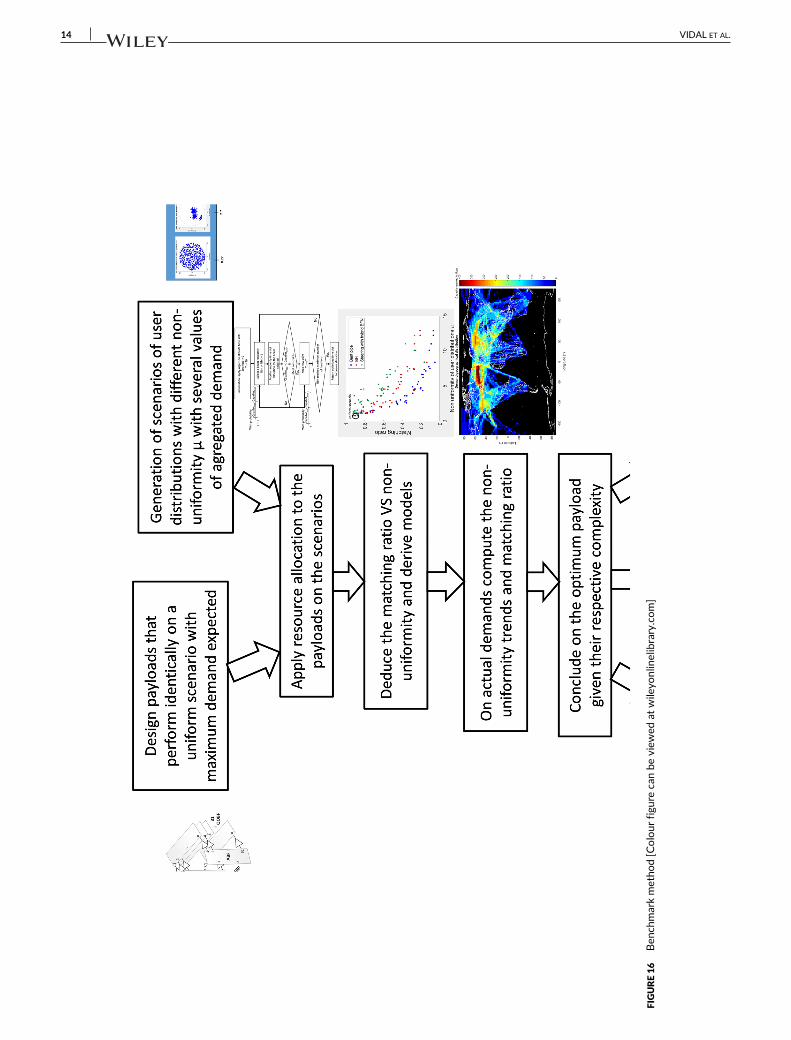
In Figure 15, the mixed demand presented in Figure 14A seen by the satellite orbiting at 1200 km is plotted with the non-uniformity of the
traffic in its FOV and the throughput allocated by different payloads. The results for the aero case displayed in Figure 14B are presented in
Annex II, Figure B1.
In the cases where the aggregated demand is less than 10 Gbps, it is assumed that the satellite completely fulfills the demand. Otherwise, for
each payload architecture and for the demand at each orbital position, the parameter 𝜇0 introduced in Equation (10) is linearly interpolated from
the 𝜇0 obtained for aggregated demands of 10, 20, and 30 Gbps. The gaps in the curves correspond to the flyovers of the South pole where there
is no demand. Non-uniformity may reach high values; however, most of the time, these values are associated with low aggregated demands so
payloads architectures are able to meet the demand in these cases.
12 VIDAL ET AL.
FIGURE 13 Least square errorinterpolation results with the matchingratio function model selected for A, thebent-pipe; B, beam hopping; and C, beamsteering architectures for a total demandper scenario of 30 Gbps [Colour figurecan be viewed at wileyonlinelibrary.com]
FIGURE 14 Demand geographicaldistribution. A, Mix of traffic scenario(aero, maritime, terrestrial); B, aerotraffic scenario [Colour figure can beviewed at wileyonlinelibrary.com]
FIGURE 15 For the mixed trafficscenario, variation of non-uniformity,total user demand, and estimatedcapacity used over two 110-minuteorbits for the A, bent-pipe; B, bea,mhopping; and C, steeringarchitectures [Colour figure can beviewed at wileyonlinelibrary.com]
VIDAL ET AL. 13
TABLE 2 Payloads performances derived from the model
Architectures Mixed traffic scenario Aero traffic scenario
Average throughput over orbits (Gbps) Minimum MR Average throughputs over orbits (Gbps) Minimum MR
Bent-pipe 7.2 0.71 5.7 0.89
BH 7.4 0.97 5.8 0.99
Steering 7.4 0.99 5.8 0.99
Bent-pipe Beam hopping Beam steering
Mass ferrite switches 0 8.8 kg 0
Mass ABFs 0 0 3 kg
Mass QOBFs 19 kg 19 kg 49 kg
Total mass estimated 19 kg 28 kg 52 kg
DC power consumed by amplifiers 830 W 830 W 1400 W
TABLE 3 Mass and power budgets
For the mixed scenarios, in the BH and in the steering cases, the throughputs follow the demand with MR near 1 along all the orbits. In
Figure 15A, the MR of the bent-pipe architecture decreases to 0.7 at the 1600th minute when the satellite flies over New Guinea where the
backhaul and inland terrestrial demands are expected to be important. The high demands in these sparse islands surrounded by the Pacific ocean
induce highly uneven user distributions. The results for the aero distribution are put in Annex II as in all cases the throughputs follow closely the
demand so no particular interpretation can be made with these curves.
The average throughput and the minimum MR over the orbital positions are shown in Table 2 for both traffic scenarios. The mixed
scenario proved to have less uniform user distributions than the aero scenario due to the scattered demand in islands and land terminals
that require more data rate than aero terminals. The New Guinea case cited above illustrates this rise of demand non-uniformity. The
choice of the optimum payload may be driven by the maximum average throughput provided. BH would be chosen in this case as it
performs similarly to the steering architecture but with less complexity in the payload. Another driver may be the highest minimum MR
over the coverage. In this case, the steering architecture is the best one with 99% of the total demand matched for all orbital positions.
However, the choice for the payload architecture must also account for the complexity of each candidate design. The next subsection deals
with an approach to determine the most appropriate payload given the results presented previously and the complexity of each payload
architecture.
5.3 Trade-off between satellite used capacity and payload complexity
The previous subsections (5.1 and 5.2) compared the different payload architectures based on the capacity they could effectively achieve.
In subsection 5.2, the results obtained from realistic scenarios present the benefits of BH and beam steering compared with the bent-pipe
architecture. These benefits were demonstrated in terms of average throughput and minimum MR over two 110 minutes orbits. To conclude the
benchmark, this subsection examines the complexity of such flexible payload architectures. At first, the estimation of the complexity focuses on
the payload mass and DC power consumption. On the one hand, mass is related with accommodation constraints and launch costs. On the other
hand, power is linked with constraints on thermal design for heat dissipation as well as the mass and cost of HPAs, solar panels, and batteries.
Mass and power therefore play a determinant role in the assessment of the satellite complexity.
The estimation of mass takes into account the QOBFs (which have the role of beam formers and radiating elements) and reflectors for the
bent-pipe payload. In Tubau et al,11 figures for the mass of the QOBFs are given as a function of the number of beams formed. According to this
reference, the configuration QOBFs plus reflectors entails 2.5 beams/kg. With recent developments mentioned in Tubau et al11 on QOBF with
up to 54◦ scanning angle and new manufacturing techniques (including molded plastics and additive manufacturing), the mass can be reduced
to achieve 5.1 beams/kg. For the BH architecture, ferrite switches are additionally taken into account. Commercial solutions are available, and
the estimated mass is 550 g per ferrite switch. For the beam steering architecture, the analog beam former mass was estimated to 3 kg. Mass
estimations are detailed below in Table 3.
To a first approximation, the power consumed only accounts for the HPAs as they are expected to play a dominant role in power consumption.
Their efficiency depends on the amplifier technology: SSPAs have 35% of estimated power efficiency, whereas TWTAs have an estimated 60%
power efficiency. All architectures have a total of 500 W aggregated RF power. Even if these mass and power budgets are not exhaustive, they
give an overview of the complexity of the payload subsystems that are benchmarked with the main components that contribute to the mass and
power budgets.
Considering the earlier results and Table 3, BH seems to offer a preferential trade-off with average throughputs and minimum MR reaching
closely the ones of the beam steering architecture in mixed and aeronautical scenarios. These performances are leveraged with 1.9 times less
mass and 40% less power consumption than the beam steering architecture. Even if the bent-pipe payload is the less complex architecture with
30% less mass than BH, its lowest MR (70%) does not make it a reliable solution in the scenarios analyzed. In use cases with narrower FOVs and
less expected demand, this configuration, analogous to the OneWeb approach, could have been considered.
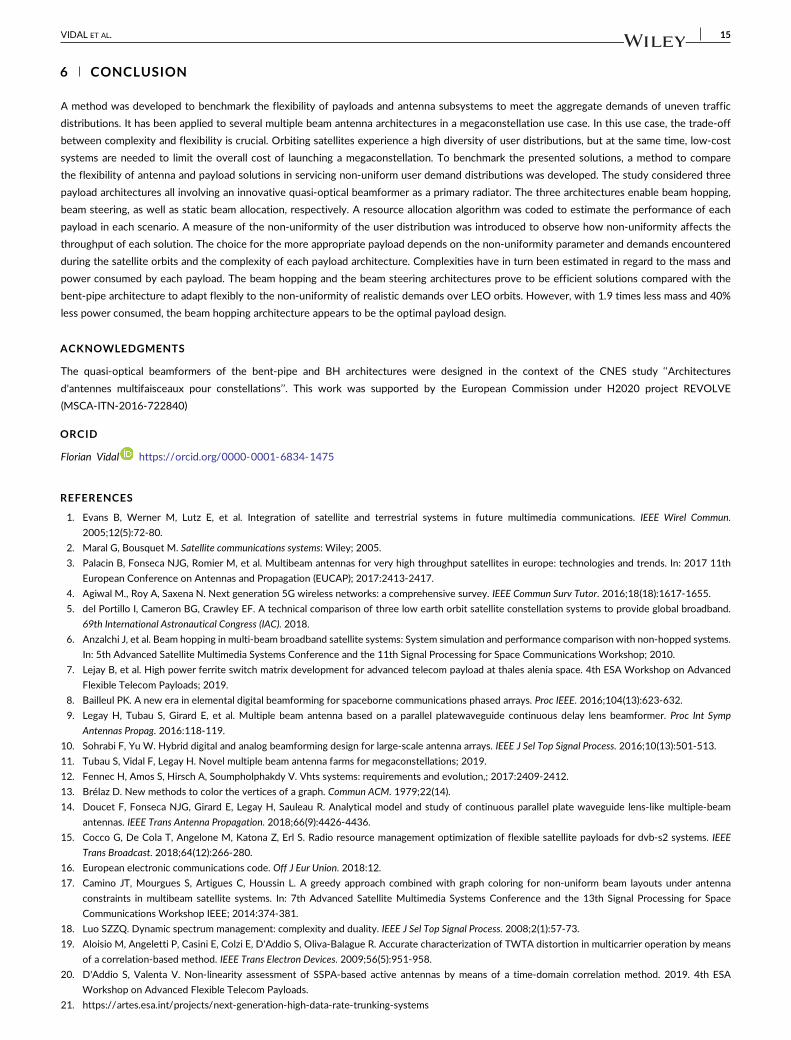
The diagram in Figure 16 sums up the methodology presented in the paper.
14 VIDAL ET AL.
FIG
UR
E1
6B
ench
mar
km
eth
od
[Co
lou
rfi
gure
can
be
view
edat
wile
yon
linel
ibra
ry.c
om
]
VIDAL ET AL. 15
6 CONCLUSION
A method was developed to benchmark the flexibility of payloads and antenna subsystems to meet the aggregate demands of uneven traffic
distributions. It has been applied to several multiple beam antenna architectures in a megaconstellation use case. In this use case, the trade-off
between complexity and flexibility is crucial. Orbiting satellites experience a high diversity of user distributions, but at the same time, low-cost
systems are needed to limit the overall cost of launching a megaconstellation. To benchmark the presented solutions, a method to compare
the flexibility of antenna and payload solutions in servicing non-uniform user demand distributions was developed. The study considered three
payload architectures all involving an innovative quasi-optical beamformer as a primary radiator. The three architectures enable beam hopping,
beam steering, as well as static beam allocation, respectively. A resource allocation algorithm was coded to estimate the performance of each
payload in each scenario. A measure of the non-uniformity of the user distribution was introduced to observe how non-uniformity affects the
throughput of each solution. The choice for the more appropriate payload depends on the non-uniformity parameter and demands encountered
during the satellite orbits and the complexity of each payload architecture. Complexities have in turn been estimated in regard to the mass and
power consumed by each payload. The beam hopping and the beam steering architectures prove to be efficient solutions compared with the
bent-pipe architecture to adapt flexibly to the non-uniformity of realistic demands over LEO orbits. However, with 1.9 times less mass and 40%
less power consumed, the beam hopping architecture appears to be the optimal payload design.
ACKNOWLEDGMENTS
The quasi-optical beamformers of the bent-pipe and BH architectures were designed in the context of the CNES study ‘‘Architectures
d'antennes multifaisceaux pour constellations’’. This work was supported by the European Commission under H2020 project REVOLVE
(MSCA-ITN-2016-722840)
ORCID
Florian Vidal https://orcid.org/0000-0001-6834-1475
REFERENCES
1. Evans B, Werner M, Lutz E, et al. Integration of satellite and terrestrial systems in future multimedia communications. IEEE Wirel Commun.
2005;12(5):72-80.
2. Maral G, Bousquet M. Satellite communications systems: Wiley; 2005.
3. Palacin B, Fonseca NJG, Romier M, et al. Multibeam antennas for very high throughput satellites in europe: technologies and trends. In: 2017 11th
European Conference on Antennas and Propagation (EUCAP); 2017:2413-2417.
4. Agiwal M., Roy A, Saxena N. Next generation 5G wireless networks: a comprehensive survey. IEEE Commun Surv Tutor. 2016;18(18):1617-1655.
5. del Portillo I, Cameron BG, Crawley EF. A technical comparison of three low earth orbit satellite constellation systems to provide global broadband.
69th International Astronautical Congress (IAC). 2018.
6. Anzalchi J, et al. Beam hopping in multi-beam broadband satellite systems: System simulation and performance comparison with non-hopped systems.
In: 5th Advanced Satellite Multimedia Systems Conference and the 11th Signal Processing for Space Communications Workshop; 2010.
7. Lejay B, et al. High power ferrite switch matrix development for advanced telecom payload at thales alenia space. 4th ESA Workshop on Advanced
Flexible Telecom Payloads; 2019.
8. Bailleul PK. A new era in elemental digital beamforming for spaceborne communications phased arrays. Proc IEEE. 2016;104(13):623-632.
9. Legay H, Tubau S, Girard E, et al. Multiple beam antenna based on a parallel platewaveguide continuous delay lens beamformer. Proc Int Symp
Antennas Propag. 2016:118-119.
10. Sohrabi F, Yu W. Hybrid digital and analog beamforming design for large-scale antenna arrays. IEEE J Sel Top Signal Process. 2016;10(13):501-513.
11. Tubau S, Vidal F, Legay H. Novel multiple beam antenna farms for megaconstellations; 2019.
12. Fennec H, Amos S, Hirsch A, Soumpholphakdy V. Vhts systems: requirements and evolution,; 2017:2409-2412.
13. Brélaz D. New methods to color the vertices of a graph. Commun ACM. 1979;22(14).
14. Doucet F, Fonseca NJG, Girard E, Legay H, Sauleau R. Analytical model and study of continuous parallel plate waveguide lens-like multiple-beam
antennas. IEEE Trans Antenna Propagation. 2018;66(9):4426-4436.
15. Cocco G, De Cola T, Angelone M, Katona Z, Erl S. Radio resource management optimization of flexible satellite payloads for dvb-s2 systems. IEEE
Trans Broadcast. 2018;64(12):266-280.
16. European electronic communications code. Off J Eur Union. 2018:12.
17. Camino JT, Mourgues S, Artigues C, Houssin L. A greedy approach combined with graph coloring for non-uniform beam layouts under antenna
constraints in multibeam satellite systems. In: 7th Advanced Satellite Multimedia Systems Conference and the 13th Signal Processing for Space
Communications Workshop IEEE; 2014:374-381.
18. Luo SZZQ. Dynamic spectrum management: complexity and duality. IEEE J Sel Top Signal Process. 2008;2(1):57-73.
19. Aloisio M, Angeletti P, Casini E, Colzi E, D'Addio S, Oliva-Balague R. Accurate characterization of TWTA distortion in multicarrier operation by means
of a correlation-based method. IEEE Trans Electron Devices. 2009;56(5):951-958.
20. D'Addio S, Valenta V. Non-linearity assessment of SSPA-based active antennas by means of a time-domain correlation method. 2019. 4th ESA
Workshop on Advanced Flexible Telecom Payloads.
21. https://artes.esa.int/projects/next-generation-high-data-rate-trunking-systems
16 VIDAL ET AL.
AUTHOR BIOGRAPHIES
Florian Vidal received his master's degree in engineering from ISAE Supaero, Toulouse, France in 2017. In the
framework of the REVOLVE project funded by the European commission, he is currently pursuing a PhD degree
in electrical engineering at Heriot Watt University, Edinburgh, United Kingdom in collaboration with Thales Alenia
Space, Toulouse, France and the Institut d'Electronique et de Télécommunications de Rennes, INSA Rennes, France.
For 6 months, he was an intern at Inmarsat in the Space Segment Department where he carried out his master's
thesis project on big data processing for satellite payload design. His current research interests include payload
architectures based on multiple beam antennas and precoding technics for telecommunication satellite applications. With Thales Alenia
Space, he supported the CNES study ‘‘Architectures d'antennes multifaisceaux pour constellations’’ to show the benefits of beam hopping
to adress non-uniform user distributions.
Hervé Legay received his electrical engineering and PhD degrees from the National Institute of Applied Sciences,
Rennes, France, in 1988 and 1991, respectively. He was then a Post-Doctoral Fellow with the University of Manitoba,
Winnipeg, MB, Canada.
In 1994, he joined Alcatel Space (now Thales Alenia Space), Toulouse, France. He initially conducted studies in
the areas of military telecommunication satellite antennas and antenna processing. He designed the architecture
and the antijamming process of the Syracuse 3 active antenna. He is currently the Head of the R&T on space
antennas, developing new antenna concepts with emerging technologies (Reflectarrays, integrated antennas, multiple beam quasi-optical
antennas, innovative active architectures, antenna processing. He is co-director of the joint laboratory MERLIN, involving Thales Alenia
Space, and the Institut d'Electronique et de Télécommunication de Rennes. Dr Legay is the chair of a group of antenna experts in Thales
Group. He coordinates the collaborations with academic and research partners. He has authored 35 patents. He was a co-prize winner of
the 2007 Schelkunoff Prize Paper Award. He was a recipient of the Gold Thales Awards in 2008, a reward for the best innovations in the
Thales Group.
George Goussetis received his diploma degree in Electrical and Computer Engineering from the National Technical
University of Athens, Greece, in 1998, and his PhD degree from the University of Westminster, London, UK, in
2002. In 2002, he also graduated BSc in physics (first class) from University College London (UCL), UK. In 1998,
he joined the Space Engineering, Rome, Italy, as RF Engineer and in 1999 the Wireless Communications Research
Group, University of Westminster, UK, as a research assistant. Between 2002 and 2006, he was a senior research
fellow at Loughborough University, UK. He was a lecturer (assistant professor) in Heriot-Watt University, Edinburgh,
UK between 2006 and 2009 and a reader (associate professor) in Queen's University Belfast, UK, between 2009 and
2012. In 2013, he joined Heriot-Watt as a reader. He has authored or co-authored over 150 peer-reviewed papers, three book chapters,
and two patents. Professor Goussetis has held a research fellowship from the Onassis Foundation in 2001, a research fellowship from the
UK Royal Academy of Engineering between 2006 and 2011 and a European Marie-Curie experienced researcher fellowship in 2011 to
2012. In 2010, he was a visiting professor in UPCT, Spain. He is the co-recipient of the 2011 European Space Agency young engineer of
the year prize, the 2011 EuCAP best student paper prize, and the 2012 EuCAP best antenna theory paper prize.
Maria Garcia Vigueras, was born in Murcia, Spain. She received both the Telecommunications Engineer and
Ph.D. degrees from the Universidad Politécnica de Cartagena (UPCT), Spain, in 2007 and 2012, respectively.
From 2012 to 2015, she was a Postdoctoral Research Fellow at the Laboratory of Electromagnetism and Anten-
nas, École Polytechnique Fédérale de Lausanne (EPFL), in Switzerland. She has been a visiting researcher at
Heriot-Watt University, Edinburgh, Scotland, U.K; at the University of Seville, Seville, Spain; and at Queen's Uni-
versity of Belfast, Belfast, Northern Ireland, U.K. Since November 2015, she works as Assistant Professor at
the Institut National des Sciences Appliquées de Rennes and Researcher at IETR. Her main research interests
include leaky-wave antennas (analysis, design, and pattern synthesis), periodic surfaces (physical insightful modeling), and compact
antennas for satellite communications. María was the recipient of the Best Ph.D. Thesis award both from UPCT in 2013, and
from the Spanish ‘‘Colegio Oficial de Ingenieros de Telecomunicaciones’’ (Official Association of Telecommunication Engineers) in
2014. She received the Best Antenna Theory Paper awards at the 5th IEEE Symposium on Microwave, Antenna, Propagation &
EMC Technologies (MAPE 2013, China), and the 6th European Conference of Antennas and Propagation (EuCAP 2012, Prague,
Czech Republic).
VIDAL ET AL. 17
Ségolène Tubau, graduated with an electronic engineering degree from the National Institute of Electrical engineering,
Electronics, Computer science, Fluid mechanics & Telecommunications and Networks (ENSEEIHT), Toulouse, France,
in 2014. She joined Thales Alenia Space in 2017 after an internship and several interim missions in this company.
Her first missions included the study of new concepts of compact feeds and the development of quasi-optical
beamformers during the TRP ESA Project ‘‘Lens Like Multiple Beam Antenna’’. Since then, she has been working on
the improvement of these concepts which lead to the submission of a new patent in July 2017. She is also currently
working on the adaption of quasi-optical beamformer to megaconstellations applications in the frame on a ESA
project.
Jean-Didier Gayrard, is Senior Research Engineer in the research department of Thales Alenia Space - France in
Toulouse. He is graduated in Telecommunication Engineering from Ecole Nationale Superieure de Télécommunication
de Bretagne.
He jointed Alcatel Space in 1985 and started in on-board digital processor development, then in payload design
and engineering. He also was in charge of payload Assembly, Integration and Test. Lastly he was in charge of
satellite procurement before joining the research department in 2000.
How to cite this article: Vidal F, Legay H, Goussetis G, Garcia Vigueras M, Tubau S, Gayrard J-D. A methodology to benchmark
flexible payload architectures in a megaconstellation use case. Int J Satell Commun Network. 2020;1–18. https://doi.org/10.1002/sat.1344
ANNEX I: LEAST SQUARE ERROR FITTING OF MATCHING RATIO, FUNCTION OF NON-UNIFORMITY
FIGURE A1 Least square errorinterpolation results with thematching ratio function modelselected for A, the bent-pipe; B,beam hopping; and C, beam steeringarchitectures for a total demand perscenario of 10 Gbps [Colour figurecan be viewed atwileyonlinelibrary.com]

18 VIDAL ET AL.
FIGURE A2 Least square errorinterpolation results with thematchign ratio function modelselected for A, the bent-pipe; B,beam hopping; and C, beam steeringarchitectures for a total demand perscenario of 20 Gbps [Colour figurecan be viewed atwileyonlinelibrary.com]
ANNEX II: RESULTS FOR THE AERO USER DISTRIBUTION
FIGURE B1 For the aero trafficscenario, variation of non-uniformity,total user demand, and estimatedcapacity used over two 110 minuteorbits for the A, bent-pipe; B, beamhopping; and C, steeringarchitectures [Colour figure can beviewed at wileyonlinelibrary.com]