a model of service quality to improve international
TRANSCRIPT

Academy of Marketing Studies Journal Volume 23, Issue 4, 2019
1 1528-2678-23-4-235
A MODEL OF SERVICE QUALITY TO IMPROVE
INTERNATIONAL AIRPORTS RANKING STARS
Ida Nuraida, Parahyangan Catholic University
Lilian Danil, Parahyangan Catholic University
ABSTRACT
Satisfaction of the passengers is an important part of the service provided at the airport.
An independent agency called Skytrax conducted a survey on passenger satisfaction from
international airports all over the the world. The aim of this empirical research is to propose a
model of service quality and passenger satisfaction for Soekarno-Hatta International Airport
and other international airports in Indonesia to increase the airport ranking stars. This research
uses the quantitative method. Quantitative research conducted by the AMOS confirmatory
analysis, subsequently continued by Structural Equation Modelling, interviews and observations.
Among all service quality, responsiveness is the most important thing in increasing passenger
satisfaction at international airports.
Keywords: Airport, Passengers Satisfaction, Service Quality.
INTRODUCTION
The growth of the middle class in Indonesia has been very rapid over the last five years to
reach 56.5%, thus increasing the need for more convenient and quick transportation for both
business and leisure. One of them is a change in the selection of a rapid means of transportation,
namely by using air transportation. It is also supported by the ease of making ticket purchasing
transactions and competitive rates between airlines, and the ease of completing check-in process,
by using an online system. In traveling by air transport ie aircraft cannot be separated from the
airport used for landing and takeoff for the aircraft. According to the transportation department,
the airport is an area on land and / or water with certain limits used as a place for landing and
take-off aircraft, passengers, loading and unloading of goods, and places of intra- and intermodal
transport, equipped with facilities flight safety and security, as well as basic facilities and other
supporting facilities. One of the airports in Indonesia is the Soekarno-Hatta international airport
(Cengkareng) located in Jakarta as the capital of the Republic of Indonesia, which is one of the
centers for domestic and international flights.
The airport is a company engaged in services, so customer satisfaction is very important.
Research on customer satisfaction has been conducted by Skytrax. Skytrax is a company that
researches the services provided by airlines and airports, and ranks the results of its research.
One of Skytrax's assessments is Soekarno-Hatta International Airport, which is located around
Jakarta as the capital city of the Republic of Indonesia. Because of its location in the capital city
of Indonesia, this airport can become an example for other international airports in Indonesia.The
results from Skytrax assess the International Airport Soekarno-Hatta Jakarta as an airport that is
still not included in the top 10 world airports that provide the best service. The world’s top ten
airports which have 5-stars airport ranking are 1) Singapore Changi Airport, 2) Incheon
International Airport, 3)Tokyo Haneda International Airport, 4) Hong Kong International
Airport, 5) Hamad International Airport, 6) Munich Airport, 7) Chubu Centrair International
Academy of Marketing Studies Journal Volume 23, Issue 4, 2019
2 1528-2678-23-4-235
Airport, 8) London Heathrow Airport, 9) Zurich Airport, 10) Frankfurt Airport. Soekarno-Hatta
International Airport has 3-stars.
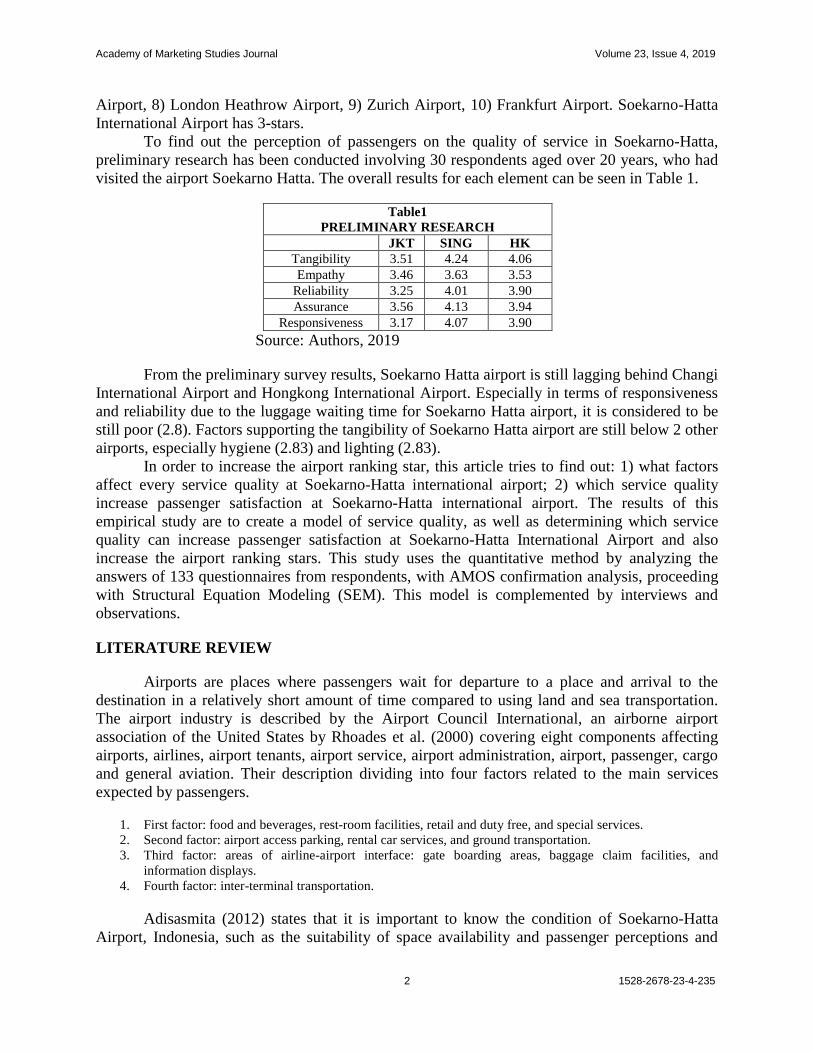
To find out the perception of passengers on the quality of service in Soekarno-Hatta,
preliminary research has been conducted involving 30 respondents aged over 20 years, who had
visited the airport Soekarno Hatta. The overall results for each element can be seen in Table 1.
Table1
PRELIMINARY RESEARCH
JKT SING HK
Tangibility 3.51 4.24 4.06
Empathy 3.46 3.63 3.53
Reliability 3.25 4.01 3.90
Assurance 3.56 4.13 3.94
Responsiveness 3.17 4.07 3.90
Source: Authors, 2019
From the preliminary survey results, Soekarno Hatta airport is still lagging behind Changi
International Airport and Hongkong International Airport. Especially in terms of responsiveness
and reliability due to the luggage waiting time for Soekarno Hatta airport, it is considered to be
still poor (2.8). Factors supporting the tangibility of Soekarno Hatta airport are still below 2 other
airports, especially hygiene (2.83) and lighting (2.83).
In order to increase the airport ranking star, this article tries to find out: 1) what factors
affect every service quality at Soekarno-Hatta international airport; 2) which service quality
increase passenger satisfaction at Soekarno-Hatta international airport. The results of this
empirical study are to create a model of service quality, as well as determining which service
quality can increase passenger satisfaction at Soekarno-Hatta International Airport and also
increase the airport ranking stars. This study uses the quantitative method by analyzing the
answers of 133 questionnaires from respondents, with AMOS confirmation analysis, proceeding
with Structural Equation Modeling (SEM). This model is complemented by interviews and
observations.
LITERATURE REVIEW
Airports are places where passengers wait for departure to a place and arrival to the
destination in a relatively short amount of time compared to using land and sea transportation.
The airport industry is described by the Airport Council International, an airborne airport
association of the United States by Rhoades et al. (2000) covering eight components affecting
airports, airlines, airport tenants, airport service, airport administration, airport, passenger, cargo
and general aviation. Their description dividing into four factors related to the main services
expected by passengers.
1. First factor: food and beverages, rest-room facilities, retail and duty free, and special services.
2. Second factor: airport access parking, rental car services, and ground transportation.
3. Third factor: areas of airline-airport interface: gate boarding areas, baggage claim facilities, and
information displays.
4. Fourth factor: inter-terminal transportation.
Adisasmita (2012) states that it is important to know the condition of Soekarno-Hatta
Airport, Indonesia, such as the suitability of space availability and passenger perceptions and

Academy of Marketing Studies Journal Volume 23, Issue 4, 2019
3 1528-2678-23-4-235
performance at airport terminal facilities. Improved economic conditions followed by the
increasing number of airlines in Indonesia effect to the price of air travel, which has became
more affordable to the public. He analyzed this from the engineering and technological
standpoint, measuring the passenger’s perception toward the performance, service level and
prospect of terminal facilities development at the airport’s terminal building. The results of the
Importance-Performance Analysis is as follows: the waiting room and food and beverages were
prioritized for expansion; airline counters frontage/check-in, lobby and inspection (lobby and
ticketing), and departure lounge were in good condition but must be maintained; baggage claim
and baggage inspection areas indicated a certain impact on the satisfaction of service users; and
airlines ticketing office, supporting services, and concourse did not affect the interest/satisfaction
of service users.
As a service company, an airport should pay attention to service quality. Therefore, we
need to understand which passenger perceptions of airport service quality can improve passenger
satisfaction. According to Shahin (2006), service quality referes to the extent to which a service
meets customers’ needs or expectations. If the expectations exceed the actual performance, then
the perceived quality is less than satisfactory and hence customer dissatisfaction occurs (Shahin,
2006). In figure 1 the customer gap is the difference between customer expectations and
perceptions (Zeithaml et al., 2013).
Source: Zeithaml et al., 2013
FIGURE 1
THE CUSTOMER GAP
If the consumer's perception of service quality equals expectations, the consumer will be
satisfied. If the consumer's perception of service quality is greater than expectations, then the
consumer will be highly satisfied. If the consumer's perception of service quality is less than
expected, the consumer will be dissatisfied. Satisfaction is obtained from the services provided
by the airport; if there is a gap it means there is dissatisfaction from the customer.
With the growing interest in the subject, Airport Service Quality (ASQ) surveys have
been systematically carried out by international agencies, regulatory authorities, airport
operators, and other organizations (ACI, 2014; Fodness & Murray, 2007; IATA, 2015; Kramer et
al., 2013; Zidarova & Zografos, 2011). In spite of systematic practices within the airport industry
(ACI, 2014; IATA, 2015; Kramer et al., 2013; Zidarova & Zografos, 2011), usually, they have
been more concerned with context-specific purposes and considerations regarding the reliability
and validity aspects of the measurement instrument have received only limited attention (George
et al., 2013). As airports are complex service settings, generic approaches for measuring service
quality might not cover some specific characteristics related to the passenger-airport interaction
(George et al., 2013, Pantouvakis, 2010). Non-aeronautical revenues have become critical for
airport sustainability, which leads to increasing concerns with the marketing of retail areas within

Academy of Marketing Studies Journal Volume 23, Issue 4, 2019
4 1528-2678-23-4-235
airport terminals (Gillen, 2011). Airport service quality would raise the level of transfer
passengers’ satisfaction, value perceptions, and airport image formation. In addition, airport
service quality has an indirect impact on transfer passenger behavior by means of value,
satisfaction, and airport image (Park & Jung, 2011).
Bogicevic et al. (2013) developed Herzberg's two-factor motivation theory to explore
most frequently mentioned attributes of airport service quality and distinguish key drivers for
passenger satisfaction/dissatisfaction in the airport context. They analysed 1,095 traveler
comments posted between 2010 and 2013 on an airport review web site which was performed in
order to identify satisfying/dissatisfying factor. The web spider randomly selected consumer
comments related to 33 popular destinations. The study results indicated key satisfiers in
the airport context such as cleanliness and pleasant environment to spend time in. On the other
side, security-check, confusing signage and poor dining offer are recognized as major
dissatisfiers in the airport setting.
Service quality improvement of the people mover system in the grand design of Soekarno
Hatta International Airport (SHIA) expected to support increasing airport service quality
management (Kurniawan et al., 2017). They utilized the Fodness & Murray theory regarding the
accurate scale to measure SHIA service quality by using the servqual method and Kano Model
approach. Airport management at SHIA should focus on the improved operating system of the
people mover system related to the attributes of punctuality, free of charge, status information
about the schedule, headway, and safety.
There are six structural factors that provide a meaningful multi-item measurement model
for perceived ASQ at Guarulhos International Airport, in Brazil. Those are 1) check-in (courtesy
and helpfulness of check-in staff, check-in process efficiency, wait-time at check-in), 2) security
(feeling of being safe and secure, courtesy and helpfulness of security staff, thoroughness of
security screening, wait-time at security checkpoints), 3) convenience (availability and quality of
stores, availability of banks/ATM/exchange, availability and quality of food facilities), 4)
ambience (cleanliness of airport facilities, thermal comfort, acoustic comfort) 5) basic facilities
(cleanliness of washroom/toilets, availability of washroom/toilets, departure lounge comfortand),
4) mobility (walking distance inside terminal, wayfinding, flight information) (Bezerra &
Gomes, 2016).
This study uses a five-dimensional approach to service quality. Service quality is a
focused evaluation that reflects the customer’s perception of: reliability, assurance,
responsiveness, empathy, and tangibles. Satisfaction, on the other hand, is more inclusive: it is
influenced by perceptions of service quality, product quality, and price as well as situational
factors and personal factors. Definitions of service quality dimension:
1. Reliability: ability to perform the promised service dependably and accurately
2. Responsiveness: willingness to help customers and provide prompt service
3. Assurance: knowledge and courtesy of employees and their ability to inspire trust and confidence
4. Empathy: caring, individualized attention the firm provides its customers.
5. Tangibles: appearance of physical facilities, equipment, personnel, and communication materials (Zeithaml
et al., 2013).
The service quality model provided by the airport consists of tangibility such as clues that
can be understood by customers as customers coming from different countries speaking different
languages, airport layouts, including immigration sections. The layout or layout includes open
office space and closed office space (Nuraida, 2014), and also tenants from airports such as food
and beverage, rental car services or retail stores. Reliability is more about the accuracy of the
Academy of Marketing Studies Journal Volume 23, Issue 4, 2019
5 1528-2678-23-4-235
process, the responsibility of the person, the time of departure and arrival, as well as the time to
conduct a re-check and baggage delivery (baggage delivery). Empathy, assurance and
responsiveness are more about the attitude and behavior of airport employees. The capability of
airport employees in dealing with customers is very important, it takes a polite and friendly
attitude, an interesting and thoughtful personality, and adequate knowledge associated with the
airport (Nuraida et al., 2015).
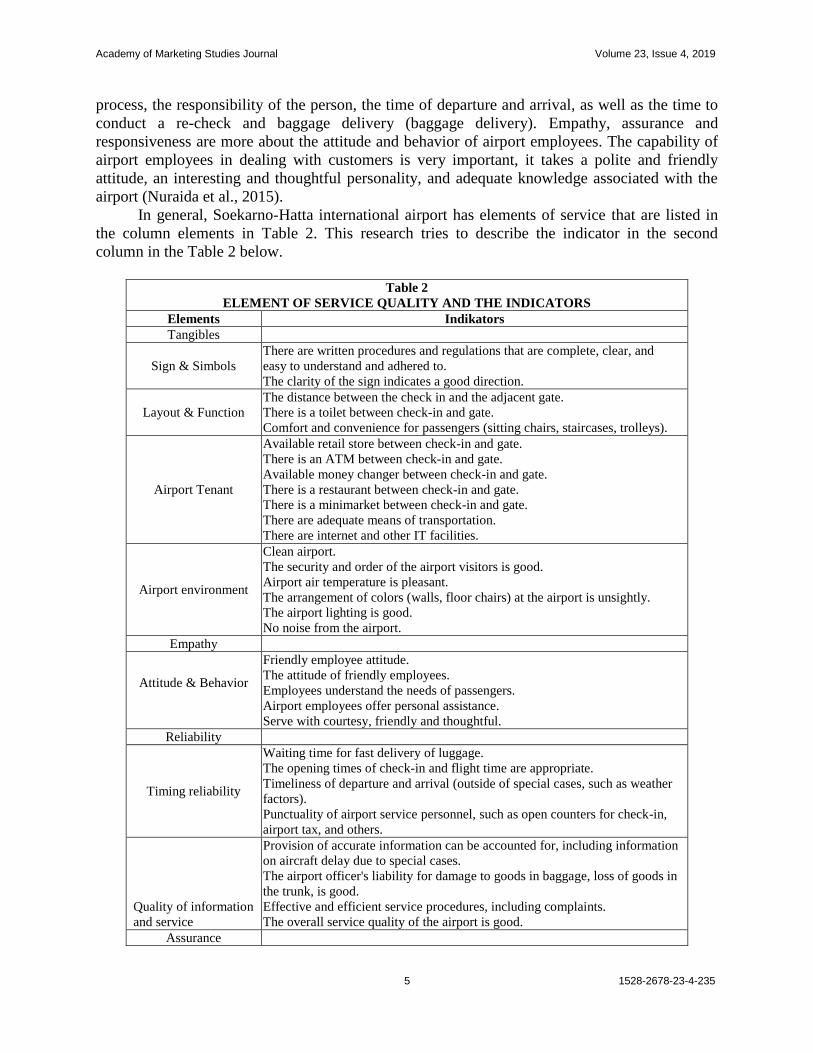
In general, Soekarno-Hatta international airport has elements of service that are listed in
the column elements in Table 2. This research tries to describe the indicator in the second
column in the Table 2 below.
Table 2
ELEMENT OF SERVICE QUALITY AND THE INDICATORS
Elements Indikators
Tangibles
Sign & Simbols
There are written procedures and regulations that are complete, clear, and
easy to understand and adhered to.
The clarity of the sign indicates a good direction.
Layout & Function
The distance between the check in and the adjacent gate.
There is a toilet between check-in and gate.
Comfort and convenience for passengers (sitting chairs, staircases, trolleys).
Airport Tenant
Available retail store between check-in and gate.
There is an ATM between check-in and gate.
Available money changer between check-in and gate.
There is a restaurant between check-in and gate.
There is a minimarket between check-in and gate.
There are adequate means of transportation.
There are internet and other IT facilities.
Airport environment
Clean airport.
The security and order of the airport visitors is good.
Airport air temperature is pleasant.
The arrangement of colors (walls, floor chairs) at the airport is unsightly.
The airport lighting is good.
No noise from the airport.
Empathy
Attitude & Behavior
Friendly employee attitude.
The attitude of friendly employees.
Employees understand the needs of passengers.
Airport employees offer personal assistance.
Serve with courtesy, friendly and thoughtful.
Reliability
Timing reliability
Waiting time for fast delivery of luggage.
The opening times of check-in and flight time are appropriate.
Timeliness of departure and arrival (outside of special cases, such as weather
factors).
Punctuality of airport service personnel, such as open counters for check-in,
airport tax, and others.
Quality of information
and service
Provision of accurate information can be accounted for, including information
on aircraft delay due to special cases.
The airport officer's liability for damage to goods in baggage, loss of goods in
the trunk, is good.
Effective and efficient service procedures, including complaints.
The overall service quality of the airport is good.
Assurance

Academy of Marketing Studies Journal Volume 23, Issue 4, 2019
6 1528-2678-23-4-235
Attitude & Behavior
Airport staffs have the appropriate attitude and work attitude in serving the
passengers.
Expertise
Airport staffs have knowledge of doing their job.
Airport staffs are skilled in doing their work.
Airport staffs have the ability to do their job.
Responsiveness
Attitude & Behavior
The airport staff took the initiative to help passengers who encountered
difficulties / problems.
The airport staff is quick and responsive to respond to the needs of
passengers.
Airport members are on site when needed.
Source : Authors, 2019
RESEARCH METHODS
This research uses quantitative methods (AMOS Confirmation Analysis and Structural
Equation Modeling), complemented by qualitative methods of interview and observation to
complete the analysis.
“Quantitative research involves strategy of inquiry such as experimental and surveys, and collect data on
predertemined instruments that yield statistical data” (Creswell, 2009).
Data collection techniques performed are the following.
1. Primary data through interviews direct observation and questionnaires in the Techniques
Interviews: in this writing interview techniques are required to know, track and collect information about
services provided by the airport. The interview was conducted to 50 respondents, consisting of 10 people
from tour travel, and 40 people who often use the airport at least 3 times.
2. Questionnaires were distributed to 300 respondents who had visited the airports, but only 133 responded.
3. If we develop a model with 20 parameters, then the minimum sample should be used are as many as 100
samples. (Ferdinand, 2014).
4. This means that the number of respondents must be collected at least 5 times the number of indicators most
in each construct. Questions in the questionnaire consisted of 5 constructs (Tangibility, Emphaty,
Reliability, Assurance and Responsiveness). The highest indicator is in Reliability of 8 indicators. Thus the
sample of respondents expected to enter is amounted to 5 times 8 indicators that is as many as 40 samples.
In addition, questions were also asked about the level of satisfaction of respondents who have visited the
airport. Questions in the questionnaire used the Likert scale 1-5, providing closed questions to the
respondents. Data were processed with the SPSS program and the AMOS confirmatory factor analysis for
the validity and reliability test. The influence of the construct whose model is fit views its effect on
satisfaction by using Structural Equation Modeling.
5. Secondary data from the PT Angkasa Pura website, literature study and previous written results.
RESEARCH MODEL
The research model is as follows.

Academy of Marketing Studies Journal Volume 23, Issue 4, 2019
7 1528-2678-23-4-235
Source: Authors, 2019
FIGURE 2
RESEARCH MODEL
Service quality consist of tangibility, empathy, reliability, assurance, and responsiveness,
which affect the satisfaction of passengers at Soekarno-Hatta international airport in figure 2.
Variable Operationalization
Operationalization of variables consists of the following.
Table 3
CONSTRUCTS AND INDICATORS OF SERVICE QUALITY
TANGIBILITY: airport physical facilities.
MAIN FACILITIES
X1
X2
X3
X4
The distance between the check-in and the adjacent gate.
Toilet between check-in and gate.
Escalator.
Adequate transportation facilities.
SUPPORTING FACILITIES
X5
X6
X7
X8
X9
Retail store between check-in and gate.
ATM between check-in and gate.
Money changer between check-in and gate.
Restoran between check-in and gate.
Minimarket between check-in and gate.
INFRASTRUCTURE
X10
X11
X12
X13
X14
X15
Trolleys.
Waiting chair.
Television.
The signpost is clear.
The procedures and regulations are complete, clear, and easy to understand.
Internet and IT facilities.
X16 Maintain cleanliness, security and order.
AIRPORT ENVIRONMENT
X17
X18
X19
X20
Airport air temperature is pleasant.
Airport color arrangement is good.
The airport lighting is good.
No airport noise.
EMPHATY: ability to understand / pay attention to consumers.
X21
X22
Employees are friendly, polite, thoughtful and friendly.
Employees understand the needs of passengers by offering personal Assistance.

Academy of Marketing Studies Journal Volume 23, Issue 4, 2019
8 1528-2678-23-4-235
X23
Employees build good relationships with passengers
RELIABILITY: provide service and services promised accurately and accountable
X24
X25
X26
X27
Waiting for fast luggage
Check in and flight times accordingly
Departures and arrivals (excluding special cases, such as weather factors)
Open counter for check-in, airport tax, etc.
X28
X29
X30
X31
Provision of accurate information, can be justified
Responsibility for goods damage, loss of goods
Effective-efficient procedures, including complaints
The overall service is good
ASSURANCE: knowledge, skills, abilities, attitudes, good manners shown by airport officials, airline
pilots and flight attendants provide assurance that anyone who buys services at the airport will be
handled by the right people (keeping consumer confidence).
X32
X33
X34
X35
The knowledge of the airport staff is good
The capability of the airport staff is good
The skill of the airport staff is good
The attitude and behavior of the airport staff is good
RESPONSIVENESS: desire and speed help proportionally in providing the right services and services.
X36
X37
X38
Airport staff took the initiative to help passengers who are confused, or face problems
The airport staff is quick and responsive to passenger needs
Airport staff are on site when needed
SATISFACTION: the perception of service quality is equal to or greater than expected.
X39
X40
X41
Election of airport as departure airport to go abroad
Refer the airport as a departure airport to colleagues
Want to come again to Soekarno-Hatta airport
Source: Authors, 2019
Based on Table 3 above, this article tries to develop indicators that can influence each
construct of service quality. The TERAR construct cannot be directly measured/cannot be
directly observed, so it needs to be manifested/measured/observed with indicators embodied in
the form of questions with a Likert scale of 1-5. So the hypotheses are as follows.
H1: Tangibility is determined by the distance check-in and gate, toilet, staircase, transportation, retail
store, ATM, money changer, restaurant, mini market, trolley, waiting chair, TV, directions, procedures, IT facilities,
air temperature, color, lighting, sound.
H2: Emphaty is determined by friendly employees-good manners-wisdom, understanding passenger needs,
fostering good relationships with passengers.
H3: Reliability is determined by time of luggage waiting, check-in and flight times, departure and arrival,
open counter for check in, accurate information, responsibility for goods, effective and efficient procedures, overall
service.
H4: Assurance is determined by the knowledge, skills, behaviour, attitude of the airport staff.
H5: Responsiveness is determined by the airport staff who take the initiative, being sprightly responsive
response to the needs of passengers, and they are there when needed.
H6: Satisfaction is determined by the selection of the airport as a departure airport, referring to the nearest
person or colleagues, wanting to come to the airport with them.
H7: Satisfaction is determined by tangibility, empathy, reliability, assurance and responsiveness.

Academy of Marketing Studies Journal Volume 23, Issue 4, 2019
9 1528-2678-23-4-235
The indicators in each construct namely tangibility, empathy, reliability, assurance, and
responsiveness, will be tested to determine which of them becomes part of each construct. So
that it can be known which hypothesis will be accepted and which will be rejected. Then we will
find out which passenger perceptions of airport service quality can improve passenger
satisfaction.
RESULTS
This research collects primary data through questionnaires, interviews and direct
observation.
Questionnaire Results
The questionnaires were obtained from 133 respondents. All 133 respondents are
Indonesian citizens.
Confirmatory analysis of tangibility, emphaty, reliability, assurance and responsiveness
In conducting a confirmatory analysis is this research used a minimum of 0.6 factor
loading (Sharma, 1996). There are 5 constructs to be tested (tangibility, emphaty, reliability,
assurance and responsiveness) of each airport, with a total of 38 indicators (X1-X38). In the
tangibility category there are 20 indicators (X1-X20), for emphaty there are 3 indicators (X21-
X23), for reliability there are 8 indicators, for assurance there are 4 indicators, and for
responsiveness there are 3 indicators. Confirmatory analysis is performed several times until all
indicators have a loading factor of ≥0.6. Each indicator starts from X1.
To see suitability of the model, the author uses 8 indexes taken from Ferdinand (2014), as
follows in Table 4.
Table 4
GOODNESS-OF-FIT INDICES
No Goodness of fit index Cut-off value
1 Chi-Square Expected low
2 Probabilities ≥ 0.01
3 TLI (Tucker Lewis Index) ≥ 0.95
4 RMSEA (Root Mean Square Error of Approximation) ≤ 0.08
5 RFI (Relative Fit Index) ≥ 0.95
6 NFI (Normed Fit Index) ≥ 0.95
7 CFI (Comparative Fit Index) ≥ 0.95
8 IFI (Incremental Fit Index) Mendekati 1
The results of confirmatory analysis of each tangibility construct, empathy, reliability,
assurance and responsiveness of Soekarno-Hatta International Airport will be explained as
follows.

Academy of Marketing Studies Journal Volume 23, Issue 4, 2019
10 1528-2678-23-4-235
FIGURE 3
TANGIBILITY OF SOEKARNO-HATTA INTERNATIONAL AIRPORT (X1, X2,
X3, X4, X5, X6, X7, X8, X, 9, X10, X11, X12, X13, X14, X15, X16, X17, X18, X19, X20)
FIGURE 4
TANGIBILITY OF SOEKARNO-HATTA INTERNATIONAL AIRPORT (X10,
X11, X12, X13, X14, X15)
From the figure 3 & figure 4 above, there are 14 indicators that are discarded. This is also
indicated by standardized regression weights below in Table 5.

Academy of Marketing Studies Journal Volume 23, Issue 4, 2019
11 1528-2678-23-4-235
Table 5
STANDARDIZED REGRESSION WEIGHTS:
(GROUP NUMBER 1-DEFAULT MODEL)
Estimate
X15 <--- TANGIBILITY 0.700
X14 <--- TANGIBILITY 0.732
X13 <--- TANGIBILITY 0.758
X12 <--- TANGIBILITY 0.815
X11 <--- TANGIBILITY 0.852
X10 <--- TANGIBILITY 0.696
With a loading factor of more than 0.6, the indicators X10, X11, X12, X13, X14 and X15
really explain / reflect / manifest / measure the construct of tangibility of Soekarno-Hatta in
Table 6.
Table 6
VARIANCES (GROUP NUMBER 1-DEFAULT MODEL)
Estimate S.E. C.R. P Label
TANGIBILITY 1.000
E15 0.506 0.071 7.134 *** par_13
E14 0.304 0.044 6.836 *** par_14
E13 0.228 0.034 6.722 *** par_15
E12 0.188 0.031 6.055 *** par_16
E11 0.176 0.032 5.436 *** par_17
E10 0.247 0.035 7.130 *** par_18
The error here shows reliability (consistency, stability) as indicated by the amount of
error. Because the error indicators X10, X11, X12, X13, X14 to X15 are significant, it shows a
small error so that it can be said to be stable / consistent.
FIGURE 5
EMPHATY OF SOEKARNO-HATTA INTERNATIONAL AIRPORT
(X1, X2, X3 ARE X21, X22, X23)

Academy of Marketing Studies Journal Volume 23, Issue 4, 2019
12 1528-2678-23-4-235
From the figure 5 above, there are no discarded indicators. This is also indicated by
standardized regression weights below in Table 7.
TABLE 7
Standardized Regression Weights: (Group number
1-Default model) (X1, X2, X3 are X21, X22, X23)
Estimate
X1 <--- EMPHATY 0.878
X2 <--- EMPHATY 0.926
X3 <--- EMPHATY 0.923
With a loading factor of more than 0.6, the X21, X22 and X23 indicators really explain /
reflect / manifest / measure the Soekarno-Hatta emphaty construct in Table 8.
TABLE 8
VARIANCES: (GROUP NUMBER 1-DEFAULT MODEL)
(E1, E2, E3 ARE E21, E22, E23)
Estimate S.E. C.R. P Label
EMPHATY 1.000
E1 0.298 0.048 6.232 *** par_6
E2 0.181 0.041 4.366 *** par_7
E3 0.158 0.035 4.527 *** par_8
The error here shows reliability (consistency, stability) as indicated by the amount of
error. Because X11, X12 and X13 indicator errors are significant, it shows a small error so that it
can be said to be stable / consistent.
FIGURE 6
RELIABILITY OF SOEKARNO-HATTA INTERNATIONAL AIRPORT
(X1,X2,X3,X4,X5,X6,X7,X8, ARE X24,X25,X26,X27,X28,X29,X30,X31)

Academy of Marketing Studies Journal Volume 23, Issue 4, 2019
13 1528-2678-23-4-235
From the figure 6 above, there are 4 indicators that are discarded. This is also indicated
by standardized regression weights below in Table 9.
TABLE 9
STANDARDIZED REGRESSION WEIGHTS: (GROUP NUMBER 1-
DEFAULT MODEL)
(X1,X2,X3,X4,X5,X6,X7,X8 ARE X24,X25,X26,X27,X28,X29,X30,X31)
Estimate
X1 <--- RELIABILITY 0.783
X2 <--- RELIABILITY 0.810
X3 <--- RELIABILITY 0.892
X4 <--- RELIABILITY 0.852
With a loading factor of more than 0.6, the X24, X25, X26 and X27 indicators really
explain / reflect / manifest / measure the construct of Soekarno-Hatta reliability in Table 10.
TABLE 10
Variances: (Group number 1-Default model)
(E1,E2,E3,E4,E5,E6,E7,E8 are E24,E25,E26,E27,E28,E29,E30,E31)
Estimate S.E. C.R. P Label
RELIABILITY 1.000
E1 0.631 0.092 6.843 *** par_8
E2 0.316 0.050 6.347 *** par_9
E3 0.173 0.039 4.477 *** par_10
E4 0.208 0.038 5.495 *** par_11
The error here shows reliability (consistency, stability) as indicated by the amount of
error. Because the X24, X25, X26 and X27 error indicators are significant, it shows a small error
so that it can be said to be stable / consistent.
FIGURE 7
ASSURANCE OF SOEKARNO-HATTA INTERNATIONAL AIRPORT (X1, X2, X3, X4,
X5 ARE X32, X33, X34, X35)

Academy of Marketing Studies Journal Volume 23, Issue 4, 2019
14 1528-2678-23-4-235
From the figure 7 above, no indicator is discarded. This is also indicated by standardized
regression weights below in Table 11.
Table 11
Standardized Regression Weights: (Group number 1-Default model)
(X1, X2, X3, X4, X5 are X32, X33, X34, X35)
Estimate
X1 <--- ASSURANCE 0.922
X2 <--- ASSURANCE 0.956
X3 <--- ASSURANCE 0.929
X4 <--- ASSURANCE 0.832
With a loading factor of more than 0.6, the indicators X32, X33, X34, and X35 really
explain / reflect / manifest / measure the assurance construct of Soekarno-Hatta in Table 12.
Table 12
VARIANCES: (GROUP NUMBER 1-DEFAULT MODEL)
(E1, E2, E3, E4, E5 ARE E32, E33, E34, E35)
Estimate S.E. C.R. P Label
ASSURANCE 1.000
E1 0.177 0.029 6.144 *** par_8
E2 0.075 0.018 4.101 *** par_9
E3 0.115 0.021 5.437 *** par_10
E4 0.276 0.038 7.242 *** par_11
The error here shows reliability (consistency, stability) as indicated by the amount of
error. Because X32, X33, X34, and X35 indicator errors are significant, it shows a small error so
that it can be said to be stable / consistent.
FIGURE 8
RESPONSIVENESS OF SOEKARNO-HATTA INTERNATIONAL AIRPORT (X1, X2,
X3 ARE X36, X37, X38)
From the figure 8 above, no indicator is discarded. This is also indicated by standardized
regression weights below in Table 13.

Academy of Marketing Studies Journal Volume 23, Issue 4, 2019
15 1528-2678-23-4-235
Table 13
STANDARDIZED REGRESSION WEIGHTS: (GROUP NUMBER 1
- DEFAULT MODEL) (X1, X2, X3 ARE X36, X37, X38)
Estimate
X1 <--- RESPONSIVENESS 1.000
X2 <--- RESPONSIVENESS 0.992
X3 <--- RESPONSIVENESS 0.992
With a loading factor of more than 0.6, the indicators X36, X37, and X38 really explain /
reflect / manifest / measure the construct of the Soekarno-Hatta responsiveness in Table 14.
Table 14
VARIANCES: (GROUP NUMBER 1 - DEFAULT MODEL) (E1, E2,
E3 ARE E36, E37, E38)
Estimate S.E. C.R. P Label
RESPONSIVENESS 1.000
E1 0.000 0.001 -0.079 0.937 par_6
E2 0.015 0.002 6.640 *** par_7
E3 0.015 0.002 6.640 *** par_8
The error here shows reliability (consistency, stability) as indicated by the amount of
error. Error X36 indicator is not significant because 0.937> α 10%. X37 and X38 indicator errors
are significant, so it shows a small error so that it can be said to be stable / consistent.
FIGURE 9
SATISFACTION OF SOEKARNO-HATTA INTERNATIONAL AIRPORT (X1, X2, X3
ARE X39, X40, X41)
From the figure 9 above, no indicator is discarded. This is also indicated by standardized
regression weights below in Table 15.
TABLE 15
STANDARDIZED REGRESSION WEIGHTS: (GROUP
NUMBER 1 - DEFAULT MODEL) (X1, X2, X3 are X39, X40, X41)
Estimate
X1 <--- SATISFACTION 0.922
X2 <--- SATISFACTION 0.651
X3 <--- SATISFACTION 0.699

Academy of Marketing Studies Journal Volume 23, Issue 4, 2019
16 1528-2678-23-4-235
With a loading factor of more than 0.6, the indicators X39, X40, and X41 really explain /
reflect / manifest / measure the construct of the Soekarno-Hatta responsiveness in Table 16.
Table 16
VARIANCES: (GROUP NUMBER 1 - DEFAULT MODEL) (E1,
E2, E3 ARE E39, E40, E41)
Estimate S.E. C.R. P Label
SATISFACTION 1.000
E1 0.175 0.184 0.952 0.341 par_6
E2 0.438 0.101 4.324 *** par_7
E3 0.346 0.093 3.707 *** par_8
The error here shows reliability (consistency, stability) as indicated by the amount of
error. The X39 indicator error is not significant because 0.341> α 10%. X40 and X41 indicator
errors are significant, so it shows a small error so that it can be said to be stable / consistent.
Based on AMOS confirmatory analysis results, all hypotheses 1 to hypothesis 6 are
accepted because each construct has an indicator with a loading factor of ≥0.6. The summary of
the confirmatory results of each construct of tangibility, emphaty, reliability, assurance and
responsiveness of the airport and its indicators are as follows in Table 17.
Table 17
FINAL RESULT OF CONFIRMATION ANALYSIS TERAR FOR SOEKARNO-HATTA
INTERNATIONAL AIRPORT
Analysis of
constructs
Indicator of the construct
discarded due to loading
factor <0.6
Indicator of the
construct received due
to loading factor ≥ 0.6
Compared with cut-
off value (fit model)
and reliability test
Tangibility
(hypothesis 1)
11 discarded :
X1= Short distance between
the check-in and the adjacent
gate
X2= The toilet between
check-in and gate
X3= Escalator
X5= The retail store between
check-in and gate
X6= ATM between check in
and gate
X7= Money changer between
check-in and gate
X8= Restaurant between
check-in and gate
X9= Minimarket between
check-in and gate
X17= Airport air temperature
is pleasant
X18= Airport color
arrangement is good
X20= No airport noise
X4 = Adequate
transportation facilities
X10 = Trolley
X11 = Waiting Chairs
X12 = Television
X13 = The signposts are
clear
X14 = The procedures
and regulations are
complete, clear, and easy
to understand
X15 = Internet and IT
facilities
X16 = Maintain
cleanliness, security and
order
X19 = The airport
lighting is good
Only IFI is close to 1
(0.911)
Emphaty
(hypothesis 2)
None X21 = Airport staff are
friendly, polite, wise,
friendly
X22 = Airport staff
Only IFI is close to 1
(0.926)

Academy of Marketing Studies Journal Volume 23, Issue 4, 2019
17 1528-2678-23-4-235
understands the needs of
passengers by offering
personal assistance
X23 = Airport staff
maintain good
relationships with
passengers
Reliability
(hypothesis 3)
3 discarded :
X28 = Provision of accurate,
reliable information
X30 = Effective-efficient
procedure, including
complaints
X31 = Good overall service
X24 = Waiting for quick
luggage
X25 = Check in and
flight time accordingly
X26 = Departure and
arrival (excluding special
cases, such as weather
factors)
X27 = Open counter for
check-in, airport tax, etc.
X29 = Responsibility for
damage and loss of
goods
Only IFI is close to 1
(0.921)
Assurance
(hypothesis 4)
None X32 = Knowledge of
airport staff is good
X33 = Good airport staff
capability
X34 = Good airport staff
skills
X35 = The attitude and
behavior of airport staff
are good
Nothing is fit with cut-
off value
Responsiveness
(hypothesis 5)
None X36 = Airport staff took
the initiative to help
passengers who are
confused, or face
problems
X37 = Spry and fast
airport staff responsive
to passenger needs
X38 = Airport staff
presence when needed
Fit cut-off value :
probabilities,
TLI,RFI,NFI,CFI,IFI
Satisfaction
(hypothesis 6)
None X39 = Selection of
airport as departure
airport to go abroad
X40 = Refer the airport
as a departure airport to
colleagues
X41 = Coming back to
Soekarno-Hatta airport
There is no
corresponding cut-off
value. X39 is not
reliable (error 0.341>
α 10% so it is
discarded.
Source: Authors, 2019
Of the 8 indices used, the index approaching the fit model for the TERAR airport
independent variable Soekarno-Hatta is responsiveness. Hence hypothesis 7 is accepted with the
adjustment that is only responsivenss that affect the satisfaction, whereas tangibility, empathy,
reliability and assurance can not be seen as influential on satisfaction because it does not meet
the cut off value.

Academy of Marketing Studies Journal Volume 23, Issue 4, 2019
18 1528-2678-23-4-235
Structural Equation Modelling
FIGURE 10
STRUCTURAL EQUATION MODELLING OF SOEKARNO-HATTA
INTERNATIONAL AIRPORT
Table 18
SQUARED MULTIPLE CORRELATIONS:
(GROUP NUMBER 1 - DEFAULT MODEL)
Estimate
SATISFACTION 0.445
X41 0.424
X40 0.629
X36 1.000
X37 0.985
X38 0.985
Table 19
REGRESSION WEIGHTS: (GROUP NUMBER 1 - DEFAULT MODEL)
Estimate S.E. C.R. P Label
SATISFACTION <--- RESPONSIVENESS 0.895 0.177 5.042 *** par_3
X38 <--- RESPONSIVENESS 1.000
X37 <--- RESPONSIVENESS 0.995 0.017 57.903 *** par_1
X36 <--- RESPONSIVENESS 1.005 0.012 81.933 *** par_2
X40 <--- SATISFACTION 0.493 0.080 6.145 *** par_4
X41 <--- SATISFACTION 0.372 0.061 6.145 *** par_5
Satisfaction = 0.667 responsiveness + Z1. From the figure 10, Table 18 and Table 19
above can be known from the column probability responsiveness that there is a positive
relationship with satisfaction. Signification means there is consistency with the probability of
obtaining a critical ratio as large as 5.042 in absolute value is less than 0.001. If respondents rate
high on responsiveness, it will also consistently rate high on satisfaction, and vice versa. From
Table 7 it can be seen from estimate responsiveness column to satisfaction is 0,895. This means
that if responsiveness rose 10%, it will result in increased satisfaction of 10% x 0.895 = 8.95%.

Academy of Marketing Studies Journal Volume 23, Issue 4, 2019
19 1528-2678-23-4-235
Interviews and Observations
The interview was conducted with 50 people who have used the services of Soekarno-
Hatta international airport. Direct observation was made by the author at the location of the
airport. Based on the results of the interview, passengers considered the poor service quality as
follows.
1. Tangibility: the safety factor of passenger goods is felt to be less than satisfying, be it loss or damage.
Cleanliness is poorly cared for. The lack of the order factor is caused by the arbritary behavior of
Indonesian people and the airport is less assertive in ordering and controlling it. This certainly requires the
procedures, regulations and addition of airport employees.
2. Responsiveness is less than satisfyng when employees are not in place when needed.
Based on observations of the airport, the bad aspects are tangibility either in terms of
cleanliness, neatness, completeness or misuse of facilities. Responsiveness of airport personnel is
below standard, which is captured by cameras in the absence of employees at work during office
hours.
DISCUSSION
As mentioned earlier, the main purpose of this paper is to find out the model of service
quality and its effect on passenger satisfaction. The model is illustrated in Figure 8 above. Based
on the AMOS confirmatory analysis and Structural Equation Modeling, valid indicators are
found to influence each construct of tangibility, emphaty, reliability, assurance, responsiveness
and satisfaction because it has a loading factor> 0.6, and each indicator is reliable because it has
an error <α 10 %. Based on the results above, the service quality model and its impact on
passenger satisfaction are as follows in figure 11.

Academy of Marketing Studies Journal Volume 23, Issue 4, 2019
20 1528-2678-23-4-235
FIGURE 11
SERVICE QUALITY MODEL AND ITS IMPACT ON PASSENGER SATISFACTION
In Table 20 below, the valid indicators of each construct of service quality in the model
are accompanied by explanations from interviews with 50 passengers on best and worst
impressions of airports, complimented by field observations.
Table 20
EXPLANATION OF SERVICE QUALITY MODEL AND ITS IMPACT ON PASSENGER
SATISFACTION
Construct Indicators (loading factor > 0,6 and error <
10%)
Explanation (from interviews and
observations)
Tangibility X4 = Adequate transportation facilities Bus, train.
X10 = Trolleys Adequate, available in place, in good
working order.
X11 = Waiting chair Adequate, in good condition.
X12 = Television Operating well.
X13 = The signposts are clear Arrows, airport lay out, airport map.
X14 = The procedures and regulations are
complete, clear, and easy to understand
It does not take too long to be
understood and implemented.
X15 = Internet and IT facilities Adequate, available and operating
well as needed.
X16 = Maintain cleanliness, security and order Cleanliness: the dump is quite

Academy of Marketing Studies Journal Volume 23, Issue 4, 2019
21 1528-2678-23-4-235
adequate, the bathroom is clean and
not smelly, the outside of the
bathroom area does not smell, the
visitors and passengers throw the
garbage in its place, not spitting
haphazardly
Order: visitors and tenant employees
do not abuse the use of airport
facilities, as seats are used as they
should, do not use a few chairs to
sleep so that other passengers can sit
down.
Security of goods in the cabin and
luggage: laptops, luggage, expensive
goods, etc.
X19 = The airport lighting is good Adequate
Emphaty X21 = Airport staff are friendly, polite, wise,
friendly
Good manners, polite behavior,
patient, smiling face.
X22 = Airport staff understands the needs of
passengers by offering personal assistance
For passengers who need
information, find difficulties, help
find solutions.
X23 = Airport staff maintain good relationships
with passengers
Good communication, passengers
feel comfortable served.
Reliability
X24 = Waiting for quick luggage Goods can be immediately taken by
the owner.
X25 = Check-in and flight time accordingly If there is a time difference is not too
long, unless there is a special case
such as weather does not support.
X26 = Departure and arrival (excluding special
cases, such as weather factors)
On schedule.
X27 = Open counter for check-in, airport tax,
etc
On schedule.
X29 = Responsibility for damage and loss of
goods
In the event of loss of goods, such as
suitcases, can be handled and
founded in good condition.
Assurance X32 = Knowledge of airport staff is good X33
= Capability of airport staff is good X34 =
Skills of airport staff is good
X35 = Attitude and behavior of airport staff are
good
Work is done properly as it should
be, every question can be answered,
every problem can be solved, service
according to expectations.
Responsive
ness
X36 = Airport staff took the initiative to help
passengers who are confused, or face problems
Unsolicited airport staff willing to
help with no strings attached.
X37 = Spry and fast airport staff responsive to
passenger needs
Fast and effective movement
according to the needs of passengers.
X38 = Airport staff are on site when needed The existence of the office is adjusted
to the shift schedule of each staff;
there is no vacancy at the turn of the
shift.
Satisfaction X40 = Refer the airport as a departure airport to
colleagues
TERAR airport makes passengers
feel at home and comfortable.
X41 = Coming back to Soekarno-Hatta airport
Source : Authors, 2019

Academy of Marketing Studies Journal Volume 23, Issue 4, 2019
22 1528-2678-23-4-235
Quantitative methods with confirmatory and SEM analyzes are used to measure how the
respondents' perceptions of statistical patterns of service quality and measure the satisfaction
factor for the airport. After being tested by confirmatory analysis, it is known which indicator is
part of the construct. The interviews and observations are very useful for completing the analysis
of the model and provide further suggestions to PT Angkasa Pura.
Based on the discussion above, there are managerial implications of this study, especially
for PT Angkasa Pura, as follows.
1. Increase responsiveness in order to increase passenger satisfaction.
2. Generally, improve the CSI (Customers Satisfaction Index), Soekarno Hatta Airport needs to improve the
overall TERAR aspect in order to attract foreign tourists and improve the image of Indonesia. It is
necessary to concider the reliability concerning the process, people and service products.
3. Maintain and reflect local culture to show Indonesia's uniqueness as a country rich in culture and customs,
being different and not owned by other countries, to attract mainly foreign tourists to come to Indonesia.
4. More technical suggestions are as follows:
a. Increase the number of employees to facilitate boarding;
b. Fix the lay out to be more comfortable, improve visitor and passenger orders, and improve tidiness and
cleanliness;
c. Seek counseling for improving the level of HR services, such as being in place when needed in working
hours;
d. Improve airport security;
e. Clarify and multiply airport bus directions as well as providing cooler air temperatures;
f. Utilize, improve, and maintain facilities (facilities and infrastructure), such as lighting, computers, wifi and
a big screen;
g. Reduce misuse of facilities by airport staff, visitors, tenants;
h. Improve cleanliness, discipline and control visitors in maintaining cleanliness
i. Increase seat capacity and parking information to be more obtainable (flight schedule in tv screen, etc);
j. Seek a one-stop-sites site;
k. Expand the size and facilities of the airport so that no unloaded overloads / overloads occur
l. Improve the safety of transportation facilities
m. Improve security requirements for airlines. For example:
1) Schedule to fly out of schedule (as happened on Air Asia QZ 8501 which crashed and sank in the Java Sea
on December 28, 2014).
2) Requirements and regulations regarding airworthiness of aircraft, such as maintenance (like Lion air flight
JT 610 has crashed into the sea on October 29, 2018 due to a technical problem) of aircraft, or age of
aircraft.
CONCLUSIONS
This paper has presented a model of airport service quality after the validity and
reliability test. It can bee seen which indicators affect each construct, and whether each construct
model is seen as fit or not. The fit construct model determines that satisfaction lies in
responsiveness only. An improvement of responsiveness of 10% had a major impact on 8.95%
increase in satisfaction. This indicates that all 133 respondents who are all Indonesians consider
that responsiveness is the most important thing because it provides a sense of comfort in terms of
the airport serving the needs and desires of consumers quickly and proportionately and in
providing services and services appropriately. In this case it takes the initiative of airport staff to
help passengers who are confused or get into trouble, being swift and quick to respond to
passenger needs, and to have airport staff is in place when needed. Regarding tangibility,
respondents certainly consider it is important, but still less important than responsiveness.

Academy of Marketing Studies Journal Volume 23, Issue 4, 2019
23 1528-2678-23-4-235
Indonesians are accustomed to seeing inadequate infrastructure facilities that are less
concerned with their shortcomings. This model is derived from the facts found in the object of
research so that it will be suitable to be applied there. Thus, PT Angkasa Pura becomes more
aware of what indicators must be improved to improve each construct of service quality.
Although responsiveness affects and increases passenger satisfaction, it is better if all constructs
of service quality are also enhanced to provide a positive image for domestic and foreign
passengers to international airports located around Jakarta, as the capital city of Indonesia.
Finally this model will be useful for PT Angkasa Pura to increase the airport ranking from 3-stars
airport ranking become 4-stars airport ranking.
REFERENCE
ACI, A. (2014). Building Code Requirements for Structural Concrete. American Concrete Institute, Farmington
Hills, Michigan. 318-14.
Adisasmita, S.A. (2012). PASSENGER PERCEPTION ON AIRPORT TERMINAL FACILITIES
PERFORMANCE (Case Study: Soekarno-Hatta International Airport, Indonesia). International Journal of
Engineering & Technology IJET-IJENS. 12(02).
Bezerra, G.C.L., & Gomes, C.F. (2016). Measuring airport service quality: A multidimensional approach. Journal of
Air Transport Management, 53, 85-93.
Bogicevic, V., Yang, W., Bilgihan, A., & Bujisic, M. (2013). Airport service quality drivers of passenger
satisfaction. Tourism Review, 68(4), 3-18. http://www.worldairportawards.com/Awards_2013/top100.htm
Creswell, J.W. (2009). Research Design: Qualitative, Quantitative and Mixed Methods Approaches. Third Edition.
Thousand Oaks. CA: Sage Publications, Inc.
Ferdinand, (2014). Metode Penelitian Manajemen. BP Universitas Diponegoro. Semarang: 73.
Fodness, D., & Murray, B. (2007). Passengers' expectations of airport service quality. Journal of Services
Marketing, 21(7), 492-506.
George, B.P., Henthorne, T.L., & Panko, T.R. (2013). ASQual: Measuring Tourist Perceived Service Quality in An
Qirport Setting. International Journal of Business Excellence. 526-536.
Gillen, D. (2011). The evolution of airport ownership and governance. Journal of Air Transport Management, 17(1),
3-13.
IATA. (2015). Report on alternative fuels. Montreal (CA)-Geneva.
Kramer, L.S., Bothner, A., & Spiro, M. (2013). How airports measure customer service performance, 48.
Transportation Research Board.
Kurniawan, R., Sebhatu, S.P., & Davoudi, S. (2017). Passengers’ Perspective Toward Airport Service Quality
(ASQ) (Case Study at Soekarno-Hatta International Airport). In Journal of the Civil Engineering Forum
3(1), 21-32.
Nuraida, I. (2014). Manajemen Administrasi Perkantoran. Revision Edition, Kanisius. Yogyakarta: 163
Nuraida, I., Widajatun, V.W., & Danil, L. (2015). Kualitas Pelayanan dan Kepuasan Konsumen di Bandar Udara
Internasional Soekarno-Hatta. Research Report-Humanities and Social Science, 1.
Pantouvakis, A. (2010). The relative importance of service features in explaining customer satisfaction: A
comparison of measurement models. Managing Service Quality: An International Journal, 20(4), 366-387.
Park, J. & Jung, S.Y. (2011). Transfer passengers' perceptions of airport service quality: a case study of Incheon
international airport. International Business Research, 4(3), 75.
Rhoades, D.L., Waguespack Jr, B., & Young, S. (2000). Developing a quality index for US airports. Managing
Service Quality: An International Journal, 10(4), 257-262.
Shahin, A. (2006). SERVQUAL and Model of Service Quality Gaps: A Framework for Determining and
Prioritizing Critical Factors in Delivering Quality Services.
Sharma, S. (1996). Applied Multivariate Techniques. John Wiley & Sons. Inc, New York.
Zeithaml, V. Bitner, M.J., & Gremler, D.D. (2013). Services Marketing: Integrating Customer Focus Across the
Firm. 6 Th ed. Mc.Graw-Hill. Boston: 54
Zidarova, E.D., & Zografos, K.G. (2011). Measuring quality of service in airport passenger terminals.
Transportation Research Record, 2214(1), 69-76.