a multinomial model for comorbidity in england of
TRANSCRIPT

A Multinomial Model for Comorbidity in England of Longstanding CVD, Diabetes,
and Obesity
Dr Karyn Morrissey
Department of Geography & Planning, University of Liverpool.
Dr Ferran Espuny
Department of Geography & Planning, University of Liverpool.
Dr Paul Williamson
Department of Geography & Planning, University of Liverpool.
Abstract
From a public health perspective, previous research on comorbidity tends to have
focused on identifying the most prevalent groupings of illnesses that demonstrate
comorbidity, particularly among the elderly population, already in receipt of care.
In contrast, little attention has been paid to possible socio-economic factors
associated with increased rates of comorbidity or to the possibility of wider
unrevealed need. Given the known relationship between CVD, diabetes and
obesity and the strong socio-economic gradients in risk factors for each of the
three diseases as single morbidities, this paper uses the Health Survey for England
to examine the demographic and socio-economic determinants of each of the
seven disease combinations in the English population. Using a multinomial logistic
model, this research finds that gender is a significant predictor for all seven disease
combinations. However, gender was not as influential as individual age or socio-
economic profile. With regard to ethnicity, the black population presents a high
obesity, diabetes and diabetes-related comorbidity risk, whilst the Asian
population presents a high risk for diabetes and diabetes-related comorbidity but a
low risk for obesity and comorbidity. Across the seven disease combinations, risk
2
was lowest for those individuals with a high income (4 out of 7), in-work (4 out of
7), home owning (3 out of 7) and degree educated (3 out of 7). Finally, smokers
have a lower risk rate of obesity (and related) than ex-smokers relative to
individuals that never smoked (in all cases controlling for all other factors). The
important influence of socioeconomic factors has implications for the spatial
demand for services and the policy solutions adopted to tackle the increasing
prevalence of comorbidity.
1. Introduction
Of the estimated 57 million global deaths in 2008, 36 million (63%) were due to
non-communicable diseases (NCDs). Population growth and increased longevity
are leading to a rapid increase in the total number of middle-aged and older
adults, with a corresponding increase in the number of deaths caused by NCDs. In
developed countries cardiovascular disease (CVD), diabetes and obesity are major
contributors to the overall burden of chronic disease. In 2012, 48% of NCD deaths
were caused by CVD and diabetes was directly responsible for 3.5% of NCD deaths
(World Health Organisation, 2012). With regard to obesity, the WHO (2011)
estimates that approximately 1.5 billion of the global adult population are
overweight.
Along with an increased prevalence of CVD, diabetes and obesity as single
morbidities, there is a growing body of evidence that individuals are increasingly
experiencing two or more of these conditions (Sachdev et al., 2004; Valderas et al.,
2009). Comorbidity refers to one or more chronic diseases among people with an
index-disease (the primary disease of interest) (Gijsen et al., 2001; Valderas et al.,
2009; Congdon, 2010). Responding to increased rates of comorbidity and the
knowledge that comorbidity significantly increases mortality rates and decreases
functional status and quality of life, the study of comorbidity has increased over
the last decade (Islam et al., 2014). With regard to CVD, two of the major risk

3
factors are obesity and diabetes (Nicholls, 2013; Congdon, 2010), and the close link
between obesity and diabetes is well established (Balluz et al., 2008). Increases in
the prevalence of obesity are a major factor in the growth of diabetes (Congdon,
2010), whilst CVD is listed as the cause of death for 65% of persons with diabetes
(Congdon, 2010).
From a public health perspective, previous research into comorbidity tends to have
focused on identifying the most prevalent groupings of illnesses that demonstrate
comorbidity (Sachdev et al., 2004), particularly among the elderly population (see
for example research by Carey et al., 2013; Salive, 2013 Fontin et al., 2007;
Marengoni et al., 2011; Gijsen et al., 2001). Indeed, in compiling a literature review
on previous research on comorbidity it is difficult to find research that is not
limited to the elderly and conceptualises the need for research on comorbidity
within the context of the global aging population. However, such a focus ignores
the accepted empirical evidence that an individual’s health is the outcome of
multifaceted processes broader than age, genetics or initial health status alone
(Morrissey et al., 2013). Health clinicians, policymakers and researchers now
appreciate the role individual level factors have on physical health regardless of
age. As such, the multifactorial model of disease causation (Williams 2003; Shim
2002), whereby socio-economic circumstances in conjunction with demographic
and genetic factors are seen as the key determinants of individual health
outcomes, has become the dominant conceptual framework underlying the
analysis of ill health in the social sciences (Morrissey et al., 2013; Williams 2003;
Shim 2002).
Socioeconomic status influences health outcomes through a number of
mechanisms operating across an individual’s life course (Kavanagh et al., 2010). As
outlined by Kavanagh et al., (2010), childhood socio-economic circumstances may
influence childhood nutrition, behaviours and illness. Whilst in adult life, socio-

4
economic circumstances could influence biological risk factors through a range of
factors including health behaviours, psychosocial conditions and access and uptake
of health services. Indeed, the WHO (2005) estimates that at least 80% of
premature CVD and diabetes could be prevented through modifiable individual risk
factors whose prevalence are associated with socio-economic status (Kavanagh et
al., 2010) such as healthy diet, regular physical activity and no tobacco use. The
existence of this inverse relationship between socioeconomic status and the
incidence or mortality rates has been demonstrated for many health outcomes
(Zhang et al., 2011; Charlton et al, 2013), including and of particular interest to this
paper; CVD (Kavanagh et al., 2010), diabetes (Kavanagh et al., 2010) and obesity
(Procter et al., 2008) as single morbidities. Thus, similar to single morbidities, this
paper argues that co-morbidity is the result of complex interrelationships between
differing health conditions and shared demographic, socioeconomic and
environmental risk factors.
From a methodological perspective, the data used in this paper are based on a
nationally representative population sample, the Health Survey for England.
Research to date on co-morbidity has focused on clinical records; GP, community
care and hospital data (Charlton et al, 2013; Valderas et al., 2009; Mulle &
Vaccarino, 2013). However, clinical record based data is a source of revealed
preference data; only individuals who have actively sought medical attention are
included in these datasets. This overlooks those individuals who have co-
morbidities but have not sought medical attention. Research on health service
access has found a variety of reasons, closely linked to an individual’s socio-
economic circumstances, such as cost, opportunity cost of time spent away from
work or the home, distance and lack of transport that cause individuals not to
access health services even when they are ill (Joseph and Phillips, 1984;
McLafferty, 2003; Neng et al., 2012). Arguably it may be the characteristics and life
circumstances of individuals that are ill and have not sought medical attention that
5
are of most interest to public health research (Neng et al., 2012; Kavanagh et al.,
2010).
Previous research on revealed preferences has demonstrated a clear
socioeconomic gradient between CVD, diabetes and obesity outcomes as single
morbidities (Kavanagh et al., 2010; Bajekal et al., 2013), the co-morbidity of CVD
and diabetes (Agardh et al. 2004; Kahn et al. 2008) and diabetes and obesity
(Congdon, 2010) and multi-morbidities using administrative data (Charlton et al,
2013). Within this context, this paper argues that there is a clear rationale for
investigating the role of individual level demographic and socioeconomic
characteristics of comorbidity for the entire English population. The key objective
of this paper is to define the population that is at risk of CVD, diabetes and obesity
controlling for both demographic and socio-economic characteristics, rather than
age profile alone. Using the Health Survey for England; a population based dataset;
this paper examines a wider set of demographic and socio-economic factors that
may be associated with the comorbidity of CVD, diabetes and obesity at the
individual level for England.
2. Data
The Health Survey for England (HSE) has been carried out annually since 1995 and
provides health, demographic, socio-economic and lifestyle information at the
individual level. The survey is designed to represent the population living in private
households, and thus it excludes those living in institutions. To date, the majority
of studies that look at the health status of the population tend to use surveys that
are based on private households only (Acik-Topiak, 2012). Acik-Topiak (2012)
highlights that using such data underestimates the extent of poor health in the
total population as the unhealthiest, which are overrepresented in institutions e.g.
residential care homes, are excluded. However, this paper argues that those
residing in residential homes or care facilities with comorbidity have their health
6
needs met and clinical data on their comorbidities exist. In contrast, this paper is
specifically interested in the general population that may have unmet health
service needs. The number of respondents for the HSE was approximately 16,000
up to 2008; however the sample size has been reduced to 8,000 since 2009. The
survey contains interviewer weights, which adjust for selection, non-response, and
population age/sex and strategic health authority (SHA) profile, the latter using
estimates from the Office of National Statistics (ONS). Unless indicated otherwise,
the analysis performed in this paper uses the HSE interviewer weights.
In order to study the comorbidity of cardiovascular disease, diabetes and obesity in
adults (age 16 years and above) data from 2008 to 2011 were pooled. People who
reported having at least one longstanding illness (LSI) were asked to choose the
disease(s) they had been diagnosed with according to the classifications in the
International Classification of Diseases (ICD 10). The LSI classification provides data
on diabetes and CVD for every year, as detailed below, whereas questions on
doctor-diagnosed CVD are only collected on particular but non-consecutive years
but from all persons, including those not self reporting a LSI. The need for a large
sample of individuals with comorbidity across consecutive years to achieve
statistical power, meant that doctor diagnosed CVD was not appropriate for this
analysis. A comparison of rates of CVD between the LSI pooled data and the doctor
diagnosed CVD for 2011 was carried out. The analysis found that 12.07% of the LSI
pooled population reported having CVD compared to 13.6% of the population
reporting doctor diagnosed CVD. The similarity in prevalence rates between both
populations further justified the decision to concentrate on the LSI population.
Among the (weighted) pooled total of 36,894 HSE participants having given a valid
response to the longstanding illness (LSI) question, 15,320 reported having a LSI.
This represented 41.53% of the HSE pooled sample. The final sample used within
this paper consisted of the 10,161 individuals that reported having a LSI and

7
provided a valid response to all the variables of interest (obesity and equivalised
income, defined below, being the most problematic variables). As this paper omits
up to two-thirds of the HSE data due to item non response, it is necessary to
ensure that the observations for the 10,161 remaining individuals are unbiased.
Table 1 presents the age-sex distribution of the two samples is compared using the
non-parametric two-sample Kolmogorov-Smirnov test (Conover, 1971). It was
found that drawing two variables from the same continuous distribution gives a p-
value of 0.98, meaning that the null hypothesis can be accepted. Therefore, the
subsample used to model comorbidity within this paper preserves the age-sex
distribution of the original LSI population.
Table 1. The age-sex distributions of the LSI populations before removing non-
response (HSE Ratios), and after doing so (Sample Ratios).
Male
Age 16-54 55-64 65-74 75+
Sample Ratios (%) 24.57 10.22 7.81 5.7
HSE Ratios (%) 22.85 9.78 7.8 6.56
Female
Age 16-54 55-64 65-74 75+
Sample Ratios (%) 26.86 10.07 7.89 6.89
HSE Ratios (%) 25.13 10.03 8.41 9.44
For the purpose of this study, individuals are categorised as having CVD if they
reported any of the following diagnosis: 1) Stroke/cerebral haemorrhage/cerebral
thrombosis, 2) Heart attack/angina and 3) Other heart problems. The diabetes
variable was taken directly from the survey. No differentiation between the two
types of diabetes is available in 2011 because of changing patterns in the
prescription of insulin therapy at early ages (which was used in previous years to
determine the diabetes type). As is typical in studies using the HSE dataset, obesity
8
was approximated using the weight and height measurements provided by the HSE
interviewers were to compute a Body Mass Index (BMI) measure. Using the
current definition of obesity, individuals with a BMI above or equal to 30 Kg/m2
were defined as obese for the purpose of this paper. The use of BMI as a health
indicator or health outcome is a contested issue (Franzosi, 2006; Evan and Colls,
2009). However, other indicators for obesity such as waist-to-hip ratio, waist
measure, and hip measures (Franzosi, 2006) were not available in the HSE. Thus,
BMI was used as a proxy for obesity. The impact of using a BMI-based measure of
obesity, particularly as it relates to different ethnic groups, is further discussed in
Section 5.
With regard to the explanatory variables used in this analysis, the individual level
demographic and socio-economic variables are presented in Table 2. The
demographic variables include age (4 categories), sex, ethnicity and marital status.
The socio-economic variables used include equivalised income (by tertiles),
employment status (in work or not), third level education (whether an individual
has a degree or not), and tenure (using the available levels in the HSE). Finally,
smoking was included as a lifestyle variable. Other lifestyle variables included in
socio-economic based analysis of CVD, diabetes and obesity include alcohol
consumption, diet and exercise. However for this analysis, the HSE did not include
data on physical activity and the question on food and diet only relates to
consumption on the previous day. Drinking frequency and quantity estimates are
also available in the HSE 2011, but initial analysis found that these variables were
highly correlated with age. Therefore, no drinking variable was included in the
model. Finally, initial analysis using multinomial regression (outlined in Section 3)
included the Index of Multiple Deprivation (IMD 2010) as an independent variable
to control for area level deprivation. However, the IMD was found to be not
significant and therefore was not included in the final model.
Table 2. Characteristics of the 2008-2011 longstanding illness English population

9
Variables Level Weighted Counts
Ratio
Total 10157.1 100.0%
Gender Male 4905.4 48.3%
Female 5251.7 51.7%
Age 16-54 5223.1 51.4%
55-64 2061.5 20.3%
65-74 1594.1 15.7%
75+ 1278.4 12.6%
Ethnicity White 9484.1 93.3%
Black 163.3 1.6%
Asian 380.0 3.7%
Other 129.7 1.3%
Marital Status Single 1562.4 15.4%
Married/Civil Partners 5530.6 54.4%
Cohabitees 1048.2 10.3%
Separated/Divorced 1089.7 10.7%
Widowed 926.2 9.1%
Income Tertile Lowest 3549.5 34.9%
Medium 3514.9 34.6%
Highest 3092.7 30.4%
In-Work Yes 4836.9 47.6%
No 5320.2 52.4%
University Yes 1877.3 18.5%
No 8279.8 81.5%
Tenure Renting or Free 3012.5 29.7%
Owning 3618.4 35.6%
Buying or Shared 3526.2 34.7%

10
Smoking Never Regular 4859.0 47.8%
Currently 2217.1 21.8%
Ex-Regular 3081.0 30.3%
3. Statistical Model: Multinomial Logistic Regression
Using variables that have been found to be significantly associated with each of
the three morbidities, this paper uses a multinomial log-linear model to model the
demographic and socio-economic determinants of comorbidity (CVD, diabetes and
obesity) at the individual level for England. Multinomial log-linear models are used
when the dependent variable to be explained is polytomous and categorical, i.e. it
has more than two categories with no global order between them (Morgon and
Teachman, 1988). Comorbidity is studied using a response variable with 8
categories, corresponding to the product of all possible combinations of CVD,
diabetes, and obesity status for the considered longstanding illness population;
concisely: non-obese, non-CVD, non-diabetic ( ); obese, non-CVD, non-
diabetic ( ); CVD, non-obese, non-diabetic ( ); diabetic, non-obese, non-
CVD ( ); obese, CVD, non-diabetic ( ); obese, diabetic, non-CVD ( );
CVD, diabetic, non-obese ( ); obese, CVD, diabetic ( ).
The probability for an individual to be in the comorbidity category is modelled
under the multinomial log-linear model as
(1)
where is the vector of values of the independent variables for individual ,
and is the vector of regression coefficients for the comorbidity category , being
the non-morbid category ( ) selected as reference: . All the
independent variables are categorised using dummies, so that each is in fact a
vector of 0 and 1 values. The easiest way to interpret the fitted multinomial model

11
is to look at its log-odds, which correspond to the logarithm of the relative risks of
moving from the reference category ( ) to a comorbidity category :
(2)
By denoting by and
the components of and , respectively, the log-odd
expression expands as a sum of terms ; the effect of each log-odd
coefficient is additive and must be only considered when
is non-zero.
Nnet within the R software (Venables & Ripley, 2002) is a statistical package that
supports the fitting of multinomial log-linear models. Its function ‘multinom’
(Venables & Ripley, 2002) was used to fit the described model for different tested
sets of explanatory variables and categorisations of those variables. The final
model selected was the one with the set of regressors (Table 1) with the best
Akaike Information Criterion (AIC), thus giving the best compromise between
goodness of fit and complexity (Burnham & Anderson 2004). The final model
coefficients and their significance levels are presented in Table 3.
4. Results
The Prevalence of Comorbidity
This study focuses on the comorbidity of CVD, diabetes and obesity, using the
population of individuals with a longstanding illness (LSI) in the weighted HSE
dataset. Table 3 presents the comorbidity profile by age/gender for the English
population that report having an LSI. This profile was estimated using temporally
pooled 2008-2011 HSE data. The prevalence of single morbidity obesity (obese, no
CVD, and no diabetes) was higher for females than for males, at any age; however,
male ratios are higher for the majority of the other single morbidities and

12
comorbidities at each age. Prevalence ratios increase with age (age gradient) for
the single morbidities CVD and diabetes, and the comorbidities of obesity & CVD,
and CVD & diabetes. In contrast, such increase stops at the age of 74 years for the
single morbidity obesity, and the comorbidities of obesity & diabetes, and of
obesity & CVD & diabetes. For ages above 55, single morbidities represent overall
between 35% and 40% of the total LSI population for both genders. Comorbidities
as a whole represent between 16% and 20% for men, and a slightly smaller
proportion for women, ranging between 12% and 15% of the total LSI population.
The considered comorbidity categories are significantly represented and merit the
further analysis that follows.
Table 3. Prevalence (%) of obesity, cardiovascular disease (CVD), and diabetes by
age/gender group among the pooled HSE 2008-2011 longstanding illness English
population
Obese
CVD Diabetes Obese, CVD
Obese, diabetic
CVD, Diabetic
Obese, CVD, Diabetic
Male 16-54 23.1 2.9 3.6 1.7 3.7 0.1 0.5
Male 55-64 25.3 8.8 5.4 7.1 6.6 0.6 1.6
Male 65-74 17.1 11.8 7.3 7.4 6.8 2.2 3.9
Male 75+ 11.6 19.4 8.1 9.7 3.5 4.1 1.9
Female 16-54 27.8 2.1 2.2 1.2 2.7 0.04 0.3
Female 55-64 27.7 5.2 2.5 3.8 6.5 0.4 1.2
Female 65-74 27.7 7.7 4.3 4.5 5.9 1.1 2.2
Female 75+ 20.1 13.8 5.5 7.3 4.0 2.3 1.4
Multinomial Logistic Analysis
Table 4 continues the analysis of the demographic and socio-economic
determinants of comorbidity by presenting the results of the multinomial model.
The comparison between intercepts in the multinomial model shows that the risk

13
of comorbidity between CVD & diabetes is less probable for the reference group
(male, age 16 to 54, white, single, high income, in-work, with a degree, owning
their own home and never a regular smoker). From Table 4 one can see that the
estimated multinomial model confirms the gender patterns observed for the
prevalence ratios in Table 3. Namely, the risk for single obesity is higher for women
than for men, whereas the risk for all other single morbidity and comorbidity
categories is significantly higher for men than for women. Increasing age gradients
are observed with the relative risk of CVD (log-odds 1.16, 1.26, 1.7), diabetes (log-
odds 0.63, 0.98, 1.16), the comorbidity of obesity and CVD (log odds 1.34, 1.23,
1.47), the comorbidity of CVD & diabetes (log-odds 2.57, 3.44, 4.16) and the
comorbidity of obesity & CVD & diabetes (1.29, 1.6, 0.81). Table 4 observes an
increasing significant age gradient for obesity until age 74 years plus. However,
interestingly individuals aged 74 years plus have decreased prevalence ratios for
obesity (log-odds 0.2, 0.001, -0.41). At the same time, it is interesting to note that
controlling for demographic and socio-economic characteristics, Table 4 indicates
that the 74 years old plus age group has the lowest levels of obesity. This result
may be due to one or more of a combination of three circumstances. Firstly, that
the oldest individuals within the group have lower rates of obesity (a cohort
effect). Secondly, that obesity lowers life expectancy, through the onset of
diseases attributable to being overweight and obesity (Foresight, 2007). Thirdly, as
this paper is examining private households only, there may be a effect of transfer
to care homes.
Ethnicity was found to be significant for obesity and diabetes as single morbidities;
and obesity & diabetes, and CVD & diabetes as comorbidities. Single morbidity
diabetes, and the comorbidities of obesity & diabetes, and CVD & diabetes are
more likely to happen in black (log-odds 1.78, 1.3, and 1.77, respectively) and
Asian (log-odds 1.81, 0.79, 2.26) populations than in the predominant white
population. This result is similar to recent research by Tallin et al. (2012), whose
14
study reported diabetes to be the most prevalent in these ethnic groups. Tallin et
al. (2012) found insulin resistance and truncal obesity to be important medical
determinants for diabetes risk in Indian-Asian and African-Caribbean females.
Individuals of Asian ethnicity were found less likely to be obese than the white
population (log-odd -0.66). Both populations have a lower obesity risk than the
black population (log-odd 0.45). This result, in combination with observed higher
diabetes risk, points to the debate on the suitability of the current BMI threshold
defining obesity for the Asian population (see e.g. James et al., 2002) but also for
the black population. The recent NICE Public Health Guidance (2013) is to use
specific BMI thresholds (lower than usual) for both ethnic groups to define obesity
only for diabetes prevention, but not for the general purpose of defining obesity.
However, to date specific BMI thresholds by ethnicity have not been agreed for
practical use.
Several marital status categories were found to have a significant relationship with
a number of the morbidities and comorbidities of interest. In all cases, being single
was associated with a lower relative risk in comparison to other marital statuses.
Concerning obesity, the marital statuses sorted by increasing relative risk are
separated or divorced, cohabitees, married/civil partnership, and widowed (log-
odds 0.33, 0.39, 0.46, and 0.51, respectively). For CVD, the marital statuses in
increasing order of relative risk are married/civil partnership, cohabitees, and
widowed (log-odds 0.49, 0.57, 0.67). The obtained marital status effect on the
relative risk for the comorbidity of obesity & CVD are consistent with the single
morbidity results: being married or in a civil partnership implies a higher risk (log-
odd 0.73) than being single and such risk is slightly higher for widowed (log-odd
0.83). Examining the comorbidity of obesity & diabetes, being married/civil
partnership, being separated or divorced, and being widowed were found
significant (log-odds 0.9, 0.96, 1.12). Being married was also found to be significant
(log-odd 0.76) for the comorbidity of obesity & CVD & diabetes.

15
Examining the socio-economic variables, Table 4 indicates that being in the lowest
or medium income tertile (log-odds 0.41, 0.19), not having a degree (log-odd 0.39),
and renting (log-odd 0.13) has a significant positive effect on obesity. The National
Obesity Observatory (National Obesity Observatory, 2012) has reported similar
income and education incidence rates for the English population. Individuals in the
lowest and medium income tertile (log-odd 0.39; 0.43), not being in-work (log-odd
-0.69), and renting (log-odd 0.31) have a significant positive effect on CVD.
Concerning the comorbidities obesity & CVD, the multinomial model found not
being in-work (log-odd 0.58), not having a degree (log-odd 0.49), renting (0.64) and
buying (log odds 0.47) were positively significant. For obesity & diabetes, a
significant negative relationship was found if an individual was in the lowest or
medium income tertile (log-odd 0.51; 0.3) or did not have a degree (log-odd -0.42).
Examining CVD & diabetes comorbidity, a positive significant effect was found for
not being in-work (log odds 1.56). With regard to the comorbidity of obesity & CVD
& diabetes, it was found that the lowest income tertile (log-odd 0.97), not being in-
work (log-odd 1.13), being a home renter or buyer (log-odds -0.93, 0.27) had a
significant positive effect on comorbidity.
In terms of analysis, an issue with multinomial models is the amount of
information provided by one model. Given the specific interest of this paper, Table
5 presents a map of the socio-economic factors and the combinations of
morbidities and comorbidities that they have the strongest significant effects on,
controlling for the demographic and socio-economic variables included in the
model. From Table 5, it becomes clear that the income gradient presented in Table
4 has the greatest effect on obesity based combinations of comorbidity, obese,
CVD & diabetes, obese & diabetes and obese & CVD. Employment status (not in
work) has the greatest significant effect on CVD based combinations of
comorbidity and CVD as a single morbidity. Not having a third level degree was

16
found to have the strongest impact on obesity based comorbidities and obesity as
a single morbidity. Finally, tenure (owning your own home), similar to employment
status, has the greatest significant effect on CVD based combinations of
comorbidity and CVD as a single morbidity. These results are interesting and
indicate that the socio-economic factors associated with differ combinations of
comorbidities are not homogenous. However, the set of socio-economic factors
included in this analysis have a stronger relationship with obesity and CVD as both
single and comorbidities, compared to diabetes.
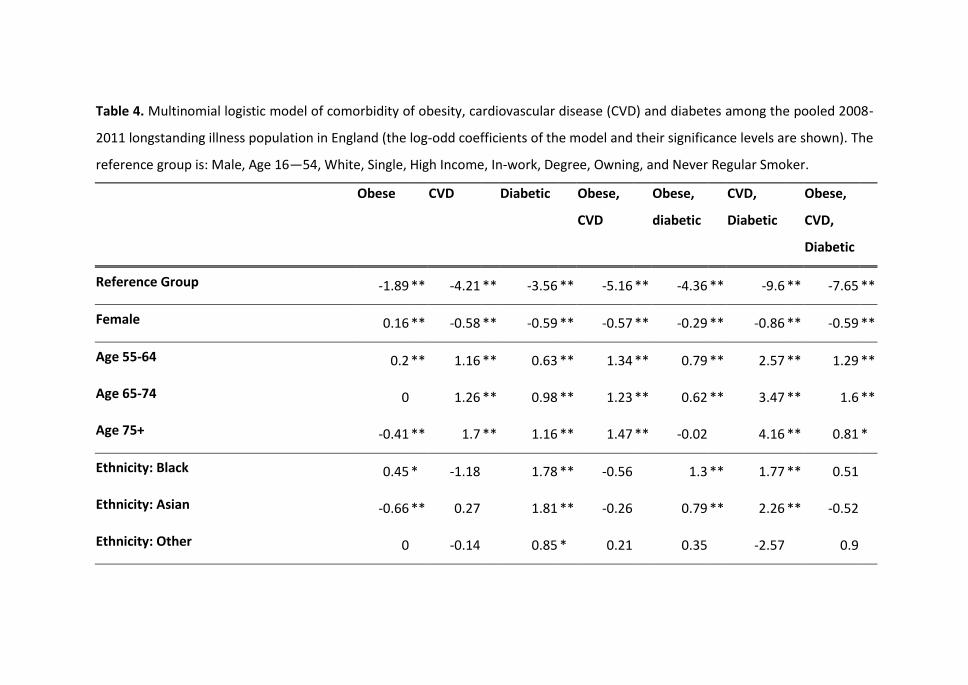
Table 4. Multinomial logistic model of comorbidity of obesity, cardiovascular disease (CVD) and diabetes among the pooled 2008-
2011 longstanding illness population in England (the log-odd coefficients of the model and their significance levels are shown). The
reference group is: Male, Age 16—54, White, Single, High Income, In-work, Degree, Owning, and Never Regular Smoker.
Obese
CVD Diabetic Obese,
CVD
Obese,
diabetic
CVD,
Diabetic
Obese,
CVD,
Diabetic
Reference Group -1.89 ** -4.21 ** -3.56 ** -5.16 ** -4.36 ** -9.6 ** -7.65 **
Female 0.16 ** -0.58 ** -0.59 ** -0.57 ** -0.29 ** -0.86 ** -0.59 **
Age 55-64 0.2 ** 1.16 ** 0.63 ** 1.34 ** 0.79 ** 2.57 ** 1.29 **
Age 65-74 0
1.26 ** 0.98 ** 1.23 ** 0.62 ** 3.47 ** 1.6 **
Age 75+ -0.41 ** 1.7 ** 1.16 ** 1.47 ** -0.02
4.16 ** 0.81 *
Ethnicity: Black 0.45 * -1.18
1.78 ** -0.56
1.3 ** 1.77 ** 0.51
Ethnicity: Asian -0.66 ** 0.27
1.81 ** -0.26
0.79 ** 2.26 ** -0.52
Ethnicity: Other 0
-0.14
0.85 * 0.21
0.35
-2.57
0.9

18
Married/Civil Partnership 0.46 ** 0.49 ** 0.31
0.73 ** 0.9 ** 0.81
0.76 *
Cohabitees 0.39 ** 0.57 ** 0.26
0.37
0.49
1.11
0.38
Separated/Divorced 0.33 ** 0.29
-0.01
0.47
0.96 ** 0.48
-0.14
Widowed 0.51 ** 0.67 ** 0.33
0.83 ** 1.12 ** 0.62
0.63
Income: Low 0.41 ** 0.39 ** 0.13
0.26
0.51 ** 0.77
0.97 **
Income: Medium 0.19 ** 0.43 ** 0.13
0.1
0.3 * 0.55
0.63
Not In-Work 0.03
0.69 ** 0.14
0.58 ** 0.2
1.56 * 1.13 **
Education: No Degree 0.39 ** 0.1
0.1
0.49 ** 0.42 ** 0.2
0.79
Renting or Free Ownership 0.13
0.31 ** -0.04
0.64 ** 0.21
0.42
0.93 **
Buying or ½ Rent/Mortgage 0.21 ** 0.17 -0.12 0.47 ** 0.09 0.21 0.27
Smoking Currently -0.42 ** 0.03 -0.03 -0.38 * -0.4 ** 0.27 -0.78 *
Smoking Ex-regularly 0.16 ** 0.21 * 0.35 ** 0.5 ** 0.27 * -0.07 0.67 **
*Significant at the 0.05 level, **Significant at the 0.01 level.

Table 5 Map of the Strongest Socio-economic factors for each disease
combination
Socio-economic Factor Strongest Significant Effect
Second Strongest Significant Effect
Third Strongest Significant Effect
Income gradient Obese, CVD & Diabetes Obese & Diabetes Obese & CVD
Not In Work Obese, CVD & Diabetes Obese & CVD CVD
Education: No degree Obese & CVD Obese & Diabetes Obese
Tenure Obese, CVD & Diabetes Obese & CVD CVD
Finally, examining the smoking variable, the multinomial model found a higher
disease risk for ex-regular smokers and a lower risk for current smokers in all the
obesity-related morbidities and comorbidities (see Table 4 for the log-odd values).
Given the known health risks associated with smoking, this was deemed a
surprising result. To examine this relationship further, a simple logistic model was
run for BMI using the smoking status as independent variable (categories smoking
currently, smoking ex-regularly, never regularly). The logistic model showed that
average BMI is lower for current smokers than for non-smokers, whilst BMI is
highest for ex-smokers. These relationships are significant. An increase in weight
when quitting smoking has been reported elsewhere (Aubin et al. 2012; Alley et
al., 2010), and this paper hypothesises that the decreased obesity risk for current
smokers compared to ex-smokers is associated with such weight gain. Being an ex-
regular smoker is associated with a higher risk for single morbidities CVD and
diabetes (log-odds 0.2 and 0.35, respectively). Unfortunately, unlike the obesity
variable, no conclusion can be extracted for current smokers, since the
corresponding model coefficients were not significant. However, it is important to
note that numerous medical studies show that quitting smoking reduces the risk
for CVD, independently of diabetes (see e.g. Clair et al. 2013).

20
5. Discussion
Numerous studies have analysed the effects of individual level socio-economic
status on cardiovascular health, diabetes and diabetes and obesity. As such, the
socio-economic determinants of each of these morbidities are well established at
the national level and include low socio-economic status and unemployment (Fone
et al., 2013; Kavanagh et al., 2010; Congdon, 2010). However limited research to
date has examined the association between socio-economic status and the
comorbidity of CVD, diabetes and obesity in itself. Previous clinical research on
comorbidity tends to have focused on identifying the most prevalent and
prognostically important illnesses that tend to demonstrate comorbidity (Sachdev
et al., 2004), whilst both clinical and population based research has tended to
focus singly on the elderly population. Widening the population to include all
individuals aged sixteen years and above, this paper presents the first socio-
economic based research on the comorbidity of CVD, diabetes and obesity in the
UK. Using a population dataset of private households, the HSE, it was found that
controlling for a host of demographic and socio-economic factors the individual
level covariates associated with different morbidities and combinations of
comorbidities are not homogenous (Table 4). Demographic and socio-economic
factors vary in significance and magnitude of association across each morbidity and
comorbidity combination.
Examining the demographic variables, this analysis indicates that gender and
marital status are significant predictors of all seven disease combinations, except
for obesity alone. However, these two explanatory variables are not as strongly
significant as other variables. The multinomial logistic model found that increasing
age gradients had a significantly higher risk for CVD, diabetes, and their co-
morbidity. With regard to ethnicity, the black population presents a high risk for
diabetes (and diabetes-related co-morbidity), whilst the Asian population presents

21
a risk for high diabetes risk but low risk for obesity. However, whilst BMI is now the
dominant tool used in quantitative analyses of obesity, it is important to note the
discussions regarding the limits of the BMI (Nicholls, 2013), including the
recommendation to apply ethnic specific BMI thresholds. With regard to obesity
and comorbidity, Bell et al., (2002) state that ethnic-specific definitions of obesity
has been hindered by a lack of data clarifying whether or not obesity-related
comorbid conditions occur at different levels of BMI in different ethnic groups.
Thus, more research needs to be conducted in ethnically diverse populations if the
relationships between BMI, body fat and chronic disease are to be better defined
(Katzmarzyk, 2011; Nicholls, 2013).
With regard to socioeconomic status, having controlled for demographic and
lifestyle factors, the risk for each of the seven disease categories was lowest for
the individuals with an equivalised income in the highest tertile, in-work, owning
their own home and having a degree, of which not in-work had the greatest
association. With regard to smoking, smokers have a lower risk rate of obesity (and
related comorbidities) than ex-smokers relative to individuals that never smoked.
The strong associations between lower socio-economic status (income, education,
employment status and tenure) and comorbidity, having controlled for
demographic characteristics, reinforces the need to concentrate health promotion
and health policy efforts on reducing social inequalities rather than behavioural
characteristics alone (Kavanagh et al., 2010).
Following Frolhlich and Polvin (2008), this paper argues that interventions that
attempt to alter some of society’s behavioural norms, for example, the current
example of banning smoking in public places, assumes that everyone’s risk
exposure is reduced by the same amount, regardless of one’s initial position in the
risk exposure distribution. In reality, socio-economic position has been repeatedly
shown to influence individual’s behavioural characteristics (Kavanagh et al., 2010;
22
Frolich and Potvin 2008). Thus, given the significant association between socio-
economic characteristics and comorbidity demonstrated in this paper, this paper
argues that a focus on vulnerable populations is complementary to a population
approach and necessary for addressing social inequalities in health. As noted by
Frolich and Potvin (2008), the notion of vulnerable populations differs from that of
populations at risk in that a population at risk is defined by a higher measured
exposure to a specific risk factor. In contrast, a vulnerable population is a
subpopulation which, because of shared social characteristics, is commonly
exposed to contextual conditions that places it at a higher risk than the rest of the
population. The findings of this paper indicate that individuals in lower socio-
economic groups across England, controlling for demographic factors may be
defined as vulnerable groups. Thus, we argue that inequalities in health outcomes
are unlikely to change without attention being paid to the generators of socio-
economic inequalities. With regard to health policy, these findings indicate that
solutions to redressing health inequalities may lie outside the health sector
(Kavanagh et al., 2010; Frolich and Potvin 2008); thus, calling for a more inter-
disciplinary approach to public health provision.
Whilst the research presented in this paper focused on individual level factors,
future research on comorbidity must include both individual and contextual
environmental factors. Place of residence is strongly patterned by social position;
neighbourhood characteristics may be important contributors to health disparities
(Diez Roux and Mair, 2010). There is a growing appreciation of the role that
contextual environmental factors or “neighborhood” effects play on physical
health (Diez Roux and Mair, 2010). Neighbourhoods have both physical and social
attributes that may influence health. Physical attributes include access to goods
and services, green space, and availability of alcohol and tobacco outlets; social
attributes include community unemployment, segregation, social capital, civic
participation, and crime (Diez Roux and Mair, 2010). Thus, the next step in this

23
research is to incorporate spatial referencing within the HSE via a spatial
microsimulation algorithm (Morrissey et al., 2013; Clarke et al., 2014) and the
Census of Population 2011 to help understand how rates of comorbidity are
represented across England. That said, this paper found that the IMD, a spatially
referenced social and economic indicator for each lower super output area in
England, did not have a significant association with any of the morbidities or
comorbidities within the model. However, creating a spatially representative
demographic, socio-economic and co-morbidity profile for the population of
England would allow research to highlight comorbidity hotspots in relation to
current health supply facilities. Such an analysis would therefore highlight areas
with potential unmet health service needs (Morrissey et al., 2008).
6. Conclusion
Previous research on comorbidity has focused on identifying the most prevalent
groupings of illnesses that demonstrate comorbidity (Sachdev et al., 2004),
particularly among the elderly population. This paper argues that such a focus
ignores the accepted empirical evidence that an individual’s health is the outcome
of multifaceted processes rather than age or initial health status alone (Morrissey
et al., 2013). Instead, the relative risk of comorbid health outcomes should be seen
as being shaped from an early age by individual level circumstances. Extending
previous research on the comorbidity of CVD, diabetes and obesity, this paper
found that just as for to CVD, diabetes and obesity as single morbidities, socio-
economic factors are an important determinant of comorbidity in England. This
suggests that increased emphasis needs to be placed on determining the socio-
economic determinants co-morbidity both in England and internationally.
However, as noted by Kavanagh et al., (2010), to change socio-economic outcomes
in health outcomes, research concentrating on individual risk factors needs to be
conducted in tandem with research on the generators of socio-economic
inequalities. Thus, both in the UK and internationally the public health agenda

24
requires numerous agencies working together in tandem to prevent inter-
generational socio-economic factors determining an individual’s health outcome.
With regard to the provision of health services, this study indicates that in England
single disease management approach is no longer suitable for a large number of
patients. Since comorbidity is significantly related to increased levels of mortality
and decreased functional status and quality of life, health care should shift its
focus from specific diseases, to multiple pathologies, worsening functional status,
increasing dependence of care and the increased risk of mental and social
problems (Gijsen et al., 2001; Islam et al., 2014). Furthermore, given the socio-
economic gradient observed in this paper and previous international research
(Kavanagh et al., 2010) interventions to reduce comorbidities should be tailored to
the unique risk profile and needs of high-risk communities (Rodriguez et al., 2013).
Acknowledgements
Funding for this research was provided by the ESRC Secondary Data Analysis
Initative, Grant Number ES/K004433/1.

25
References
Acik-Toprak N, (2012), SARs Use Example: Comparing the Health of Elderly People
in Communal Establishments and Households with the 2001 Individual Licensed
SARs, CCSR, University of Manchester
Alley DE, Lloyd J, Shardell M. Can obesity account for cross-national differences in
life expectancy trends? In: Crimmins EM, Preston SH, Cohen B,
editors.International Differences in Mortality at Older Ages: Dimensions and
Sources. Washington, DC: The National Academies Press; 2010, 164–192.
Aubin, H. J., Farley, A., Lycett, D., Lahmek, P., & Aveyard, P. (2012). Weight gain in
smokers after quitting cigarettes: meta-analysis. British Medical Journal 2012; 345-
4439.
Bajekal M, Scholes S, O’Flaherty M, Raine R, Norman P, et al. (2013) Unequal
Trends in Coronary Heart Disease Mortality by Socioeconomic Circumstances,
England 1982–2006: An Analytical Study. PLoS ONE 8(3): e59608.
Balluz, L. Okoro, C. Mokdad, A. Association between selected unhealthy lifestyle
factors, body mass index, and chronic health conditions among individuals 50 years
of age or older, by race/ethnicity. Ethnic Dis. 2008, 18, 450-457.
Bell A, Adair L, Popkin B. (2002), Ethnic Differences in the Association between
Body Mass Index and Hypertension, American Journal of Epidemiology, 155(4)
346-353.

26
Burnham, K. P., & Anderson, D. R. (2004). Multimodal inference: understanding AIC
and BIC in Model Selection. Sociological Methods and Research 33:261—304.
Carey I, Shah S, Harris T, DeWilde S, Cook D. (2013). A new simple primary care
morbidity score predicted mortality and better explains between practice
variations than the Charlson index. J Clinical Epidemiology, 66(4), 436-444.
Clair, C., Rigotti, N. A., Porneala, B., Fox, C. S., D'Agostino, R. B., Pencina, M.
J., Meigs, J. B. (2013) Association of Smoking Cessation and Weight Change with
Cardiovascular Disease Among Adults With and Without Diabetes. The Journal of
the American Medical Association, 2013; 309:1014-1021.
Clarke S, Birkin M, Heppenstall A, Sub regional estimates of morbidities in the
English elderly population, Health and Place 2014; 27: 176-185.
Charlton J, Rudisill C, Bhattarai N Gulliford M. (2013) Impact of deprivation on
occurrence, outcomes and health care costs of people with multiple morbidity.
Journal of Health Services Research and Policy, 1-9.
Congdon P (2010). A Multilevel Model for Comorbid Outcomes: Obesity and
Diabetes in the US. International Journal of Environmental Resources and Public
Health; 7(2) 333-352.
Conover W. (1971), Practical Nonparametric Statistics. New York: John Wiley &
Sons, 309–314.
Diez Roux A, Mair C. (2010). Neighborhoods and health, Annals of New York
Academy of Sciences. 1186 (2010) 125–145

27
Evans B and (Colls R) (2009) Measuring fatness, governing bodies: The spatialities
of the Body Mass Index (BMI) in anti-obesity politics. Antipode, 41(5), 1051-1083
Fone D., Greene G, Farewell D. (2013). Common mental disorders, neighbourhood
income inequality and income deprivation: small-area multilevel analysis. British
Journal of Psychiatry, 202, 286-293.
Fortin M, Dubois MF, Hudon C, Soubhi H, Almirall J (2007) Multimorbidity and
quality of life: a closer look. Health and quality of life outcomes 5: 52.
Foresight, 2007. Tackling Obesities: Future Choices—Project Report. Government
Office for Science, London.
Franzosi M (2006) Should we continue to use BMI as a cardiovascular risk factor?
The Lancet 368(9536):624–625.Frohlich, K. L., & Potvin, L. (2008). The inequality
paradox: the population approach and vulnerable populations. American Journal
of Public Health, 98, 216-221.
Gijsen R, Hoeymans N, Schellevis FG, Ruwaard D, Satariano W, van den Bos G.
(2001). Causes and consequences of comorbidity: a review. Journal of Clinical
Epidemiology, 54(7), 661-674.
Islam MM, Valderas JM, Yen L, Dawda P, Jowsey T, et al. (2014) Multimorbidity and
Comorbidity of Chronic Diseases among the Senior Australians: Prevalence and
Patterns. PLoS ONE 9(1): e83783.
James WPT, Chen C, Inoue S. (2002). Appropriate Asian body mass indices? Obesity
Review, 3(3):139.

28
Joseph A, Phillips D, 1984, Accessibility and utilization: Geographical perspectives
on health care delivery. London, UK: Harper & Row.
Kahn R, Robertson RM, Smith R, Eddy D. The impact of prevention on reducing the
burden of cardiovascular disease. Circulation. 2008; 118:576-85.
Katzmarzyk P, Bray G, Greenway F, Johnson, W Newton R, Ravussin E, Ryanand D,
Bouchard C., Ethnic-Specific BMI and Waist Circumference Thresholds, Obesity,
2011; 19(6): 1272–1278.
Kavanagh, A., Bentley, RJ., Turrell, G., Shaw, J., Dunstan, D. & Subramanian SV.
(2010). Socioeconomic position, gender, health behaviours and biomarkers of
cardiovascular disease and diabetes. Social Science & Medicine, 71, 1150-1160.
Marengoni A, Angleman S, Melis R, Mangialasche F, Karp A, et al. (2011) Aging with
multimorbidity: a systematic review of the literature. Ageing research reviews 10:
430–439.
McLafferty, S. (2003). GIS and Health Care. Annual Review of Public Health, 24:25-
42.
Morgan, S. P, & Teachman, J.D. (1988). Logistic regression: Description, examples,
and comparisons, Journal of Marriage and the Family, 50, 929-936.
Morrissey K., G. Clarke, D. Ballas, S. Hynes, C. O’Donoghue (2008) Analysing Access
to GP Services in Rural Ireland using micro-level Analysis. Area 40(3), 354-364.
Morrissey K, O'Donoghue C, Clarke G, Li J. (2013) Using Simulated Data to examine
the Determinants of Acute Hospital Demand at the Small Area Level. Geographical
Analysis, 45(1), 49-76.
Mulle J, Vaccarino V. (2013). Cardiovascular Disease, Psychosocial Factors, and

29
Genetics: The Case of Depression, Progress in Cardiovascular Disorders, 55, 557–
562.
National Obesity Obervatory (2012). Adult Obesity and Socioeconomic Status,
National Obesity Obervatory Data Factsheet.
Neng, W., Zhan, FB., Zou B. & Wilson, JB. (2012). Spatial Access to Health Care
Services and Disparities in Colorectal. Professional Geographer, 65(3), 527-541.
NICE Public Health Guidance 46. Assessing body mass index and waist
circumference thresholds for intervening to prevent ill health and premature death
among adults from black, Asian and other minority ethnic groups in the UK, (2013).
Nicholls, S. 2013. Standards and classification: A perspective on the ‘obesity
epidemic’. Social Science and Medicine 87: 9–15
Procter KL, Clarke GP, Ransley JK, et al. (2008) Microlevel analysis of childhood
obesity, diet, physical activity, residential socioeconomic and social capital
variables: Where are the obesogenic environments in Leeds? Area 40(3): 323–340.
Rodriguez F, Wang Y, Naderi S, Johnson C, Foody J. (2013). Community-Level
Cardiovascular Risk Factors Impact Geographic Variation in Cardiovascular Disease
Hospitalizations for Women, Journal of Community Health, 38, 451-457.
Sachdev M, Lena Sun J, Tsiatis A, Nelson C, Mark D, Jollis, J. (2004). The prognostic
importance of comorbidity for mortality in patients with stable coronary artery
disease. Journal of the American College of Cardiology, 43(4), 576-582.
Salive M, (2013). Multimorbidity in Older Adults, Epidemiology Reviews, 35:75–83
Shim J.K. (2002). Understanding the routinized inclusion of race, socio-economic
status and sex in epidemiology: the utility of concepts from technoscience studies.
Sociology of Health and Illness, 24, 129–50.
30
Struijs J., Baan C., Westert G, van de Bos G. (2006). Comorbidity in patients with
diabetes mellitus: impact on medical health care utilization, BMC Health Services
Research, 6(84), 1-9.
Valderas JM, Starfield B., Sibbald,B., Salisbury C, Roland M. (2009). Defining
comorbidity: implications for understanding health and health services, Annals of
Family Medicine 7(4), 357-63
Villanueva C, Aggarwal B. (2013). The Association between Neighborhood
Socioeconomic Status and Clinical Outcomes among Patients 1 Year After
Hospitalization for Cardiovascular Disease, Journal of Community Health 38, 690–
697.
Williams, G. (2003). “The determinants of health: structure, context and agency.”
Sociology of Health & Illness, 25(1), 131–154.
World Health Organisation, World Health Statistics, World Health Organisation;
2012.
Zhang X, Cook P, Jarmon P, Lisboa, P. (2011). Area effects on health inequalities:
The impact of neighbouring deprivation on mortality, Health & Place 17, 1266–
1273.