a practical application of geostatistical j methods to ... · pdf filethe application of...
TRANSCRIPT

Journal
Paper
Introduction
The economic evaluation of natural resourcesdepends on the accuracy of reserve estimates.Such estimates are necessary in makingdecisions about opening new mines or inplanning future investment for operating
mines or industrial deposits. Resourceestimation and grade control establish a basisfor successful mining operations. Both theoverestimation and underestimation of mineralreserves can have severe consequences forfuture mine planning. Underestimation mayresult in a potentially feasible operation beingdisposed of when it actually represents apotentially profitable mine. The more likelyconsequence is an underdesigned plant.Overestimation may lead to construction of amine where no profitable orebody exists. Morecommonly, it will result in the lifespan of themine operation being shorter than anticipated.
Generally, reserves are estimated by thetraditional methods such as polygon,triangular prism, trapezoid, isopach maps, andgeological section. These techniques do notallow for a determination of the reliability ofthe estimate. The estimation error may be highand the actual mean value cannot bedetermined. Geostatistical techniques do notonly provide estimations for any point, butalso make it possible to find weighting coeffi-cients for a given mining block and also dataconfigurations that minimize the error orobtain the associated variance.
The application of geostatistics in miningdates back to the late 1970s (Krige, 1951;David, 1977; Journel and Huijbregts, 1978;Clark, 1979). Geostatistics was appliedprimarily in the mining industry and thendeveloped in the areas of environmentalproblems and oil reservoir modelling (David,1988; Isaaks and Srivastava, 1989; Clark andHarper, 2000). A few studies have been foundrelating to the application of geostatistics tocement raw material deposits (e.g. Almedia et al., 2004; Marcotte et al., 2005).
A practical application of geostatisticalmethods to quality and mineral reservemodelling of cement raw materialsby T.Y. Yunsel*
SynopsisEstimation techniques such as polygonal, triangular prism,trapezoid, isopach maps, and inverse distance methods are oftenused in ore or industrial minerals deposit evaluation. Thesetechniques do not express the variability of the deposit and do notallow a determination of the reliability of the estimates. However,geostatistical methods can express a measure of the error associatedwith the estimates, by finding weighting coefficients for a givenmining block, and can also help with data configuration thatminimizes the error. This work addresses an application study onthe quality and reserve characteristics of the cement raw materialsof the Adana Cement Factory in Adana, Turkey, based on the spatialdistribution and variability of the chemical components (SiO2, CaO,Al2O3, Fe2O3). The study has been carried out using a geostatisticalprocedure that is useful for site assessment, characterization, andmonitoring situations where data are collected spatially. Directionaland omnidirectional experimental variograms of the cement rawmaterial variables showed that neither strong geometric nor severezonal anisotropy exists in the data. The most evident spatialdependence structure expressing the continuity for omnidirectionalexperimental variograms were characterized by exponential andspherical variogram models. These models have been used in cross-validation analysis, which proved that these models, theirparameters, and kriging parameters are applicable for the studyarea. Quality contour maps of the deposits at given levelsunderground were estimated using a kriging interpolationtechnique. Anomalies such as bullseyes and drift were not observedin the maps that were generated. Kriged maps showed the spatialdistribution of quality continuity and variability of the deposits.Grade-tonnage curves and total tonnage estimates in the particulargrade were determined using ordinary kriging in order to improvethe mining operation and planning. Consequently, local uncertaintyand the probability of extreme values occurring are tools of primeimportance for the mine planning, the optimum mix of rawmaterials coming from different quarry stopes.
Keywordscement raw materials, geostatistics, variogram, quality and reserveestimation, kriging.
* Department of Mining Engineering, CukurovaUniversity, Balcali, Adana, Turkey.
© The Southern African Institute of Mining andMetallurgy, 2012. SA ISSN 0038–223X/3.00 +0.00. Paper received Feb. 2010; revised paperreceived Oct. 2011.
239The Journal of The Southern African Institute of Mining and Metallurgy VOLUME 112 MARCH 2012 ▲

A practical application of geostatistical methods to quality and mineral reserve modelling
Geostatistical analysis provides a powerful tool forenhancing the prediction and decisionmaking capabilities ofplanners and engineers in the cement raw materials industry.Geostatistical methods are useful for site assessment, charac-terization, and monitoring situations where data is collectedspatially. The approach preferred in a geostatistical study isto apply an iterative three-step approach involving:
➤ Exploratory data analysis➤ Variogram model selection, parameter determination,
and model validation➤ Making predictions (kriging estimation and/or
simulations).
There are several types of variogram models. However, inthis study, Gaussian, spherical, and exponential variogrammodels were used due to the appropriate fitting of the data tothese models.
This paper is a case study and aims to assess the spatialstructure of the distributions of quality and reserveinformation for cement raw materials. The geostatisticalresults are determined from variograms and ordinary krigingusing core samples from drillholes. The qualities and reserveestimation were carried out for a successful raw materialsoperation and production planning. Kriging contour maps anda three-dimensional estimation of the study area wereconstructed for future planning.
The study area
The study area is located 10 km southeast of Adana Countyand 1 km south of the E-90 motorway in Turkey (Figure 1).The study area belongs to Adana Cement Industry, which isthe first and biggest cement factory in Turkey. The factoryuses 4 Mt of cement raw materials, and produces approxi-mately 2.5 Mt of cement, per year. The factory has thecapacity to produce 3.5 Mt of cement annually. The Adanacement industry has 65 kt stock capacity of preblending, fourraw crushers, four raw mills, four rotary kilns, five cementmills, and six packing-weighing machines. Different types ofcement (e.g. Portland, composite, white Portland, sulphate-resistant, blended, tras, blast furnace slag, Portlandcomposite, and pozzolanic cement) are produced.Approximately 25% of the cement produced is exported toEuropean and Middle Eastern countries.
Geology in the area of interest consists of limestone,clayey limestone, marl, and , which were formed during theUpper Miocene. These rocks are thought, on the basis of theirlithology and texture, to have been deposited in a shelfenvironment. Clayey limestone is widespread and thedominant material in the area. Its thickness is very variable,and it gradually passes into other lithologies. The rock is veryfine-grained and is composed of microcrystalline calcite, clayminerals and microcrystalline quartz, and fossil fragmentsmake up the remainder of the rock. Limestone with anmixture of silica, clay substance, and iron oxide is calledmarl. Geologically, marls are generated by the simultaneoussedimentation of calcium carbonate and clay minerals. Marlsare an excellent raw material for cement production, becausethey contain the lime and the clay component in an alreadyhomogenized condition, are easy to operate, crush, mill, andburn for the cement process. Marls appear different in colour,mainly yellow-green and blue-grey-black. There is littledifference in terms of chemical content for the differentcoloured marls. The rocks in the north of the study area havea high silica content, whereas the marls in the south of thestudy area are high in carbonate. The rock contains a consid-erable amount of fossil fragments. Sandstone is fine-grained,fossilferous, dispersive, and varies in thicknesses. The rockconsists of 20–30% free silica (quartz), 25–30% calcite, and5% fossil fragments. The surface of the cement raw materialsin the area is covered by caliche, which is 1–2 m in thicknessand Quaternary in geologic age. This rock is classified assecondary limestone, and is widespread in the region. It isformed by evaporation in dry climatic conditions.
Open pit mining is employed for the production. Theproduced material is transported by lorries to the factory. Thestudy area is approximately 500 000 m2 in extent.
The data
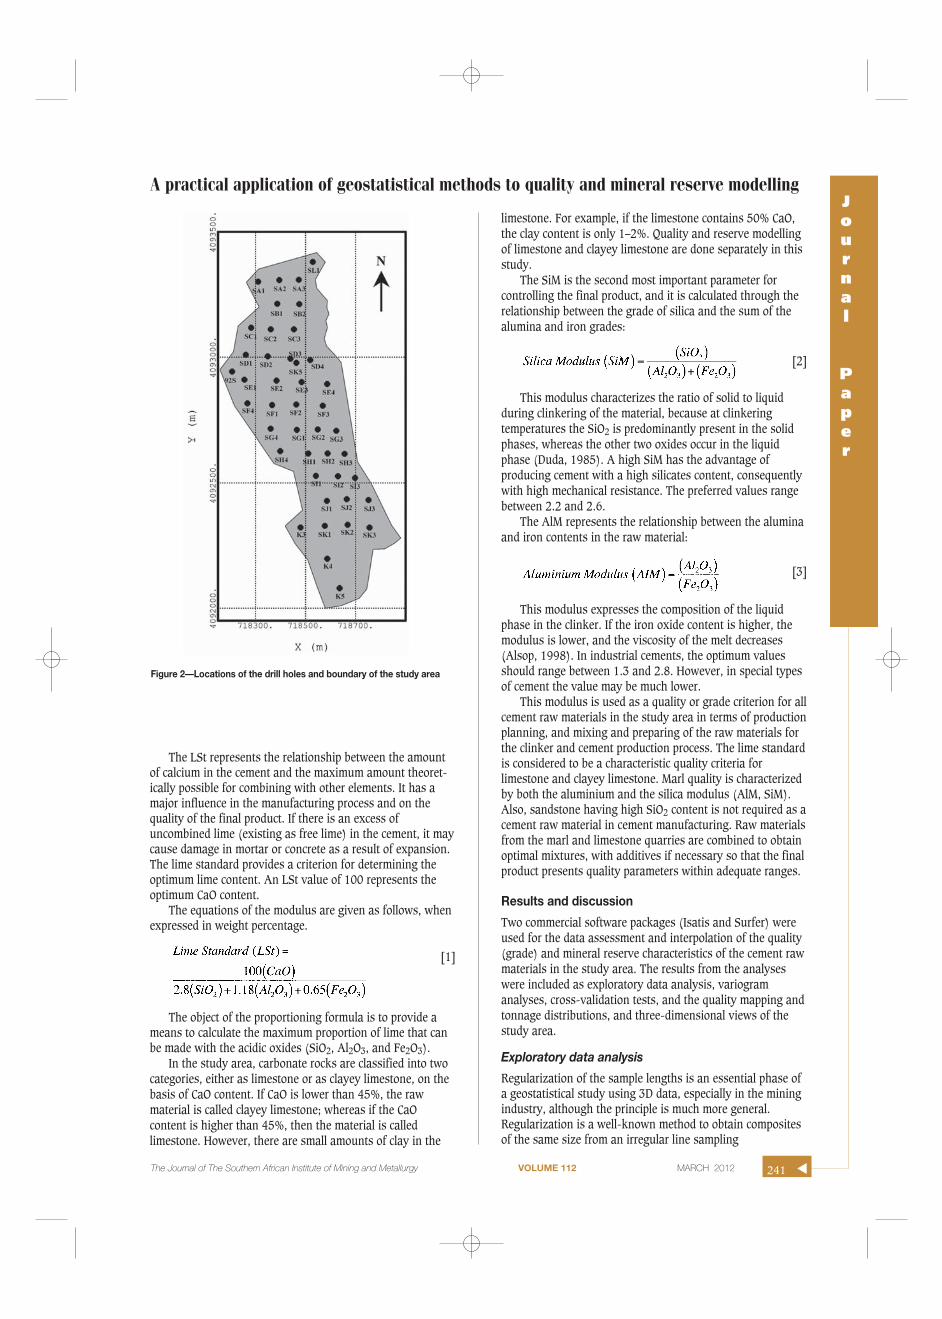
The data consisted of core samples obtained from 43drillholes, the locations of which are shown in Figure 2. Agrid design was applied for the drillhole locations. Thedistance between the collar locations was approximately80–100 m and the average depth of the holes 20 m, on thebasis of the topographical and geological conditions of thearea. All holes were drilled to 40 m altitudes above sea level,because of problems with ground water which is costly todrain. Approximately 900 m of drilling was completed. Theborehole intersections were logged. These logs include thethickness of the intersection, chemical contents andgeological description of the raw materials, and depth andcoordinates of the drill hole. Core samples were taken fromeach of the different geological formations. A total of 220representative core samples were collected.
The samples were analysed in order to determine theconcentrations of CaO, SiO2, Al2O3, Fe2O3, MgO, Na2O, K2O,and loss on ignition (LOI). The raw material quality dependson these compounds (especially CaO, SiO2, Al2O3, andFe2O3). Distribution of the compounds varies greatlyaccording to sampling location in the study area. A set ofparameters is currently used in cement manufacturing tocharacterize the quality of the raw material and to ensure thequality of the produced cement. Most of cement industries inthe world uses quality parameters such as the LSt-limestandard, SiM-silica modulus and AlM-alumunium modulus.
▲
240 MARCH 2012 VOLUME 112 The Journal of The Southern African Institute of Mining and Metallurgy
Figure 1—Location map of the study area
The LSt represents the relationship between the amountof calcium in the cement and the maximum amount theoret-ically possible for combining with other elements. It has amajor influence in the manufacturing process and on thequality of the final product. If there is an excess ofuncombined lime (existing as free lime) in the cement, it maycause damage in mortar or concrete as a result of expansion.The lime standard provides a criterion for determining theoptimum lime content. An LSt value of 100 represents theoptimum CaO content.
The equations of the modulus are given as follows, whenexpressed in weight percentage.
[1]
The object of the proportioning formula is to provide ameans to calculate the maximum proportion of lime that canbe made with the acidic oxides (SiO2, Al2O3, and Fe2O3).
In the study area, carbonate rocks are classified into twocategories, either as limestone or as clayey limestone, on thebasis of CaO content. If CaO is lower than 45%, the rawmaterial is called clayey limestone; whereas if the CaOcontent is higher than 45%, then the material is calledlimestone. However, there are small amounts of clay in the
limestone. For example, if the limestone contains 50% CaO,the clay content is only 1–2%. Quality and reserve modellingof limestone and clayey limestone are done separately in thisstudy.
The SiM is the second most important parameter forcontrolling the final product, and it is calculated through therelationship between the grade of silica and the sum of thealumina and iron grades:
[2]
This modulus characterizes the ratio of solid to liquidduring clinkering of the material, because at clinkeringtemperatures the SiO2 is predominantly present in the solidphases, whereas the other two oxides occur in the liquidphase (Duda, 1985). A high SiM has the advantage ofproducing cement with a high silicates content, consequentlywith high mechanical resistance. The preferred values rangebetween 2.2 and 2.6.
The AlM represents the relationship between the aluminaand iron contents in the raw material:
[3]
This modulus expresses the composition of the liquidphase in the clinker. If the iron oxide content is higher, themodulus is lower, and the viscosity of the melt decreases(Alsop, 1998). In industrial cements, the optimum valuesshould range between 1.3 and 2.8. However, in special typesof cement the value may be much lower.
This modulus is used as a quality or grade criterion for allcement raw materials in the study area in terms of productionplanning, and mixing and preparing of the raw materials forthe clinker and cement production process. The lime standardis considered to be a characteristic quality criteria forlimestone and clayey limestone. Marl quality is characterizedby both the aluminium and the silica modulus (AlM, SiM).Also, sandstone having high SiO2 content is not required as acement raw material in cement manufacturing. Raw materialsfrom the marl and limestone quarries are combined to obtainoptimal mixtures, with additives if necessary so that the finalproduct presents quality parameters within adequate ranges.
Results and discussion
Two commercial software packages (Isatis and Surfer) wereused for the data assessment and interpolation of the quality(grade) and mineral reserve characteristics of the cement rawmaterials in the study area. The results from the analyseswere included as exploratory data analysis, variogramanalyses, cross-validation tests, and the quality mapping andtonnage distributions, and three-dimensional views of thestudy area.
Exploratory data analysis
Regularization of the sample lengths is an essential phase ofa geostatistical study using 3D data, especially in the miningindustry, although the principle is much more general.Regularization is a well-known method to obtain compositesof the same size from an irregular line sampling
A practical application of geostatistical methods to quality and mineral reserve modellingJournal
Paper
241The Journal of The Southern African Institute of Mining and Metallurgy VOLUME 112 MARCH 2012 ▲
Figure 2—Locations of the drill holes and boundary of the study area

A practical application of geostatistical methods to quality and mineral reserve modelling
(compositing). The algorithm used in the regularizationprocess is a ‘weighted average’ of the original properties, theweights being the length of the analysed ‘cores’ that fallinside the new regularized composites. The data isregularized into 2.5 m composites. This composite length waschosen by taking into consideration the minimum andmaximum thicknesses of the formations. The summation ofgrade times length and length values were the same beforeand after compositing. Both data and composites wereunbiased, because the average grades of all composites werecentred on the same mean value. All geostatistical analyseswere carried out on the composite data.
The summary statistics of the composite data are shownin Table I. It is important to check the effect of the regular-ization on the statistics for each variable. We have seen thatthe mean remain unchanged, but the variance decrease. FromTable I, it can be seen that the values of the central tendency
measurement for LSt (limestone and clayey limestone), AlM(marl), and sandstone are very close to each other. This alsoindicates that these modulus or materials are normallydistributed. The histograms of the variables, except forsandstone, are presented in Figure 3. The histograms showthat the variables approximately a Gaussian distributionexcept for SiM (marl) (Figure 3d). The histogram of the SiM(marl) is skewed to the right, showing a departure from thesymmetrical shape of the normal distribution. The coefficientsof skewness and kurtosis for SiM (marl) are high incomparison to the coefficients of the normal distributios.Although it is not a mandatory, it is expected that a variableis normally distributed for the Kriging technique. Thus, a‘normal score’ transformation is applied to the SiM(marl).Consequently, the data distributions provide that statisticalassumptions for the geostatistical analysis are obtained. Thenext stage is the variogram analysis.
▲
242 MARCH 2012 VOLUME 112 The Journal of The Southern African Institute of Mining and Metallurgy
Table I
Summary statistics of the composited cement data
Variable Limestone Clayey limestone Marl Sandstone(LSt) (LSt) (AlM) (SiM) (% SiO2)
Count 93.00 70.00 164 164 42.00Min. 83.11 62.29 1.410 2.026 26.00Max. 494.09 208.94 2.050 4.202 46.20Mean 278.06 138.86 1.775 2.460 36.07Mod. 153.39 165.99 1.720 2.410 35.56Median 282.85 138.94 1.784 2.350 37.13Std. Dev. 103.12 35.85 0.116 0.400 4.42Variance 10 633.00 1 285.48 0.013 0.160 19.53Skewness 0.08 -0.09 -0.329 2.427 -0.36Kurtosis 2.06 2.26 3.427 8.991 2.83Variation C. 0.37 0.26 0.065 0.163 0.12
Figure 3—Histogram of the variables (a) LSt (limestone), (b) LSt (clayey limestone), (c) AIM (marl), (d) SiM (marl)

Variogram analysis
The variogram is used in various procedures during mineralresource and mineral reserve evaluation to quantify thegeological factors that affect the accuracy of estimates. Thevariogram is a critical input to geostatistical studies: firstly, itis a tool to investigate and quantify the spatial variability ofthe phenomenon being studied, and secondly, the geosta-tistical estimation or simulation algorithms require ananalytical variogram model that will reproduce the statisticalproperties of the variable depending on direction anddistance.
The semivariogram analyses have been carried out inboth the horizontal and vertical planes on the data observed.Both directional (for the directions of 0°, 45°, 90°, 13°respectively) and omnidirectional experimental semi-variograms for LSt (limestone, clayey limestone), AlM (Marl),SiM (Marl) and SiO2% (sandstone) were performedseparately. Omnidirectional horizontal and verticalvariograms of the variables, except for SiO2 (sandstone), areshown in Figure 4 and Figure 5 respectively. Directionalexperimental semivariogram graphs of the raw materialvariables show neither severe geometric nor strong zonalanisotropy. The horizontal and related vertical variogramscould not be shown in the same figures because of differentrange values of the planes (about 20 m and 1 200 m in thevertical and horizontal planes respectively), which degradethe clarity of parameters on the graph. It should be noted thathorizontal and vertical variogram graphs of sandstone (%SiO2) are not presented here, but they were calculated and
evaluated as part of the study. The parameters of both thehorizontal and vertical variogram structures are given inTable II. In the variogram graphs, the jagged continuous linesand bold continuous lines represents the experimental andmodelled variograms respectively. Visual examination of theexperimental variograms suggested that the modelledspherical, exponential, and Gaussian models are reasonablyin agreement with the data. The horizontal variogram graphsexhibit clear spatial structures. It is important to highlightthat the sill values of the theoretical models of each variablewere found close to the variance of the variables (Table I and2, Figure 4). The ranges were 275 m, 225 m, 160 m, 225 m,and 250 m for LSt (limestone, clayey limestone), AlM (Marl),SiM (Marl) and sandstone (% SiO2) respectively (Table II).On the other hand, the vertical variograms did not show aclear structure relatively to the horizontal plane, althoughboth plane variograms share the same nugget effect. Thisimplies that there is no important spatial variation in thevertical plane in contrast to the horizontal plane. Themaximum distance between two samples in the study area isabout 1 300 m. Approximately half of the maximum distancebetween two samples is considered appropriate for variogramanalysis in practise. Thus, a distance about 650–800 m isconsidered to be optimum for the variogram analyses on thestudy area in the horizontal plane, and 20–25 m in thevertical plane (Figure 4). Consequently, the variogram analysis findingsshowed that the sampling layout is effective in that thedistance between samples is large enough to determine thespatial structure.
A practical application of geostatistical methods to quality and mineral reserve modellingJournal
Paper
The Journal of The Southern African Institute of Mining and Metallurgy VOLUME 112 MARCH 2012 243 ▲
Figure 4—Omnidirectional (horizontal) variograms (a) LSt (limestone), (b) LSt (clayey limestone), (c) AIM (marl), (d) SiM (marl)

A practical application of geostatistical methods to quality and mineral reserve modelling
Kriging implementation
There are several forms of kriging including ordinary,universal, lognormal, outlier restricted, indicator, probability,multi-Gaussian, and disjunctive. Ordinary kriging is amethod that calculates point or block values directly from the semi-variogram (or covariogram) relationship without having toprovide additional qualifying data or modification of thesample data or kriging results. Several authors (Fytas et al.,1990; Dominy et al., 1997 and Roy et al., 2004) have statedthat for grade distributions with a coefficient of variation of
less than about 1.5, meaningful semivariograms can beproduced. Fytas et al. (1990) explained that parametricgeostatistics like ordinary kriging works well in deposits witha coefficient of variation of around one or less. Coefficients ofvariation of all the variables for the study area are below 0.4(Table I). Ordinary kriging was chosen as the estimationmethod to evaluate in this study. The correlation matrix ofthe cement modulus is given in Table III. The table showsthat there is no correlation amongst the modulus. Therefore,co-kriging was not applied to estimate grade and reserves ofthe cement raw materials.
▲
244 MARCH 2012 VOLUME 112 The Journal of The Southern African Institute of Mining and Metallurgy
Figure 5—Vertical variograms (a) LSt (limestone), (b) LSt (clayey limestone), (c) AIM (marl), (d) SiM (marl)
Table II
The variogram structure parameters of the cement variables
Limestone Clayey limestone Marl Sandstone(LSt) (LSt) (AlM) (SiM) (% SiO2)
Horizontal plane Variogram model Exponential Spherical Exponential Exponential SphericalLag distance (m) 25 31 30 33 30Number of lags 31 27 25 28 24
Sill 8.500 1.100 0.007 0.56 1.05Range (m) 275 225 160 225 250
Nugget Effect 1.000 250 0.007 0.44 0.1
Vertical plane Variogram model Gaussian Gaussian Gaussian Spherical GaussianLag distance (m) 2.5 2 2.5 2 1.7Number of lags 7 9 10 15 10
Sill 3.800 175 0.005 0.22 0.7Range (m) 11 9 18 11 13
Nugget Effect 1.000 250 0.007 0.45 0.1

Cross-validation tests
Cross-validation is a procedure that checks the compatibilitybetween a set of data and a structural model. This procedureconsiders each data point in turn, removing it temporarilyfrom the data set, and using its neighbouring information topredict (through a kriging procedure) the value of thevariable at its location and using the model previously fitted.The estimation result is compared to the actual value toproduce the estimation error, standardized by the standarddeviation of estimation. Another essential parameter of thisprocess is the neighbourhood concept, which tells the systemwhich data points, located close enough to the target will beused in the estimation. In this case study, because of thesmall number of points, we use the unique neighbourhood,which means that all information will be systematically usedfor the estimation of any target point in the field. In the caseof cross-validation, each data point is estimated fromneighbouring data. Rotation angles were not used foranisotropy as this was not present in the variogram models.The search geometry was an ellipsoid. The ellipsoid is uniquein the horizontal plane and different in the vertical plane.Four kriging sectors for clayey limestone, marl, andsandstone, and two sectors for limestone, were chosenrespectively. The number of sectors, optimum sample pointsused in the sectors, and the range of the variables wereindividually adjusted on the basis of the best cross-validationresults. Related neighbouring and search radius parametersare shown in Table IV.
The procedure followed by Isatis (Geovariances, 2006) iscross-validation performed to cross-check the models and thedata. The mean of the standardized squared error (MSSE)and mean error (ME) of the exponential and spherical modelsproduced the most favourable results, indicating that thesearch strategy, neighbourhood parameters, model, andmodel parameters etc. used in the estimation wereappropriate. Furthermore, the ME of the exponential andspherical models proved that the unbiasedness condition ofthe kriging algorithm worked properly. Therefore, theexponential, spherical and Gaussian models were chosen tocalculate the variables for the cement raw materials.
Cross-validation of the model is shown in Figure 6 for thevariable LSt (limestone). Cross-validation graphs of the othervariables are not presented here, as the results for thesevariables showed the same behaviour as those for LSt(limestone).
Cross-validation tests were carried out as a 95%confidence interval. Dashed lines (Figure 6c, 6d) delineatethe outliers from the valid points. The pluses (Figure 6d)indicate that the data is included into the 95% quantile of anormal distribution, that is, to the samples lying inside the95% confidence limit of a normal distribution. It is likely thatthe points outside the confidence limits imply that the data isover/underestimated outliers resulting from estimation error.
A sample is considered as an outlier when itsstandardized estimation error (SEE) is larger than a giventhreshold in absolute value (Geovariances, 2006). Outliersare depicted on the base map (Figure 6a). A scatter diagramof the observed data versus estimated value is shown inFigure 6b, the histogram of the SEE is shown Figure 6c, anda scatter diagram of the estimated value versus the SEE isshown in Figure 6d. Outliers of the variables did not followany particular pattern, as is shown in Figure 6a-d.
Scatter plots of observed data versus estimated valueswith conditional expectation curves (the 45° diagonal line) inFigures 6b show a slight conditional bias. This indicates thattrue and estimated values do not match exactly. Cross-validation graphs of estimated values versus SEE showedthat the errors in estimation are within acceptable limits,excluding the outliers (Figure 6d). Histograms of SEE for allthe variables (Figure 6c) were in good agreement with thefindings of the cross-validation analyses mentioned above.
The tabulated statistical results of the cross-validation onthe estimation error and standardized error (mean andvariance) are presented in Table V. Each model satisfies theglobal unbiased condition reasonably, where distributions oferrors are centred on a zero mean. The spread of the errorsand the correlation coefficient of the known values againstthe kriged estimates were used to determine an adequatesearch strategy. On this basis, a search radius and the use ofthe nearest points for each variable were selected as anoptimal model. In theory, it is expected that the mean error
A practical application of geostatistical methods to quality and mineral reserve modellingJournal
Paper
The Journal of The Southern African Institute of Mining and Metallurgy VOLUME 112 MARCH 2012 245 ▲
Table IV
Search radius and neighbourhood parameters for cross-validation testing
AlM SiM LSt LSt SiO2%
(Limestone) (clayey limestone) (Sandstone)
Number of angular sectors 2 4 4 4 3Optimum samples per sector 6 3 3 2 2
X (m) 160 225 275 225 250Search Radius Y (m) 160 225 275 225 250
Z (m) 18 11 11 9 13
Table III
Correlation matrix of the cement modulus
AlM SiM LSt SiO2
AlM 1.00 0.25 -0.37 0.43SiM 0.25 1.00 -0.07 0.23LSt -0.37 -0.07 1.00 -0.49SiO2 0.43 0.23 -0.49 1.00

A practical application of geostatistical methods to quality and mineral reserve modelling
and the variance of the estimation are equal to 0 and 1respectively. The mean error proves that the unbiasedcondition of the kriging algorithm worked efficiently. Thevariance of the estimation standardized error measures theratio between the experimental estimation error and thekriging variance. Consequently, the cross -results showedthat the estimation is reasonably acceptable (Table V).
Grade (quality) and mineral reserve estimation
The objective of geostatistical estimation for an industrialdeposit evaluation is to provide a continuous representationof grade variation that accounts for structural, lithological,and mineralogical discontinuities.
At this stage, a grid design was applied over the studyarea (Table VI). The neighbourhood and variogramparameters were used for the estimation. The grade-tonnagecurves and tonnage estimations were carried out using theordinary block kriging method. Co-kriging is another interpo-lation technique that allows one to better estimate map valuesby kriging with auxiliary data. Co-kriging requires muchmore for estimation, including estimating the autocorrelationfor each variable as well as all cross-correlations. Throughthe interpretation of the correlation matrix of the variables atthe same points, there is no correlation among the variables(Table III). For this reason, multivariate techniques were notperformed for the estimation process.
The ordinary block kriging method has mostly beenapplied to sedimentary deposits such as coal and industrialraw mineral deposits.
The total tonnage above cut-off grade is calculated usingthe following equation:
[4]
where∑Ti = Total tonnage of 1 block in percentageVb = Volume in m3 of 1 blockd = Density (t/ m3).
▲
246 MARCH 2012 VOLUME 112 The Journal of The Southern African Institute of Mining and Metallurgy
Figure 6—Cross-validation graphs for LSt (limestone). (a) The base map showing the locations of the tested data points, (b) The scatter plot of the truevalues Z against the estimated values Z*, (c) The histogram of the standardized estimation errors, (d) The scatter plot of the standardized estimation errorsvs. the estimated values Z*
Table VI
Grid design parameters for the estimation volume
X (m) Y (m) Z (m)
71,850 4 092 000 3625 25 1.528 60 26
Table V
The statistical results of the cross validation tests
Variable Standard errorMean Variance
Limestone (LSt) 0.098 0.999Clayey limestone (LSt) 0.033 1.054Marl (SiM) -0.015 0.992Marl (AlM) 0.005 1.010SiO2 % (sandstone) 0.008 1.017

Mean grade above cut-off is calculated using thefollowing equation:
[5]
wheremi = Mean grade unitn = Number of samples above cut-off.Bulk densities of the cement raw materials were
determined from core samples. The mineral reserve estimateof the raw materials was made within the polygon boundary(Figure 2).
As mentioned previously, LSt for limestone > 45 % CaO,clayey limestone < 45 % CaO, AlM and SiM for marl, andSiO2% for sandstone have been used as the quality (grade)criteria. The cut-off grade for cement raw materials isdetermined as a minimum value of the cement modulus(such as LSt, AlM, SiM, and SiO2 content of sandstone).Sometimes, minimum values of the modulus are required,because of proportional mixing of the raw material. Figure 7shows the cut-off grade or quality of the cement rawmaterials versus the tonnage for LSt and AlM (marl). Fromthe figures, raw material tonnage in a given quality value orin particular quality intervals can be easily seen. The totalmineral reserves of the raw materials are given in Table VII.Consequently, these results can form the basis of productiondesign and future planning of raw materials, clinker andcement production.
Quality mapping
The procedure of evaluating normal distributions of data,
variogram analysis, and cross-validation tests was carriedout prior to constructing a contour map of the cementmodulus. The distribution of the modulus in all geologicalformations of the area was considered in quality mapping.The values at the 43 680 grid nodes of each quality moduluswere estimated by ordinary block kriging using theexponential, spherical variogram, and Gaussian models of themodulus. Greyscale maps were produced by using griddeddata to determine quality distribution and variability of thecement modulus in all the raw materials in the study area. Itshould be noted that a map of each quality modulus wasplotted at specific levels in the ground (at 40.5 m, 43.5 m,46.5 m, 49.5 m, 52.5 m, 55.5 m, and 58.5 m). The maps atthese specific levels are not illustrated here, and only thecontour map of the LSt modulus at the 43.5 m level is shownin Figure 8. Interpretation of the maps is relatively simpleand practical. These maps assist the operational andproduction management of the raw materials, and inidentifying mix and the proportions of the materials for thecement manufacturing process.
A three-dimensional (3D) perspective view for the studyarea is shown in Figure 9. This figure shows the distributionof the main variables in the area. When preparing thisdiagram, each estimated cell was designated with differentcolours according to the presence of each related variable,resulting in a four-colour 3D view of the study area wasobtained. The vertical plane scaling has been exaggerated toshow the variable locations in the deposit. This solid modelenables an operational design and future production planningof the deposit (such as monthly or yearly production).
A practical application of geostatistical methods to quality and mineral reserve modellingJournal
Paper
The Journal of The Southern African Institute of Mining and Metallurgy VOLUME 112 MARCH 2012 247 ▲
Table VII
Total mineral reserves of the raw materials
Limestone Clayey limestone Marl Sandstone (SiO2)
(LSt) (LSt) (AlM) (SiM)
Total reserve 5 913 844 3 620 925 10 219 491 10 219 491 2 425 313(tons) 9 534 769 10 219 491
19 754 26022 179 573
Figure 7—Cutt-off grade versus total tonnage (a) LSt (limestone), (b) AIM (marl)

Conclusions
The following conclusions can be drawn from this case study.
➤ Geostatistics provides a set of tools and techniques foraddressing the problem of evaluating cement rawmaterial deposits and mineral reserve features.Variograms can be used to successfully characterize thespatial variability of deposit quality
➤ The study showed the benefits of the using geosta-tistical methods in the assessment of data, sampling
strategy, and estimation of values at unsampled areasto determine quality and mineral reserve characteristics
➤ Sufficient good, quality data and exploratory analysisof the data is essential for raw materials and clinkerproduction
➤ Anisotropy was not detected in the three-dimensionalexperimental semivariograms of the raw materials. Theomnidirectional horizontal experimental variogram ofeach variable was found to be the most representativeby the fitted exponential, spherical, and Gaussian
A practical application of geostatistical methods to quality and mineral reserve modelling
▲
248 MARCH 2012 VOLUME 112 The Journal of The Southern African Institute of Mining and Metallurgy
Figure 8—Kriging contour map of the LSt modulus at 43.5 m level of the underground
Figure 9—Three-dimensional view of the study area

A practical application of geostatistical methods to quality and mineral reserve modellingJournal
Paper
The Journal of The Southern African Institute of Mining and Metallurgy VOLUME 112 MARCH 2012 249 ▲
models. Variogram analyses exhibited clear spatialstructures. This showed that the sampling strategy waseffective and the distance between the samples issufficient to determine raw material quality andmineral reserve characteristics. These models havebeen tested by cross-validation analysis, which showedthat the models with their parameters and krigingsearch parameters are representative for the variablesin the study area
➤ The quality and tonnage curve for the raw materialswas constructed and the tonnages of the raw materialvariables for a particular quality interval were alsocalculated, since these are the basis for efficient cementdeposit operation and production planning
➤ Kriged maps for the cement modulus at a particularunderground level were produced. These contour mapsshowed the extent, quality variability, and propermixing of the raw materials required for clinkerproduction
➤ A 3D perspective view of the study area wasconstructed. The view showed the thickness and depthof the formations for underground modelling. Thisprovides an operational design for future productionplanning of the cement raw materials for geologists andmining engineers.
References
ALMEDIA, J., ROCHA, M., and TEIXEIRA, A. 2004, Spatial Characterization ofLimestone and Marl Quality in a Quarry for Cement Manufacturing, vol. 1,
Leuangthong, O. and Deutsch, C.V. (eds.). Springer. Geostatistics Banff,2004.
ALSOP, P.A. 1998. Cement Plant Operations Handbook for Dry Process Plants.2nd edn., Tradeship Publications Ltd.
CLARK, I. and HARPER, W.V. 2000. Practical Geostatistics 2000. Greyden Press,Columbus.
CLARK, I. 1979. Practical Geostatistics. Elsevier Science Publications, London.1979.
DAVID, M. 1997. Geostatistical Ore Reserve Estimation, Elsevier ScientificPublishing, Amsterdam.
DAVID, M. 1988. Handbook of Applied Advanced Geostatistical Ore ReserveEstimation. Elsevier Science Publishing, Amsterdam.
DOMINY, S.C., ANNELS, A.E., CAMM, G.S., WHEELER, P., and BARR, S.P. 1997.Geology in the resource and reserve estimation of narrow vein deposits.Exploration and Mining Geology, vol. 6. pp. 317–333.
DUDA, W.H. 1985. Cement Data Book: International Process Engineering in theCement Industry, vol.1, 3rd edn., Bauverlag GMBH.
FYTAS, K., CHAOVAL, N., and LAVIGNE, M. 1990. Gold deposit estimation usingindicator Kriging. CIM Bulletin, vol. 934. pp. 77–83.
GEOVARIANCES. 2006. Isatis Software Manual, France.
ISAAKS, E.H. and SRIVASTAVA, R.M. 1989. An Introduction to AppliedGeostatistics. Oxford University Press, New York.
JOURNEL, A.G. and HUIJBREGTS, CH.J. 1978. Mining Geostatistics. Academic Press,London.
KRIGE, D.G. 1951. A Statistical Approach to Some Basic Mine ValuationProblems on the Witwatersrand. Journal of the Chemical, Metallurgicaland Mining Society of South Africa, vol. 52, no. 6. pp. 119–139.
MARCOTTE, D., NARAGHI, K., BELLEHUMEUR, C., and GLOAGUEN, E. 2005. Anapplication of multivariate simulation in the cement industry.Mathematical Geology, vol. 37, no. 55. pp. 493–512.
ROY, D., BUTT, S.D., and FREMPONG, P.K. 2004. Geostatistical ResourceEstimation for the Poura Narrow-vein Gold Deposit. CIM bulletin, vol. 97,no. 1077. pp. 44–51. ◆