a report to for: george massey tunnel replacement project · a report to for: george massey tunnel...
TRANSCRIPT
A Report to
For:
GEORGE MASSEY TUNNEL REPLACEMENT PROJECT COLLISION DATA ANALYSIS
Submitted By:
SW1223
August 2015
GEORGE MASSEY REPLACEMENT PROJECT COLLISION DATA ANALYSIS - DRAFT
SW1223 – August 2015 1
1. INTRODUCTION
As part of the George Massey Tunnel Replacement Project, the Ministry of
Transportation and Infrastructure (the Ministry) requested a collision data analysis of
the Highway 99 corridor from the US Border to the Oak Street Bridge. Specifically, the
following tasks were requested as part of the study:
• Calculate average existing collision rates on the segmented study corridor; and
• Determine collision trends and patterns.
The purpose of this document is to outline the methodologies and assumptions used in
the analysis, and present the findings.
2. DATA SOURCES
There are two sources of collision data in British Columbia, and both were obtained as
part of this study:
• The Ministry’s Collision Information System (CIS), and
• Insurance Corporation of British Columbia (ICBC) Claims Data.
The CIS database of collisions is based on motor vehicle accident reports that are
generated by police-attended collisions. As such, the database underreports the actual
number of collisions because not all collisions are police-attended. All collisions are
geocoded using the Ministry’s Landmark Kilometre Inventory (LKI), which identifies
collision locations to the nearest 100 m. Collision configuration is provided in the
dataset. Collisions are also classified by severity – property damage only, injury and
fatality.
The ICBC claims data is as the name suggests, data from insurance claims after a
collision has occurred. ICBC claims data typically produces the most complete dataset.
Collisions are geocoded by latitude and longitude to the nearest landmark. Collision
configuration and severity is provided in the dataset. Unlike the CIS dataset, collisions
are classified as either property damage only or casualty, the latter of which is a
combination of injuries and fatalities.
Data from 2008 – 2012 was obtained for both datasets.
GEORGE MASSEY REPLACEMENT PROJECT COLLISION DATA ANALYSIS - DRAFT
SW1223 – August 2015 2
3. AVERAGE COLLISION RATES
The Ministry publishes provincial average collision rates every four years on their
Highway Planning website. These average collision rates are calculated using data
from the CIS database. Thus, all average collision rate calculations presented in this
study were based on the CIS data.
Generally speaking, the average collision rate of a highway segment is calculated by
using Formula 1:
Formula 1
# # 365 1,000,000
The average collision rate is measured in units of collisions per million vehicle
kilometres (c/mvk), and provides a measure of the frequency of collisions in the study
segment.
3.1 Provincial Average Collision Rate
Most of the Highway 99 corridor would be classified under the “urban-freeway-divided-
4 lane+” (UFD4) highway classification. According to the Ministry Average Provincial
Collision Rates, UFD4 facilities have a collision rate of 0.30 c/mvk. This rate was
calculated using the tools and methodology embedded within the CIS. While Formula 1
was still used as the basis of these calculations, the system uses historic AADT volumes
and projections, examines the highway by incremental segments, and aggregates the
results. It should be noted that this average is calculated using the following highway
segments:
• Highway 1 from Horseshoe Bay to 160 Street;
• Highway 91 from Nordel Way to Highway 99;
• Highway 99 from Bridgeport Road to the northern end of the Oak Street Bridge;
and
• Highway 91A from Nordel Way to the northern end of Queensborough Bridge.
GEORGE MASSEY REPLACEMENT PROJECT COLLISION DATA ANALYSIS - DRAFT
SW1223 – August 2015 3
3.2 Average Collision Rate – Highway 99
The tools embedded in the CIS were not used to calculate average collision rates on
Highway 99. It was desired to simplify the methodology and make it easier to replicate
for future analysis. The study corridor was segmented and a separate collision rate
was calculated for each segment and direction.
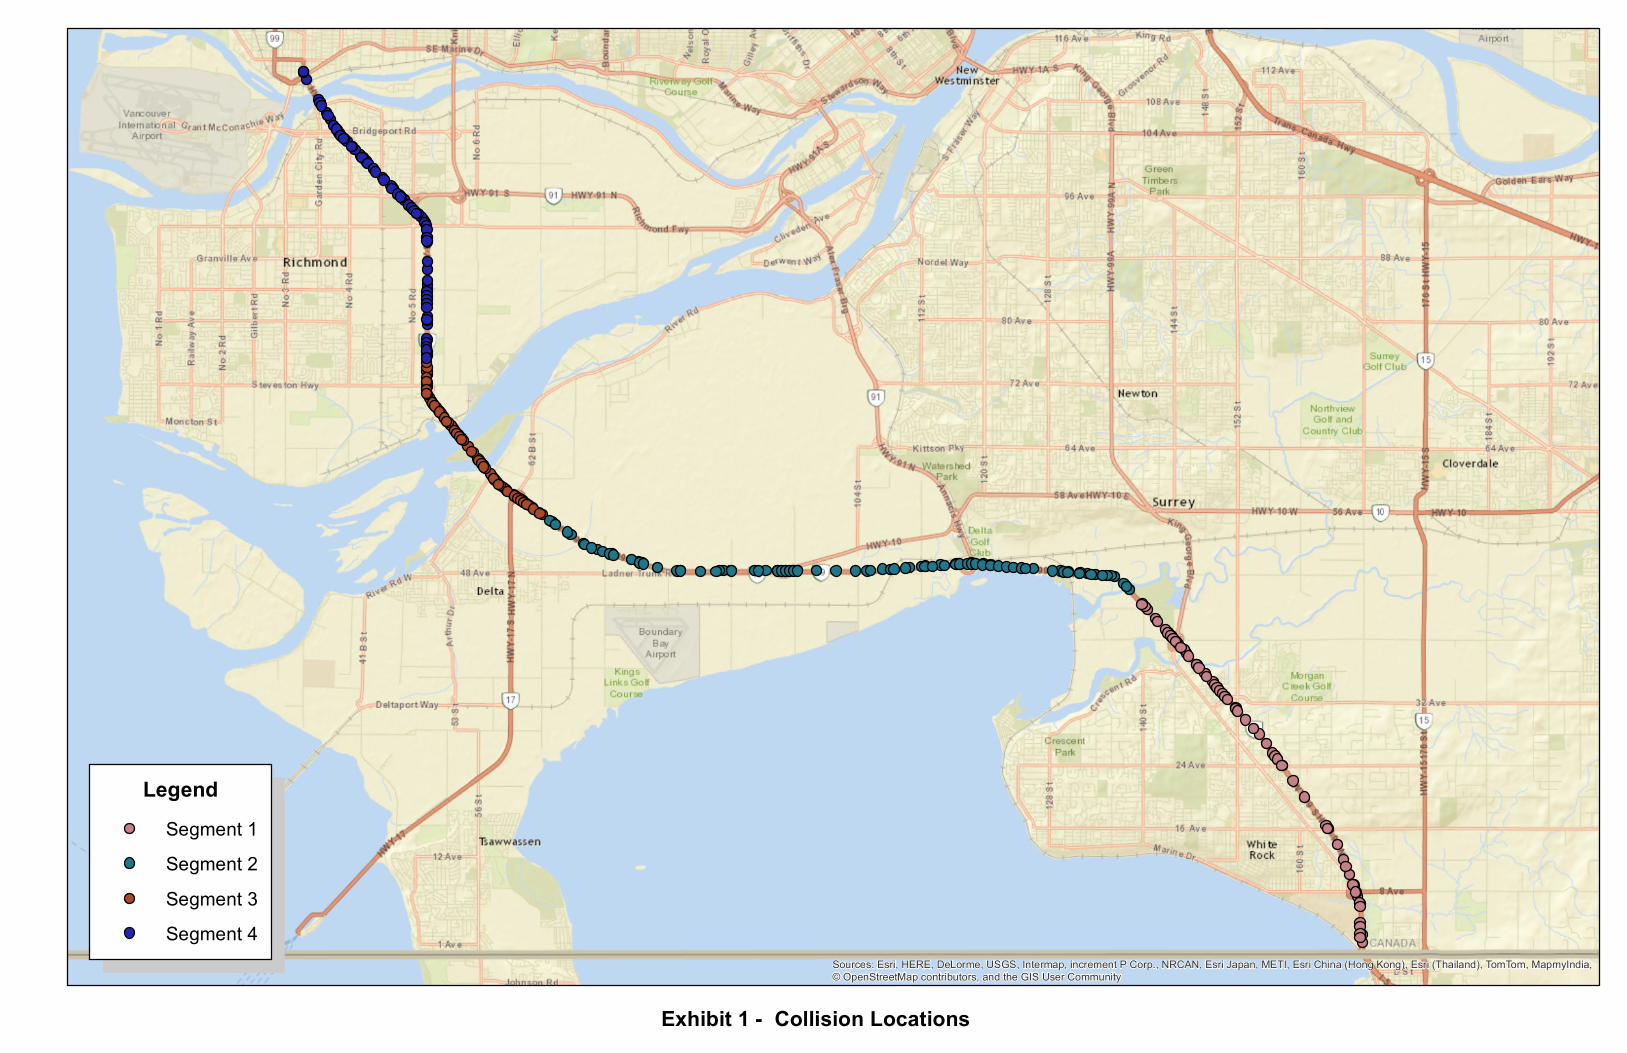
The Highway 99 corridor was divided into four segments:
1. US Border to Serpentine River;
2. Serpentine River to Highway 17A;
3. Highway 17A to Steveston Highway; and
4. Steveston Highway to Oak Street Bridge.
Exhibit 1 shows the location of the collisions on Highway 99, colour coded by the
segments described above.
Each segment contains at least one permanent count station to provide AADT statistics
and the traffic patterns within each segment are quite similar. Therefore, it would be
reasonable to calculate a collision rate for each individual segment. The estimated
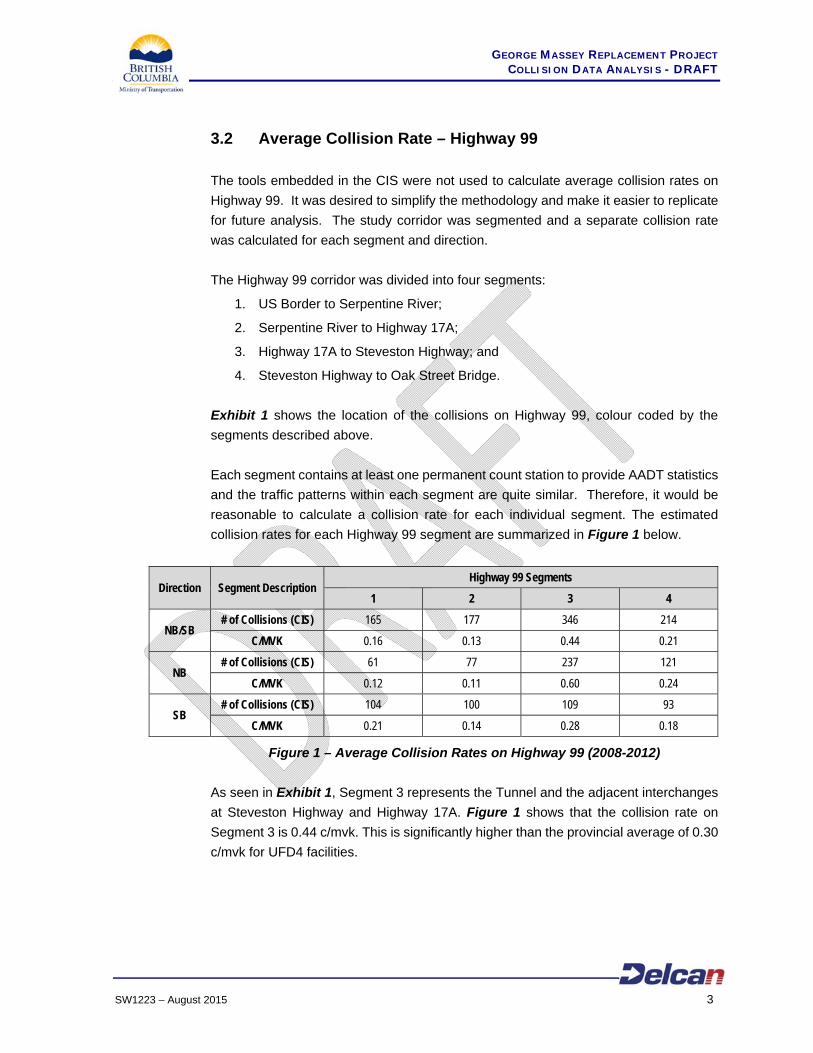
collision rates for each Highway 99 segment are summarized in Figure 1 below.
Direction Segment Description Highway 99 Segments
1 2 3 4
NB/SB # of Collisions (CIS) 165 177 346 214
C/MVK 0.16 0.13 0.44 0.21
NB # of Collisions (CIS) 61 77 237 121
C/MVK 0.12 0.11 0.60 0.24
SB # of Collisions (CIS) 104 100 109 93
C/MVK 0.21 0.14 0.28 0.18
Figure 1 – Average Collision Rates on Highway 99 (2008-2012)
As seen in Exhibit 1, Segment 3 represents the Tunnel and the adjacent interchanges
at Steveston Highway and Highway 17A. Figure 1 shows that the collision rate on
Segment 3 is 0.44 c/mvk. This is significantly higher than the provincial average of 0.30
c/mvk for UFD4 facilities.
Sources: Esri, HERE, DeLorme, USGS, Intermap, increment P Corp., NRCAN, Esri Japan, METI, Esri China (Hong Kong), Esri (Thailand), TomTom, MapmyIndia,© OpenStreetMap contributors, and the GIS User Community
Exhibit 1 - Collision Locations
LegendSegment 1Segment 2Segment 3Segment 4
GEORGE MASSEY REPLACEMENT PROJECT COLLISION DATA ANALYSIS - DRAFT
SW1223 – August 2015 4
4. ICBC CLAIMS DATA
Collision data was provided by ICBC. Collision data for intersections adjacent to
Highway 99 and nearby routes was collected. The data covered the period from 2008
to 2012. Data for 2013 was not included as not all insurance claims would have been
processed at the time of the analysis (January/February 2014). In total, 6,024 claims
were processed in the study corridor between 2008 and 2012.
4.1 Collision Locations
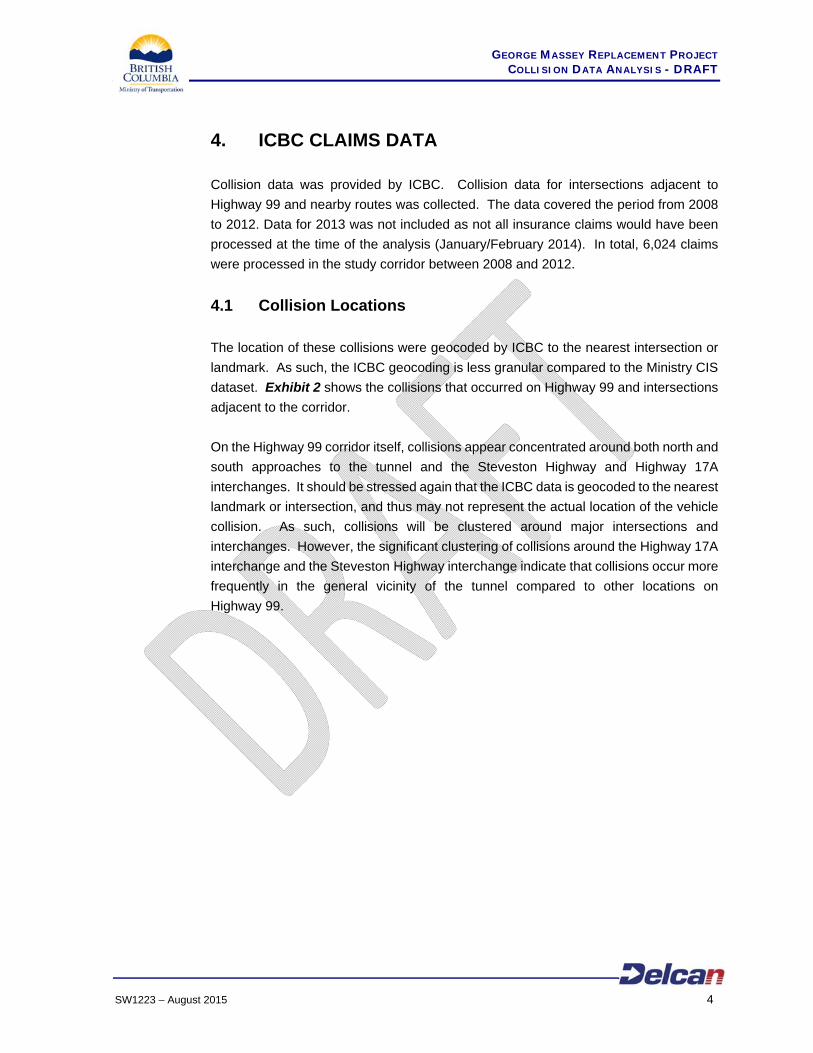
The location of these collisions were geocoded by ICBC to the nearest intersection or
landmark. As such, the ICBC geocoding is less granular compared to the Ministry CIS
dataset. Exhibit 2 shows the collisions that occurred on Highway 99 and intersections
adjacent to the corridor.
On the Highway 99 corridor itself, collisions appear concentrated around both north and
south approaches to the tunnel and the Steveston Highway and Highway 17A
interchanges. It should be stressed again that the ICBC data is geocoded to the nearest
landmark or intersection, and thus may not represent the actual location of the vehicle
collision. As such, collisions will be clustered around major intersections and
interchanges. However, the significant clustering of collisions around the Highway 17A
interchange and the Steveston Highway interchange indicate that collisions occur more
frequently in the general vicinity of the tunnel compared to other locations on
Highway 99.
Sources: Esri, HERE, DeLorme, USGS, Intermap, increment P Corp., NRCAN, Esri Japan, METI, Esri China (Hong Kong), Esri (Thailand), TomTom, MapmyIndia,© OpenStreetMap contributors, and the GIS User Community
Exhibit 2 - ICBC Claims Data Collision Frequency - Highway 99 Corridor (2008-2012)
Total Collisions1 - 100
101 - 200
201 - 300
301 - 400
401 - 500
500+

GEORGE MASSEY REPLACEMENT PROJECT COLLISION DATA ANALYSIS - DRAFT
SW1223 – August 2015 5
4.2 Highway 99 Collision Trends
This section focuses on the 6024 collisions that occurred on Highway 99 or possibly
due to traffic conditions on Highway 99.
Figure 2 shows the collision frequency on Highway 99 by year and severity.
Figure 2 – Collision Frequency by Year
Generally, collision frequency has increased on an annual basis since 2009. Collision
severity has remained relatively constant in the past five years, ranging between 33%
and 39% casualties. It should be noted again that the ICBC database classifies collision
severity using two categories only – property damage only and casualties. Casualties
include collisions that cause injuries and fatalities.
Figure 3 shows the collision frequency on Highway 99 and adjacent intersections by
month and severity.
GEORGE MASSEY REPLACEMENT PROJECT COLLISION DATA ANALYSIS - DRAFT
SW1223 – August 2015 6
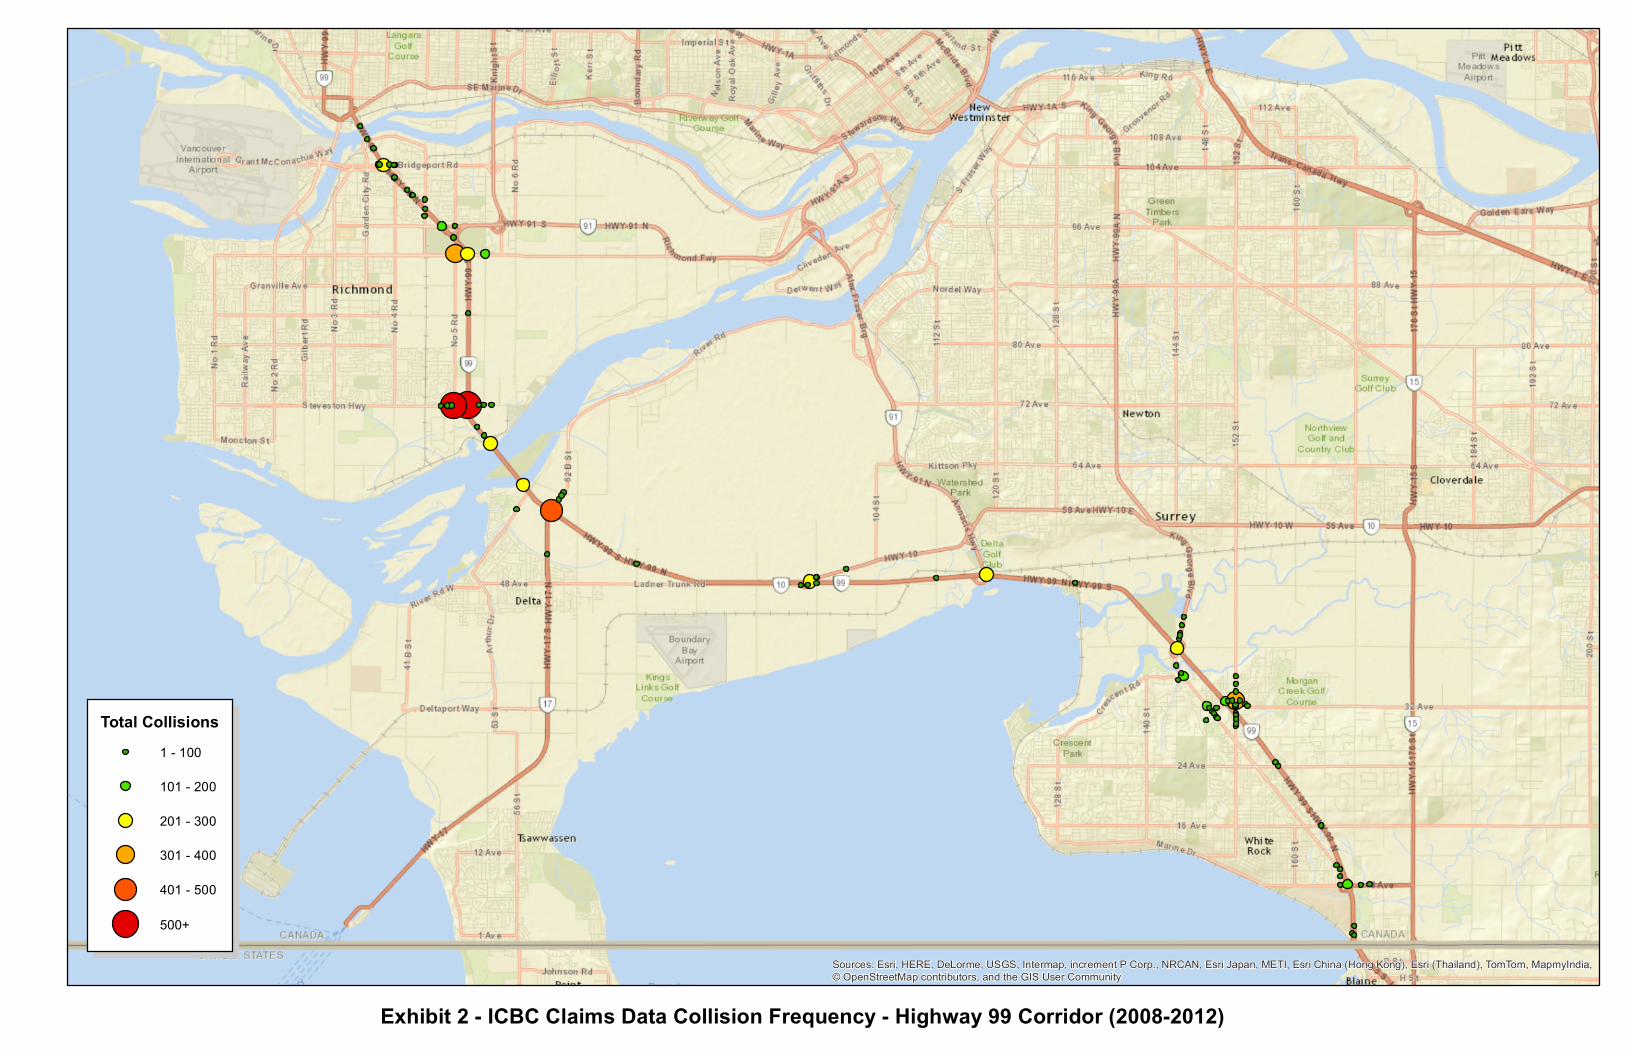
Figure 3 – Collision Frequency by Month
Collisions occurred more frequently in mid-Spring (April and May) and late-Fall (October
and November). January and February experienced the fewest collisions. Collision
severity ranges from 32% casualties in December to 40% casualties in March.
Figure 4 shows the collision frequency on Highway 99 and adjacent intersections by
day of week and severity.
Figure 4 – Collision Frequency by Day of Week
GEORGE MASSEY REPLACEMENT PROJECT COLLISION DATA ANALYSIS - DRAFT
SW1223 – August 2015 7
Collision frequency appeared fairly consistent between Tuesday and Fridays. Far fewer
collisions occurred on the weekends, likely due to reduced traffic volumes. Fewer
collisions occur on Monday compared to the other weekdays. This may be due to a
combination of the prevalence of statutory holidays on Monday, and human behavior.
Collision severity does not vary significantly between each day of the week.
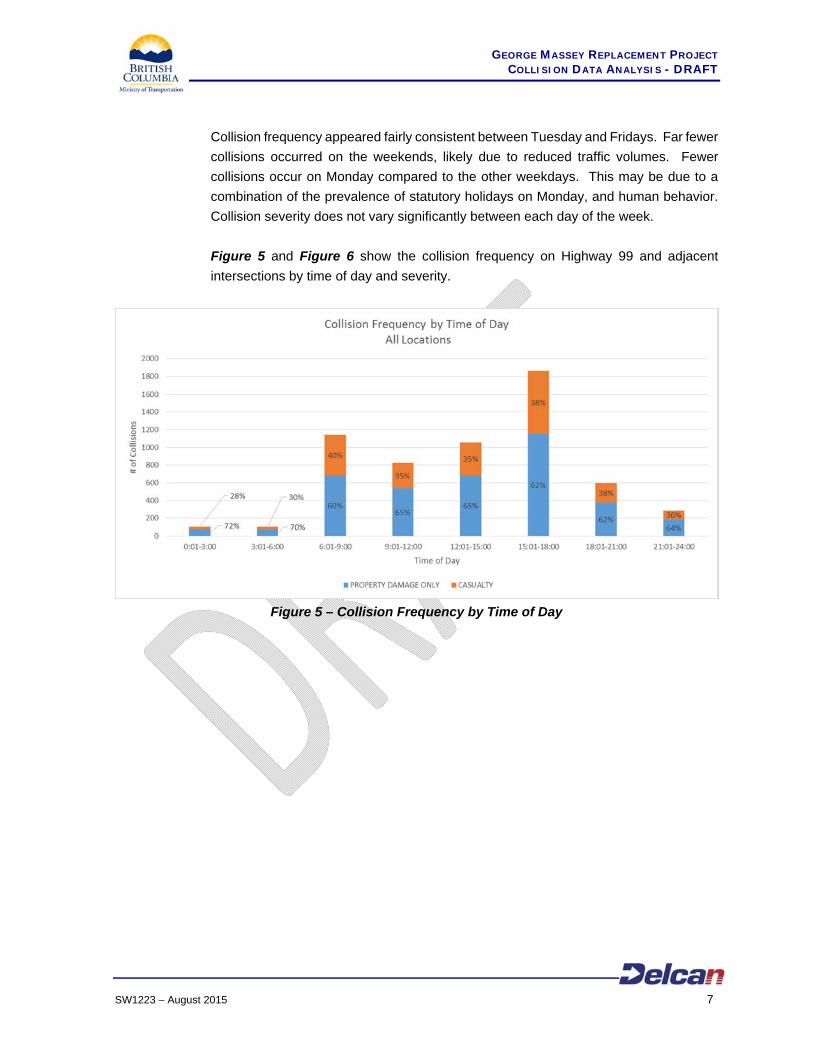
Figure 5 and Figure 6 show the collision frequency on Highway 99 and adjacent
intersections by time of day and severity.
Figure 5 – Collision Frequency by Time of Day
GEORGE MASSEY REPLACEMENT PROJECT COLLISION DATA ANALYSIS - DRAFT
SW1223 – August 2015 8
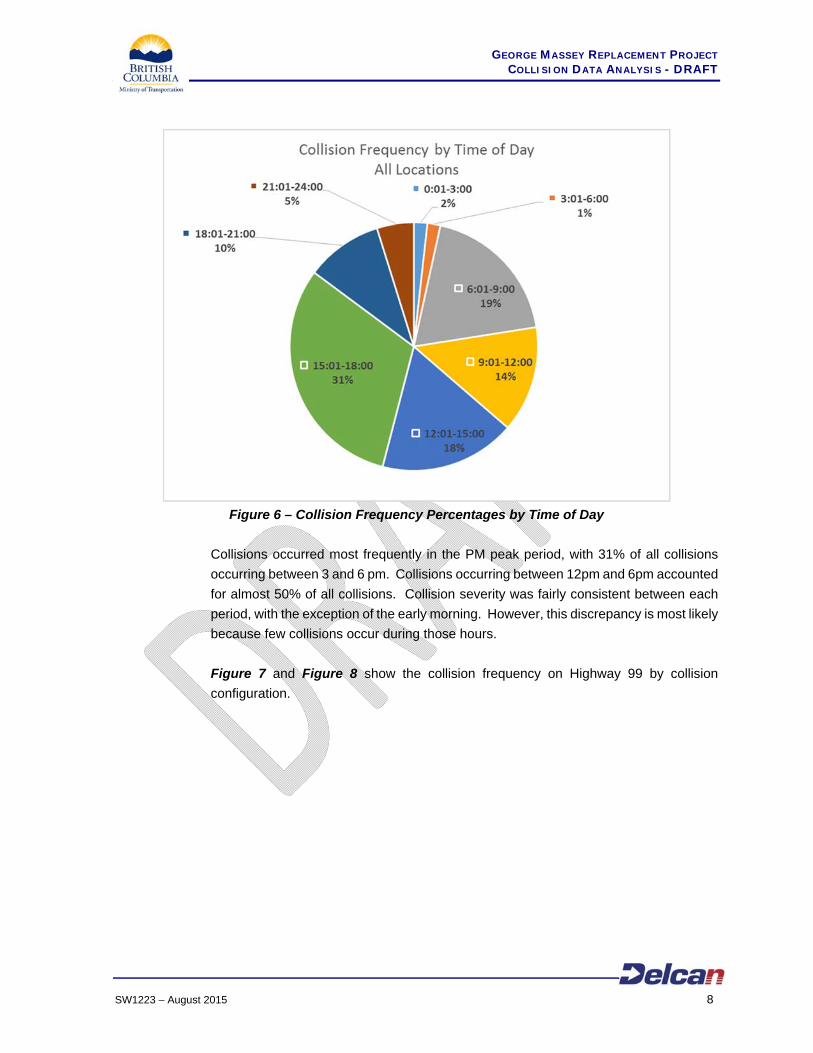
Figure 6 – Collision Frequency Percentages by Time of Day
Collisions occurred most frequently in the PM peak period, with 31% of all collisions
occurring between 3 and 6 pm. Collisions occurring between 12pm and 6pm accounted
for almost 50% of all collisions. Collision severity was fairly consistent between each
period, with the exception of the early morning. However, this discrepancy is most likely
because few collisions occur during those hours.
Figure 7 and Figure 8 show the collision frequency on Highway 99 by collision
configuration.
GEORGE MASSEY REPLACEMENT PROJECT COLLISION DATA ANALYSIS - DRAFT
SW1223 – August 2015 9
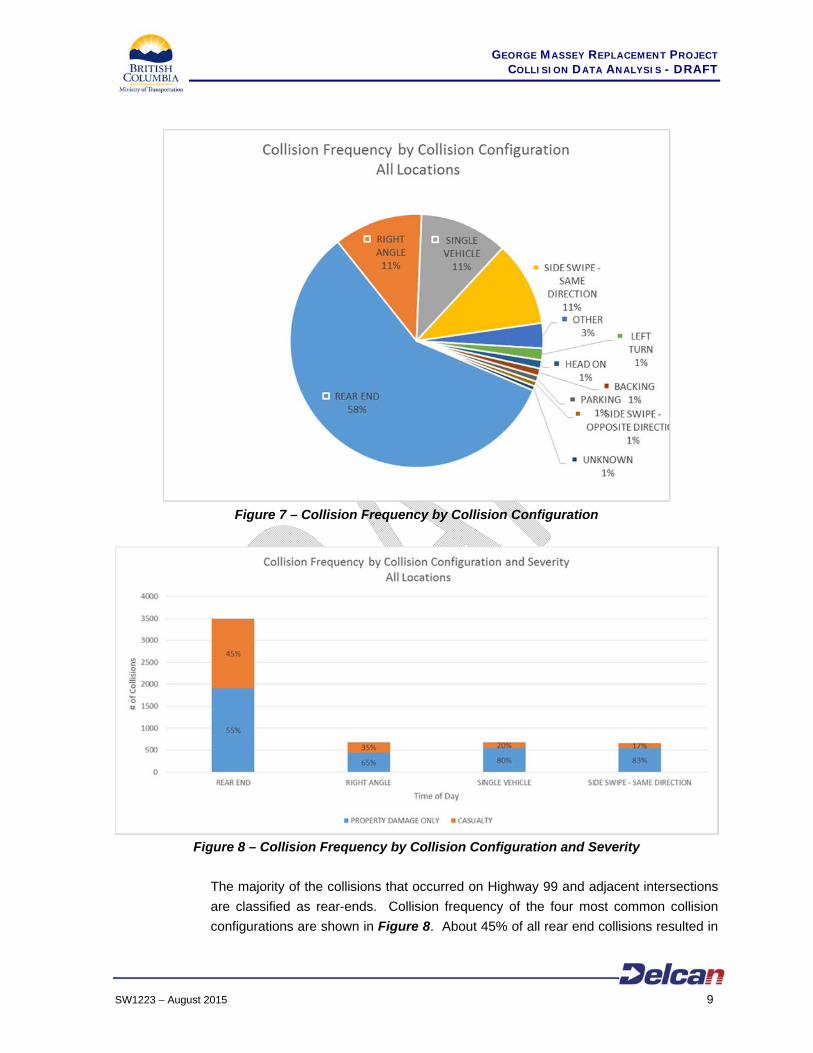
Figure 7 – Collision Frequency by Collision Configuration
Figure 8 – Collision Frequency by Collision Configuration and Severity
The majority of the collisions that occurred on Highway 99 and adjacent intersections
are classified as rear-ends. Collision frequency of the four most common collision
configurations are shown in Figure 8. About 45% of all rear end collisions resulted in
GEORGE MASSEY REPLACEMENT PROJECT COLLISION DATA ANALYSIS - DRAFT
SW1223 – August 2015 10
casualties. Other collision configurations generally resulted in a lower percentage of
casualties.
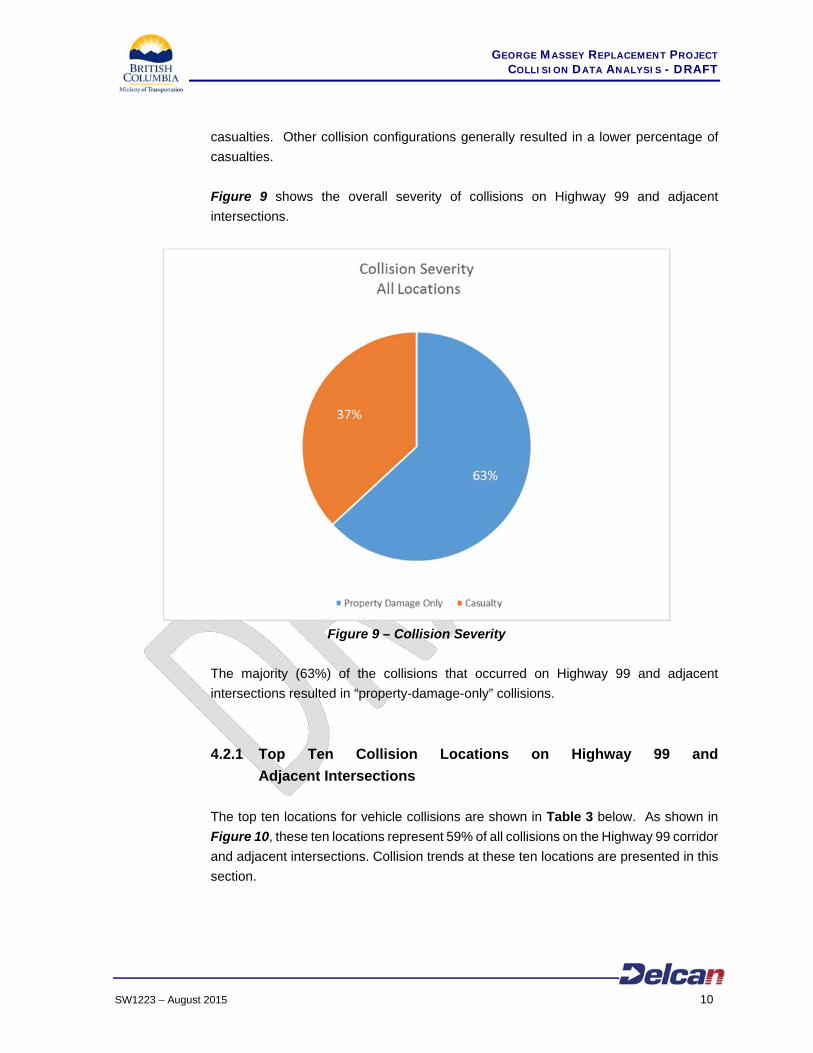
Figure 9 shows the overall severity of collisions on Highway 99 and adjacent
intersections.
Figure 9 – Collision Severity
The majority (63%) of the collisions that occurred on Highway 99 and adjacent
intersections resulted in “property-damage-only” collisions.
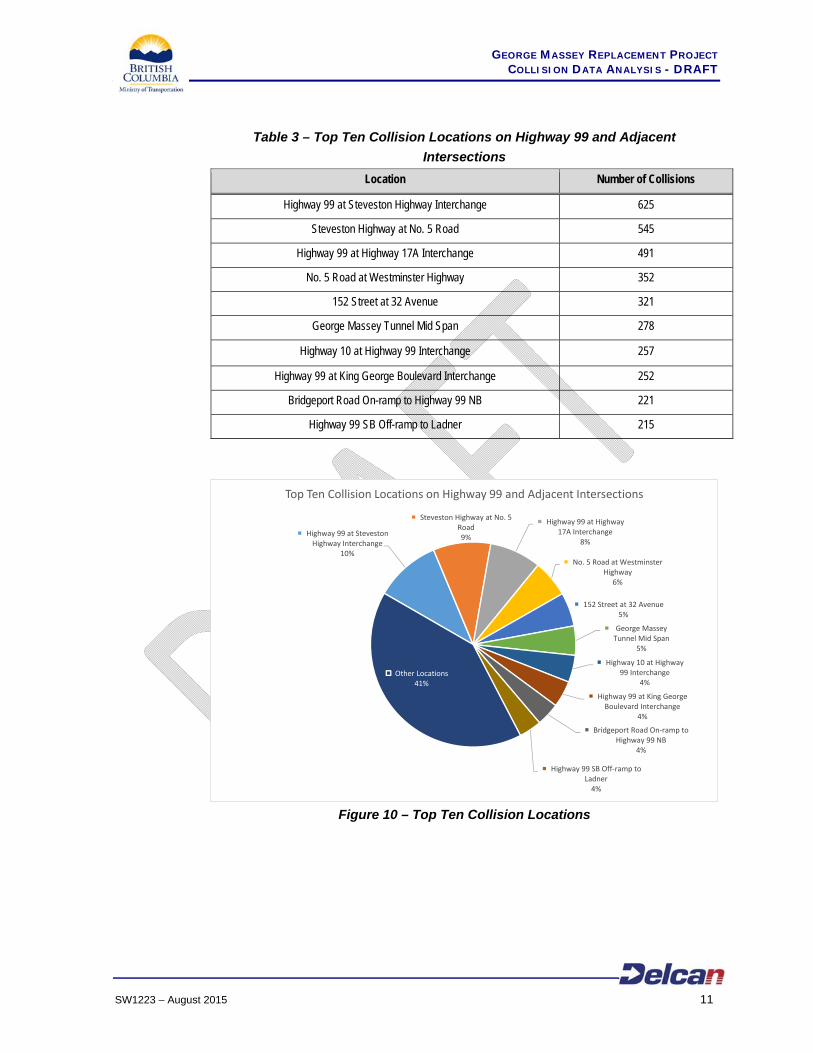
4.2.1 Top Ten Collision Locations on Highway 99 and
Adjacent Intersections
The top ten locations for vehicle collisions are shown in Table 3 below. As shown in
Figure 10, these ten locations represent 59% of all collisions on the Highway 99 corridor
and adjacent intersections. Collision trends at these ten locations are presented in this
section.
GEORGE MASSEY REPLACEMENT PROJECT COLLISION DATA ANALYSIS - DRAFT
SW1223 – August 2015 11
Table 3 – Top Ten Collision Locations on Highway 99 and Adjacent
Intersections
Location Number of Collisions
Highway 99 at Steveston Highway Interchange 625
Steveston Highway at No. 5 Road 545
Highway 99 at Highway 17A Interchange 491
No. 5 Road at Westminster Highway 352
152 Street at 32 Avenue 321
George Massey Tunnel Mid Span 278
Highway 10 at Highway 99 Interchange 257
Highway 99 at King George Boulevard Interchange 252
Bridgeport Road On-ramp to Highway 99 NB 221
Highway 99 SB Off-ramp to Ladner 215
Figure 10 – Top Ten Collision Locations
Highway 99 at Steveston Highway Interchange
10%
Steveston Highway at No. 5 Road9%
Highway 99 at Highway 17A Interchange
8%
No. 5 Road at Westminster Highway
6%
152 Street at 32 Avenue5%
George Massey Tunnel Mid Span
5%
Highway 10 at Highway 99 Interchange
4%
Highway 99 at King George Boulevard Interchange
4%
Bridgeport Road On-ramp to Highway 99 NB
4%
Highway 99 SB Off-ramp to Ladner
4%
Other Locations41%
Top Ten Collision Locations on Highway 99 and Adjacent Intersections
GEORGE MASSEY REPLACEMENT PROJECT COLLISION DATA ANALYSIS - DRAFT
SW1223 – August 2015 12
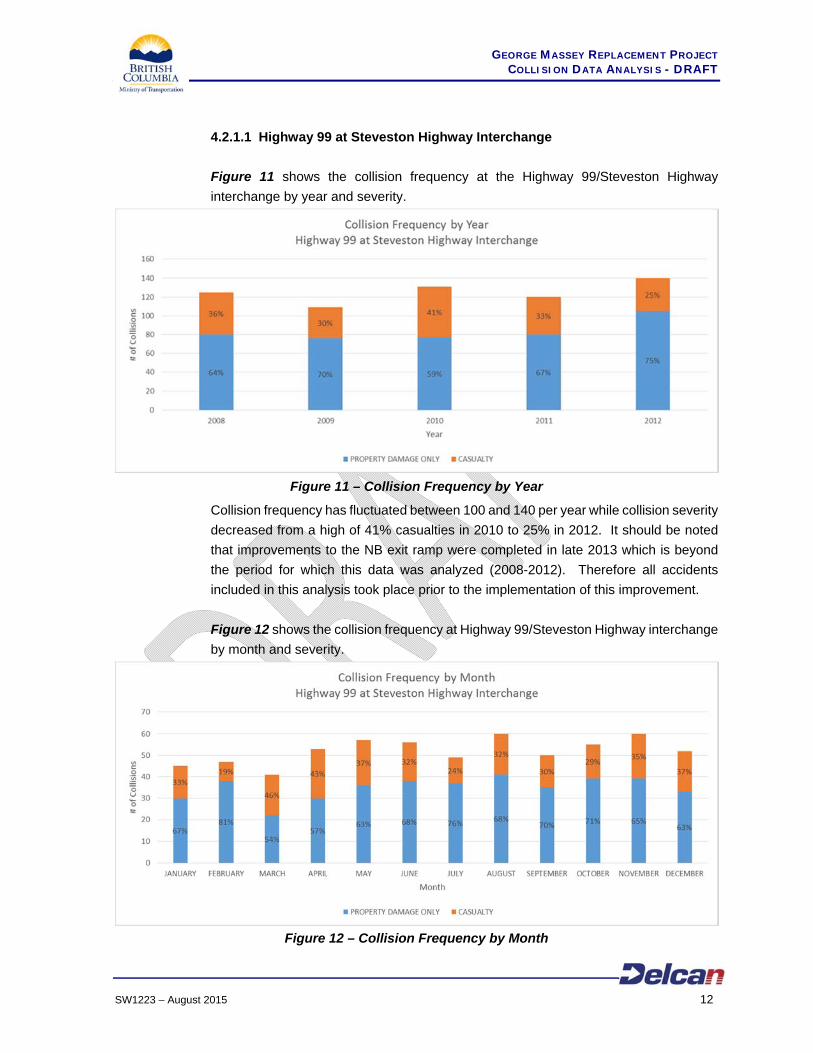
4.2.1.1 Highway 99 at Steveston Highway Interchange
Figure 11 shows the collision frequency at the Highway 99/Steveston Highway
interchange by year and severity.
Figure 11 – Collision Frequency by Year
Collision frequency has fluctuated between 100 and 140 per year while collision severity
decreased from a high of 41% casualties in 2010 to 25% in 2012. It should be noted
that improvements to the NB exit ramp were completed in late 2013 which is beyond
the period for which this data was analyzed (2008-2012). Therefore all accidents
included in this analysis took place prior to the implementation of this improvement.
Figure 12 shows the collision frequency at Highway 99/Steveston Highway interchange
by month and severity.
Figure 12 – Collision Frequency by Month
GEORGE MASSEY REPLACEMENT PROJECT COLLISION DATA ANALYSIS - DRAFT
SW1223 – August 2015 13
Collisions occurred more frequently in the Spring months (April to June) and spiked
noticeably in August and November. The Winter months, January to March
experienced the fewest collisions. Collision severity ranged from 19% casualties in
February to 46% casualties in March.
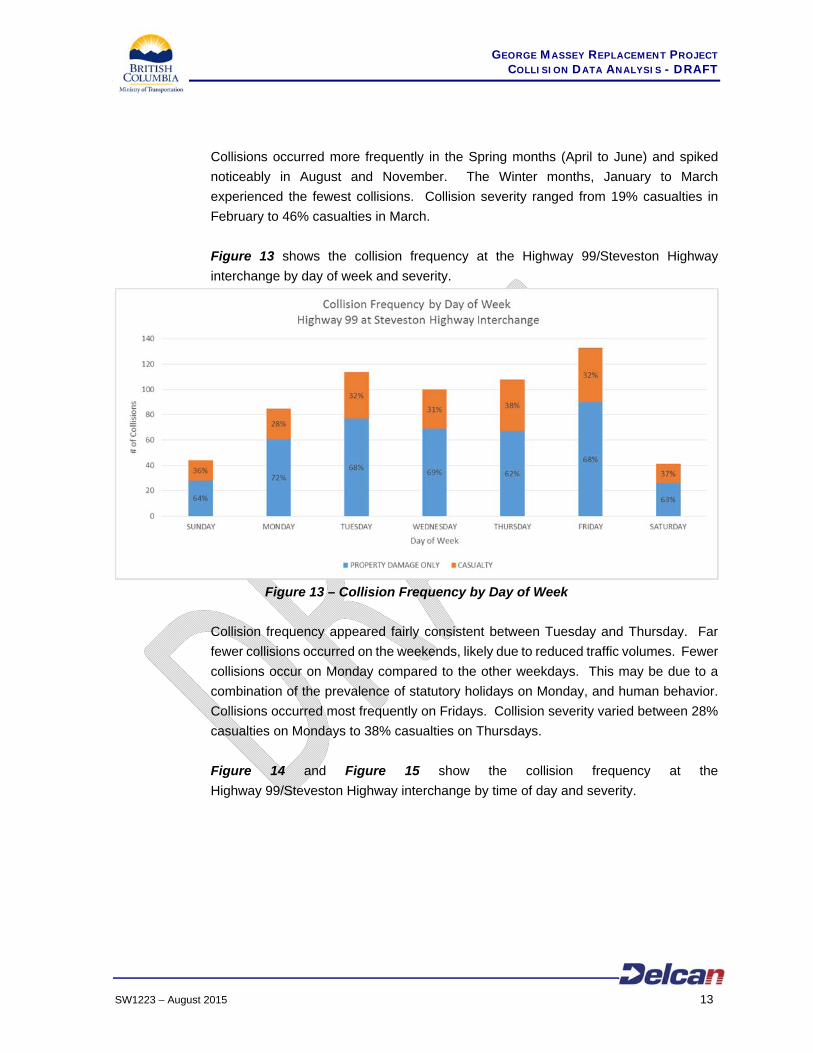
Figure 13 shows the collision frequency at the Highway 99/Steveston Highway
interchange by day of week and severity.
Figure 13 – Collision Frequency by Day of Week
Collision frequency appeared fairly consistent between Tuesday and Thursday. Far
fewer collisions occurred on the weekends, likely due to reduced traffic volumes. Fewer
collisions occur on Monday compared to the other weekdays. This may be due to a
combination of the prevalence of statutory holidays on Monday, and human behavior.
Collisions occurred most frequently on Fridays. Collision severity varied between 28%
casualties on Mondays to 38% casualties on Thursdays.
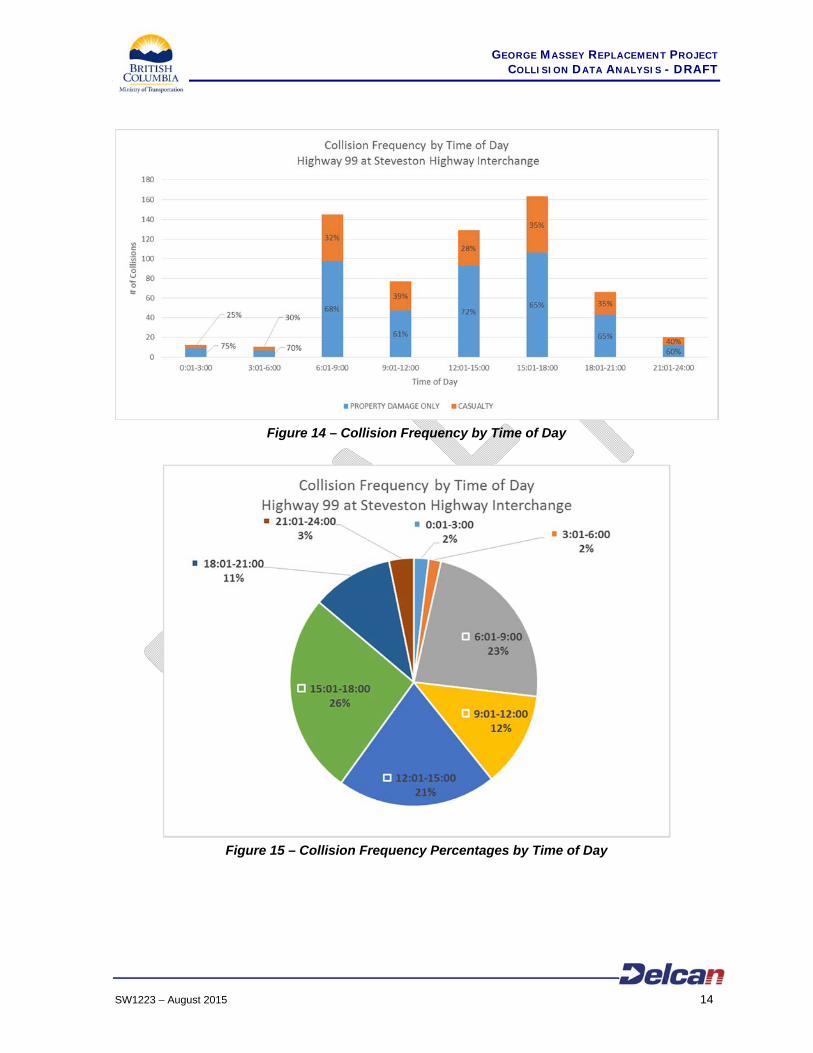
Figure 14 and Figure 15 show the collision frequency at the
Highway 99/Steveston Highway interchange by time of day and severity.
GEORGE MASSEY REPLACEMENT PROJECT COLLISION DATA ANALYSIS - DRAFT
SW1223 – August 2015 14
Figure 14 – Collision Frequency by Time of Day
Figure 15 – Collision Frequency Percentages by Time of Day
GEORGE MASSEY REPLACEMENT PROJECT COLLISION DATA ANALYSIS - DRAFT
SW1223 – August 2015 15
Collisions occurred most frequently in the PM peak period, with 26% of all collisions
occurring between 3pm and 6pm. Collisions occurring between 12pm and 6pm
accounted for 47% of all collisions. Collision severity varied between 28% casualties in
the 12pm to 3pm period, and 39% casualties in the 9am to 12pm period. Few collisions
occurred between 12am to 6am.
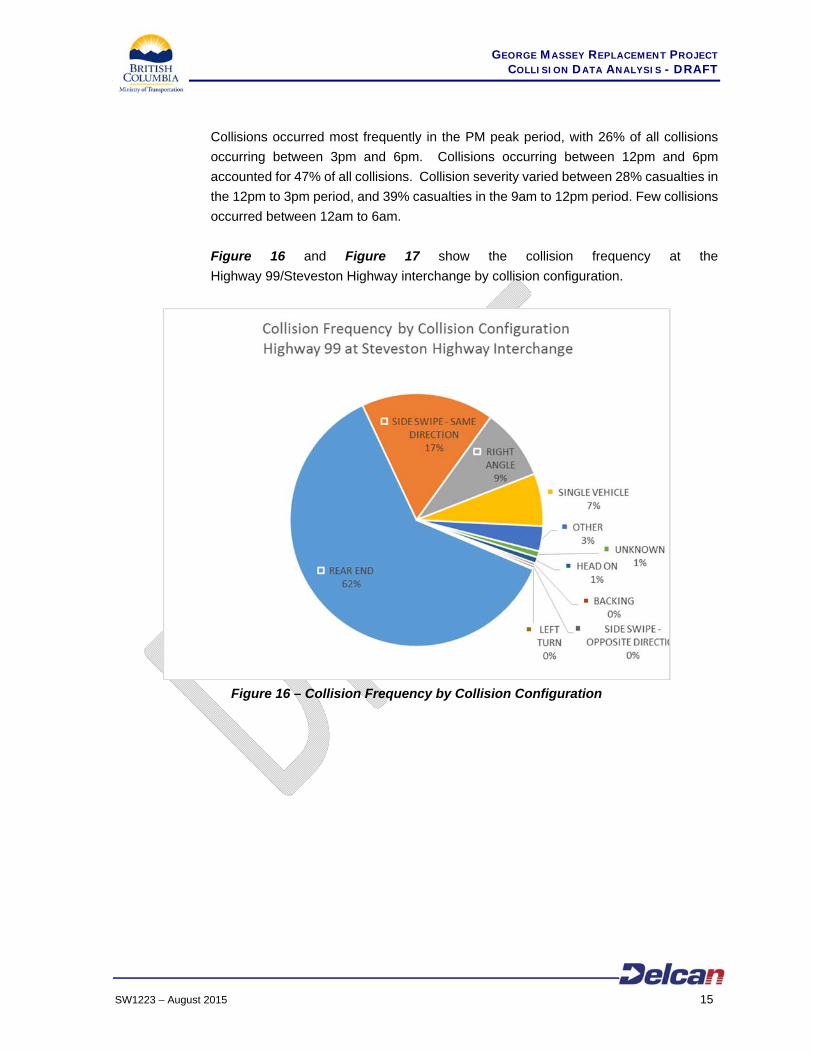
Figure 16 and Figure 17 show the collision frequency at the
Highway 99/Steveston Highway interchange by collision configuration.
Figure 16 – Collision Frequency by Collision Configuration
GEORGE MASSEY REPLACEMENT PROJECT COLLISION DATA ANALYSIS - DRAFT
SW1223 – August 2015 16
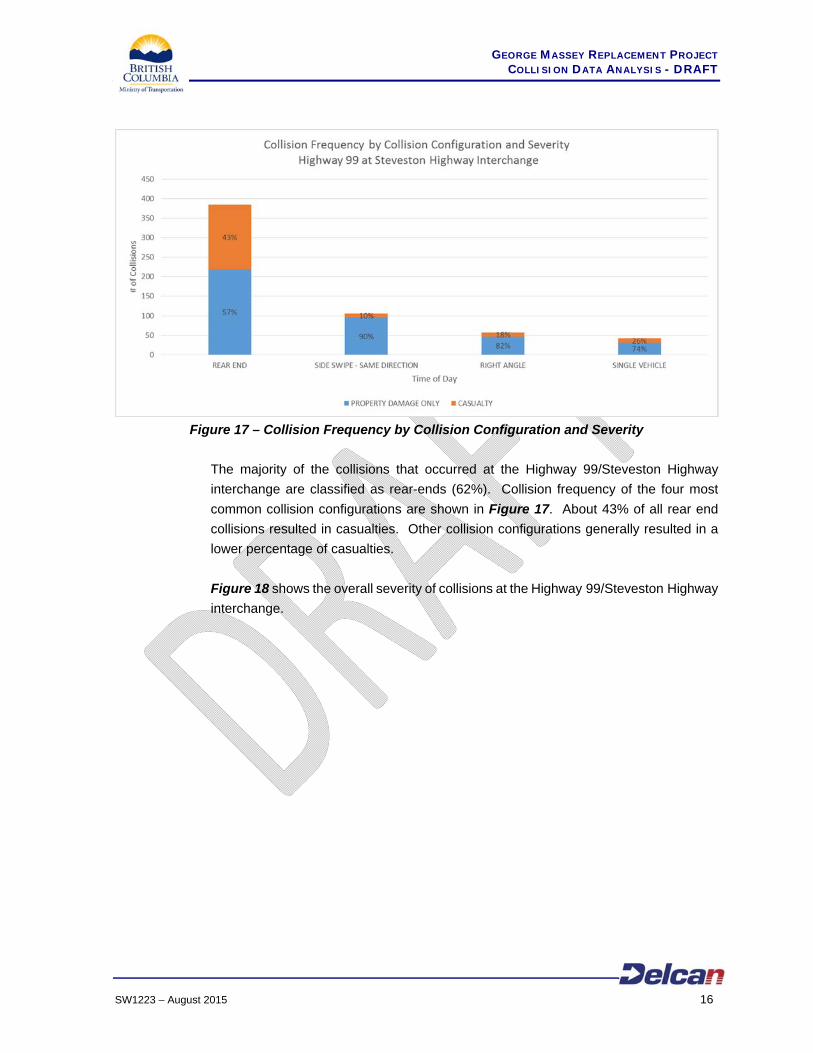
Figure 17 – Collision Frequency by Collision Configuration and Severity
The majority of the collisions that occurred at the Highway 99/Steveston Highway
interchange are classified as rear-ends (62%). Collision frequency of the four most
common collision configurations are shown in Figure 17. About 43% of all rear end
collisions resulted in casualties. Other collision configurations generally resulted in a
lower percentage of casualties.
Figure 18 shows the overall severity of collisions at the Highway 99/Steveston Highway
interchange.

GEORGE MASSEY REPLACEMENT PROJECT COLLISION DATA ANALYSIS - DRAFT
SW1223 – August 2015 17
Figure 18 – Collision Severity
The majority (67%) of the collisions that occurred at the Highway 99/Steveston Highway
interchange resulted in “property-damage-only” collisions.
GEORGE MASSEY REPLACEMENT PROJECT COLLISION DATA ANALYSIS - DRAFT
SW1223 – August 2015 18
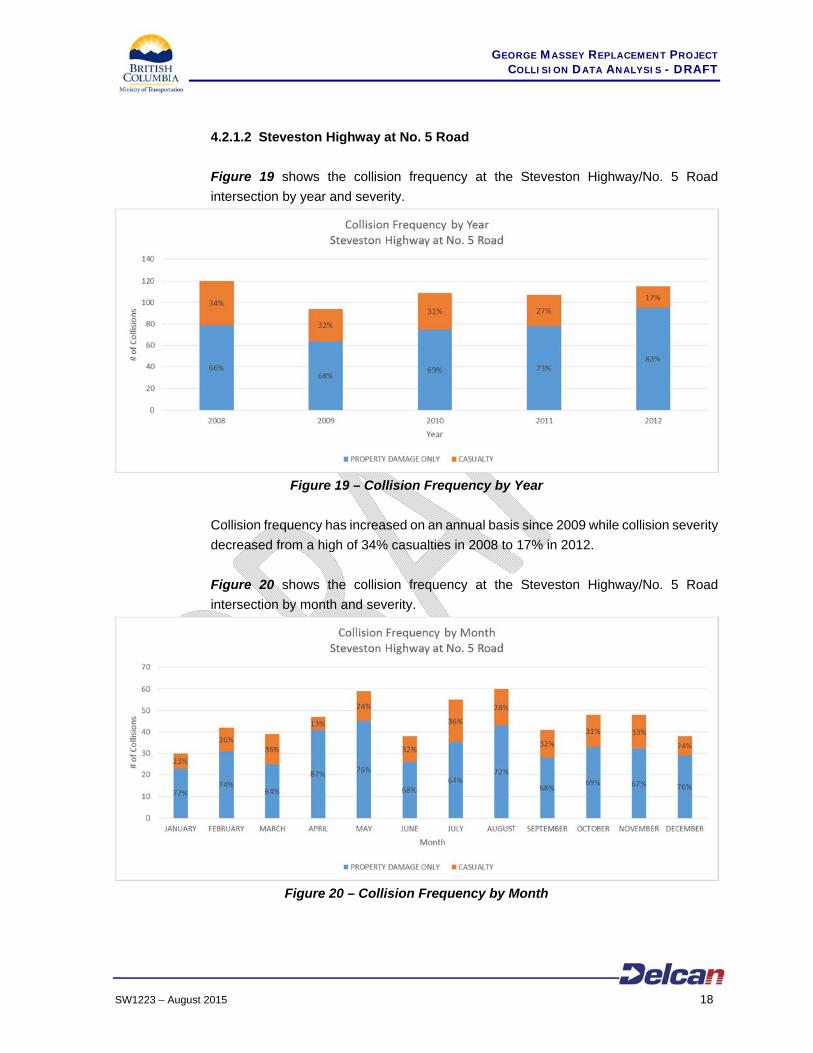
4.2.1.2 Steveston Highway at No. 5 Road
Figure 19 shows the collision frequency at the Steveston Highway/No. 5 Road
intersection by year and severity.
Figure 19 – Collision Frequency by Year
Collision frequency has increased on an annual basis since 2009 while collision severity
decreased from a high of 34% casualties in 2008 to 17% in 2012.
Figure 20 shows the collision frequency at the Steveston Highway/No. 5 Road
intersection by month and severity.
Figure 20 – Collision Frequency by Month
GEORGE MASSEY REPLACEMENT PROJECT COLLISION DATA ANALYSIS - DRAFT
SW1223 – August 2015 19
Collisions occurred more frequently in the Spring (April and May) and Summer (July
and August). Collision severity ranged from 13% casualties in April to 36 % casualties
in March and July.
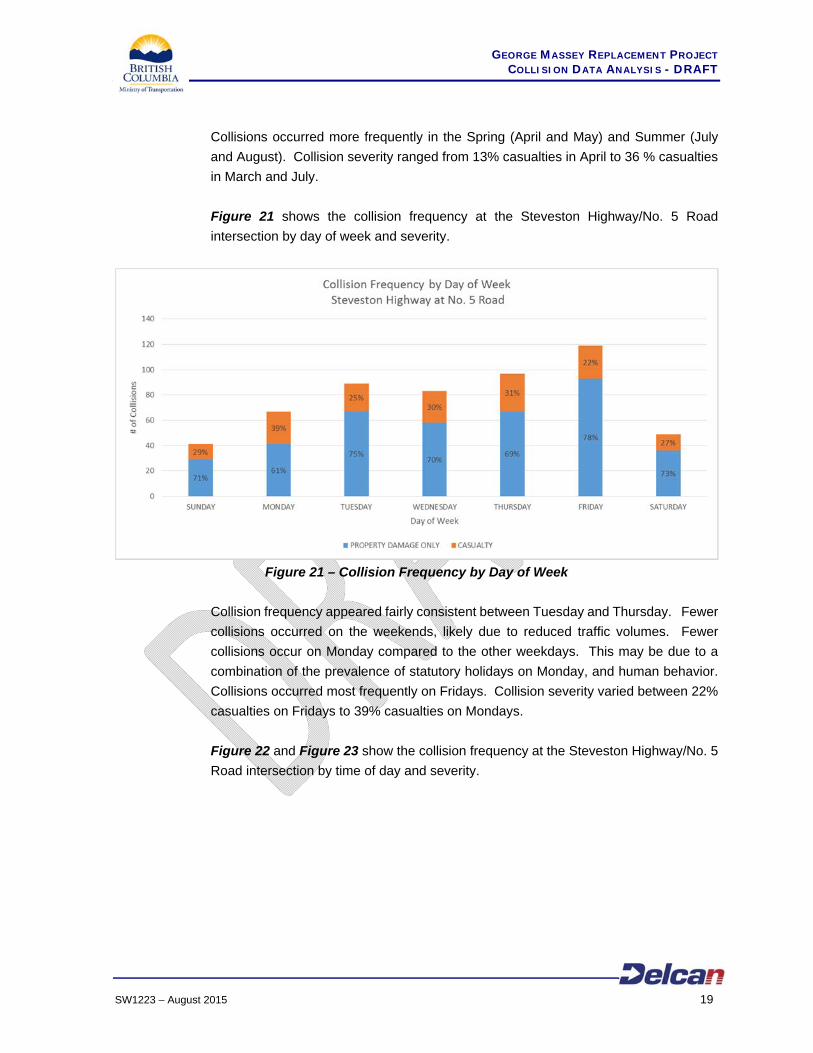
Figure 21 shows the collision frequency at the Steveston Highway/No. 5 Road
intersection by day of week and severity.
Figure 21 – Collision Frequency by Day of Week
Collision frequency appeared fairly consistent between Tuesday and Thursday. Fewer
collisions occurred on the weekends, likely due to reduced traffic volumes. Fewer
collisions occur on Monday compared to the other weekdays. This may be due to a
combination of the prevalence of statutory holidays on Monday, and human behavior.
Collisions occurred most frequently on Fridays. Collision severity varied between 22%
casualties on Fridays to 39% casualties on Mondays.
Figure 22 and Figure 23 show the collision frequency at the Steveston Highway/No. 5
Road intersection by time of day and severity.
GEORGE MASSEY REPLACEMENT PROJECT COLLISION DATA ANALYSIS - DRAFT
SW1223 – August 2015 20
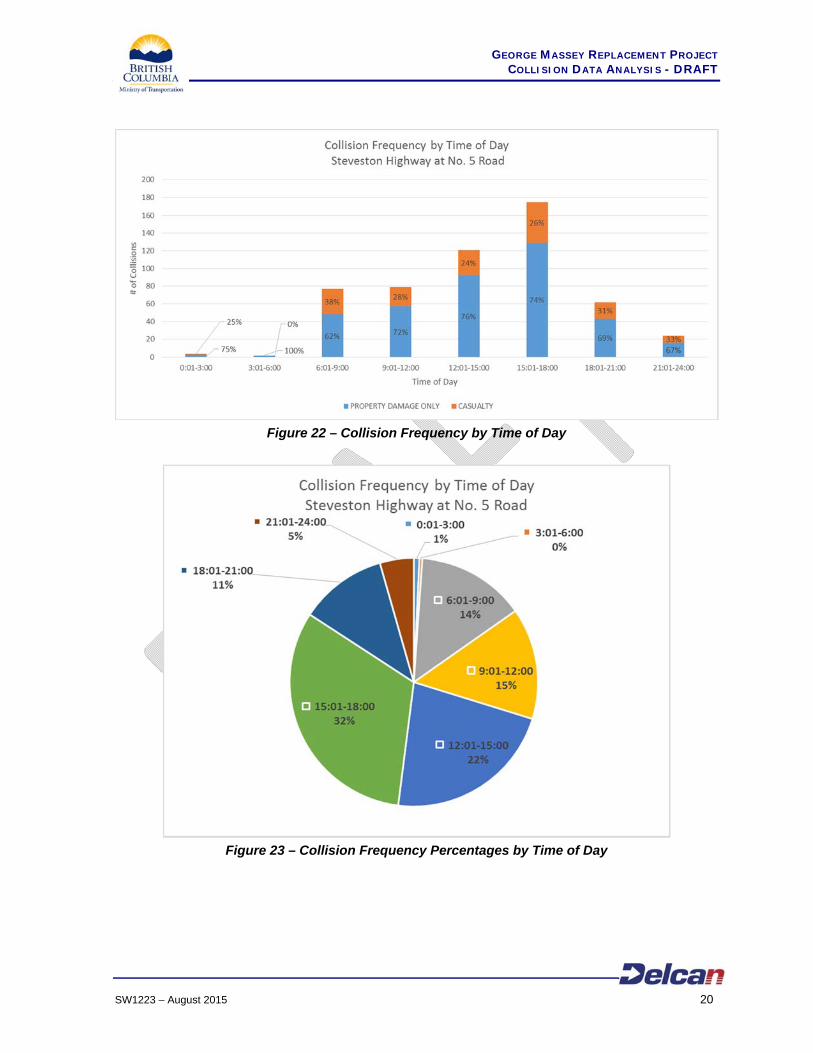
Figure 22 – Collision Frequency by Time of Day
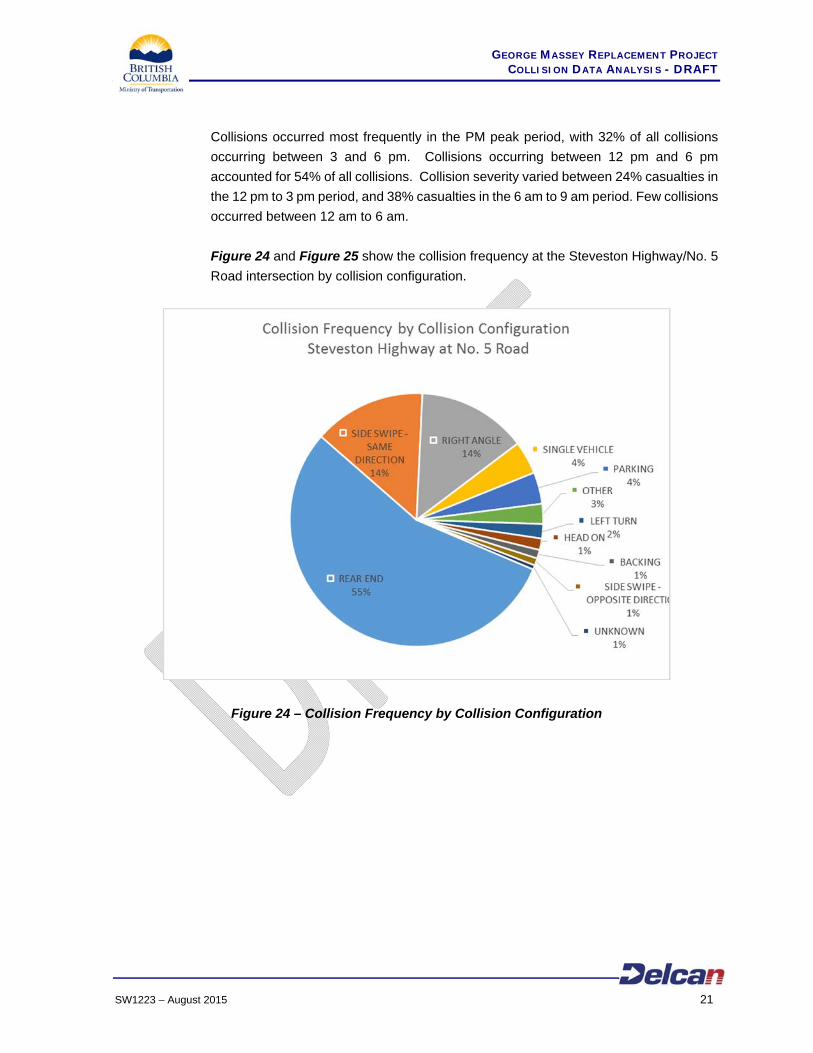
Figure 23 – Collision Frequency Percentages by Time of Day
GEORGE MASSEY REPLACEMENT PROJECT COLLISION DATA ANALYSIS - DRAFT
SW1223 – August 2015 21
Collisions occurred most frequently in the PM peak period, with 32% of all collisions
occurring between 3 and 6 pm. Collisions occurring between 12 pm and 6 pm
accounted for 54% of all collisions. Collision severity varied between 24% casualties in
the 12 pm to 3 pm period, and 38% casualties in the 6 am to 9 am period. Few collisions
occurred between 12 am to 6 am.
Figure 24 and Figure 25 show the collision frequency at the Steveston Highway/No. 5
Road intersection by collision configuration.
Figure 24 – Collision Frequency by Collision Configuration
GEORGE MASSEY REPLACEMENT PROJECT COLLISION DATA ANALYSIS - DRAFT
SW1223 – August 2015 22
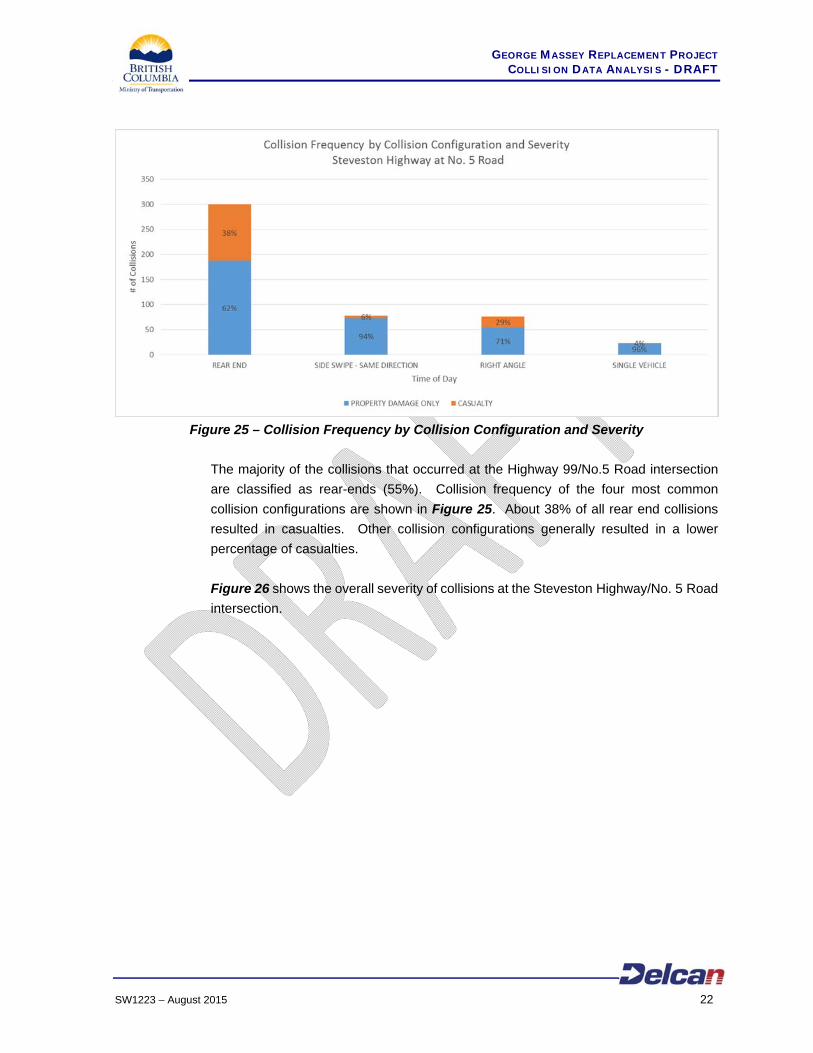
Figure 25 – Collision Frequency by Collision Configuration and Severity
The majority of the collisions that occurred at the Highway 99/No.5 Road intersection
are classified as rear-ends (55%). Collision frequency of the four most common
collision configurations are shown in Figure 25. About 38% of all rear end collisions
resulted in casualties. Other collision configurations generally resulted in a lower
percentage of casualties.
Figure 26 shows the overall severity of collisions at the Steveston Highway/No. 5 Road
intersection.

GEORGE MASSEY REPLACEMENT PROJECT COLLISION DATA ANALYSIS - DRAFT
SW1223 – August 2015 23
Figure 26 – Collision Severity
The majority (72%) of the collisions that occurred at the Steveston Highway/No. 5 Road
intersection resulted in “property-damage-only” collisions
GEORGE MASSEY REPLACEMENT PROJECT COLLISION DATA ANALYSIS - DRAFT
SW1223 – August 2015 24
4.2.1.3 Highway 99 at Highway 17A Interchange
Figure 27 shows the collision frequency at the Highway 99/Highway 17A interchange
by year and severity.
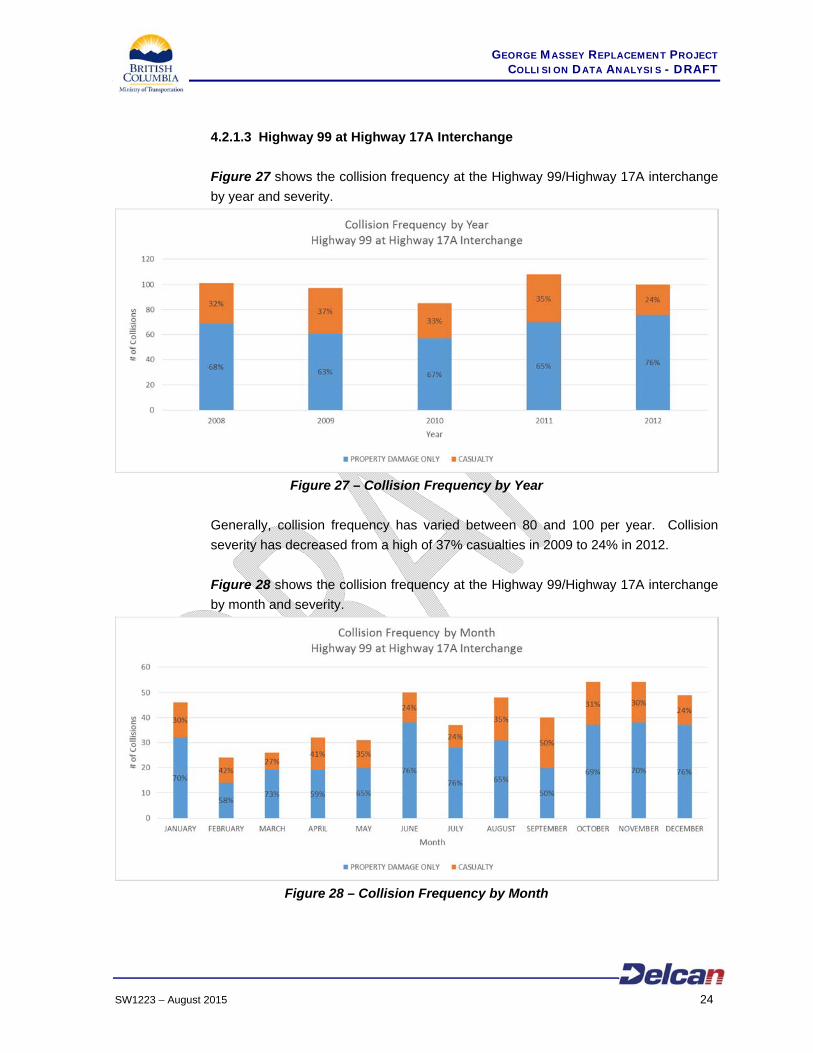
Figure 27 – Collision Frequency by Year
Generally, collision frequency has varied between 80 and 100 per year. Collision
severity has decreased from a high of 37% casualties in 2009 to 24% in 2012.
Figure 28 shows the collision frequency at the Highway 99/Highway 17A interchange
by month and severity.
Figure 28 – Collision Frequency by Month
GEORGE MASSEY REPLACEMENT PROJECT COLLISION DATA ANALYSIS - DRAFT
SW1223 – August 2015 25
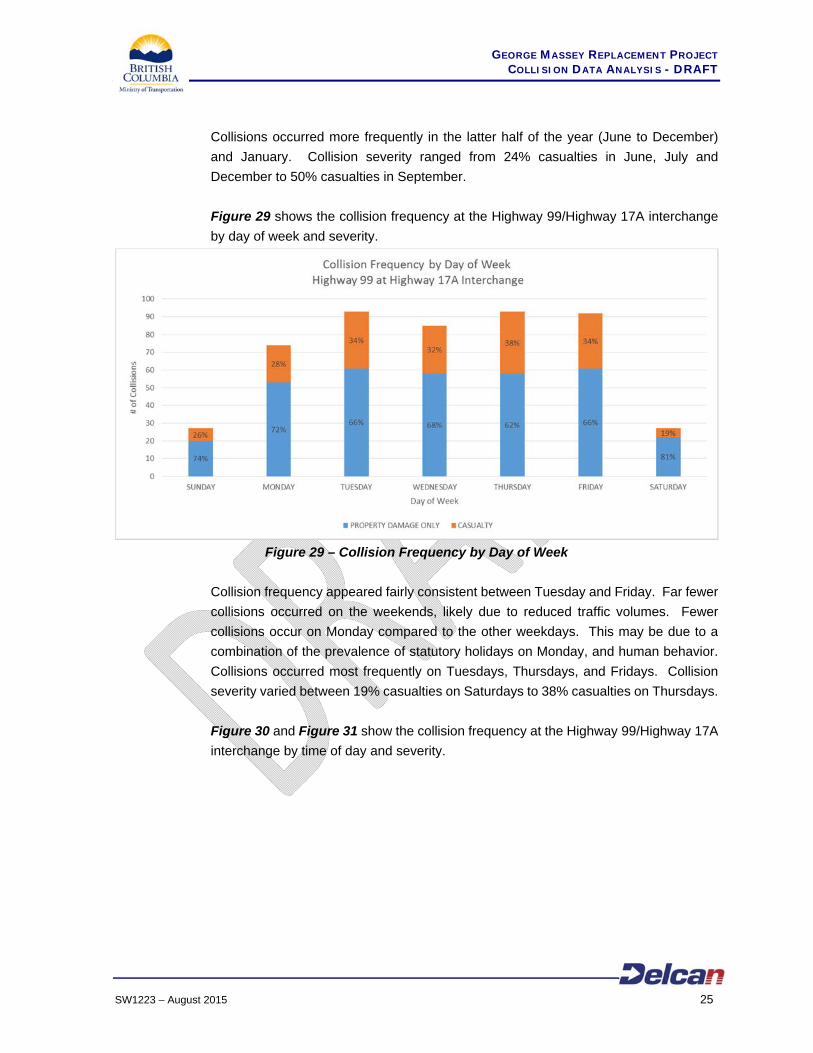
Collisions occurred more frequently in the latter half of the year (June to December)
and January. Collision severity ranged from 24% casualties in June, July and
December to 50% casualties in September.
Figure 29 shows the collision frequency at the Highway 99/Highway 17A interchange
by day of week and severity.
Figure 29 – Collision Frequency by Day of Week
Collision frequency appeared fairly consistent between Tuesday and Friday. Far fewer
collisions occurred on the weekends, likely due to reduced traffic volumes. Fewer
collisions occur on Monday compared to the other weekdays. This may be due to a
combination of the prevalence of statutory holidays on Monday, and human behavior.
Collisions occurred most frequently on Tuesdays, Thursdays, and Fridays. Collision
severity varied between 19% casualties on Saturdays to 38% casualties on Thursdays.
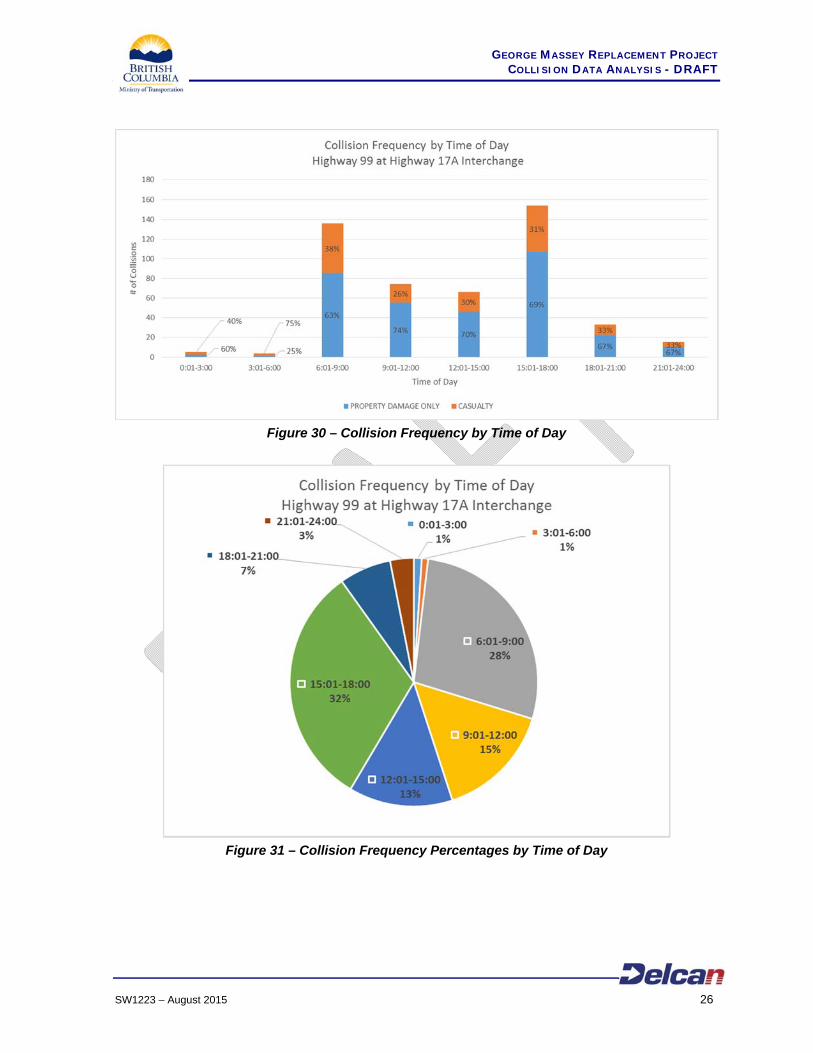
Figure 30 and Figure 31 show the collision frequency at the Highway 99/Highway 17A
interchange by time of day and severity.
GEORGE MASSEY REPLACEMENT PROJECT COLLISION DATA ANALYSIS - DRAFT
SW1223 – August 2015 26
Figure 30 – Collision Frequency by Time of Day
Figure 31 – Collision Frequency Percentages by Time of Day
GEORGE MASSEY REPLACEMENT PROJECT COLLISION DATA ANALYSIS - DRAFT
SW1223 – August 2015 27
Collisions occurred most frequently in the PM peak period, with 32% of all collisions
occurring between 3 and 6 pm. Collision severity varied between 26% casualties in the
12 pm to 3 pm period, and 38% casualties in the 6 am to 9 am period. Few collisions
occurred between 12 am to 6 am.
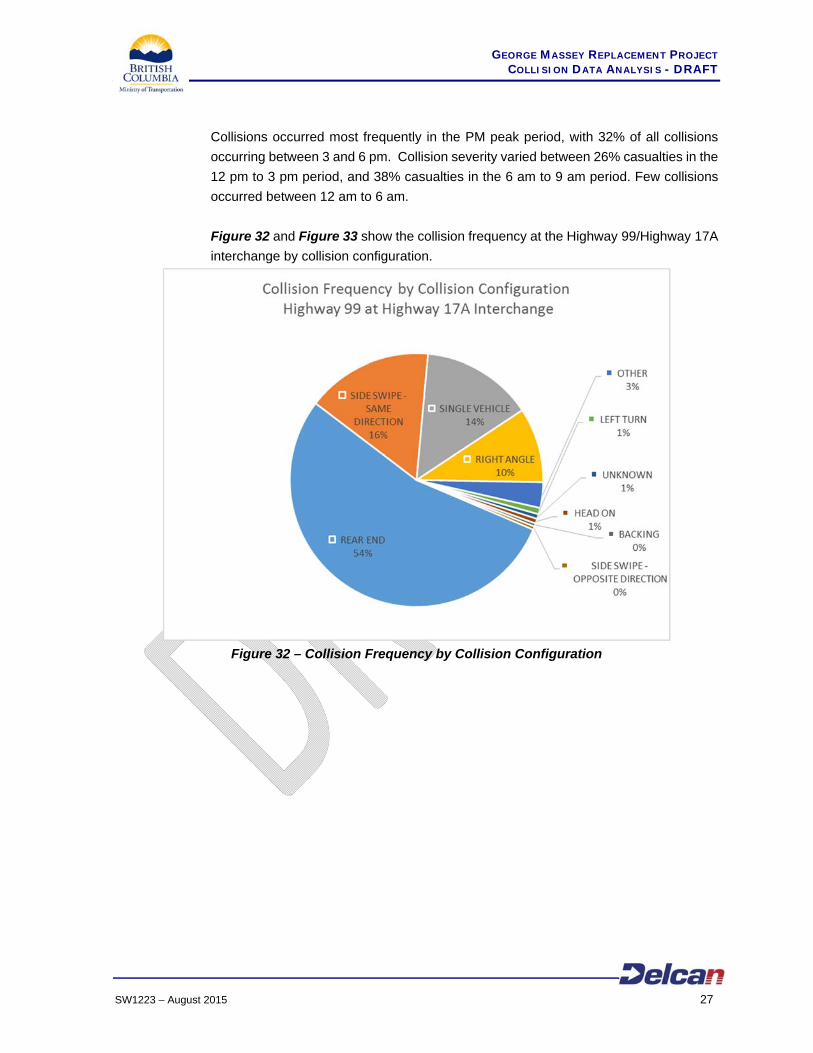
Figure 32 and Figure 33 show the collision frequency at the Highway 99/Highway 17A
interchange by collision configuration.
Figure 32 – Collision Frequency by Collision Configuration
GEORGE MASSEY REPLACEMENT PROJECT COLLISION DATA ANALYSIS - DRAFT
SW1223 – August 2015 28
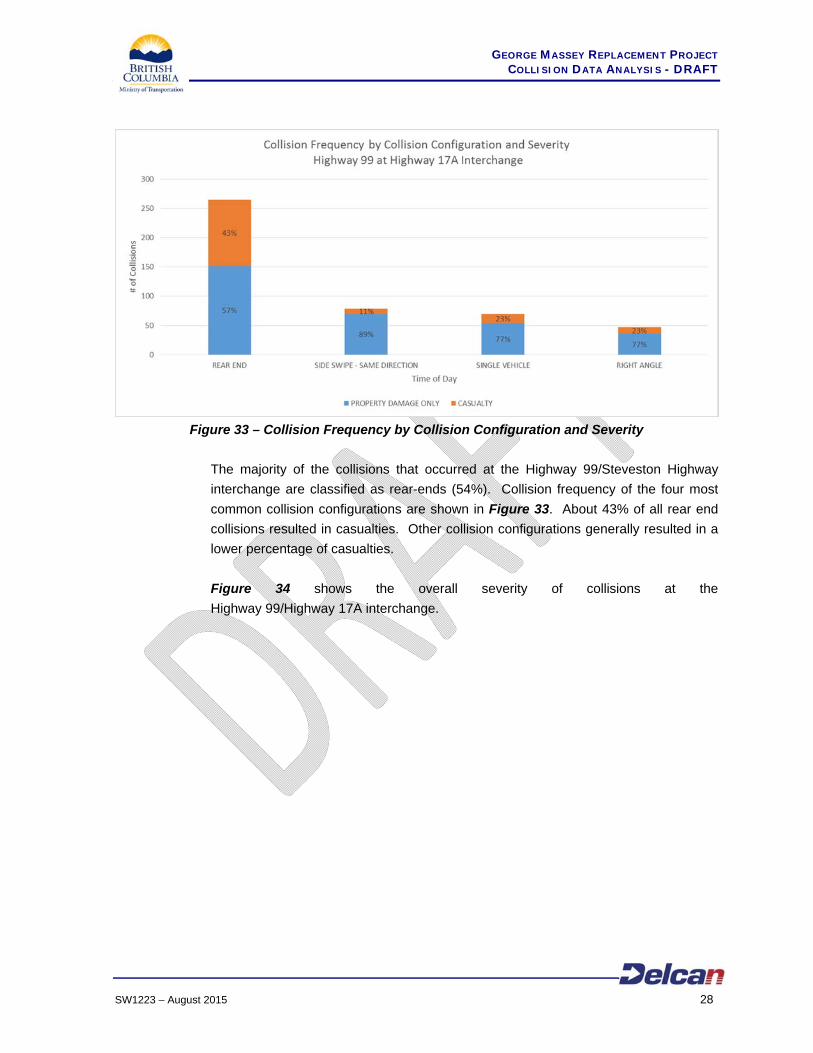
Figure 33 – Collision Frequency by Collision Configuration and Severity
The majority of the collisions that occurred at the Highway 99/Steveston Highway
interchange are classified as rear-ends (54%). Collision frequency of the four most
common collision configurations are shown in Figure 33. About 43% of all rear end
collisions resulted in casualties. Other collision configurations generally resulted in a
lower percentage of casualties.
Figure 34 shows the overall severity of collisions at the
Highway 99/Highway 17A interchange.
GEORGE MASSEY REPLACEMENT PROJECT COLLISION DATA ANALYSIS - DRAFT
SW1223 – August 2015 29
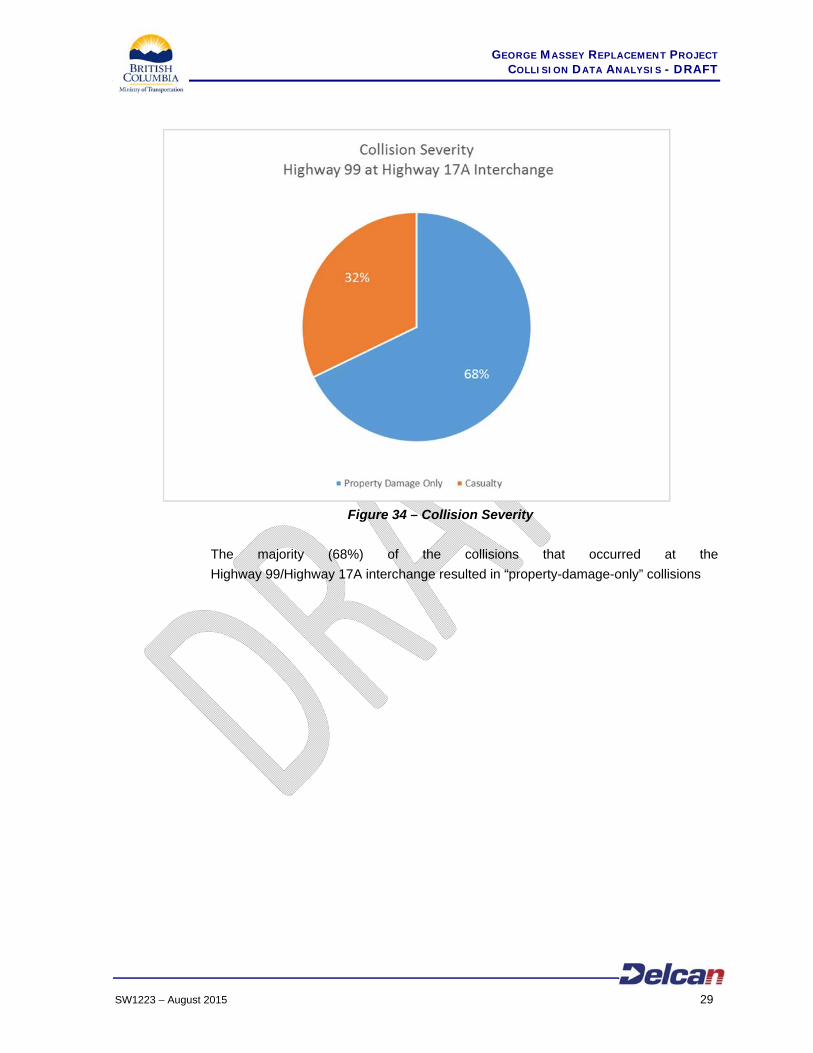
Figure 34 – Collision Severity
The majority (68%) of the collisions that occurred at the
Highway 99/Highway 17A interchange resulted in “property-damage-only” collisions
GEORGE MASSEY REPLACEMENT PROJECT COLLISION DATA ANALYSIS - DRAFT
SW1223 – August 2015 30
4.2.1.4 No. 5 Road at Westminster Highway
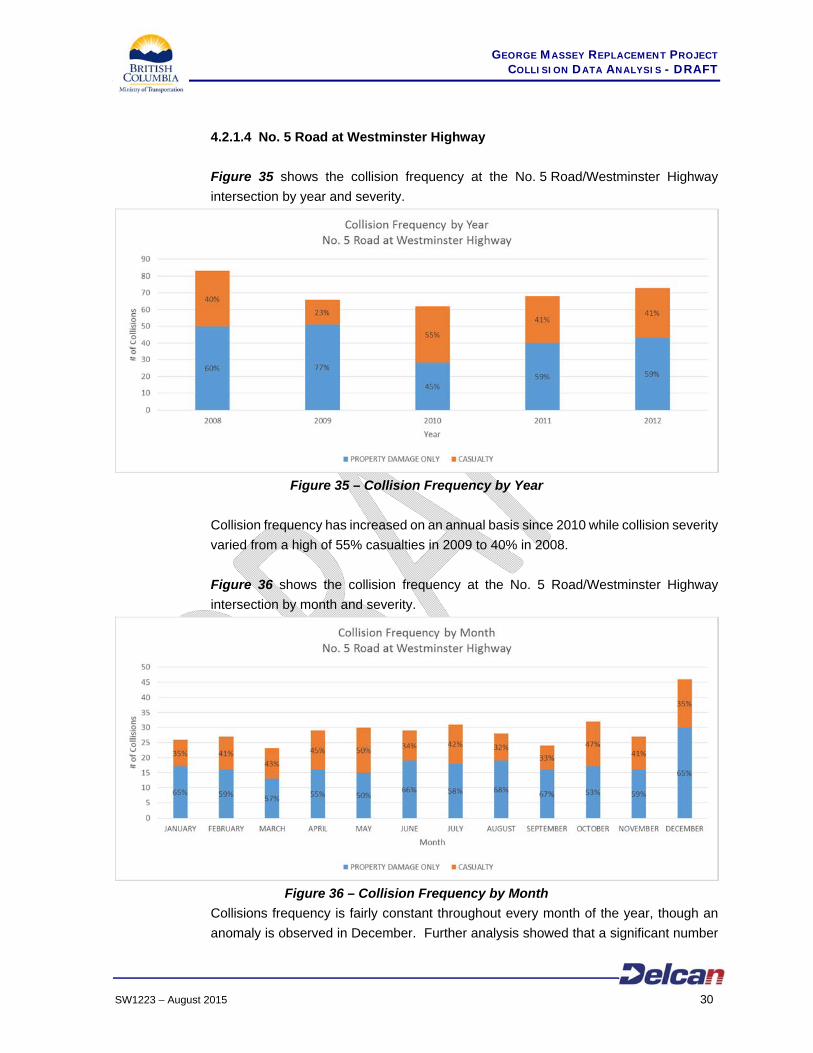
Figure 35 shows the collision frequency at the No. 5 Road/Westminster Highway
intersection by year and severity.
Figure 35 – Collision Frequency by Year
Collision frequency has increased on an annual basis since 2010 while collision severity
varied from a high of 55% casualties in 2009 to 40% in 2008.
Figure 36 shows the collision frequency at the No. 5 Road/Westminster Highway
intersection by month and severity.
Figure 36 – Collision Frequency by Month
Collisions frequency is fairly constant throughout every month of the year, though an
anomaly is observed in December. Further analysis showed that a significant number
GEORGE MASSEY REPLACEMENT PROJECT COLLISION DATA ANALYSIS - DRAFT
SW1223 – August 2015 31
of collisions occurred during December of 2008. Patterns are fairly consistent if that
month is removed from the dataset. Collision severity ranged from 32% casualties in
August to 50% casualties in May.
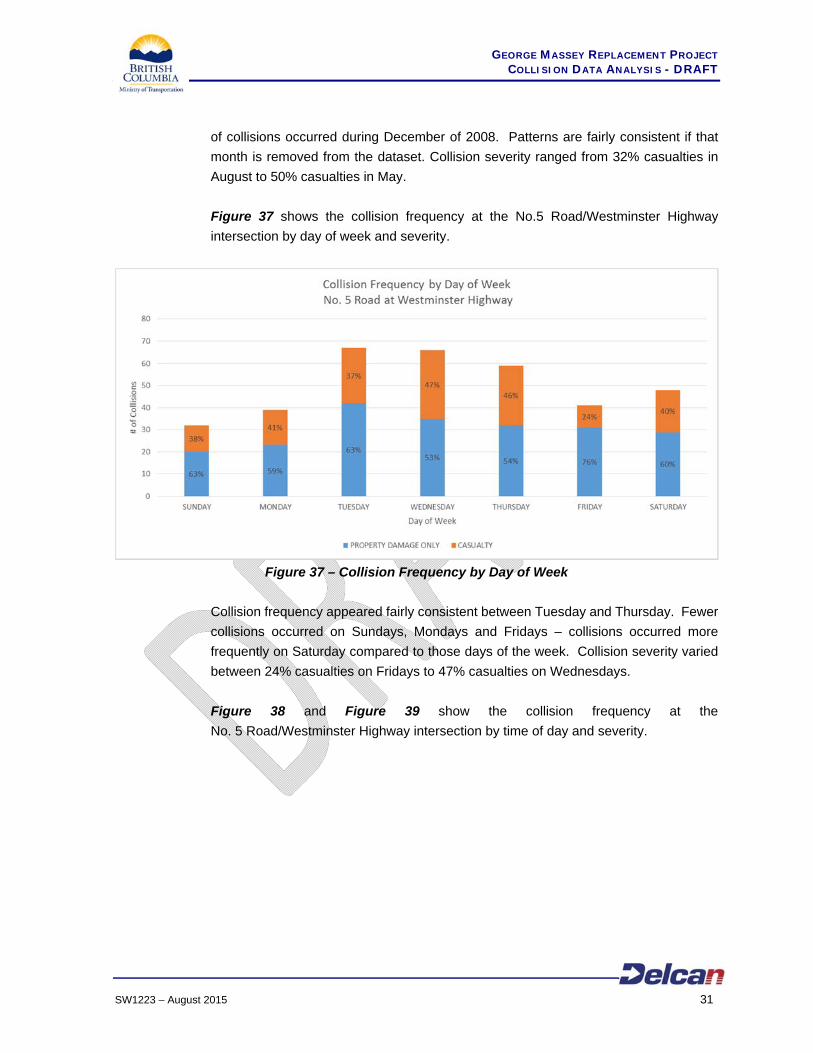
Figure 37 shows the collision frequency at the No.5 Road/Westminster Highway
intersection by day of week and severity.
Figure 37 – Collision Frequency by Day of Week
Collision frequency appeared fairly consistent between Tuesday and Thursday. Fewer
collisions occurred on Sundays, Mondays and Fridays – collisions occurred more
frequently on Saturday compared to those days of the week. Collision severity varied
between 24% casualties on Fridays to 47% casualties on Wednesdays.
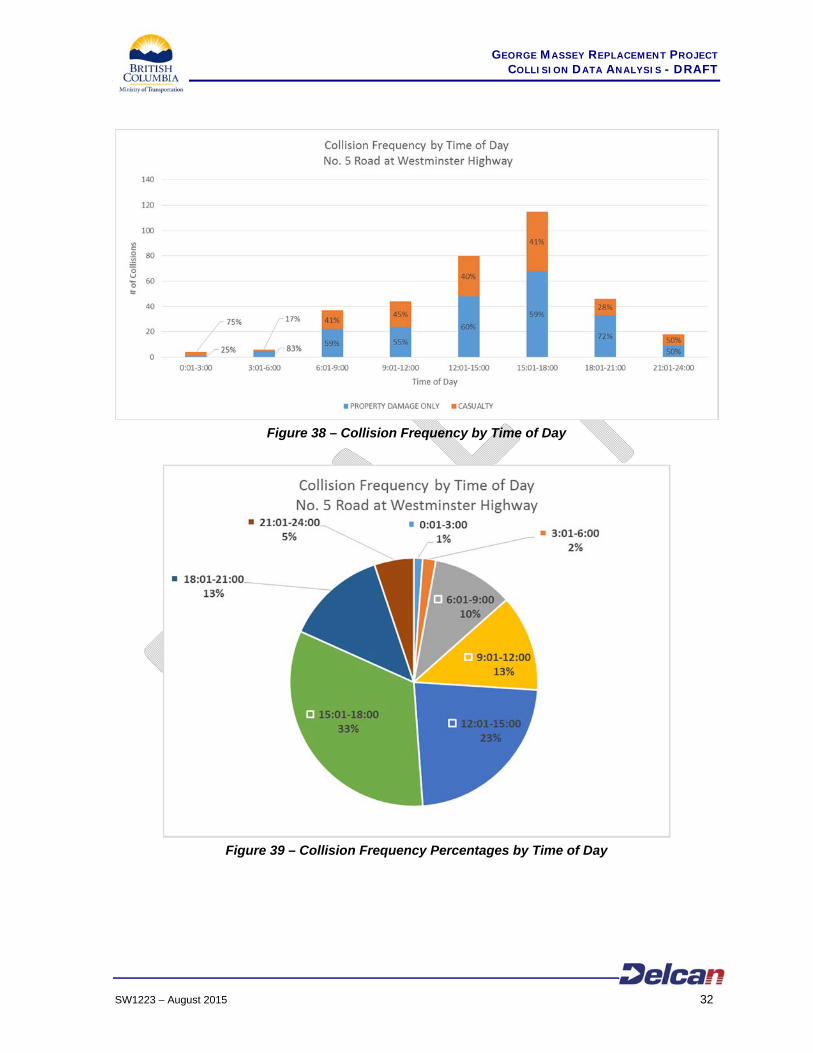
Figure 38 and Figure 39 show the collision frequency at the
No. 5 Road/Westminster Highway intersection by time of day and severity.
GEORGE MASSEY REPLACEMENT PROJECT COLLISION DATA ANALYSIS - DRAFT
SW1223 – August 2015 32
Figure 38 – Collision Frequency by Time of Day
Figure 39 – Collision Frequency Percentages by Time of Day
GEORGE MASSEY REPLACEMENT PROJECT COLLISION DATA ANALYSIS - DRAFT
SW1223 – August 2015 33
Collisions occurred most frequently in the PM peak period, with 33% of all collisions
occurring between 3 pm and 6 pm. Collisions occurring between 12pm and 6pm
accounted for 56% of all collisions. Collision severity varied between 28% casualties in
the 6 pm to 9 pm period, and 50% casualties in the 9 pm to 12 am period. Few collisions
occurred between 12 am to 6 am.
Figure 40 and Figure 41 show the collision frequency at the
No. 5 Road/Westminster Highway intersection by collision configuration.
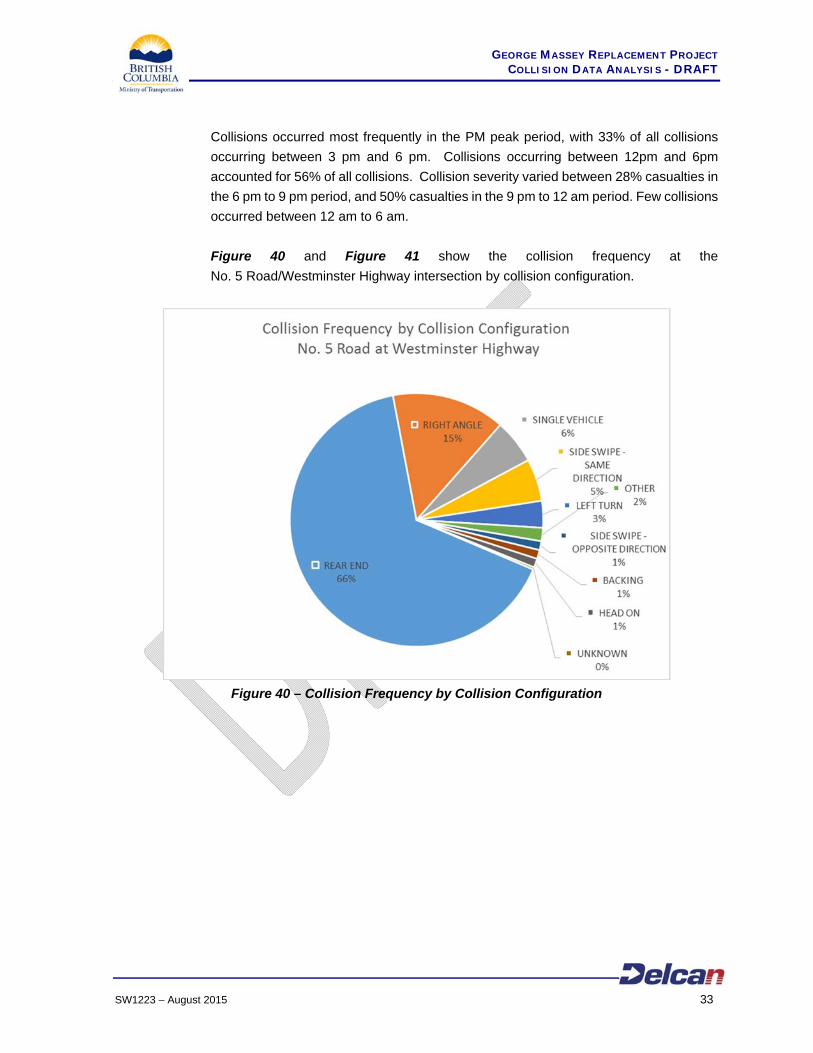
Figure 40 – Collision Frequency by Collision Configuration
GEORGE MASSEY REPLACEMENT PROJECT COLLISION DATA ANALYSIS - DRAFT
SW1223 – August 2015 34
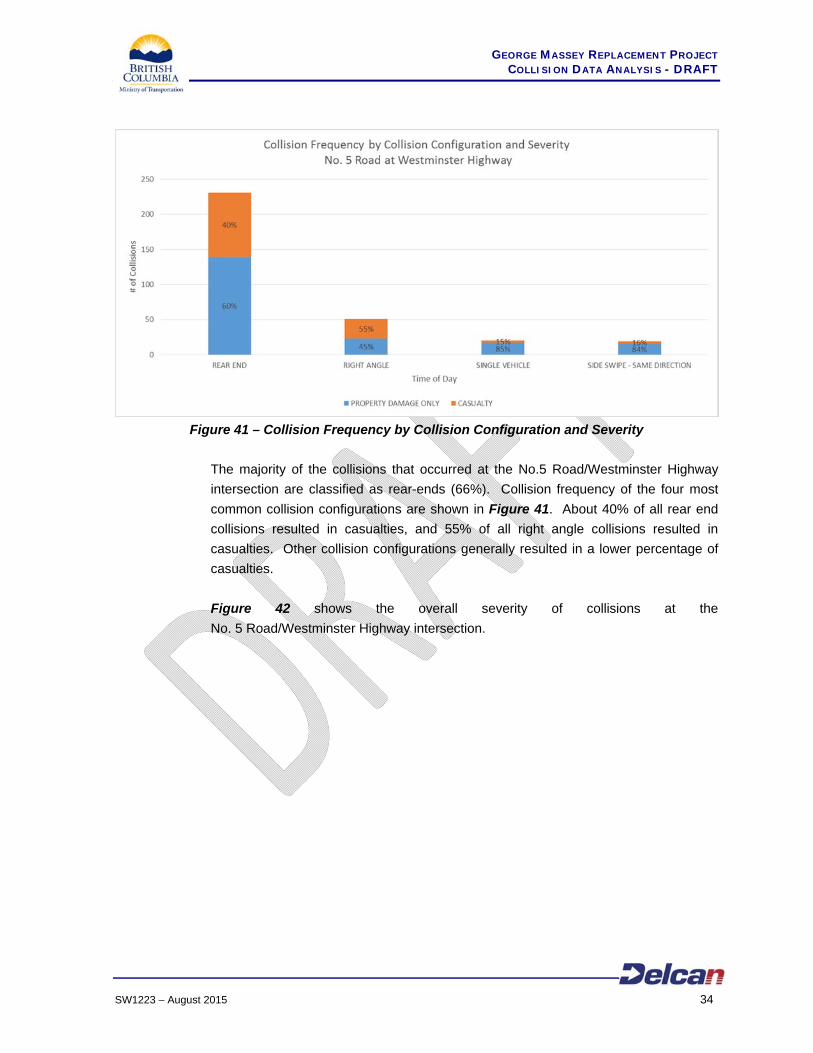
Figure 41 – Collision Frequency by Collision Configuration and Severity
The majority of the collisions that occurred at the No.5 Road/Westminster Highway
intersection are classified as rear-ends (66%). Collision frequency of the four most
common collision configurations are shown in Figure 41. About 40% of all rear end
collisions resulted in casualties, and 55% of all right angle collisions resulted in
casualties. Other collision configurations generally resulted in a lower percentage of
casualties.
Figure 42 shows the overall severity of collisions at the
No. 5 Road/Westminster Highway intersection.
GEORGE MASSEY REPLACEMENT PROJECT COLLISION DATA ANALYSIS - DRAFT
SW1223 – August 2015 35
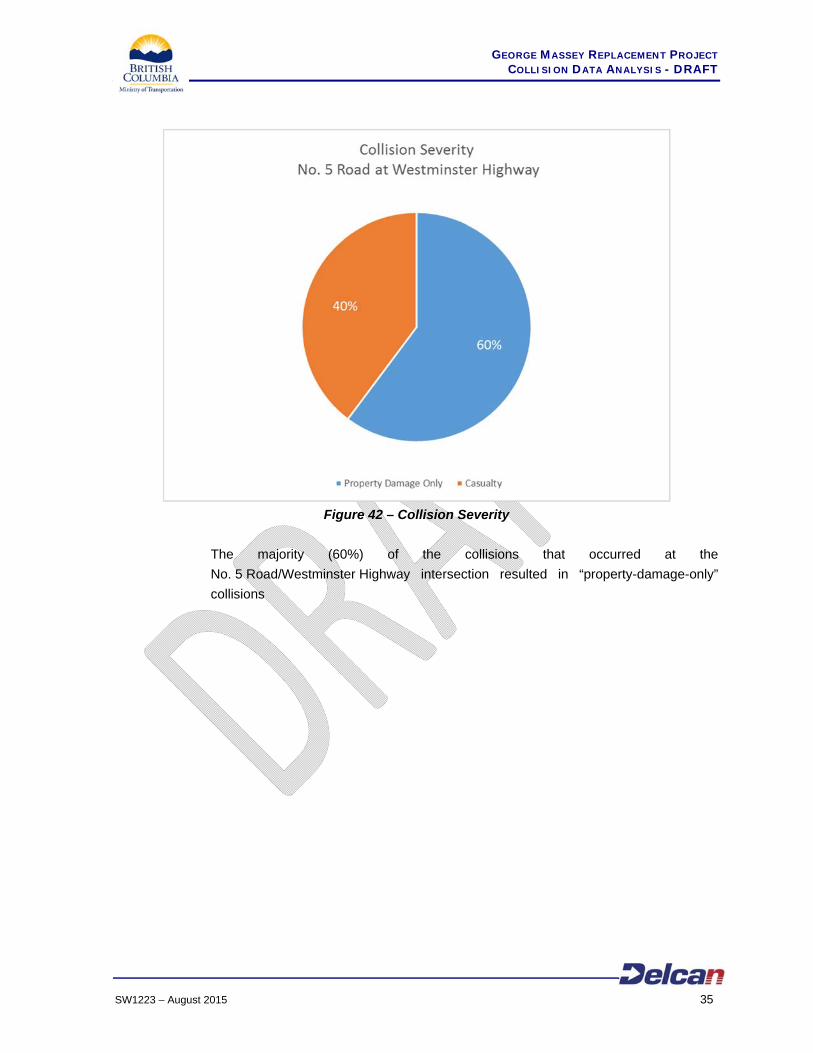
Figure 42 – Collision Severity
The majority (60%) of the collisions that occurred at the
No. 5 Road/Westminster Highway intersection resulted in “property-damage-only”
collisions
GEORGE MASSEY REPLACEMENT PROJECT COLLISION DATA ANALYSIS - DRAFT
SW1223 – August 2015 36
4.2.1.5 152 Street at 32 Avenue
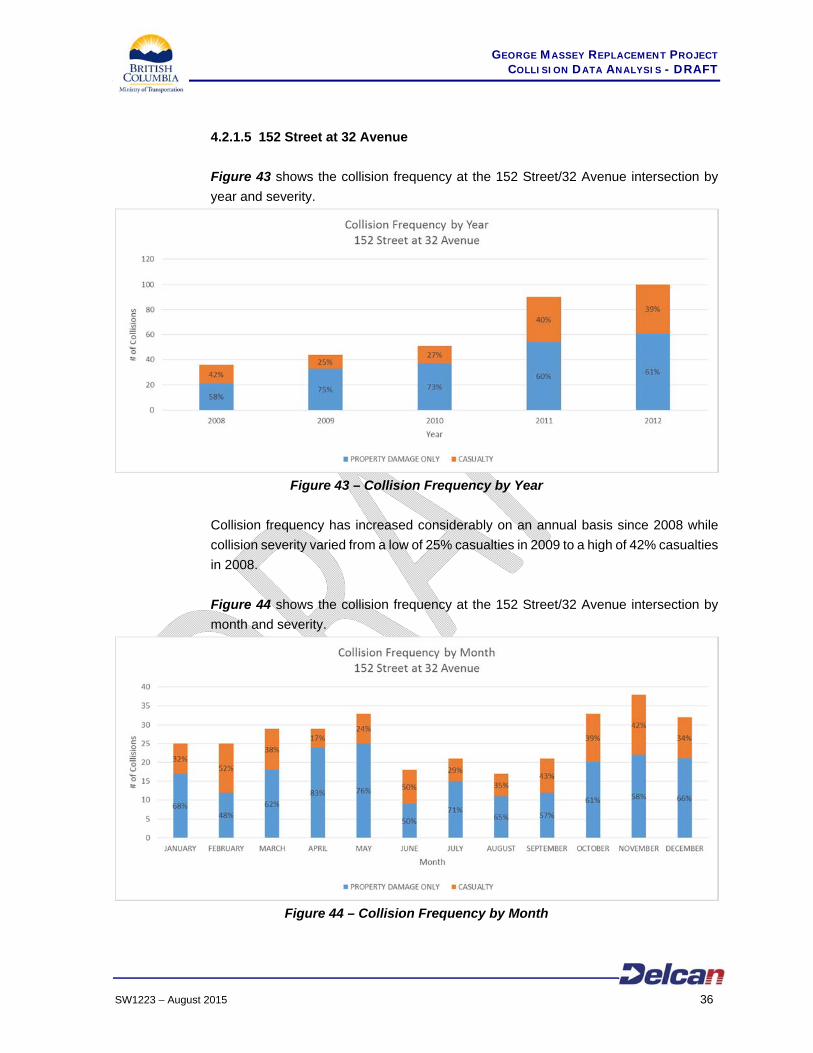
Figure 43 shows the collision frequency at the 152 Street/32 Avenue intersection by
year and severity.
Figure 43 – Collision Frequency by Year
Collision frequency has increased considerably on an annual basis since 2008 while
collision severity varied from a low of 25% casualties in 2009 to a high of 42% casualties
in 2008.
Figure 44 shows the collision frequency at the 152 Street/32 Avenue intersection by
month and severity.
Figure 44 – Collision Frequency by Month
GEORGE MASSEY REPLACEMENT PROJECT COLLISION DATA ANALYSIS - DRAFT
SW1223 – August 2015 37
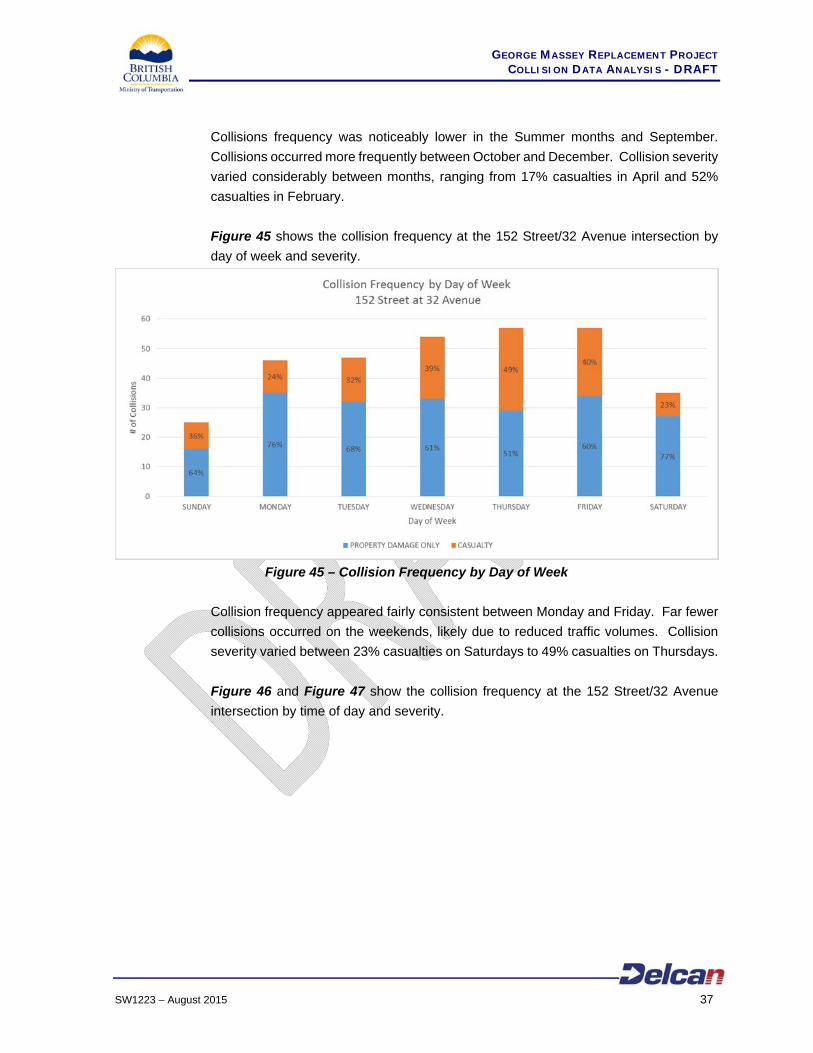
Collisions frequency was noticeably lower in the Summer months and September.
Collisions occurred more frequently between October and December. Collision severity
varied considerably between months, ranging from 17% casualties in April and 52%
casualties in February.
Figure 45 shows the collision frequency at the 152 Street/32 Avenue intersection by
day of week and severity.
Figure 45 – Collision Frequency by Day of Week
Collision frequency appeared fairly consistent between Monday and Friday. Far fewer
collisions occurred on the weekends, likely due to reduced traffic volumes. Collision
severity varied between 23% casualties on Saturdays to 49% casualties on Thursdays.
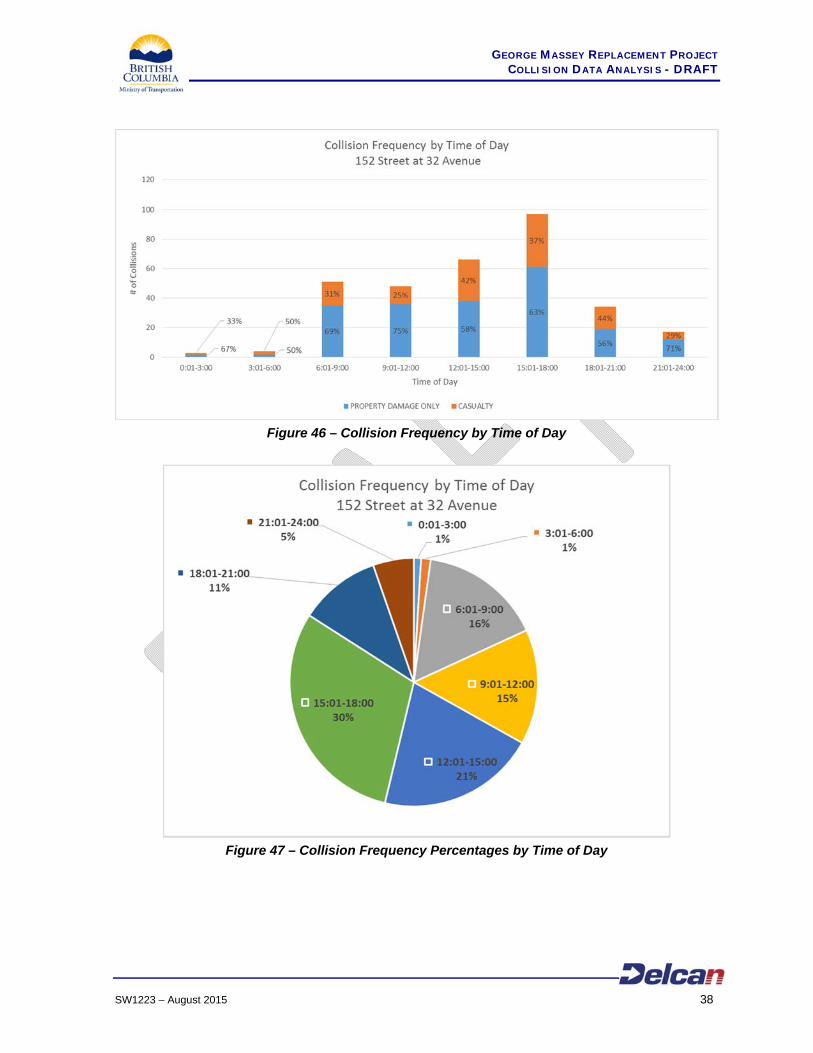
Figure 46 and Figure 47 show the collision frequency at the 152 Street/32 Avenue
intersection by time of day and severity.
GEORGE MASSEY REPLACEMENT PROJECT COLLISION DATA ANALYSIS - DRAFT
SW1223 – August 2015 38
Figure 46 – Collision Frequency by Time of Day
Figure 47 – Collision Frequency Percentages by Time of Day
GEORGE MASSEY REPLACEMENT PROJECT COLLISION DATA ANALYSIS - DRAFT
SW1223 – August 2015 39
Collisions occurred most frequently in the PM peak period, with 30% of all collisions
occurring between 3 pm and 6 pm. Collisions occurring between 12pm and 6pm
accounted for 51% of all collisions. Collision severity varied between 25% casualties in
the 9 am to 12 pm period, and 44% casualties in the 6 pm to 9 pm period. Few collisions
occurred between 12 am to 6 am.
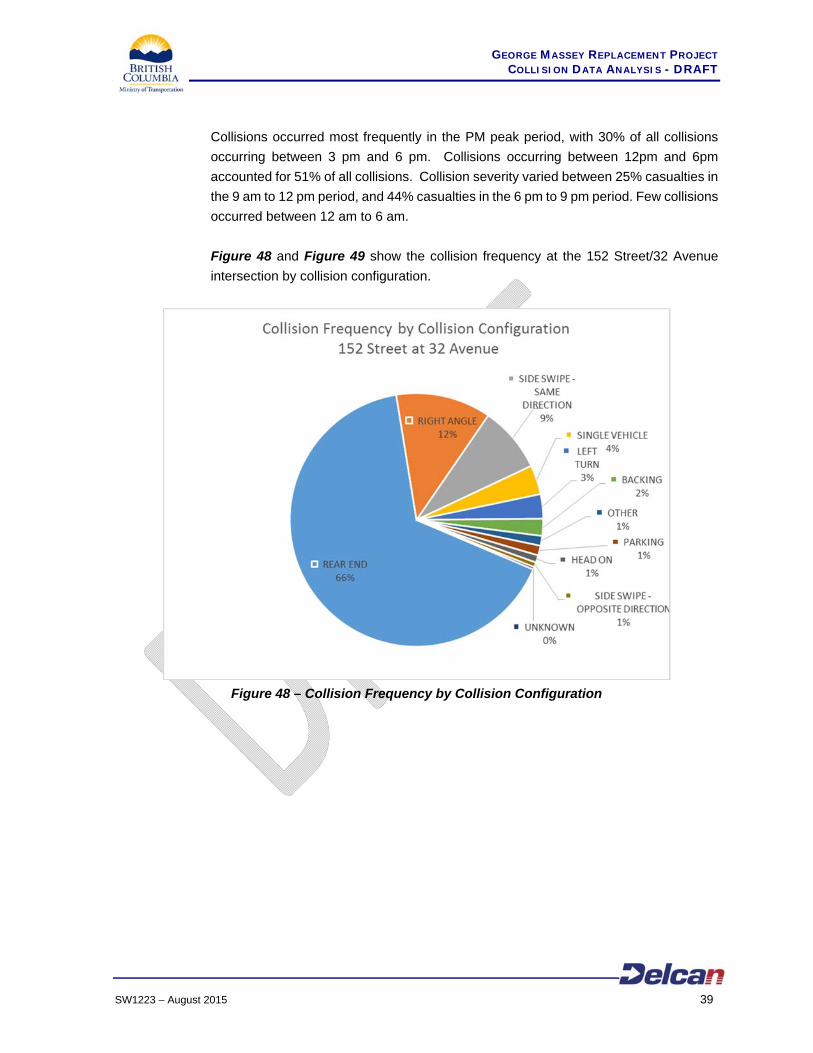
Figure 48 and Figure 49 show the collision frequency at the 152 Street/32 Avenue
intersection by collision configuration.
Figure 48 – Collision Frequency by Collision Configuration
GEORGE MASSEY REPLACEMENT PROJECT COLLISION DATA ANALYSIS - DRAFT
SW1223 – August 2015 40
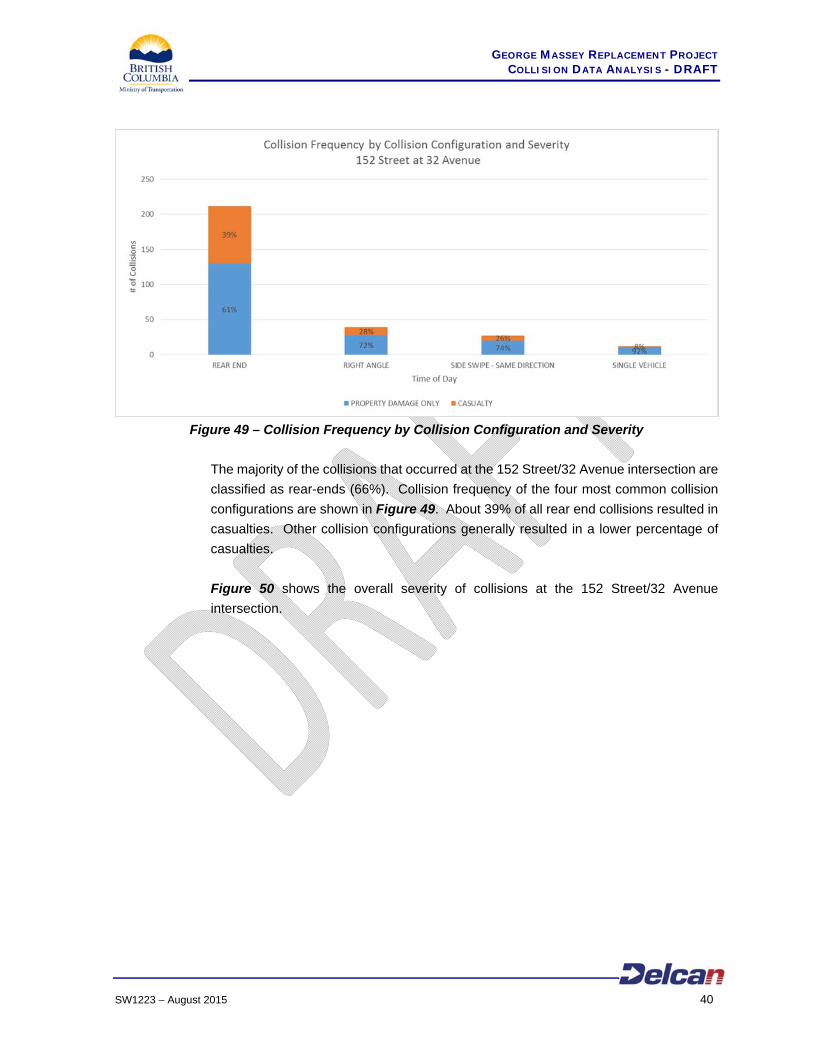
Figure 49 – Collision Frequency by Collision Configuration and Severity
The majority of the collisions that occurred at the 152 Street/32 Avenue intersection are
classified as rear-ends (66%). Collision frequency of the four most common collision
configurations are shown in Figure 49. About 39% of all rear end collisions resulted in
casualties. Other collision configurations generally resulted in a lower percentage of
casualties.
Figure 50 shows the overall severity of collisions at the 152 Street/32 Avenue
intersection.
GEORGE MASSEY REPLACEMENT PROJECT COLLISION DATA ANALYSIS - DRAFT
SW1223 – August 2015 41
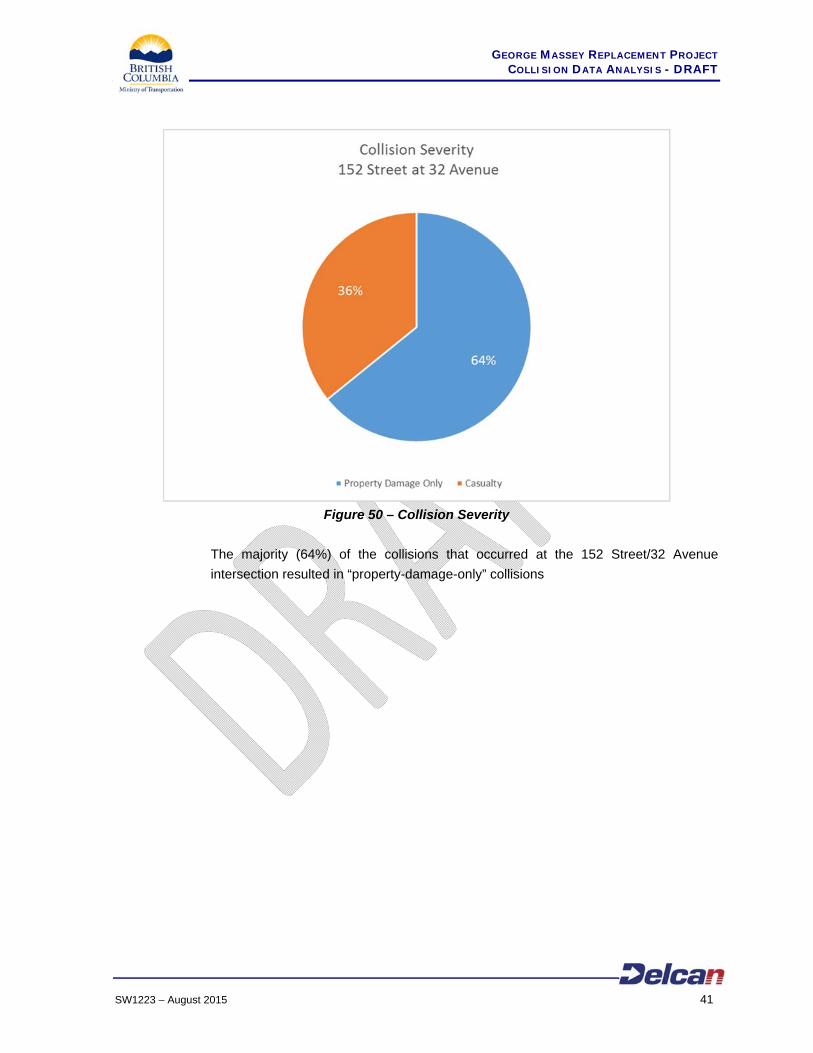
Figure 50 – Collision Severity
The majority (64%) of the collisions that occurred at the 152 Street/32 Avenue
intersection resulted in “property-damage-only” collisions
GEORGE MASSEY REPLACEMENT PROJECT COLLISION DATA ANALYSIS - DRAFT
SW1223 – August 2015 42
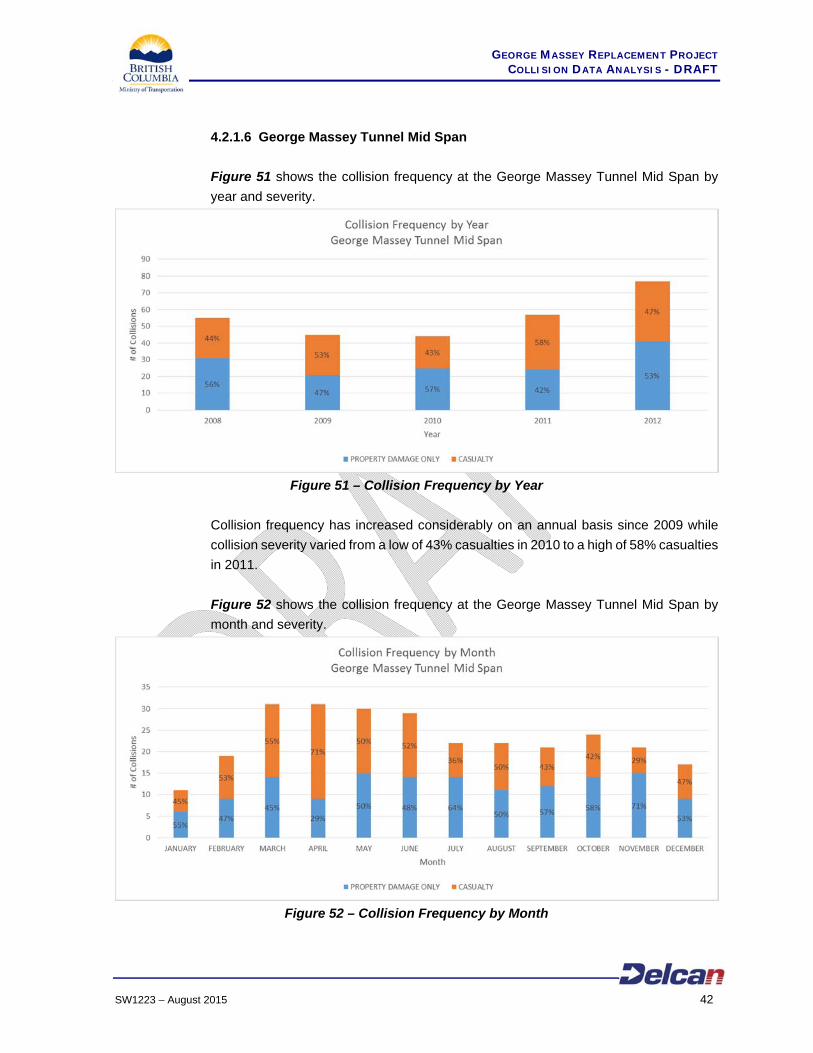
4.2.1.6 George Massey Tunnel Mid Span
Figure 51 shows the collision frequency at the George Massey Tunnel Mid Span by
year and severity.
Figure 51 – Collision Frequency by Year
Collision frequency has increased considerably on an annual basis since 2009 while
collision severity varied from a low of 43% casualties in 2010 to a high of 58% casualties
in 2011.
Figure 52 shows the collision frequency at the George Massey Tunnel Mid Span by
month and severity.
Figure 52 – Collision Frequency by Month
GEORGE MASSEY REPLACEMENT PROJECT COLLISION DATA ANALYSIS - DRAFT
SW1223 – August 2015 43
Collision frequency was noticeably higher during the spring and early summer months
between March and June. Collision severity varied considerably between months,
ranging from a low of 29% casualties in November to a high of 71% casualties in April.
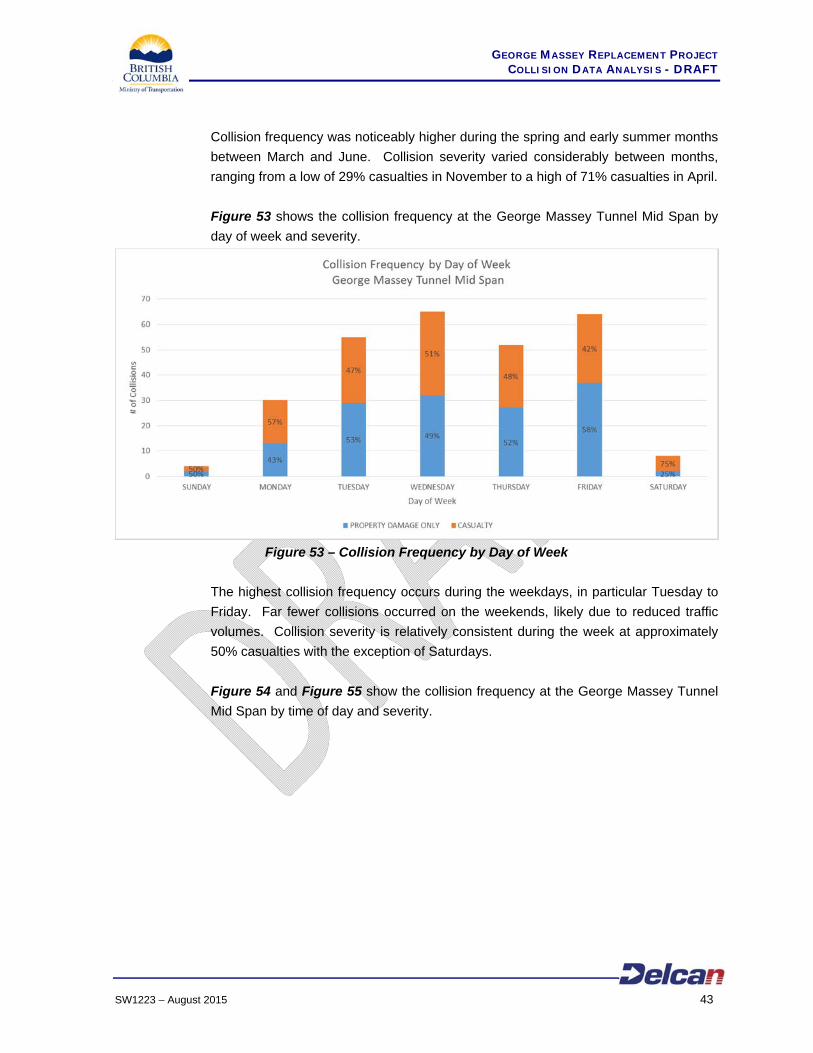
Figure 53 shows the collision frequency at the George Massey Tunnel Mid Span by
day of week and severity.
Figure 53 – Collision Frequency by Day of Week
The highest collision frequency occurs during the weekdays, in particular Tuesday to
Friday. Far fewer collisions occurred on the weekends, likely due to reduced traffic
volumes. Collision severity is relatively consistent during the week at approximately
50% casualties with the exception of Saturdays.
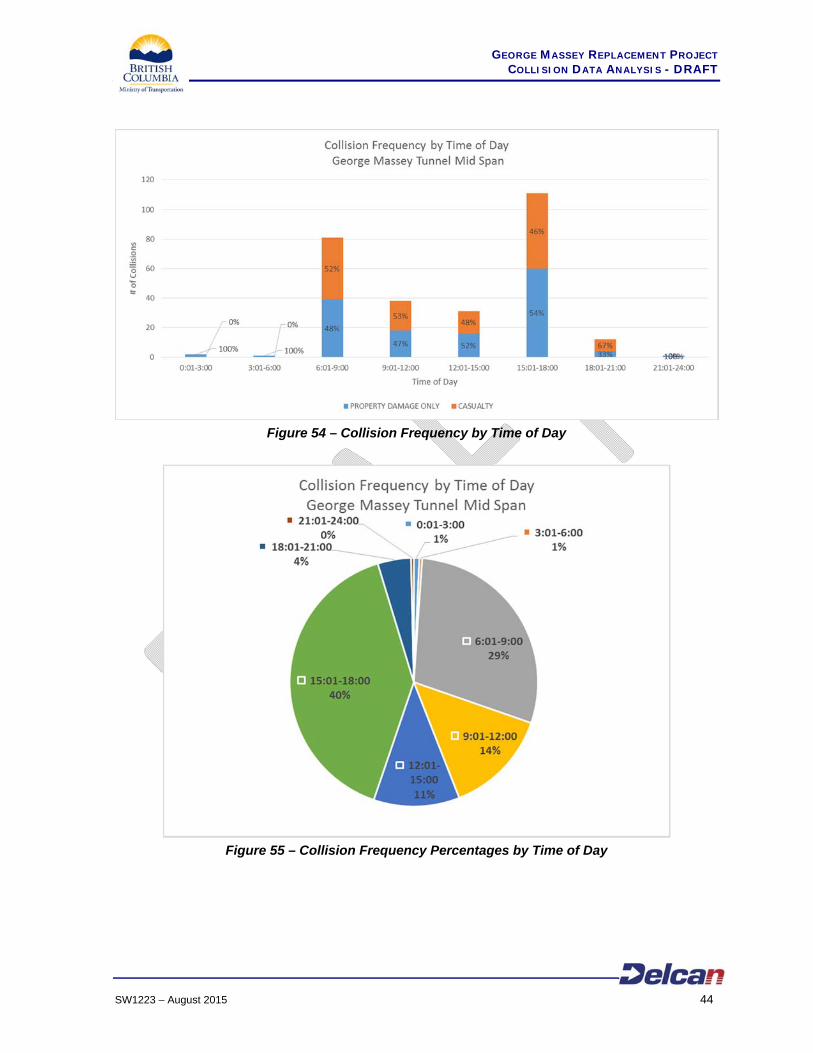
Figure 54 and Figure 55 show the collision frequency at the George Massey Tunnel
Mid Span by time of day and severity.
GEORGE MASSEY REPLACEMENT PROJECT COLLISION DATA ANALYSIS - DRAFT
SW1223 – August 2015 44
Figure 54 – Collision Frequency by Time of Day
Figure 55 – Collision Frequency Percentages by Time of Day
GEORGE MASSEY REPLACEMENT PROJECT COLLISION DATA ANALYSIS - DRAFT
SW1223 – August 2015 45
Collisions occurred most frequency during the AM and PM peak periods, with 29% of
all collisions occurring between 6 am and 9 am, and 40% of all collisions occurring
between 3 pm and 6 pm. Collision severity is approximately 50% casualties during the
busiest times of the day (6 am to 6 pm). Few collisions occurred between 12 am to 6
am.
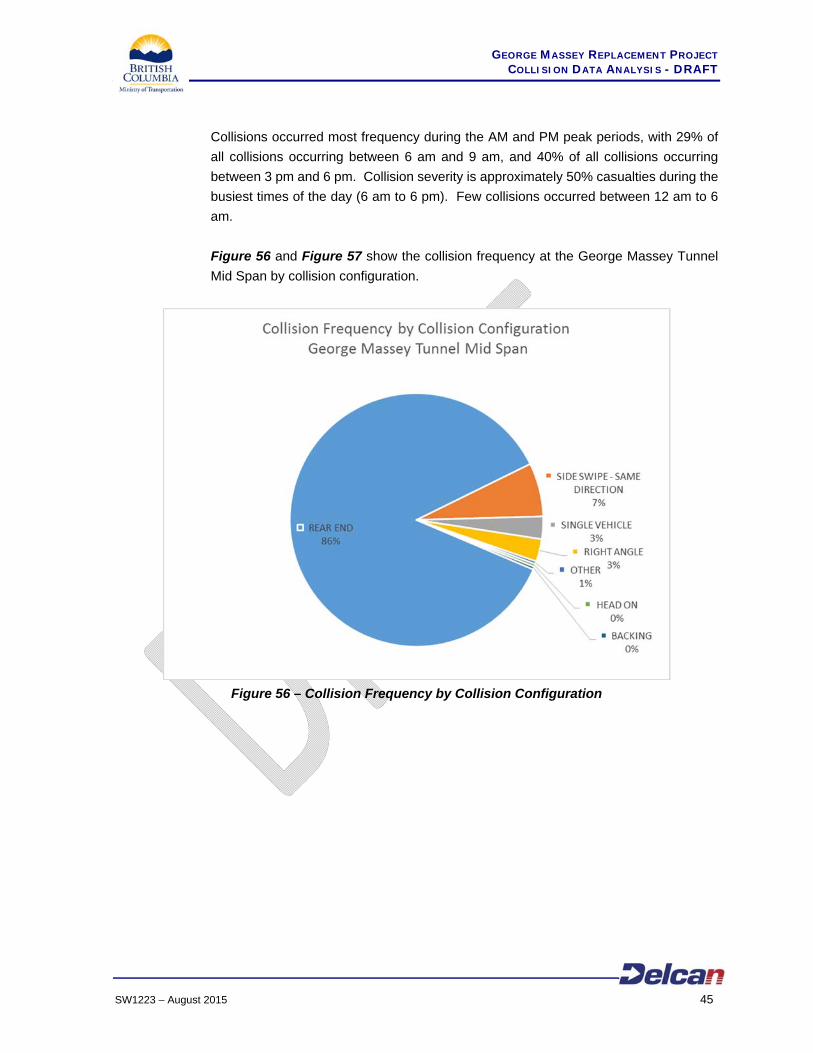
Figure 56 and Figure 57 show the collision frequency at the George Massey Tunnel
Mid Span by collision configuration.
Figure 56 – Collision Frequency by Collision Configuration
GEORGE MASSEY REPLACEMENT PROJECT COLLISION DATA ANALYSIS - DRAFT
SW1223 – August 2015 46
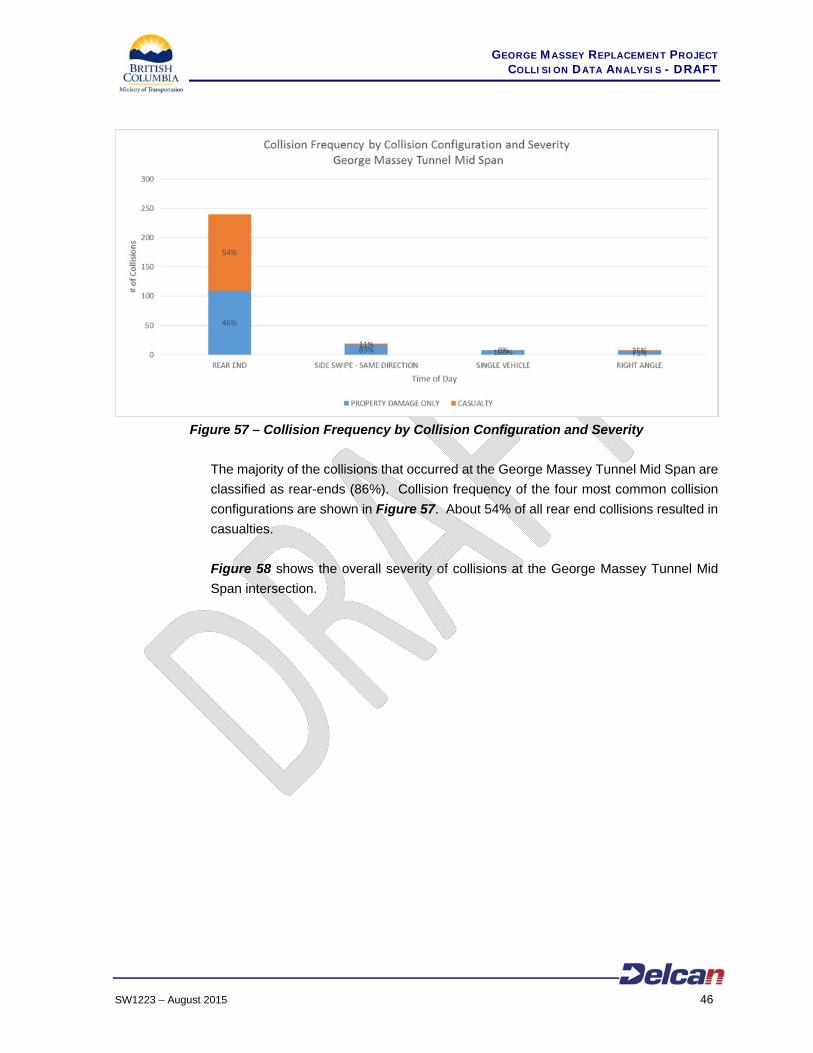
Figure 57 – Collision Frequency by Collision Configuration and Severity
The majority of the collisions that occurred at the George Massey Tunnel Mid Span are
classified as rear-ends (86%). Collision frequency of the four most common collision
configurations are shown in Figure 57. About 54% of all rear end collisions resulted in
casualties.
Figure 58 shows the overall severity of collisions at the George Massey Tunnel Mid
Span intersection.

GEORGE MASSEY REPLACEMENT PROJECT COLLISION DATA ANALYSIS - DRAFT
SW1223 – August 2015 47
Figure 58 – Collision Severity
Approximately half of the collisions that occurred at the George Massey Tunnel Mid
Span resulted in “property-damage-only” collisions and half resulted in casualties.

GEORGE MASSEY REPLACEMENT PROJECT COLLISION DATA ANALYSIS - DRAFT
SW1223 – August 2015 48
4.2.1.7 Highway 10 at Highway 99 Interchange
Figure 59 shows the collision frequency at the Highway 10/Highway 99 interchange by
year and severity.
Figure 59 – Collision Frequency by Year
Collision frequency generally varies between 50 to 60 collisions per year, with 2010
being an exception to the trend. Collision severity increased from a low of 33%
casualties in 2008 to a high of 49% casualties in 2012.
Figure 60 shows the collision frequency at the Highway 10/Highway 99 interchange by
month and severity.
Figure 60 – Collision Frequency by Month
GEORGE MASSEY REPLACEMENT PROJECT COLLISION DATA ANALYSIS - DRAFT
SW1223 – August 2015 49
Collision frequency showed fluctuations with fewer collisions occurring in March, June,
August, and November. Collisions frequency was highest in September. Collision
severity varied considerably between months, ranging from 17% casualties in
December to 60% casualties in June.
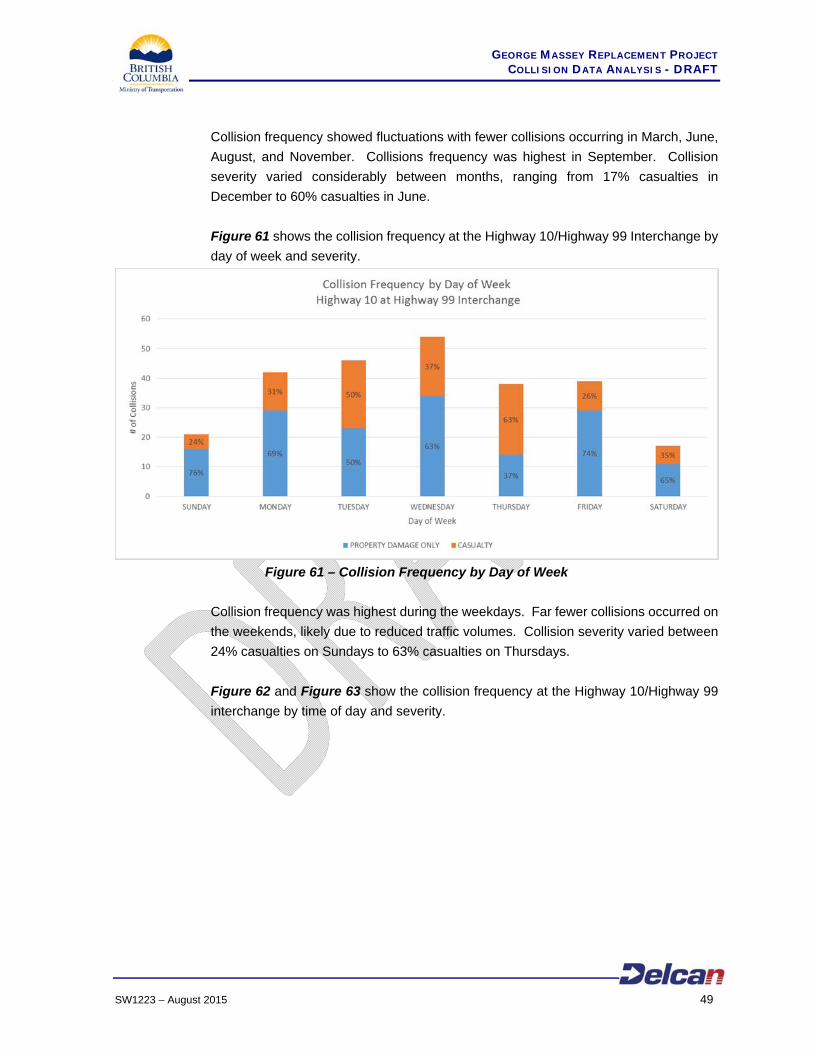
Figure 61 shows the collision frequency at the Highway 10/Highway 99 Interchange by
day of week and severity.
Figure 61 – Collision Frequency by Day of Week
Collision frequency was highest during the weekdays. Far fewer collisions occurred on
the weekends, likely due to reduced traffic volumes. Collision severity varied between
24% casualties on Sundays to 63% casualties on Thursdays.
Figure 62 and Figure 63 show the collision frequency at the Highway 10/Highway 99
interchange by time of day and severity.
GEORGE MASSEY REPLACEMENT PROJECT COLLISION DATA ANALYSIS - DRAFT
SW1223 – August 2015 50
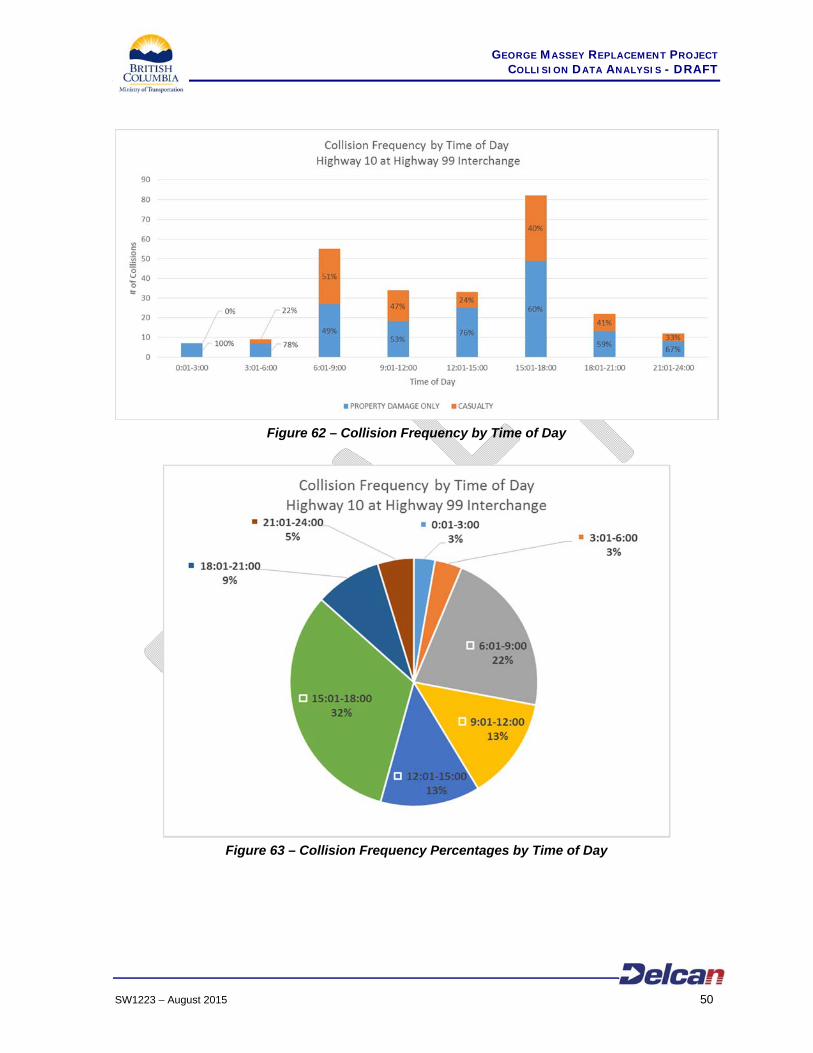
Figure 62 – Collision Frequency by Time of Day
Figure 63 – Collision Frequency Percentages by Time of Day

GEORGE MASSEY REPLACEMENT PROJECT COLLISION DATA ANALYSIS - DRAFT
SW1223 – August 2015 51
Collisions occurred most frequency during the AM and PM peak periods, with 22% of
all collisions occurring between 6 am and 9 am, and 32% of all collisions occurring
between 3 pm and 6 pm. Collision severity varied from 24% casualties between 12 pm
to 3 pm, to 51% casualties between 6 am to 9 am. Few collisions occurred between 12
am to 6 am.
Figure 64 and Figure 65 show the collision frequency at the Highway 10/Highway 99
interchange by collision configuration.
Figure 64 – Collision Frequency by Collision Configuration
GEORGE MASSEY REPLACEMENT PROJECT COLLISION DATA ANALYSIS - DRAFT
SW1223 – August 2015 52
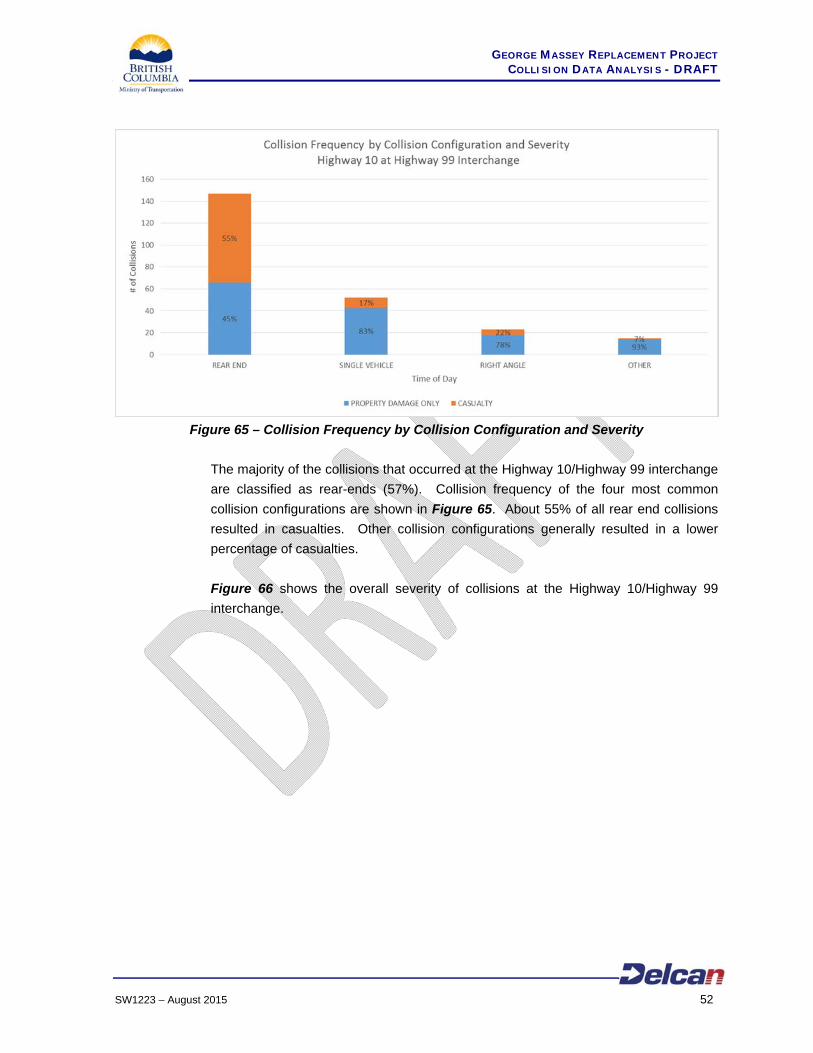
Figure 65 – Collision Frequency by Collision Configuration and Severity
The majority of the collisions that occurred at the Highway 10/Highway 99 interchange
are classified as rear-ends (57%). Collision frequency of the four most common
collision configurations are shown in Figure 65. About 55% of all rear end collisions
resulted in casualties. Other collision configurations generally resulted in a lower
percentage of casualties.
Figure 66 shows the overall severity of collisions at the Highway 10/Highway 99
interchange.
GEORGE MASSEY REPLACEMENT PROJECT COLLISION DATA ANALYSIS - DRAFT
SW1223 – August 2015 53
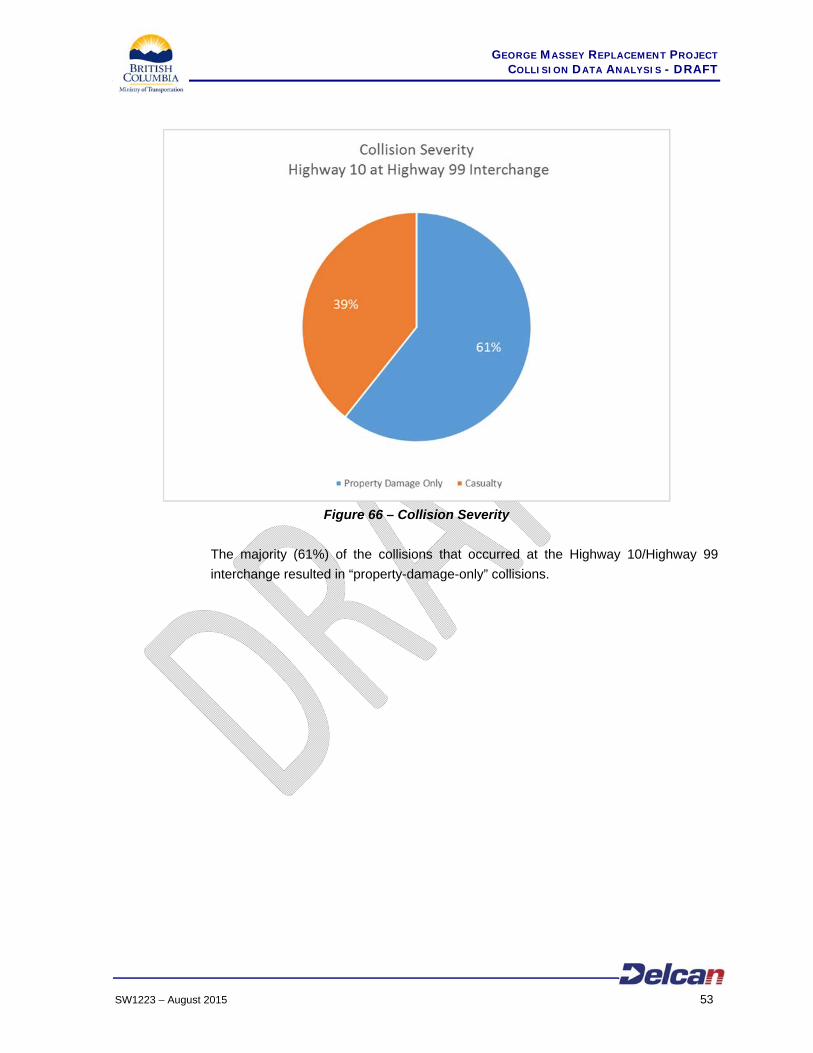
Figure 66 – Collision Severity
The majority (61%) of the collisions that occurred at the Highway 10/Highway 99
interchange resulted in “property-damage-only” collisions.
GEORGE MASSEY REPLACEMENT PROJECT COLLISION DATA ANALYSIS - DRAFT
SW1223 – August 2015 54
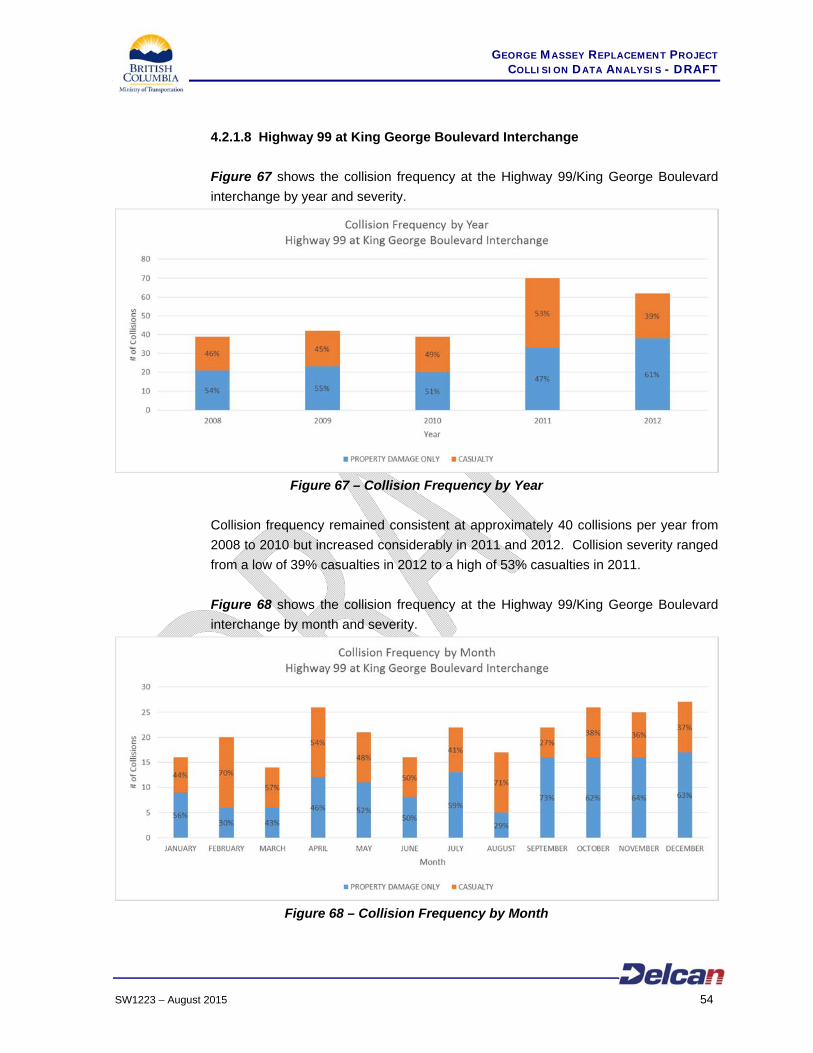
4.2.1.8 Highway 99 at King George Boulevard Interchange
Figure 67 shows the collision frequency at the Highway 99/King George Boulevard
interchange by year and severity.
Figure 67 – Collision Frequency by Year
Collision frequency remained consistent at approximately 40 collisions per year from
2008 to 2010 but increased considerably in 2011 and 2012. Collision severity ranged
from a low of 39% casualties in 2012 to a high of 53% casualties in 2011.
Figure 68 shows the collision frequency at the Highway 99/King George Boulevard
interchange by month and severity.
Figure 68 – Collision Frequency by Month
GEORGE MASSEY REPLACEMENT PROJECT COLLISION DATA ANALYSIS - DRAFT
SW1223 – August 2015 55
Collision frequency was highest in April and during the fall and early winter months from
September to December. The lowest collision frequency months are January, March
and June. Collision severity varied between months, ranging from a low of 27% in
September to 71% in August.
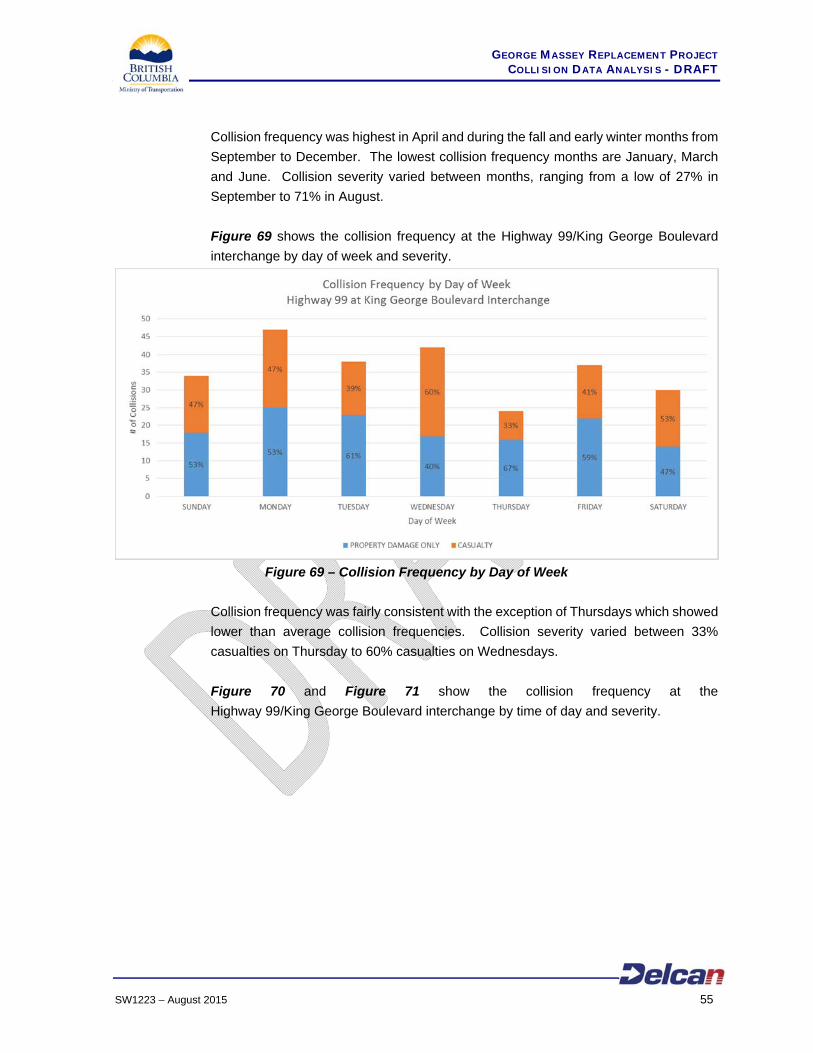
Figure 69 shows the collision frequency at the Highway 99/King George Boulevard
interchange by day of week and severity.
Figure 69 – Collision Frequency by Day of Week
Collision frequency was fairly consistent with the exception of Thursdays which showed
lower than average collision frequencies. Collision severity varied between 33%
casualties on Thursday to 60% casualties on Wednesdays.
Figure 70 and Figure 71 show the collision frequency at the
Highway 99/King George Boulevard interchange by time of day and severity.
GEORGE MASSEY REPLACEMENT PROJECT COLLISION DATA ANALYSIS - DRAFT
SW1223 – August 2015 56
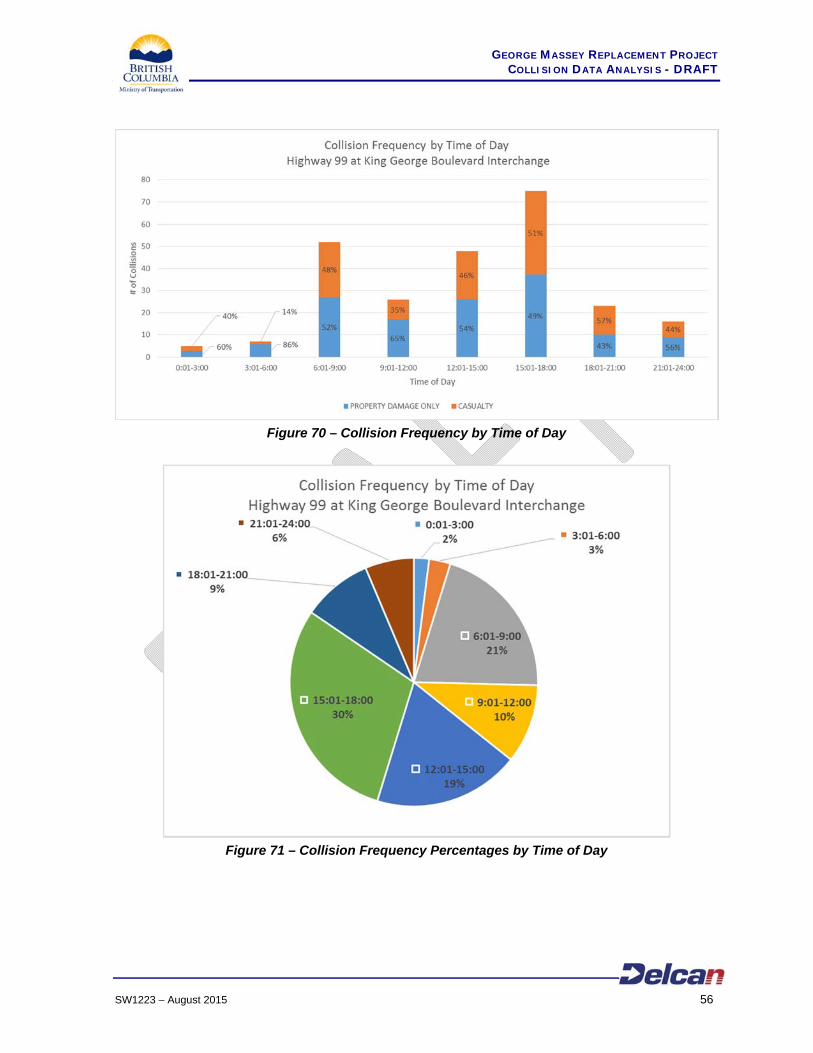
Figure 70 – Collision Frequency by Time of Day
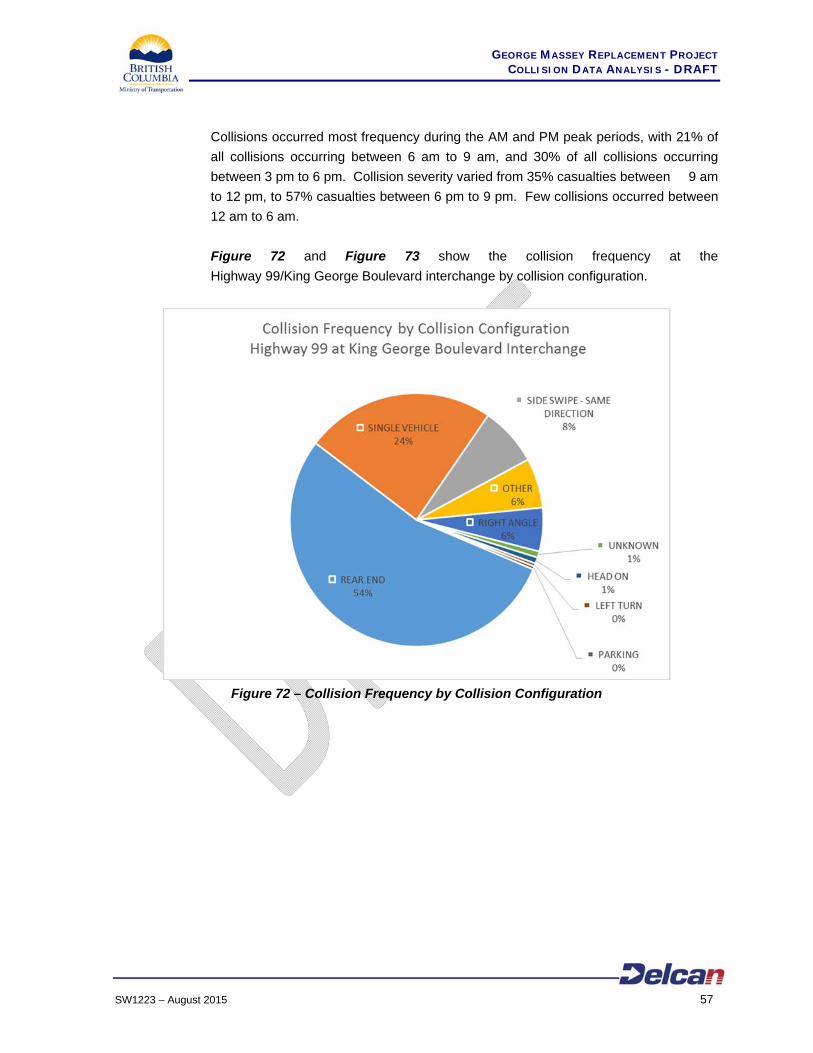
Figure 71 – Collision Frequency Percentages by Time of Day
GEORGE MASSEY REPLACEMENT PROJECT COLLISION DATA ANALYSIS - DRAFT
SW1223 – August 2015 57
Collisions occurred most frequency during the AM and PM peak periods, with 21% of
all collisions occurring between 6 am to 9 am, and 30% of all collisions occurring
between 3 pm to 6 pm. Collision severity varied from 35% casualties between 9 am
to 12 pm, to 57% casualties between 6 pm to 9 pm. Few collisions occurred between
12 am to 6 am.
Figure 72 and Figure 73 show the collision frequency at the
Highway 99/King George Boulevard interchange by collision configuration.
Figure 72 – Collision Frequency by Collision Configuration
GEORGE MASSEY REPLACEMENT PROJECT COLLISION DATA ANALYSIS - DRAFT
SW1223 – August 2015 58
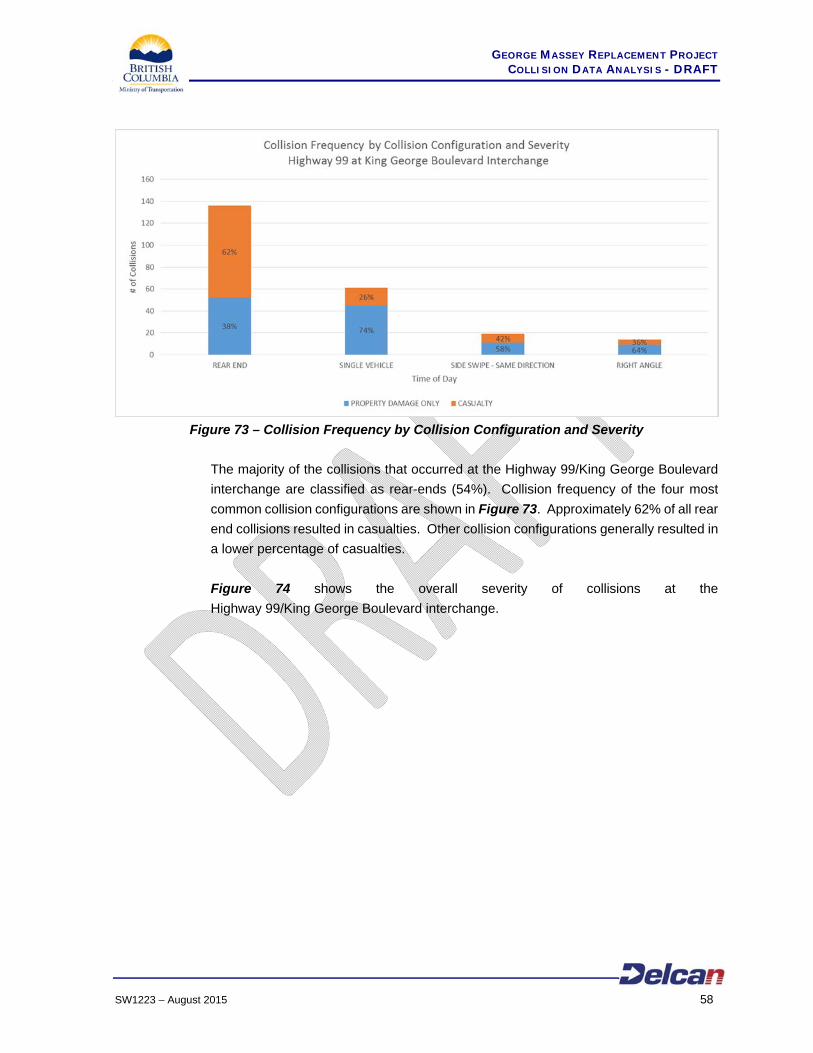
Figure 73 – Collision Frequency by Collision Configuration and Severity
The majority of the collisions that occurred at the Highway 99/King George Boulevard
interchange are classified as rear-ends (54%). Collision frequency of the four most
common collision configurations are shown in Figure 73. Approximately 62% of all rear
end collisions resulted in casualties. Other collision configurations generally resulted in
a lower percentage of casualties.
Figure 74 shows the overall severity of collisions at the
Highway 99/King George Boulevard interchange.
GEORGE MASSEY REPLACEMENT PROJECT COLLISION DATA ANALYSIS - DRAFT
SW1223 – August 2015 59
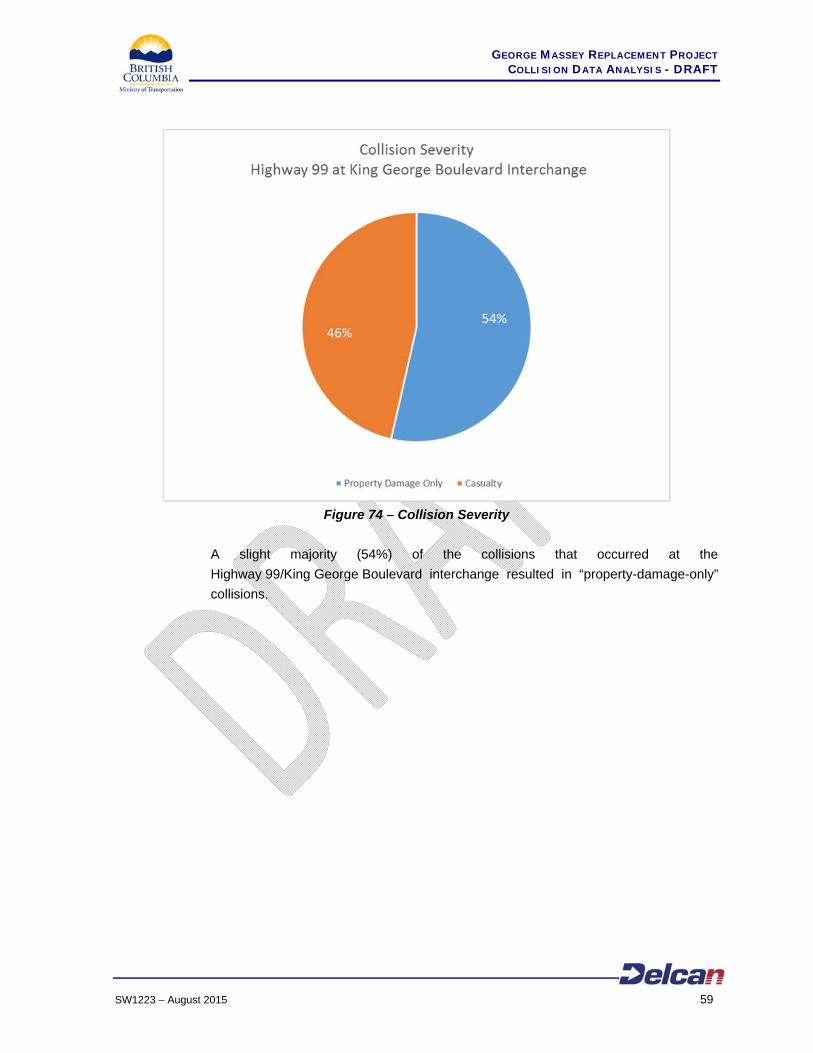
Figure 74 – Collision Severity
A slight majority (54%) of the collisions that occurred at the
Highway 99/King George Boulevard interchange resulted in “property-damage-only”
collisions.
GEORGE MASSEY REPLACEMENT PROJECT COLLISION DATA ANALYSIS - DRAFT
SW1223 – August 2015 60
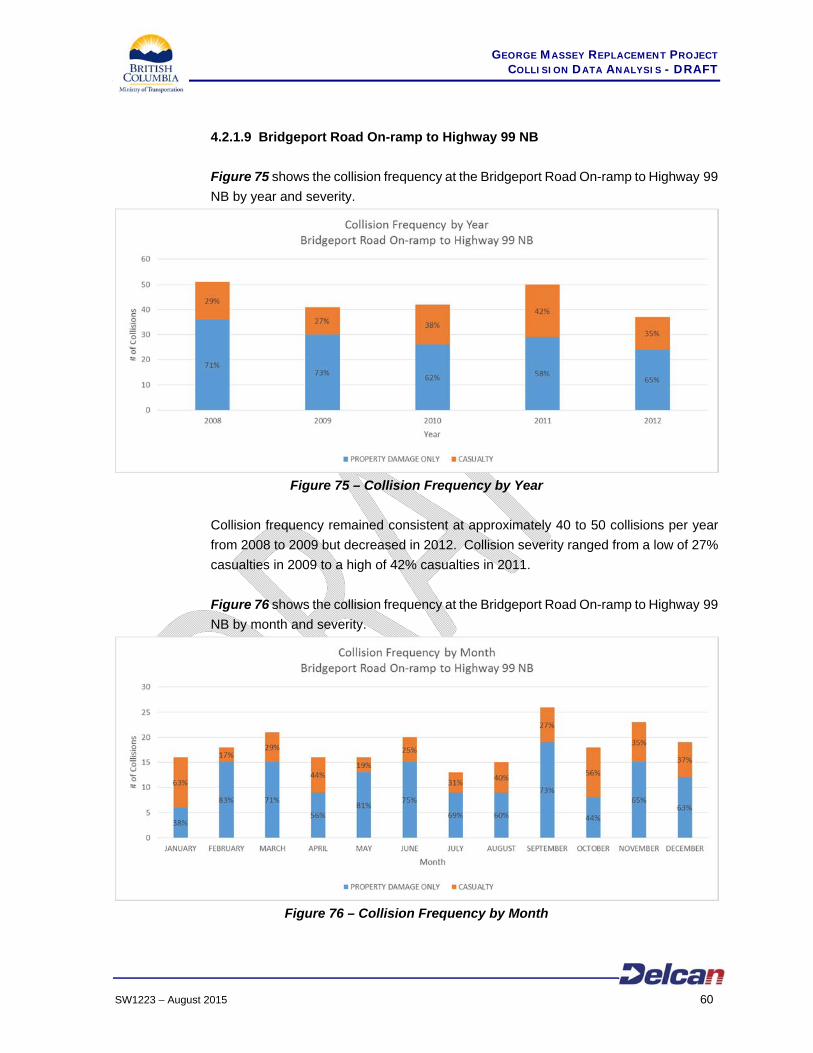
4.2.1.9 Bridgeport Road On-ramp to Highway 99 NB
Figure 75 shows the collision frequency at the Bridgeport Road On-ramp to Highway 99
NB by year and severity.
Figure 75 – Collision Frequency by Year
Collision frequency remained consistent at approximately 40 to 50 collisions per year
from 2008 to 2009 but decreased in 2012. Collision severity ranged from a low of 27%
casualties in 2009 to a high of 42% casualties in 2011.
Figure 76 shows the collision frequency at the Bridgeport Road On-ramp to Highway 99
NB by month and severity.
Figure 76 – Collision Frequency by Month
GEORGE MASSEY REPLACEMENT PROJECT COLLISION DATA ANALYSIS - DRAFT
SW1223 – August 2015 61
Collision frequency was highest during March, June and the fall and early winter months
from September to December. The lowest collision frequency months generally
occurred during the summer. Collision severity varied between months, ranging from
a low of 17% casualties in February to a high of 63% casualties in January.
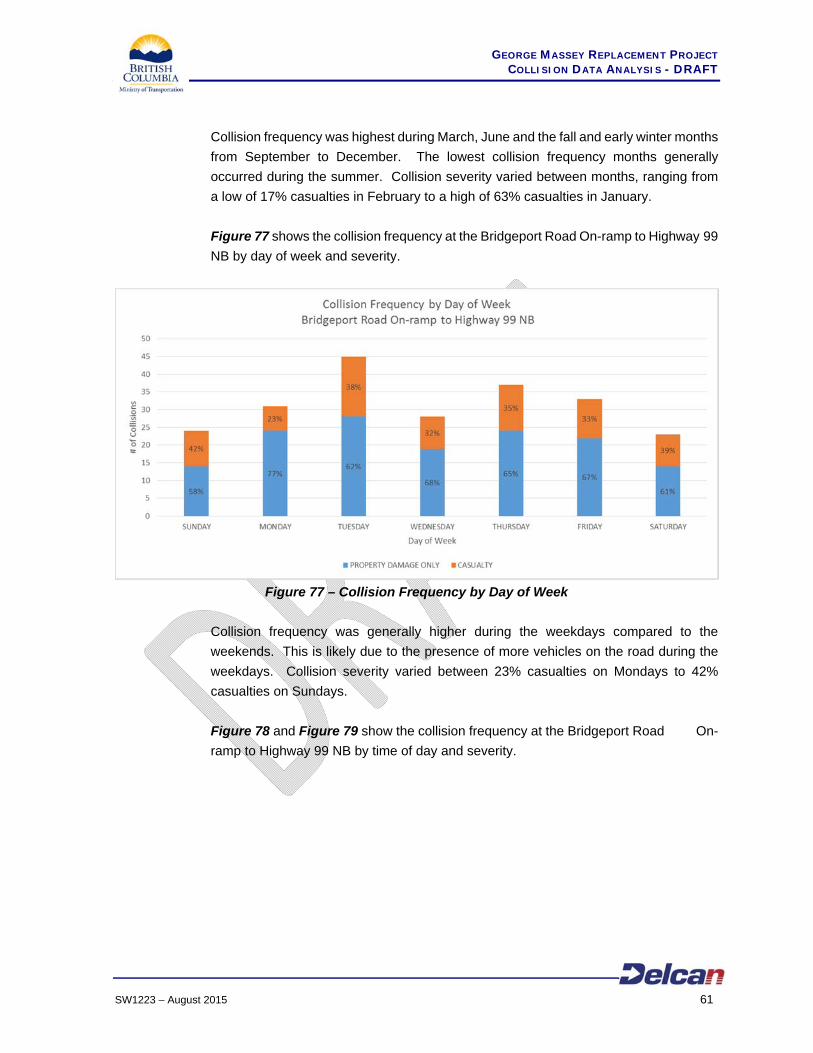
Figure 77 shows the collision frequency at the Bridgeport Road On-ramp to Highway 99
NB by day of week and severity.
Figure 77 – Collision Frequency by Day of Week
Collision frequency was generally higher during the weekdays compared to the
weekends. This is likely due to the presence of more vehicles on the road during the
weekdays. Collision severity varied between 23% casualties on Mondays to 42%
casualties on Sundays.
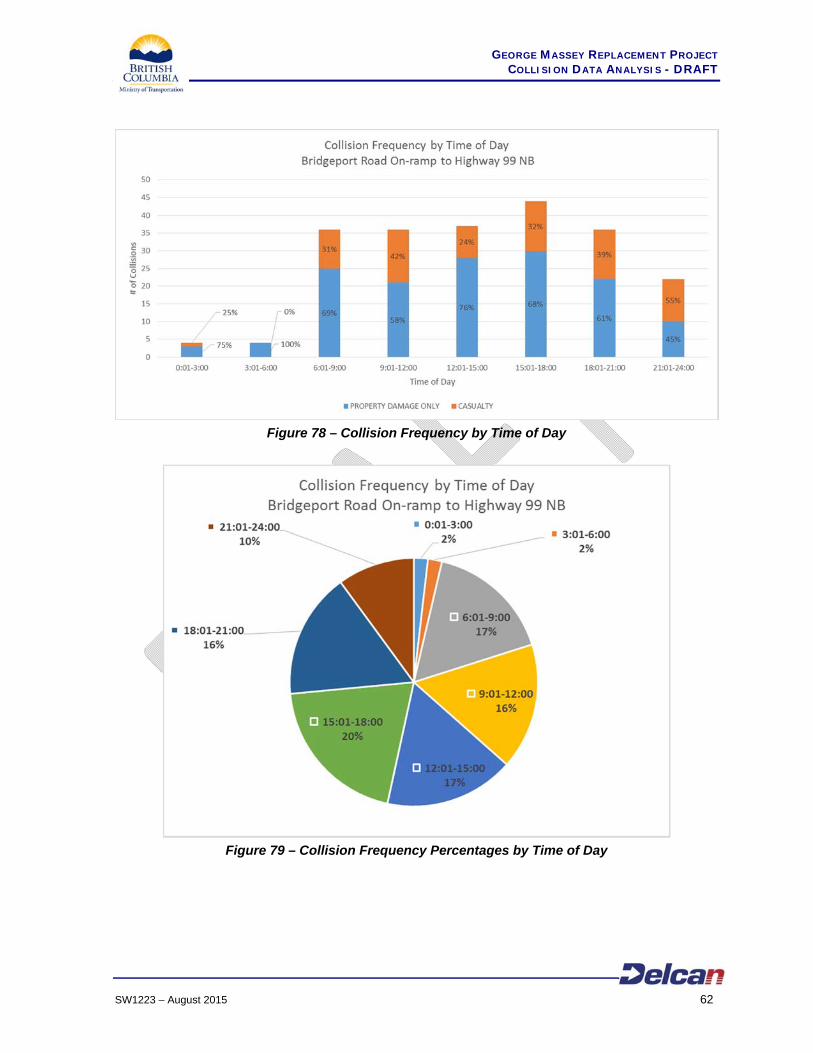
Figure 78 and Figure 79 show the collision frequency at the Bridgeport Road On-
ramp to Highway 99 NB by time of day and severity.
GEORGE MASSEY REPLACEMENT PROJECT COLLISION DATA ANALYSIS - DRAFT
SW1223 – August 2015 62
Figure 78 – Collision Frequency by Time of Day
Figure 79 – Collision Frequency Percentages by Time of Day
GEORGE MASSEY REPLACEMENT PROJECT COLLISION DATA ANALYSIS - DRAFT
SW1223 – August 2015 63
Collisions occurred with consistent frequency throughout the day. Collision severity
varied from 24% casualties between 12 pm to 3 pm, to 55% casualties between 9 pm
to 12 am. Few collisions occurred between 12 am to 6 am.
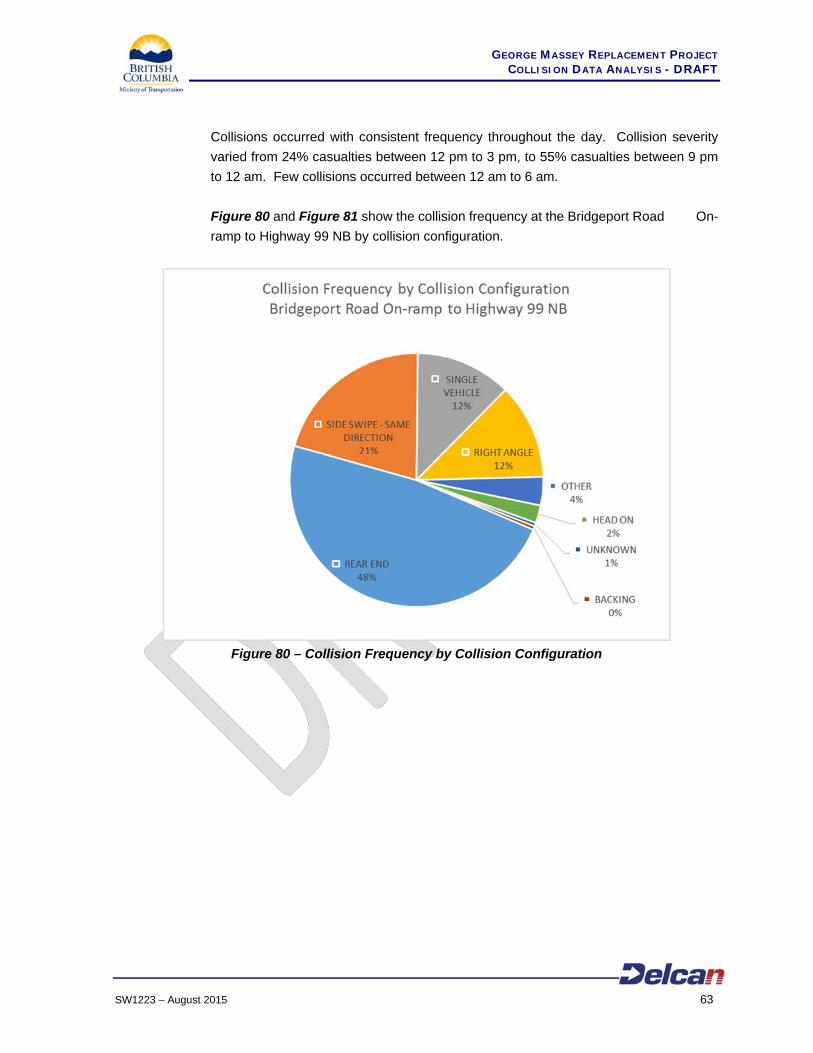
Figure 80 and Figure 81 show the collision frequency at the Bridgeport Road On-
ramp to Highway 99 NB by collision configuration.
Figure 80 – Collision Frequency by Collision Configuration
GEORGE MASSEY REPLACEMENT PROJECT COLLISION DATA ANALYSIS - DRAFT
SW1223 – August 2015 64
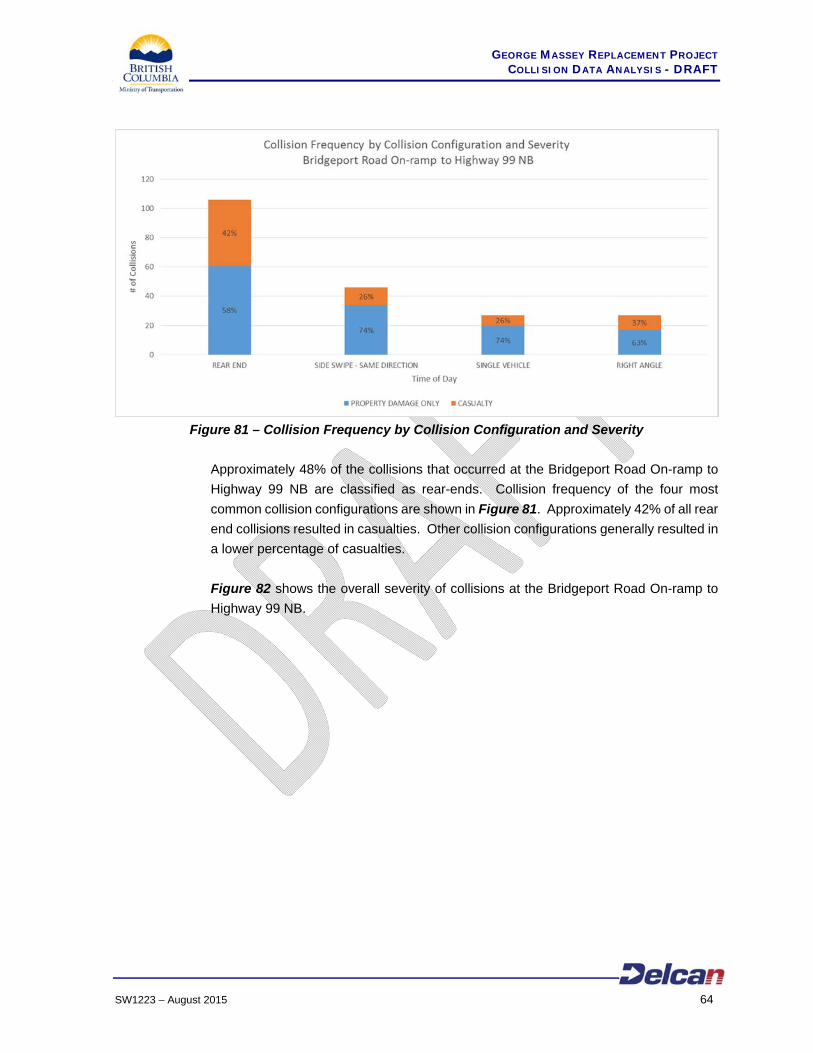
Figure 81 – Collision Frequency by Collision Configuration and Severity
Approximately 48% of the collisions that occurred at the Bridgeport Road On-ramp to
Highway 99 NB are classified as rear-ends. Collision frequency of the four most
common collision configurations are shown in Figure 81. Approximately 42% of all rear
end collisions resulted in casualties. Other collision configurations generally resulted in
a lower percentage of casualties.
Figure 82 shows the overall severity of collisions at the Bridgeport Road On-ramp to
Highway 99 NB.
GEORGE MASSEY REPLACEMENT PROJECT COLLISION DATA ANALYSIS - DRAFT
SW1223 – August 2015 65
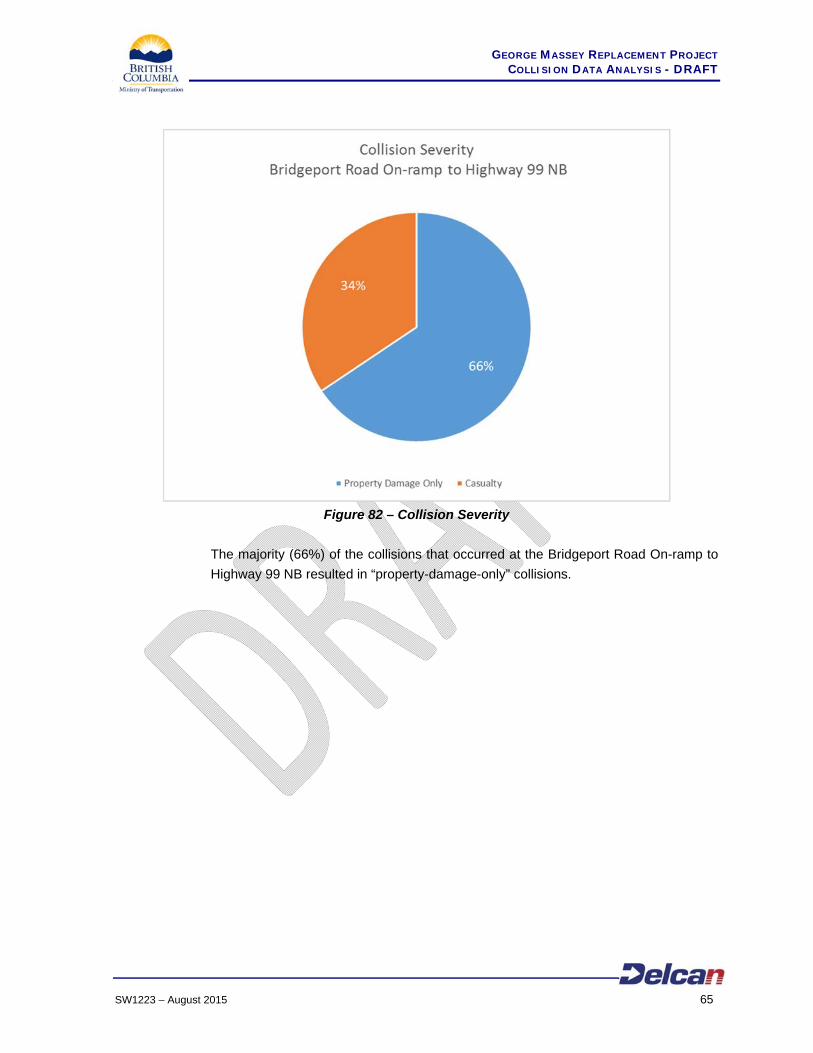
Figure 82 – Collision Severity
The majority (66%) of the collisions that occurred at the Bridgeport Road On-ramp to
Highway 99 NB resulted in “property-damage-only” collisions.
GEORGE MASSEY REPLACEMENT PROJECT COLLISION DATA ANALYSIS - DRAFT
SW1223 – August 2015 66
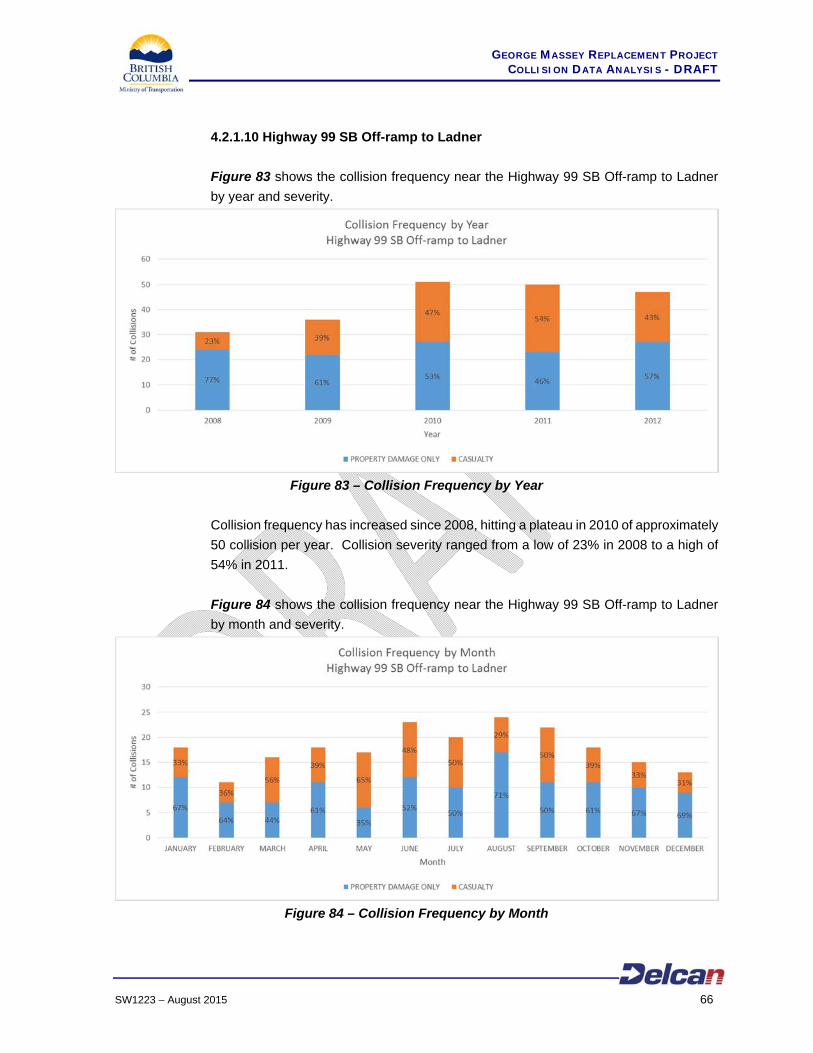
4.2.1.10 Highway 99 SB Off-ramp to Ladner
Figure 83 shows the collision frequency near the Highway 99 SB Off-ramp to Ladner
by year and severity.
Figure 83 – Collision Frequency by Year
Collision frequency has increased since 2008, hitting a plateau in 2010 of approximately
50 collision per year. Collision severity ranged from a low of 23% in 2008 to a high of
54% in 2011.
Figure 84 shows the collision frequency near the Highway 99 SB Off-ramp to Ladner
by month and severity.
Figure 84 – Collision Frequency by Month
GEORGE MASSEY REPLACEMENT PROJECT COLLISION DATA ANALYSIS - DRAFT
SW1223 – August 2015 67
Collision frequency was highest during the summer months from June to August. The
lowest collision frequency months occurred during the winter. Collision severity varied
between months, ranging from a low of 29% casualties in August to a high of 65%
casualties in May.
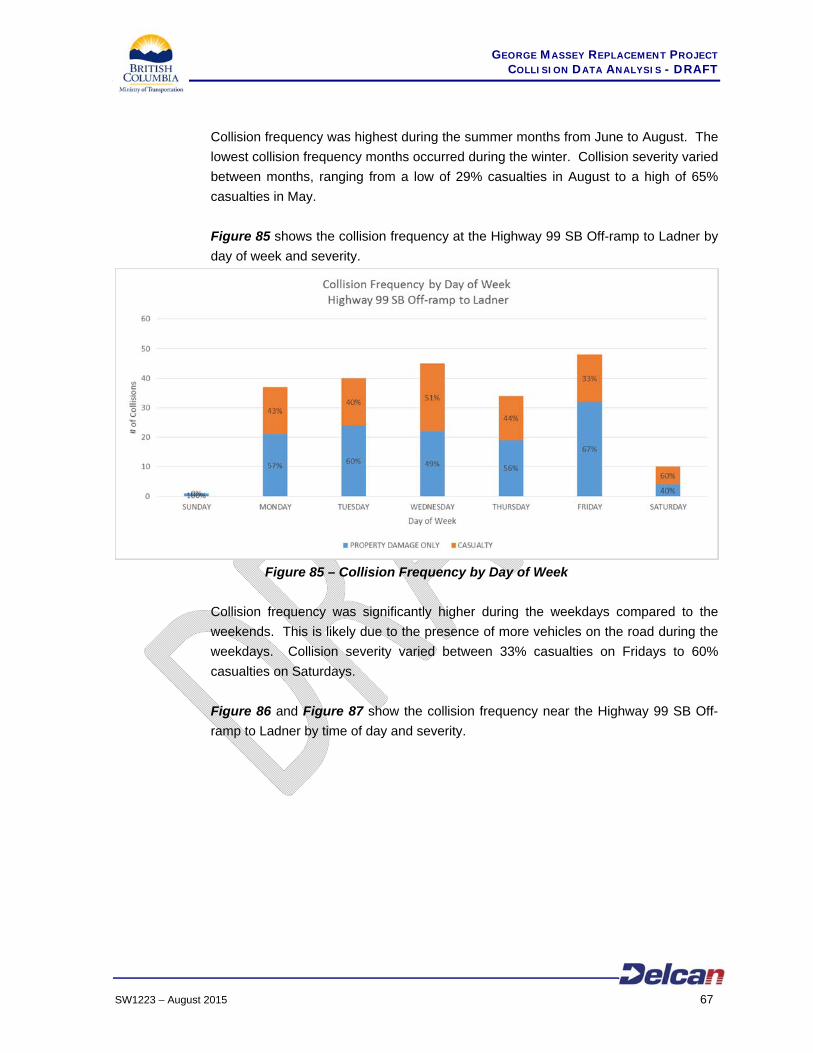
Figure 85 shows the collision frequency at the Highway 99 SB Off-ramp to Ladner by
day of week and severity.
Figure 85 – Collision Frequency by Day of Week
Collision frequency was significantly higher during the weekdays compared to the
weekends. This is likely due to the presence of more vehicles on the road during the
weekdays. Collision severity varied between 33% casualties on Fridays to 60%
casualties on Saturdays.
Figure 86 and Figure 87 show the collision frequency near the Highway 99 SB Off-
ramp to Ladner by time of day and severity.
GEORGE MASSEY REPLACEMENT PROJECT COLLISION DATA ANALYSIS - DRAFT
SW1223 – August 2015 68
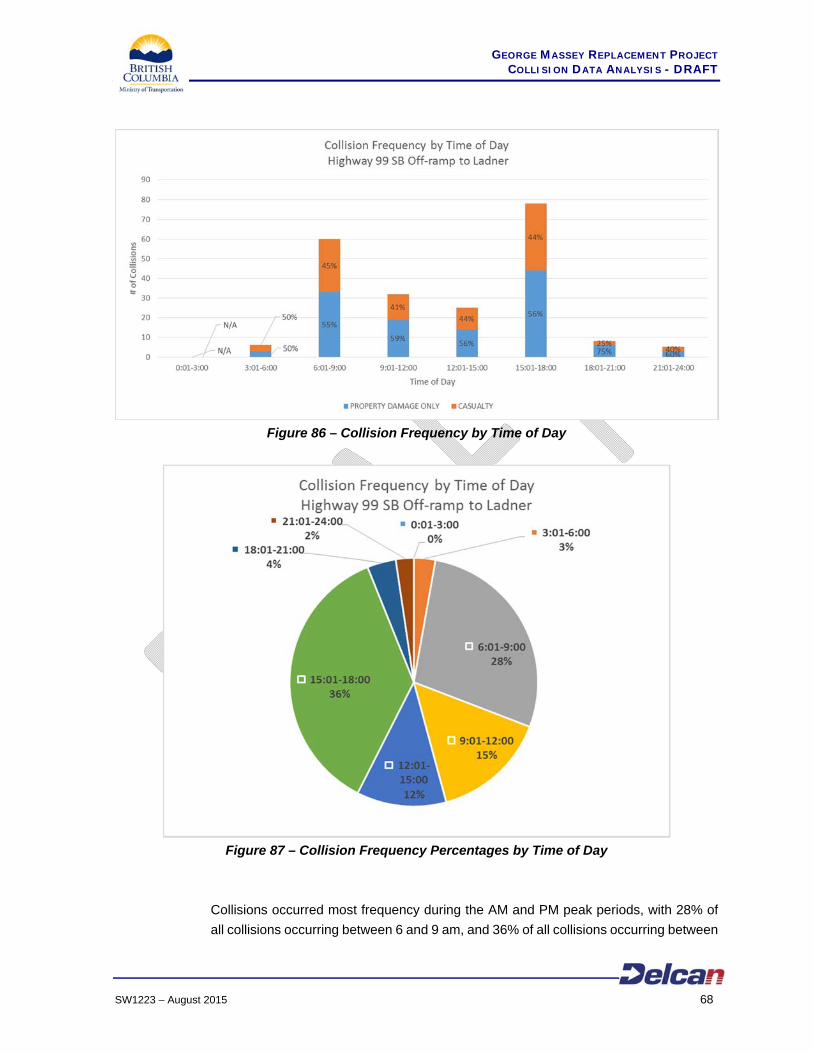
Figure 86 – Collision Frequency by Time of Day
Figure 87 – Collision Frequency Percentages by Time of Day
Collisions occurred most frequency during the AM and PM peak periods, with 28% of
all collisions occurring between 6 and 9 am, and 36% of all collisions occurring between
GEORGE MASSEY REPLACEMENT PROJECT COLLISION DATA ANALYSIS - DRAFT
SW1223 – August 2015 69
3 and 6 pm. Collision severity varied from 25% casualties between 6 pm to 9 pm, to
45% casualties between 6 am to 9 am. Few collisions occurred between 9 pm to 6 am.
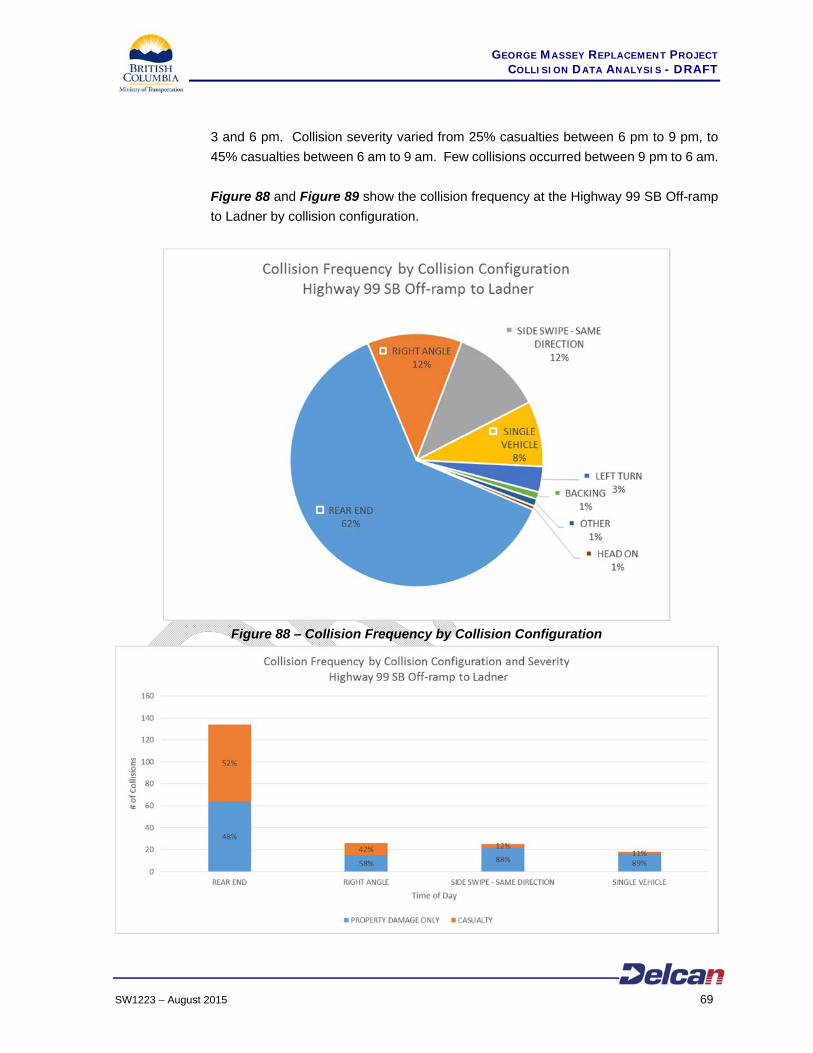
Figure 88 and Figure 89 show the collision frequency at the Highway 99 SB Off-ramp
to Ladner by collision configuration.
Figure 88 – Collision Frequency by Collision Configuration
GEORGE MASSEY REPLACEMENT PROJECT COLLISION DATA ANALYSIS - DRAFT
SW1223 – August 2015 70
Figure 89 – Collision Frequency by Collision Configuration and Severity
The majority of the collisions that occurred at the Highway 99 SB Off-ramp to Ladner
are classified as rear-ends. Collision frequency of the four most common collision
configurations are shown in Figure 89. Approximately 52% of all rear end collisions
resulted in casualties. Other collision configurations generally resulted in a lower
percentage of casualties.
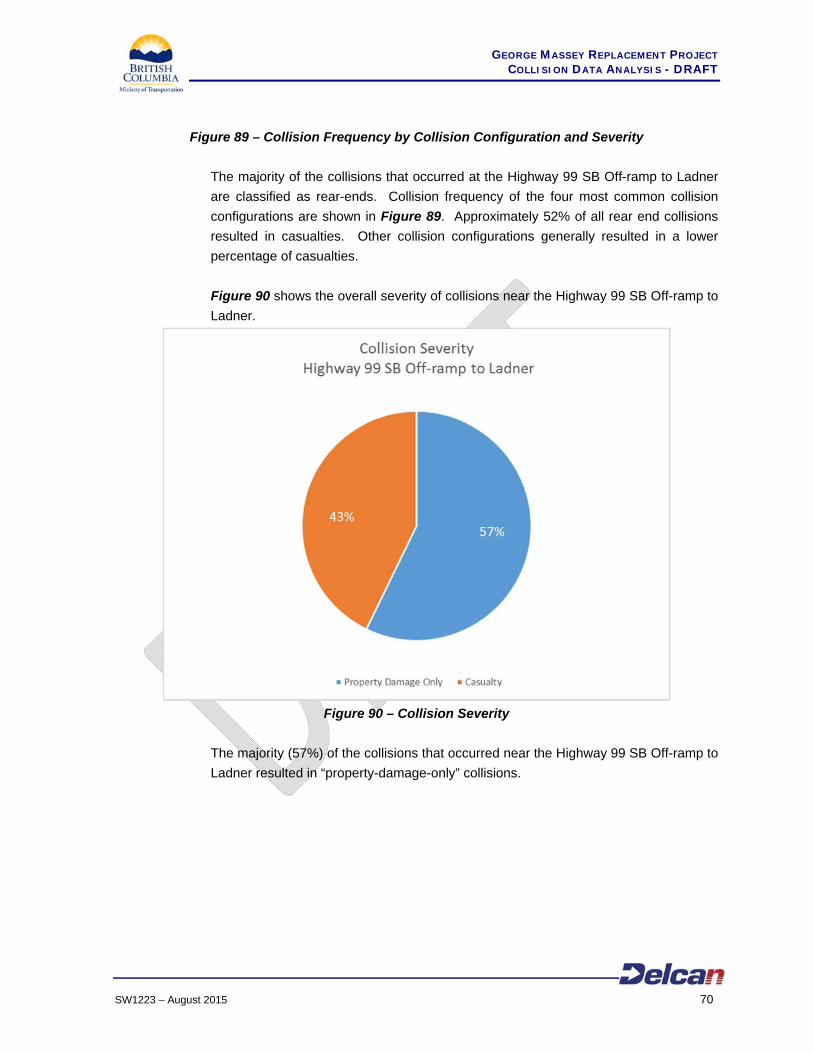
Figure 90 shows the overall severity of collisions near the Highway 99 SB Off-ramp to
Ladner.
Figure 90 – Collision Severity
The majority (57%) of the collisions that occurred near the Highway 99 SB Off-ramp to
Ladner resulted in “property-damage-only” collisions.