a seminar on eu feed rules and feed import requirements and the global feed trends “thailand feed...
TRANSCRIPT

A Seminar onEU Feed Rules and Feed Import
Requirements and the Global Feed Trends
“Thailand Feed Situation in 2013”
Mr. Boontham AramsiriwatSecretary General,TFMA
Mar 7, 2013Imperial Queen’s Park, Bangkok,
Thailand
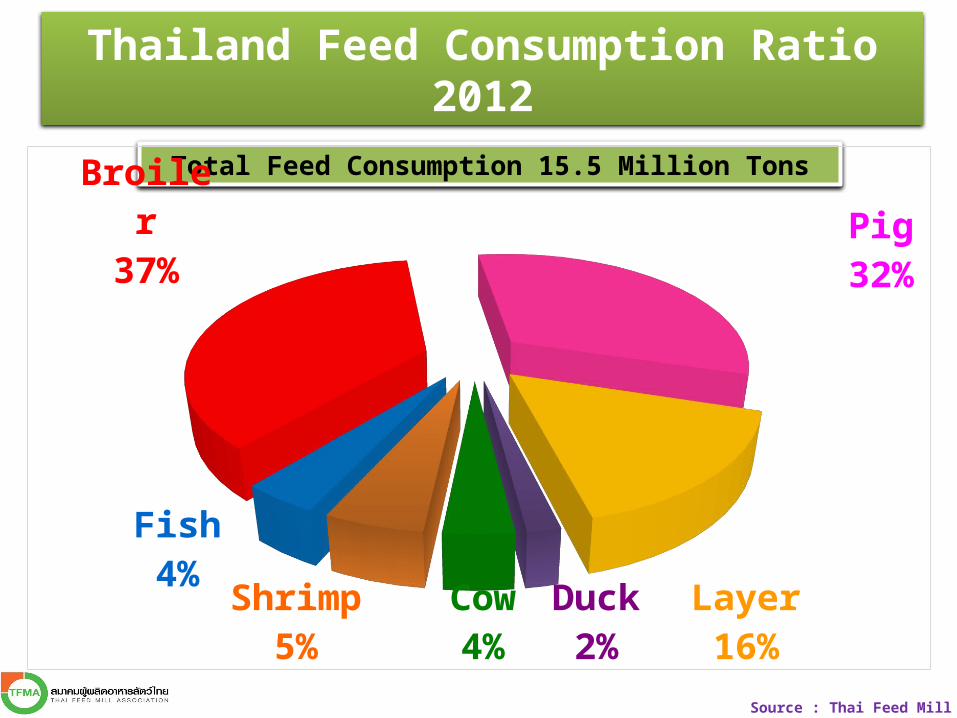
Thailand Feed Consumption Ratio 2012
Total Feed Consumption 15.5 Million Tons
Broiler37% Pig
32%
Layer16%Duck
2%Cow4%
Shrimp5%
Fish4%
Source : Thai Feed Mill Association, 2013

2004 2005 2006 2007 2008 2009 2010 2011 2012 2013*0
2
4
6
8
10
12
14
16
18
10.0 10.812.2 12.9 12.6 12.3 12.9
14.3 15.5 16.5
Million Tons
Thailand Feed Demand
Source : Thai Feed Mill Association, 2013
Feed Demand Δ 7.2 % per year
Bird Flu Crisis
Hamburger Crisis
Flood Crisis
Drought&Heat Wave
* : Forecast
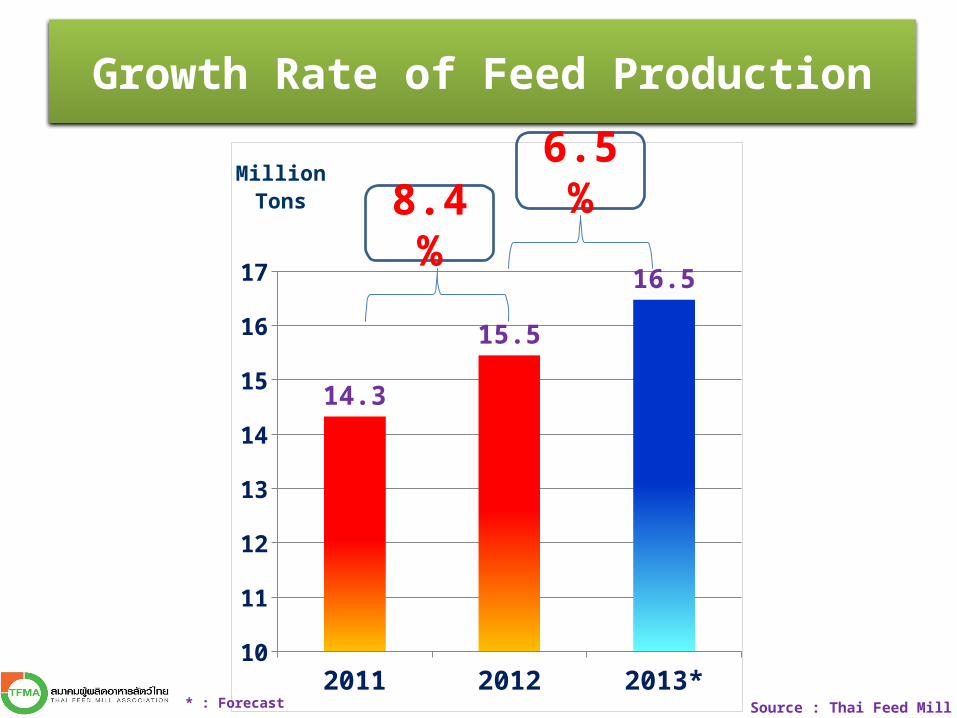
2011 2012 2013*10
11
12
13
14
15
16
17
14.3
15.5
16.5
Million Tons
Growth Rate of Feed Production
Source : Thai Feed Mill Association, 2013
8.4%
6.5%
* : Forecast

Soybean Meal CBOT
Jan Feb Mar Apr May Jun Jul Aug Sep Oct Nov Dec250
300
350
400
450
500
550
375.25372.37358.02352.50352.62355.14353.63357.28
346.89
315.17297.82291.39
315.99330.66
368.79
399.43
416.71
420.95
495.22
524.93506.07
469.71445.06
442.02414.30425.63434.20
435.30430.20413.20
384.60
362.40 359.80
344.01
427.96406.63
2011
USD/ST
Source : CBOT, March 6, 2013
∆ 2011 Vs 2012 : 24.4%
∆ 2012 Vs 2013 : -5.0%

Corn CBOT
Jan Feb Mar Apr May Jun Jul Aug Sep Oct Nov Dec550
600
650
700
750
800
850
635.43
690.64684.38
752.35722.42
720.55
674.11
713.38
692.98
632.12625.30
604.67630.86
640.39647.97634.81
605.47603.19
761.30
803.61
763.45
749.96740.08
719.94714.65706.94
708.00688.40
671.60
567.20
679.03691.75
657.28
2011
Cent/Bushel
Source : CBOT, March 6, 2013
∆ 2011 Vs 2012 : 1.9%∆ 2012 Vs 2013 : -
5.0%
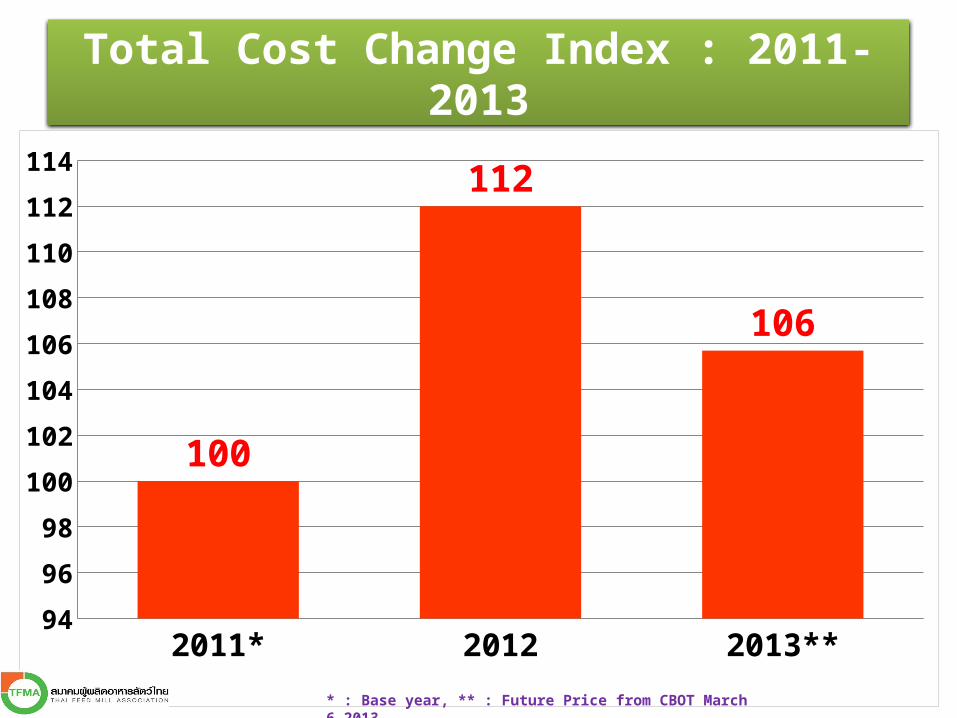
Total Cost Change Index : 2011-2013
2011* 2012 2013**94
96
98
100
102
104
106
108
110
112
114
100
112
106
* : Base year, ** : Future Price from CBOT March 6 2013
Conclusion
The Animal Feed Industry in Thailand is growing along with the normal average level.
Cost of Raw Material in 2013 tends to be slightly lower than previous year.

Thank You