a study of embedment and other metallurgical and … library kafb, nm a study of embedment and other...
TRANSCRIPT
A STUDY OF EMBEDMENT A N D OTHER METALLURGICAL A N D MECHANICAL CHARACTERISTICS, OF CROSS-WIRE RESISTANCE WELDS
by Jumes A. Munford Goddurd Space Flight Center Greenbelt, M d
NATIONAL AERONAUIVCS AND SPACE ADMINISTRATION WASHINGTON, D. C. NOVEMBER 1966
i / i i
4
https://ntrs.nasa.gov/search.jsp?R=19670001998 2018-05-30T07:44:07+00:00Z

TECH LIBRARY KAFB, NM
A STUDY O F EMBEDMENT AND OTHER
METALLURGICAL AND MECHANICAL CHARACTERISTICS O F
CROSS- WIRE RESISTANCE WELDS
By James A. Munford
Goddard Space Flight Center Greenbelt , Md.
N A T I O N A L AERONAUT ICs AND SPACE ADMINISTRATION
For sale by the Clearinghouse for Federal Scientific and Technical Information Springfield, Virginia 22151 - Price $1.00

ABSTRACT
An investigation was performed to evaluate the cross- wire resistance welded joints used in welded electronic as- semblies for aerospace applications. Mechanical strength and reproducibility of strength were determined for several alloy combinations by performing single torsion-shear tests in a pneumatically operated pull testing machine. A metal- lographic investigation was performed in order to determine the type of bonding and the degree of mutual embedment re- sulting from the welding operation.
Material combinations investigated were Nickel 20.0 interconnect welded to itself, Kovar, Alloy 180, and Dumet; and Alloy 180 interconnect welded to itself, Kovar, and Dumet. Strength, embedment, and consistency data indicate that an optimum degree of embedment exists for each com- bination of materials. For the material combinations studied, the optimum embedment was found to be between 10 and 25 percent of the wire diameter.
ii
CONTENTS
Abstract . . . . . . . . . . . . . . . . . . . . . . . . . . . . . . . . . . . . . . . . . . . . . ii
INTRODUCTION . . . . . . . . . . . . . . . . . . . . . . . . . . . . . . . . . . . . . . . 1
EQVIPMENT . . . . . . . . . . . . . . . . . . . . . . . . . . . . . . . . . . . . . . . . . . 3
PROCEDURE . . . . . . . . . . . . . . . . . . . . . . . . . . . . . . . . . . . . . . . . . 3
MATERIALS . . . . . . . . . . . . . . . . . . . . . . . . . . . . . . . . . . . . . . . . . . 4
DATA . . . . . . . . . . . . . . . . . . . . . . . . . . . . . . . . . . . . . . . . . . . . . . 5
RESULTS AND DISCUSSION . . . . . . . . . . . . . . . . . . . . . . . . . . . . . . . 10
Nickel 200 Welded to Nickel 200 . . . . . . . . . . . . . . . . . . . . . . . . . . Nickel 200 Welded to Dumet . . . . . . . . . . . . . . . . . . . . . . . . . . . . . Nickel 200 Welded to Kovar . . . . . . . . . . . . . . . . . . . . . . . . . . . . . Nickel 200 Welded to Alloy 180 . . . . . . . . . . . . . . . . . . . . . . . . . . . Alloy 180 Welded to Alloy 180 . . . . . . . . . . . . . . . . . . . . . . . . . . . 16
Alloy 180 Welded to Dumet
Alloy 180 Welded to Kovar . . . . . . . . . . . . . . . . . . . . . . . . . . . . . . Alloy 180 Welded to Alloy 180 Ribbon
10
12
14
15
. . . . . . . . . . . . . . . . . . . . . . . . . . . . . 18
19
19 . . . . . . . . . . . . . . . . . . . . . . CONCLUSIONS . . . . . . . . . . . . . . . . . . . . . . . . . . . . . . . . . . . . . . . . 21
Bibliography . . . . . . . . . . . . . . . . . . . . . . . . . . . . . . . . . . . . . . . . . . 22
iii
I
A STUDY OF EMBEDMENT AND OTHER METALLURGlCAb AND MECHANICAL CHARACTERISTICS OF
CROSS-WIRE RESISTANCE WELDS
by James A. Munford
Goddard Space Flight Center
INTRODUCTION
The advent of space exploration has placed an ever increasing demand upon the electronics industry to provide smaller, lighter, more reliable, and more complex electronic packages. Welded circuitry provides a balance between the weight and physical size of printed circuit assemblies and the high cost and limited power applications of thin film circuitry. The welded joints also exhibit higher mechanical strengths than soldered joints.
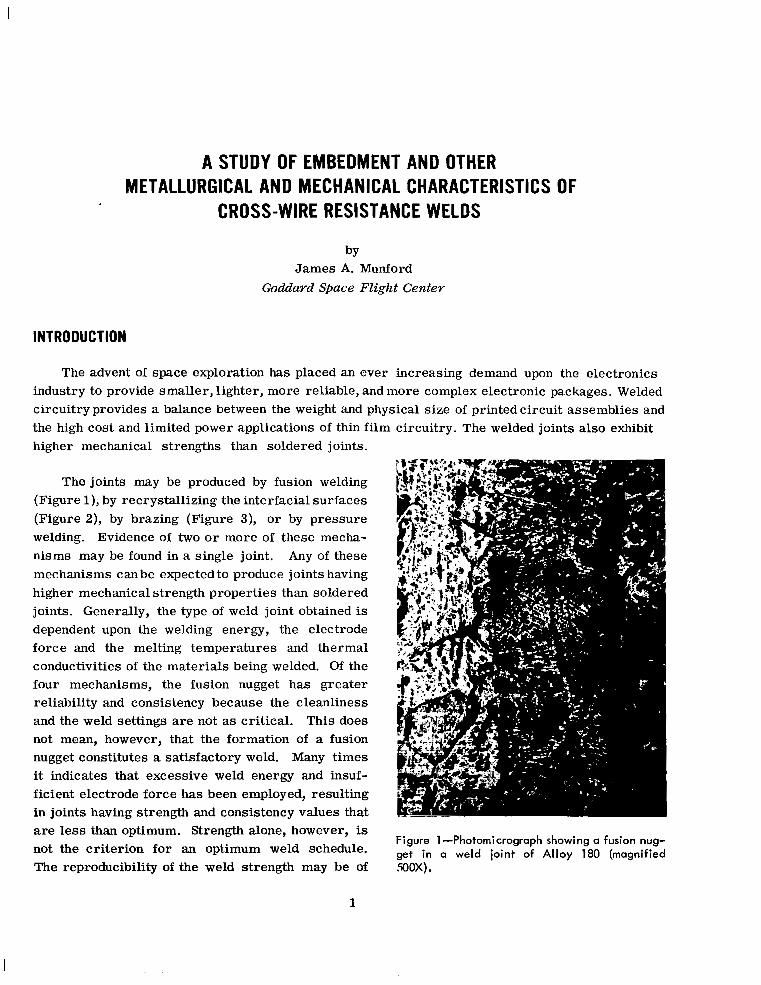
The joints may be produced by fusion welding (Figure l), by recrystallizing the interfacial surfaces (Figure 2), by brazing (Figure 3), or by pressure welding. Evidence of two or more of these mecha- nisms may be found in a single joint, Any of these mechanisms canbe expected to produce joints having higher mechanical strength properties than soldered joints. Generally, the type of weld joint obtained is dependent upon the welding energy, the electrode force and the melting temperatures and thermal conductivities of the materials being welded. Of the four mechanisms, the fusion nugget has greater reliability and consistency because the cleanliness and the weld settings are not as critical. This does not mean, however, that the formation of a fusion nugget constitutes a satisfactory weld. Many times it indicates that excessive weld energy and insuf- ficient electrode force has been employed, resulting in joints having strength and consistency values that are less than optimum. Strength alone, however, is not the criterion for an optimum weld schedule. The reproducibility of the weld strength may be of
Figure 1 -Photomicrograph showing a fusion nug- get in a of Alloy 180 (magnified ,500X).
1

l11lll11l I
Figure 2-Photomicrogroph showing a recrystal- lized interface in a nickel weld joint (magnified 500X).
Figure 3-Photomicrograph of a braze joint pro- duced between the copper sheath of Dumet (right) and nickel (magnified SOOX).
greater importance in establishing a weld schedule than the tensile-shear strength alone. A few pounds of the average pull strength may well be sacrificed to attain the desired reproducibility.
Claddings, coatings, and platings may also influence the type of bond produced. High melting point coatings such as silver, copper, or gold may remain in the joint interface and produce a brazed joint. Low melting point coatings such as tin, lead, or solder do not affect the type of weld, in most cases, because they are quickly melted and forced out of the joints.
Resistance welded joints are normally evaluated on the basis of their mechanical strength, visual appearance, and metallographic appearance. Since mechanical strength and metallographic appearance cannot be determined on an actual production weld joint, statistical quality control has become the standard method of determining production weld integrity. The combination of elec- trodes, electrode force, and energy input used to produce consistently high strength welded joints is usually determined by an empirical method. One such method involves systematically varying the electrode force and energy input to select the settings that produce a combination of the highest strength and the lowest standard deviation. Strength and reproducibility data alone, however, are not sufficient to establish a production weld schedule. Mechanical tests should be supplemented with visual and metallurgical examinations. Although appearance alone has been used by some fabricators as a measure of weld integrity, this method cannot be expected to yield highly reliable welded joints.
2

The criteria used for visual examination generally involves only a search for external defects, misaligned or off-center welds, and excessive or insufficient embedment. The determination of embedment is best accomplished by a metallographic examination, however an estimate can be made visually under a magnification of 10 to 15 diameters. Embedment values may also be de- termined in some instances by measuring the thickness of welded joints with micrometers. When space permits, this method may offer a non-destructive method of monitoring joint quality when the strength-variation-embedment relationships have been established for an alloy and size com- bination. Although one specification (Bureau of Naval Weapons OD 11889B) requires that embed- ment be greater than 5 percent and not more than 75 percent, regardless of the alloy or the size of the lead materials, it is found that for a particular combination of materials, there is an optimum degree of embedment corresponding to the optimum weld schedule; that is, one producing welds having high strength and a minimum standard deviation.
EQUIPMENT
The welder (Figure 4) used to develop the data in this report is composed of a power supply, a junction box, and a weld head.
The power supply is of the capacitive discharge type and is capable of producing up to 40 watt-seconds of energy. The weld pulse is approximately 1 -1/2 milliseconds through a normal impedance weld joint, and can be repeated every two seconds at maxi- mum power. Energy storage is variable from 0.4 to 40 watt-seconds.
A wide range pincer weld head having pri*"- +a " two fixed-angle electrode configurations was
used in conjunction with the power supply. This head provides spring controlled variable electrode forces from 1/4 to 10 pounds and a low inertia of 0.5 ounce. The electrode.tip angle can be set at 60 degrees for normal production or 36 degrees for applications where workspace is limited.
Figure 4-Capacitive discharge welder with pincer head.
PROCEDURE
Over eight thousand weld samples were made with 0.020 inch diameter wire at various elec- trode force and weld energy settings. Sixty welds were made at each two-pound force increment and each two-watt-second energy increment. Fifty welds made at each setting were tensile-shear tested (Figure 5) on a pneumatically operated mechanical tester (Figure 6). From this data, the average strength and standard deviation was computed.
3

1 1 1 I 1111111 I I II I I
Figure 6-Pneumatic pull tester for determining tensile-shear strength.
The remaining samples were mounted in plastic, ground on successively finer grades of silicon carbide paper, then polished metallurgically using a diamond abrasive followed by aluminum oxide. The amount of embedment of one wire into the other was measured microscopically using a filar eyepiece. The type of bonding and the role of platings or coatings were de- termined by microscopic examination on a research metallograph. Average pull strength, standard devia- tion, and welding energy at constant electrode forces were then plotted against embedment, and the optimum degree of embedment was determined for each combina- tion of materials.
One additional combination of materials (0.020 inch Figure 5-Typical cross-wire weld joint showing direction of loading for tensi le-shear tests.
diameter wire of Alloy 180 welded to 0.012-inch by 0.022- inch ribbon of Alloy 180) was welded at various force and energy settings to determine if micrometer meas-
urements of embedment could be effective in providing a non-destructive method of evaluating weld joint quality. The thicknesses of the weld joints were measured with barrel micrometers and the embedments calculated. These samples were then tensile-shear tested to determine the average strength and standard deviation at each machine setting.
MATERIALS
The combinations of materials selected for this investigation represent those normally en- countered in electronic module production. Both Nickel 200 and Alloy 180 are commonly used as interconnect materials, and preferred component leads are usually Nickel 200, Kovar, or Dumet. Alloy 180 is also available as a lead material on components from some suppliers.
Nickel 200 is a commercially pure nickel widely used as an interconnecting medium in the fabrication of welded electronic modules. Its chemical composition is controlled to a minimum of 99.00 percent nickel (+ cobalt). This material has excellent weldability over a wide range of welding variables in addition to high electrical conductivity and inherent corrosion resistance.
4

Alloy 180 is a copper-nickel alloy consisting of 78 percent copper and 22 percent nickel. This material is frequently used as the interconnecting medium on electronic modules where a non- magnetic requirement exists. It also exhibits good weldability, high electrical conductivity, and good corrosion resistance.
Kovar is an iron base alloy consisting of 54 percent iron, 29 percent nickel, and 17 percent cobalt. This alloy is widely used for leads on transistors and other components employing hard glass seals because of its compatible coefficient of expansion. Since Kovar is not inherently cor- rosion resistant, it is usually supplied with gold plating or with a solder or tin coating.
Diodes, capacitors, and resistors having soft glass seals a r e often supplied with Dumet leads, an alloy of 42 percent nickel and 58 percent iron with a copper sheath. The coefficient of expan- sion of this alloy is controlled to match many soft glasses used in hermetically sealed components.
Numerous other metals and alloys a r e occasionally found as lead materials on components intended for use in welded electronic modules. However, in an effort to limit the number of lead materials and weld schedules, the Department of Defense issued Military Standard 1276, "Weldable Leads for Electronic Component Parts," which specifies the use of Dumet, Kovar, nickel, and copper for component leads unless other materials a re specified for special applications. This standard also limits the chemical composition of the base materials, the thicknesses and chemical compositions of platings and coatings, and establishes the sizes of wire and flat ribbon to be used as lead materials on electronic components intended for welding.
DATA
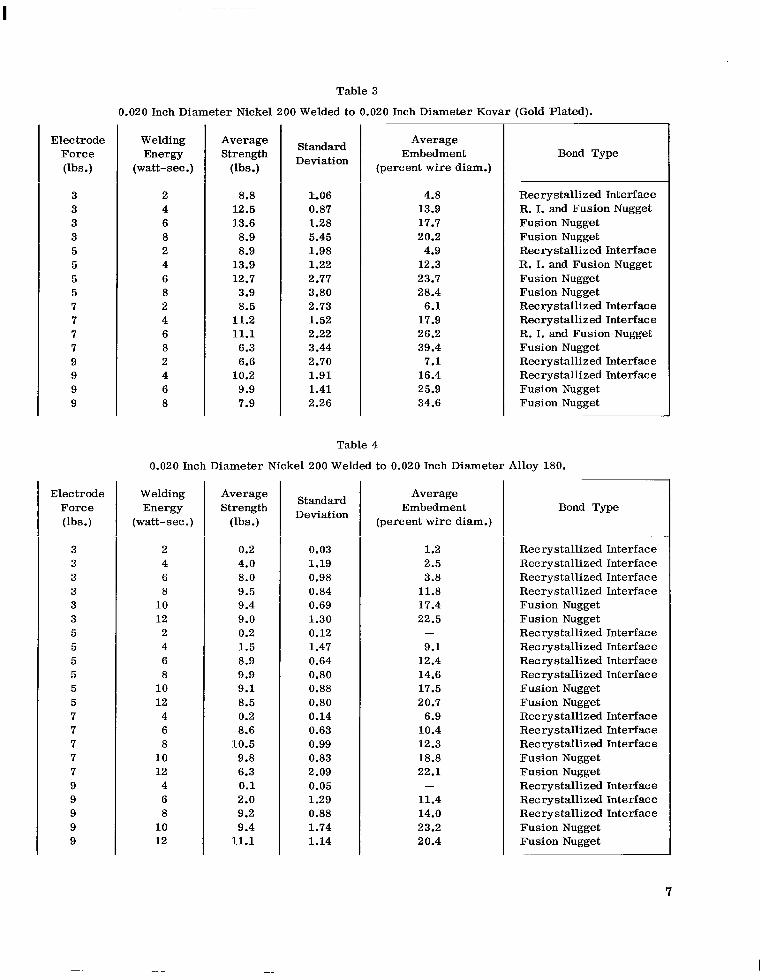
The data contained in Tables 1 through 8 represent findings from more than eight thousand cross-wire weld samples. Strength values given for each welder setting represent an average of 50 tensile-shear tests and embedment values represent the average of 10 microscopic measurements.
Table 1
0.020 Inch Diameter Nickel 200 Welded to 0.020 Inch Diameter Nickel 200.
Electrode Force (Ibs.)
3 3 3 3 3 3 3 5 5
Welding Energy
(watt-sec .)
2 4 6 8 10 12 14 2 4
Average Strength
(lbs.)
6.1 12.1 13.8 15.4 17.0 16.7 17.6 0.7 10.4
Standard Deviation
1.14 0.40 0.56 0.76 1.10 0.63 0.82 0.54 0.92
Average Embedment
(percent wire diam.)
5.5 11.2 14.5 14.7 20.7 17.7 18.5 3.4 6.3
Recrystallized Interface Recrystallized Interface R. I. and Fusion Nugget R. I. and Fusion Nugget R. I. and Fusion Nugget Fusion Nugget Recrystallized Interface Recrystallized Interface Recrystallized Interface
5

I I l11ll111llll I I1
Table 1 (continued)
Electrode Force (lbs.)
5 5 5 5 5 7 7 7 7 7 7 7 9 9 9 9 9 9 9
Electrode Force (lbs.)
3 3 3 3 3 5 5 5 5 5 5 7 7 7 7 7 7 9 9 9 9 9 9
Welding Energy
(watt-sec .)
6 8
10 12 14 4 6 8
10 12 14 16 4 6 8
10 12 14 16
Average Strength
(lbs.)
13.6 14.5 15.5 16.7 17.9
8.5 14.3 15.9 16.9 18.3 18.5 19.8
1.0 13.5 16.0 17.3 18.6 20.0 19.7
~
Standard Deviation
0.59 0.66 0.69 0.80 1.04 0.98 0.56 0.88 0.71 0.92 1.07 0.86 0.76 1.34 1.56 1.34 0.73 0.92 1.49
Average Embedment
(percent wire diam.)
8.2 9.8
15.5 15.4 16.2 3.4 5.5 9.4
12.0 15.0 17.0 18.0 4.3 6.5 8.5
10.0 19.0 15.2 16.4
Bond Type
Recrystallized Interface Recrystallized Interface Recrystallized Interface Recrystallized Interface Recrystallized Interface Recrystallized Interface Recrystallized Interface Recrystallized Interface Recrystallized Interface Recrystallized Interface Recrystallized Interface Recrystallized Interface Recrystallized Interface Recrystallized Interface Recrystallized Interface Recrystallized Interface Recrystallized Interface Recrystallized Interface Recrystallized Interface
Table 2
0.020 Inch Diameter Nickel 200 Welded to 0.020 Inch Diameter Dumet.
Welding Energy
(watt-sec.)
2 4 6 8
10 2 4 6 8
10 12 2 4 6 8 10 12 2 4 6 8
10 12
Average Strength
(lbs.)
0.4 10.3 13.0 13.4 12.4 0.3
11.8 14.6 13.7 12.2 11.5
0.2 12.5 15.9 16.7 13.8 12.0 0.2
10.0 13.8 14.5 12.9 12.2
Standard Deviation
0.18 0.90 0.76 1.14 3.29 0.21 1.37 1.04 1.48 1.37 0.58 0.10 1.24 1.07 1.85 2.57 0.52 0.03 1.50 0.86 1.24 1.69 1.92
Average Embedment
(percent wire diam.)
4.4 12.5 15.3 21.2 27.0
7.6 13.8 16.5 21.2 27.6 32.0
3.9 10.0 17.2 18.7 28.9 31.7
0.5 9.8
18.0 21.5 29.9 33.0
Bond Type
Copper Braze Recrystallized Interface Recrystallized Interface Recrystallized Interface R. I. and Fusion Nugget Copper Braze Recrystallized Interface Recrystallized Interface Recrystallized Interface Recrystallized Interface R. I. and Fusion Nugget Copper Braze Recrystallized Interface Recrystallized Interface Recrystallized Interface Recrystallized Interface Recrystallized Interface Copper Braze Recrystallized Interface Recrystallized Interface Recrystallized Interface Recrystallized Interface Recrystallized Interface
6
Electrode Force (lbs.)
3 3 3 3 5 5 5 5 7 7 7 7 9 9 9 9
Electrode Force (lbs.)
3 3 3 3 3 3 5 5 5 5 5 5 7 7 7 7 7 9 9 9 9 9
Table 3
0.020 Inch Diameter Nickel 200 Welded to 0.020 Inch Diameter Kovar (Gold Plated).
Welding Energy
(watt-see.)
2 4 6 8 2 4 6 8 2 4 6 8 2 4 6 8
Average Strength
(lbs.)
8.8 12.5 13.6
8.9 8.9
13.9 12.7 3.9 8.5
11.2 11.1 6.3 6.6
10.2 9.9 7.9
Standard Deviation
Average Embedment
(percent wire diam.)
LO6 0.87 1.28 5.45 1.98 1.22 2.77 3.80 2.73 1.52 2.22 3.44 2.70 1.91 1.41 2.26
Table 4
4.8 13.9 17.7 20.2 4.9
12.3 23.7 28.4
6.1 17.9 26.2 39.4
7.1 16.4 25.9 34.6
Bond Type
Recrystallized Interface R. I. and Fusion Nugget Fusion Nugget Fusion Nugget Recrystallized Interface R. I. and Fusion Nugget Fusion Nugget Fusion Nugget Recrystallized Interface Recrystallized Interface R. I. and Fusion Nugget Fusion Nugget Recrystallized Interface Recrystallized: Interface Fusion Nugget Fusion Nugget
0.020 Inch Diameter Nickel 200 Welded to 0.020 Inch Diameter Alloy 180.
Welding Energy
(watt-sec.)
2 4 6 8
10 12 2 4 6 8
10 12 4 6 8
10 12 4 6 8
10 12
Average Strength
(lbs.)
0.2 4.0 8.0 9.5 9.4 9.0 0.2 1.5 8.9 9.9 9.1 8.5 0.2 8.6
10.5 9.8 6.3 0.1 2.0 9.2 9.4
11.1
Standard Deviation
0.03 1.19 0.98 0.84 0.69 1.30 0.12 1.47 0.64 0.80 0.88 0.80 0.14 0.63 0.99 0.83 2.09 0.05 1.29 0.88 1.74 1.14
Average Embedment
(percent wire diam.)
1.2 2.5 3.8
11.8 17.4 22.5
9.1 12.4 14.6 17.5 20.7
6.9 10.4 12.3 18.8 22.1
11.4 14.0 23.2 20.4
-
-
Bond Type
Recrystallized Interface Recrystallized Interface Recrystallized Interface Recrystallized Interface Fusion Nugget Fusion Nugget Recrystallized Interface Recrystallized Interface Recrystallized Interface Recrystallized Interface Fusion Nugget Fusion Nugget Recrystallized Interface Recrystallized Interface Recrystallized Interface Fusion Nugget Fusion Nugget Recrystallized Interface Recrystallized Interface Recrystallized Interface Fusion Nugget Fusion Nugget
Electrode Force (lbs.)
3 3 3 3 3 5 5 5 5 5 7 7 7 7 7 7 9 9 9 9 9
Electrode Force (Ibs.)
3 3 3 3 5 5 5 5 7 7 7 7 7 9 9 9 9 9
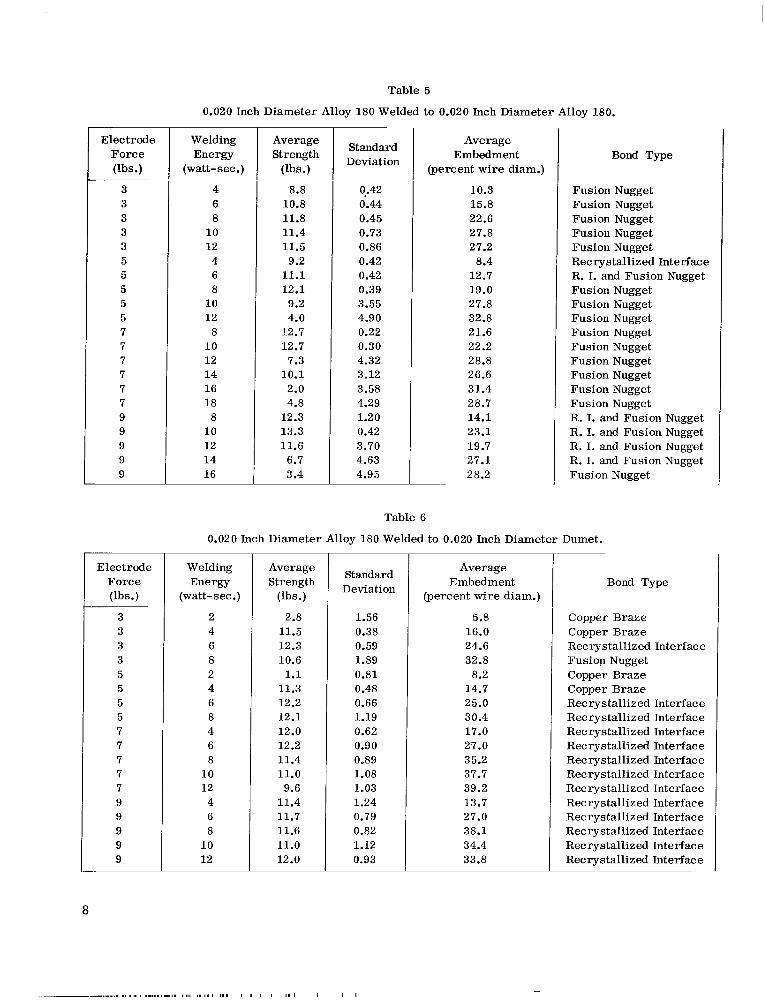
Table 5
0.020 Inch Diameter Alloy 180 Welded to 0.020 Inch Diameter Alloy 180.
Welding Energy
(watt-sec .)
4 6 8
10 12 4 6 8
10 12 8
10 12 14 16 18
8 10 12 14 16
Average Strength
(lbs.)
8.8 10.8 11.8 11.4 11.5 9.2
11.1 12.1 9.2 4.0
12.7 12.7 7.3
10.1 2.0 4.8
12.3 13.3 11.6 6.7 3.4
Standard Deviation
q.42 0.44 0.45 0.73 0.86 0.42 0.42 0.39 3.55 4.90 0.22 0.30 4.32 3.12 3.58 4.29 1.20 0.42 3.70 4.63 4.95
Average Embedment
(percent wire diam.)
10.3 15.8 22.6 27.8 27.2
8.4 12.7 19.0 27.8 32.8 21.6 22.2 28.8 26.6 31.4 28.7 14.1 23.1 19.7 27.1 28.2
Bond Type
Fusion Nugget Fusion Nugget Fusion Nugget Fusion Nugget Fusion Nugget Recrystallized Interface R. I. and Fusion Nugget Fusion Nugget Fusion Nugget Fusion Nugget Fusion Nugget Fusion Nugget Fusion Nugget Fusion Nugget Fusion Nugget Fusion Nugget R. I. and Fusion Nugget R. I. and Fusion Nugget R. I. and Fusion Nugget R. I. and Fusion Nugget Fusion Nugget
Table 6
0.020 Inch Diameter Alloy 180 Welded to 0.020 Inch Diameter Dumet.
Welding Energy
(watt-sec.)
2 4 6 8 2 4 6 8 4 6 8
10 12 4 6 8
10 12
Average Strength
(lbs.)
2.8 11.5 12.3 10.6 1.1
11.3 12.2 12.1 12.0 12.2 11.4 11.0 9.6
11.4 11.7 11.6 11.0 12.0
Standard Deviation
1.56 0.38 0.59 1.89 0.81 0.48 0.66 1.19 0.62 0.90 0.89 1.08 1.03 1.24 0.79 0.82 1.12 0.93
Average Embedment
(percent wire diam.)
5.8 16.0 24.6 32.8
8.2 14.7 25.0 30.4 17.0 27.0 35.2 37.7 39.2 13.7 27.0 38.1 34.4 33.8
Bond Type
Copper Braze Copper Braze Recrystallized Interface Fusion Nugget Copper Braze Copper Braze Recrystallized Interface Recrystallized Interface Recrystallized Interface Recrystallized Interface Recrystallized Interface Recrystallized Interface Recrystallized Interface Recrystallized Interface Recrystallized Interface Recrystallized Interface Recrystallized Interface Recrystallized Interface
8
I
Electrode Force (Ibs.)
Electrode Force (lbs.)
3 3 3 3 3 3 5 5 5 5 5 5 5 5 7 7 7 7 7 7 7 7 9 9 9 9 9 9
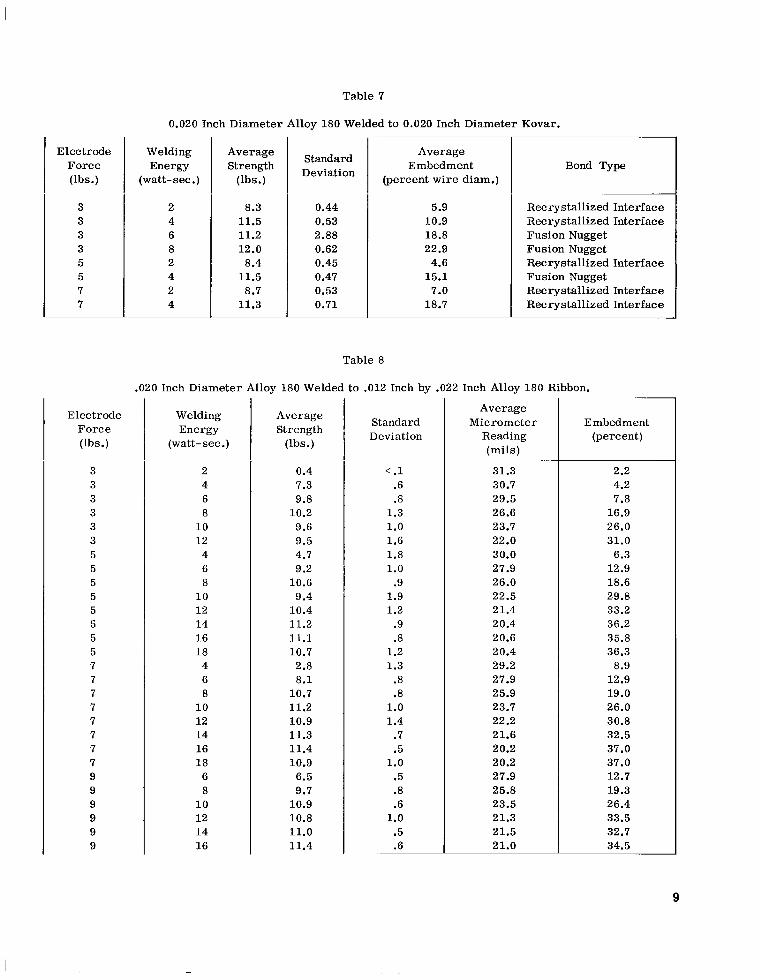
Table 7
0.020 Inch Diameter Alloy 180 Welded to 0.020 Inch Diameter Kovar.
Welding Energy
(watt-sec.)
Average Strength
(lbs.)
8.3 11.5 11.2 12.0 8.4
11.5 8.7
11.3
Average Embedment
(percent wire diam.)
Standard Deviation
0.44 0.53 2.88 0.62 0.45 0.47 0.53 0.71
5.9 10.9 18.8 22.9
4.6 15.1
7.0 18.7
Bond Type
Recrystallized Interface Recrystallized Interface Fusion Nugget Fusion Nugget Recrystallized Interface Fusion Nugget Recrystallized Interface Recrystallized Interface
Table 8
.020 Inch Diameter Alloy 180 Welded to .012 Inch by .022 Inch Alloy 180 Ribbon.
Welding Energy
(watt-sec.)
2 4 6 8
10 12 4 6 8
10 12 14 16 18 4 6 8
10 12 14 16 18 6 8
10 12 14 16
Average Strength
(lbs.)
0.4 7.3 9.8
10.2 9.6 9.5 4.7 9.2
10.6 9.4
10.4 11.2 11.1 10.7 2.8 8.1
10.7 11.2 10.9 11.3 11.4 10.9
6.5 9.7
10.9 10.8 11.0 11.4
Standard Deviation
< .1 .6 .8
1.3 1.0 1.6 1.8 1.0
.9 1.9 1.2
.9
.8 1.2 1.3
.8
.8 1.0 1.4
.7
.5 1.0
.5
.8
.6 1.0
.5
.6
Average Micrometer
Reading (mils)
31.3 30.7 29.5 26.6 23.7 22.0 30.0 27.9 26.0 22.5 21.4 20.4 20.6 20.4 29.2 27.9 25.9 23.7 22.2 21.6 20.2 20.2 27.9 25.8 23.5 21.3 21.5 21.0
Embedment (percent)
2.2 4.2 7.8
16.9 26.0 31.0
6.3 12.9 18.6 29.8 33.2 36.2 35.8 36.3
8.9 12.9 19.0 26.0 30.8 32.5 37.0 37.0 12.7 19.3 26.4 33.5 32.7 34.5
9
RESULTS AND DISCUSSION
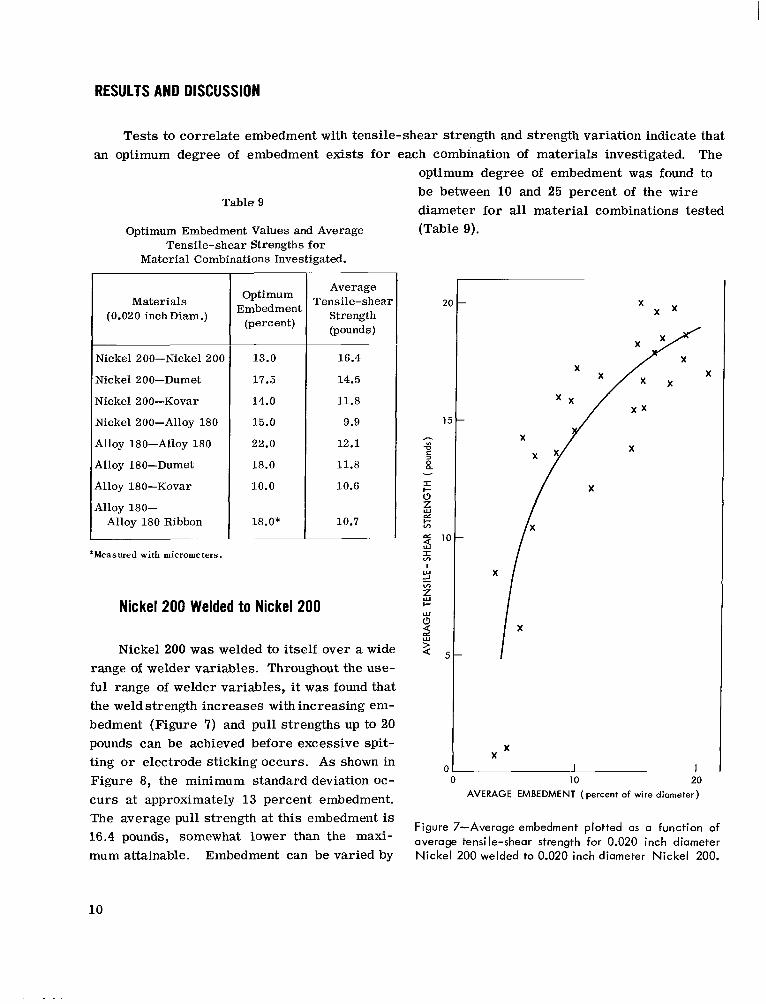
Tests to correlate embedment with tensile-shear strength and strength variation indicate that The an optimum degree of embedment exists for each combination of materials investigated.
Table 9
Optimum Embedment Values and Average Tensile-shear Strengths for
Material Combinations Investigated.
optimum degree of embedment was found to be between 10 and 25 percent of the wire diameter for all material combinations tested (Table 9).
Materials (0.020 inchDiam.)
Nickel 200-Nickel 200
Nickel 200-Dumet
Xickel 200-Kovar
Nickel 200-Alloy 180
4110~ 180-Alloy 180
4110~ 180-Dumet
411oy 180-Kovar
4110~ 180- Alloy 180 Ribbon
Optimum Embedment
(percent)
13.0
17.5
14.0
15.0
22.0
18.0
10.0
18.0* ~
Average Tensile-shea1
Strength (pounds)
16.4
14.5
11.8
9.9
12.1
11.8
10.6
10.7
* M e a s u r e d with m i c r o m e t e r s .
Nickel 200 Welded to Nickel 200
Nickel 200 was welded to itself over a wide range of welder variables. Throughout the use- ful range of welder variables, it was found that the weld strength increases with increasing em- bedment (Figure 7) and pull strengths up to 20 pounds can be achieved before excessive spit- ting or electrode sticking occurs. As shown in Figure 8, the minimum standard deviation OC-
curs at approximately 13 percent embedment. The average pull strength at this embedment is 16.4 pounds, somewhat lower than the maxi- mum attainable. Embedment can be varied by
X x x
X X
X X
X X
I I 0 10 20
AVERAGE EMBEDMENT (percent of wire diameter)
Figure 7-Average embedment plotted as a function of average tensi le-shear strength for 0.020 inch diameter Nickel 200 welded to 0.020 inch diameter Nickel 200.
10
. .

0 0.5
0-
I 10 20
AVERAGE EMBEDMENT (percent of wire diameter)
Figure 8-Average embedment plotted as a function of standard deviation for 0.020 inch diameter Nickel 200 welded to 0.020 inch diameter Nickel 200.
changing either the electrode force or the welding energy. An increase in weld energy produces greater embedment; at low electrode force settings, an increase in the electrode force produces decreased embedment. At any useful value of weld energy, as shown in Fig- ure 9, a 3-pound electrode force will produce a greater embedment than a 9-pound force. This is attributed to the difference in the re- sistance of the joints, and hence, the heat de- veloped in the joints. A high electrode force deforms the wire surfaces at their points of contact, providing more surface a rea to trans- mit the electrical energy. The lower resistance
i# 31 ELECTRODE I FORCE
I 10 20
AVERAGE EMBEDMENT (percent of wire diameter)
Figure 9-Average embedment plotted as a function of welding energy for 0.020 inch diameter Nickel 200 welded to 0.020 inch diameter Nickel 200.
in the joint produces less heat, according to the relationship H a I* Rt, where H is the energy (or heat) in watt-seconds, I is the current in amperes, R is the resistance in ohms, and t is the time in seconds. A proportionality constant K can be inserted to convert this relationship to the equation H = I* RtK. The constant K is dimensionless, usually less than unity, and is de- pendent upon the electrical and thermal properties of the materials to be welded. The resistance R is determined principally at the junction of the two materials to be welded. A high electrode force will reduce the interfacial resistance R and consequently will lower the energy H dissipated in the joint. Hence, at the same welding energy level, higher electrode forces cause lower inter- facial resistance and less heat to be produced in the joint, resulting in a decreased embedment. This relationship is mentioned because under particular conditions, as shown later, a seemingly opposite effect can be encountered. A photomicrograph of a typical joint is shown in Figure 10.
11
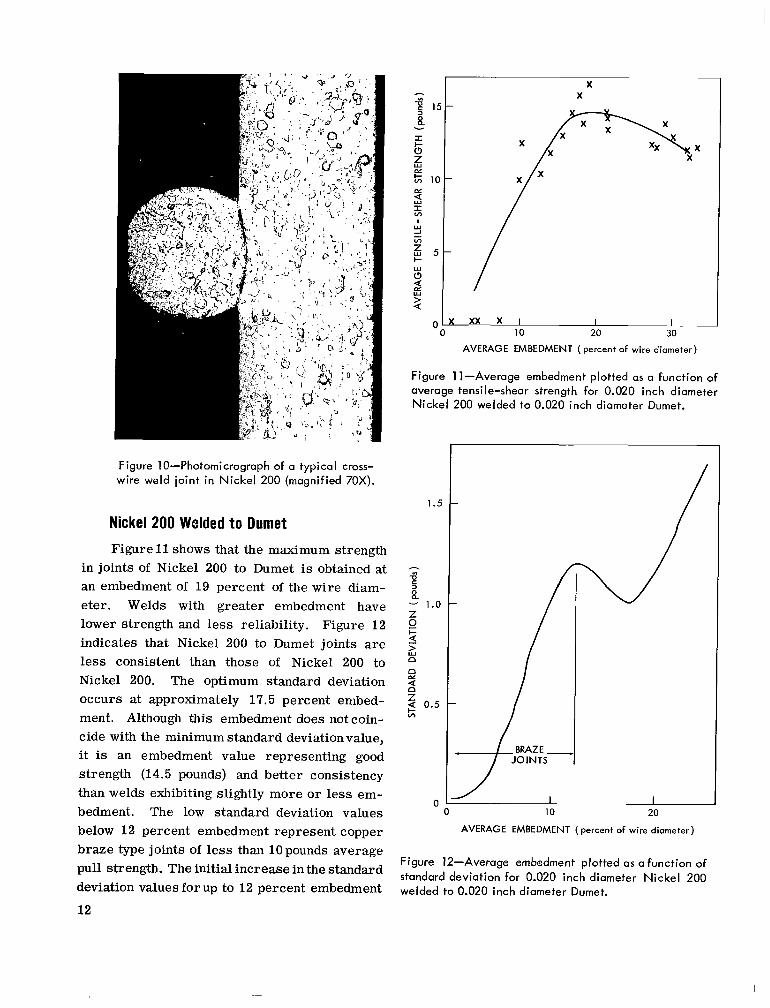
Figure IO-Photomicrograph of a typical cross- wire weld joint in Nickel 200 (magnified 70X).
Nickel 200 Welded t o Dumet Figure 11 shows that the maximum strength
in joints of Nickel 200 to Dumet is obtained at an embedment of 19 percent of the wire diam- eter. Welds with greater embedment have lower strength and less reliability. Figure 12 indicates that Nickel 200 to Dumet joints a r e less consistent than those of Nickel 200 to Nickel 200. The optimum standard deviation occurs at approximately 17.5 percent embed- ment. Although this embedment does not coin- cide with the minimum standard deviation value, it is an embedment value representing good strength (14.5 pounds) and better consistency than welds exhibiting slightly more or less em- bedment. The low standard deviation values below 12 percent embedment represent copper braze type joints of less than 10pounds average pull strength. The initial increase in the standard deviation values for up to 12 percent embedment
12
X
Figure 11-Average embedment plotted as a function of average tensile-shear strength for 0.020 inch diameter Nickel 200 welded to 0.020 inch diameter Dumet.
o l x xx x I I 1 0 10 20 30 ~
AVERAGE EMBEDMENT (percent of wire diameter)
1.5
h
0"
- 1.0 Z
2 9 9 2 n n
2 0.5
I-
2 v)
0 I I 10 20
AVERAGE EMBEDMENT (percent of wire diameter)
Figure 12-Average embedment plotted as a function of standard deviation for 0.020 inch diameter Nickel 200 welded to 0.020 inch diameter Dumet.
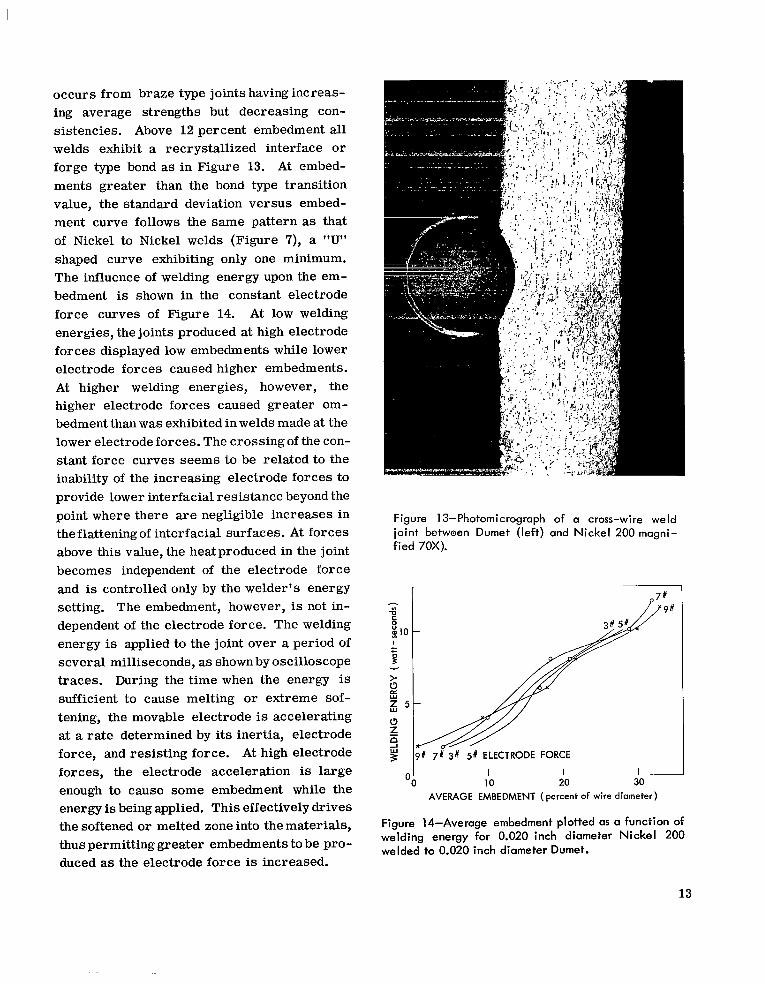
occurs from braze type joints having increas- ing average strengths but decreasing con- sistencies. Above 12 percent embedment all welds exhibit a recrystallized interface or forge type bond as in Figure 13. At embed- ments greater than the bond type transition value, the standard deviation versus embed- ment curve follows the same pattern as that of Nickel to Nickel welds (Figure 7), a "U" shaped curve exhibiting only one minimum. The influence of welding energy upon the em- bedment is shown in the constant electrode force curves of Figure 14. At low welding energies, the joints produced at high electrode forces displayed low embedments while lower electrode forces caused higher embedments. At higher welding energies, however, the higher electrode forces caused greater em- bedment than was exhibited in welds made at the lower electrodeforces. The crossing of the con- stant force curves seems to be related to the inability of the increasing electrode forces to provide lower interfacial resistance beyond the point where there are negligible increases in theflatteningof interfacial surfaces. At forces above this value, the heatproduced in the joint becomes independent of the electrode force and is controlled only by the welder's energy setting. The embedment, however, is not in- dependent of the electrode force. The welding energy is applied to the joint over a period of several milliseconds, as shown by oscilloscope traces. During the time when the energy is sufficient to cause melting or extreme sof- tening, the movable electrode is accelerating at a rate determined by its inertia, electrode force, and resisting force. At high electrode forces, the electrode acceleration is large enough to cause some embedment while the energy is being applied. This effectively drives the softened or melted zone into the materials, thus permitting greater embedments to be pro- duced as the electrode force is increased.
. . . ' .
Figure 13-Photomicrograph of a cross-wire weld joint between Dumet (left) and Nickel 200 magni- fied 70X).
I I I 10 20 30
I OO
AVERAGE EMBEDMENT (percent of wire diameter)
Figure 14-Average embedment plotted as a function of welding energy for 0.020 inch diameter Nickel 200 welded to 0.020 inch diameter Dumet.
13
Nickel 200 Welded to Kovar
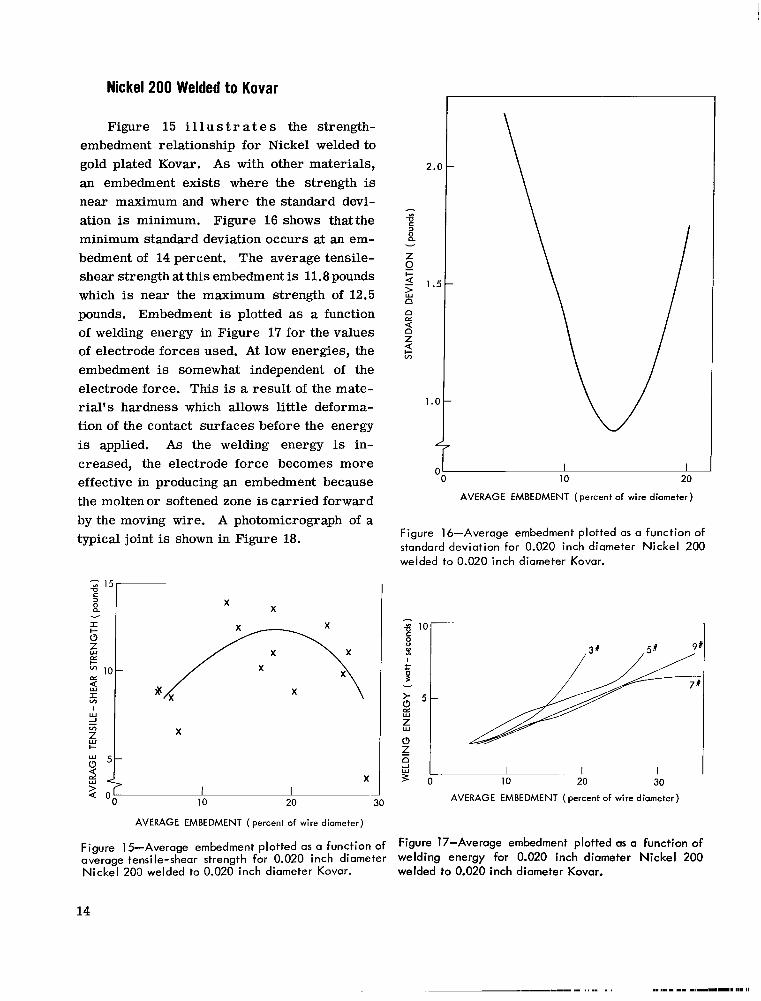
Figure 15 i l l u s t r a t e s the strength- embedment relationship for Nickel welded to gold plated Kovar. As with other materials, an embedment exists where the strength is near maximum and where the standard devi- ation is minimum. Figure 16 shows thatthe minimum standard deviation occurs at an em- bedment of 14 percent. The average tensile- shear strengthat this embedment is 11.8pounds which is near the maximum strength of 12.5 pounds. Embedment is plotted as a function of welding energy in Figure 17 for the values of electrode forces used. At low energies, the embedment is somewhat independent of the electrode force. This is a result of the mate- rial's hardness which allows little deforma- tion of the contact surfaces before the energy is applied. As the welding energy is in- creased, the electrode force becomes more effective in producing an embedment because the molten or softened zone is carried forward by the moving wire. A photomicrograph of a typical joint is shown in Figure 18.
X X
X
X
10 20 30
AVERAGE EMBEDMENT (percent of wire diameter)
Figure 15-Average embedment plotted as a function of average tensile-shear strength for 0.020 inch diameter Nickel 200 welded to 0.020 inch diameter Kovar.
14
10 20
AVERAGE EMBEDMENT (percent of wire diameter)
Figure 16-Average embedment plotted as a function of standard deviation for 0.020 inch diameter Nickel 200 welded to 0.020 inch diameter Kovar.
AVERAGE EMBEDMENT (percent of wire diameter)
Figure 17-Average embedment plotted as a function of welding energy for 0.020 inch diameter Nickel 200 welded to 0.020 inch diameter Kovar.

Figure 18-Photomicrograph of a cross-wire weld joint between nickel (right) and gold plated Kovar (magnified 70X).
10
Nickel 200 Welded to Alloy 180
-
5 -
Nickel welded to Alloy 180 exhibits the same characteristic strength-embedment curve as described previously. The maximum average strength of 10.0 pounds occurs at an embedment of 16 percent (Figure 19) and the standard de- viation reaches a minimum at 15 percent em- bedment (Figure 20). The optimum weld sched- ule would then produce joints having embedments near 15 percent. Figure 21 illustrates the small dependence of embedment upon elec- trode force. In the energy range required to produce approximately 15 percent embedment, the joint strength (and embedment) is dependent only upon the welding energy.
X X
X
X I , 10 20
01 x 0
AVERAGE EMBEDMENT (percent of wire diameter)
Figure 19-Average embedment plotted as a func- tion of average tensile-shear strength for 0.020 inch diameter Nickel 200 welded to 0.020 inch daimeter Alloy 180.
f I'
OO 10 I
20
AVERAGE EMBEDMENT (percent of wire diameter)
Figure 20-Average embedment plotted as a func- tion of standard deviation for 0.020 inch dia- meter Nickel 200 welded to 0.020 inch diameter Alloy 180.
I
15
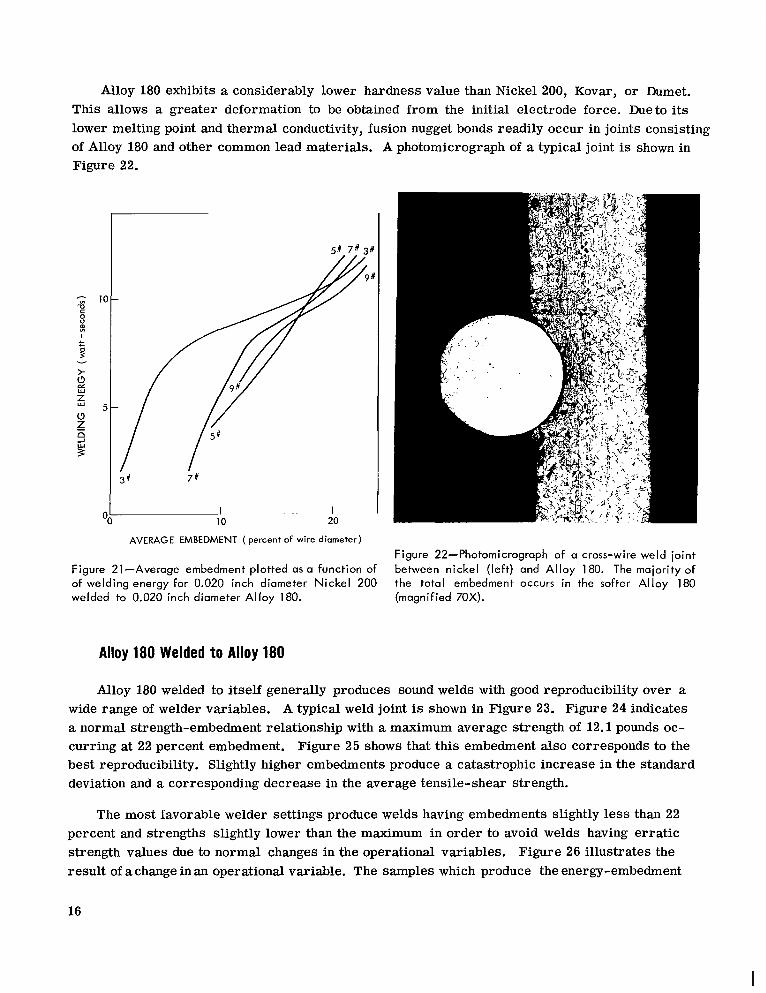
Alloy 180 exhibits a considerably lower hardness value than Nickel 200, Kovar, or Dumet. This allows a greater deformation to be obtained from the initial electrode force. Dueto its lower melting point and thermal conductivity, fusion nugget bonds readily occur in joints consisting of Alloy 180 and other common lead materials. A photomicrograph of a typical joint is shown in Figure 22.
I - .. I 10 20
AVERAGE EMBEDMENT (percent of wire diameter)
Figure 21-Average embedment plotted as a function of of welding energy for 0.020 inch diameter Nickel 200 welded to 0.020 inch diameter Alloy 180.
Figure 22-Photomicrograph of a cross-wire weld joint between nickel (left) and Alloy 180. The majority of the total embedment occurs in the softer Alloy 180 (magnified 70X).
Alloy 180 Welded to Alloy 180
Alloy 180 welded to itself generally produces sound welds with good reproducibility over a wide range of welder variables. A typical weld joint is shown in Figure 23. Figure 24 indicates a normal strength-embedment relationship with a maximum average strength of 12.1 pounds oc- curring at 22 percent embedment. Figure 25 shows that this embedment also corresponds to the best reproducibility. Slightly higher embedments produce a catastrophic increase in the standard deviation and a corresponding decrease in the average tensile-shear strength.
The most favorable welder settings produce welds having embedments slightly less than 22 percent and strengths slightly lower than the maximum in order to avoid welds having erratic strength values due to normal changes in the operational variables. Figure 26 illustrates the result of achange in an operational variable. The samples which produce the energy-embedment
16
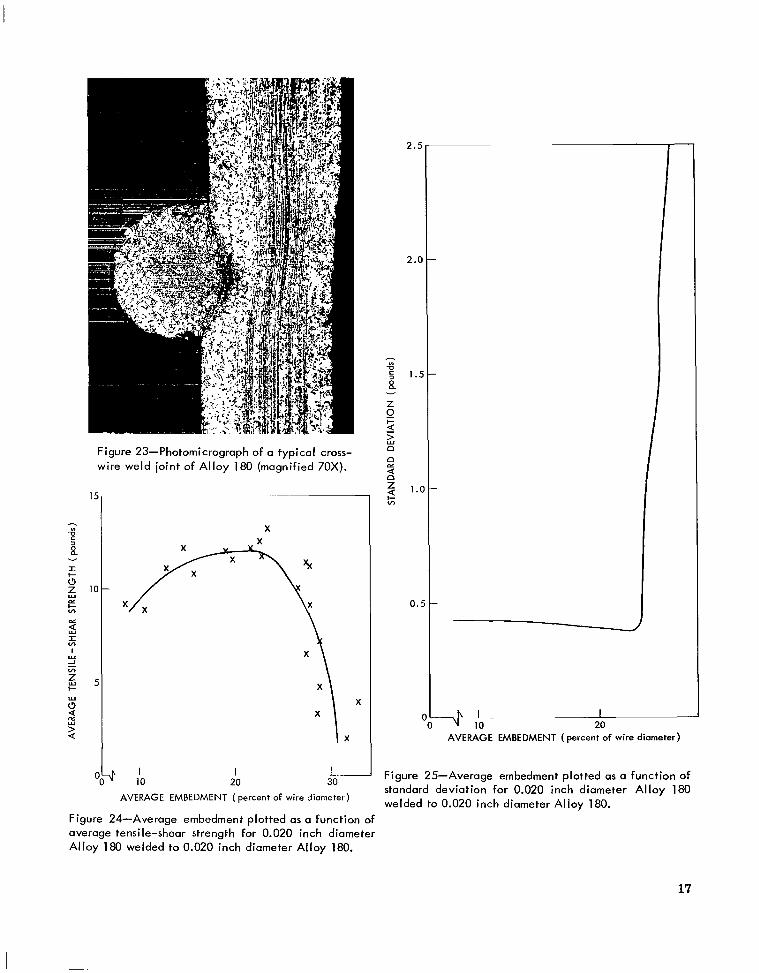
Figure 23-Photomicrograph of a typical cross- wire weld joint of Alloy 180 (magnified 70X).
I I 1.-
X
I 20
AVERAGE EMBEDMENT (percent of wire diameter)
Figure 25-Average embedment plotted as a function of standard deviation for 0.020 inch diameter Alloy 180 welded to 0.020 inch diameter AI loy 180.
Figure 24-Average embedment plotted as a function of average tensile-shear strength for 0.020 inch diameter Alloy 180 welded to 0.020 inch diameter Alloy 180.
17
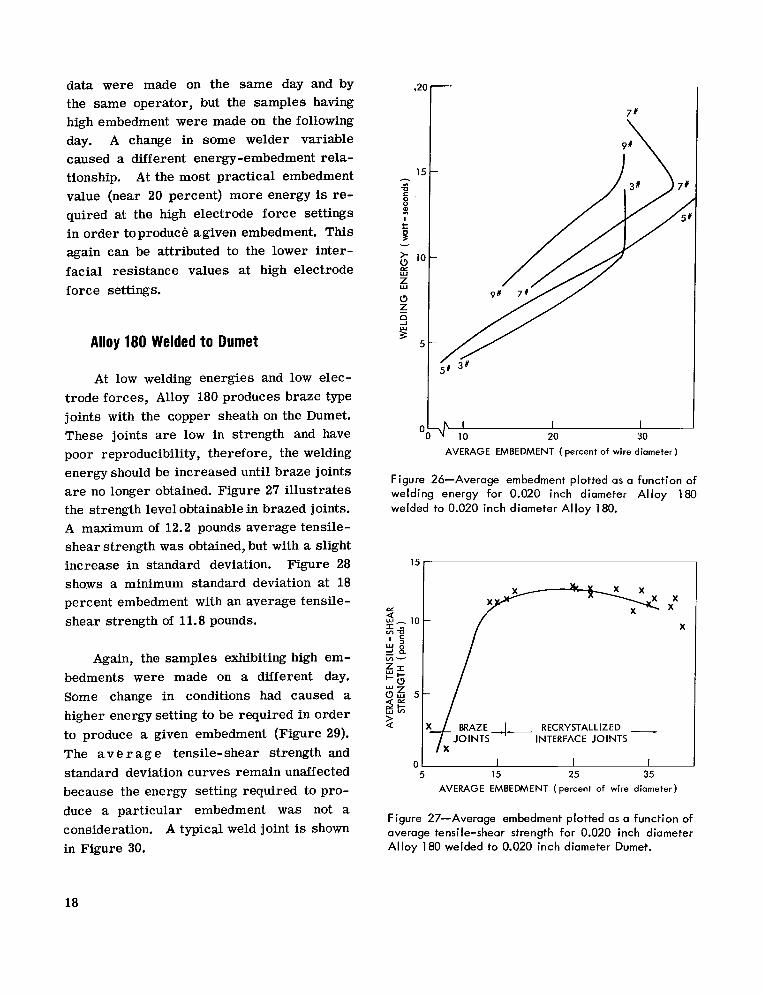
data were made on the same day and by the same operator, but the samples having high embedment were made on the following day. A change in some welder variable caused a different energy-embedment rela- tionship. At the most practical embedment value (near 20 percent) more energy is re- quired at the high electrode force settings in order to produce agiven embedment. This again can be attributed to the lower inter- facial resistance values at high electrode force settings.
Alloy 180 Welded to Dumet
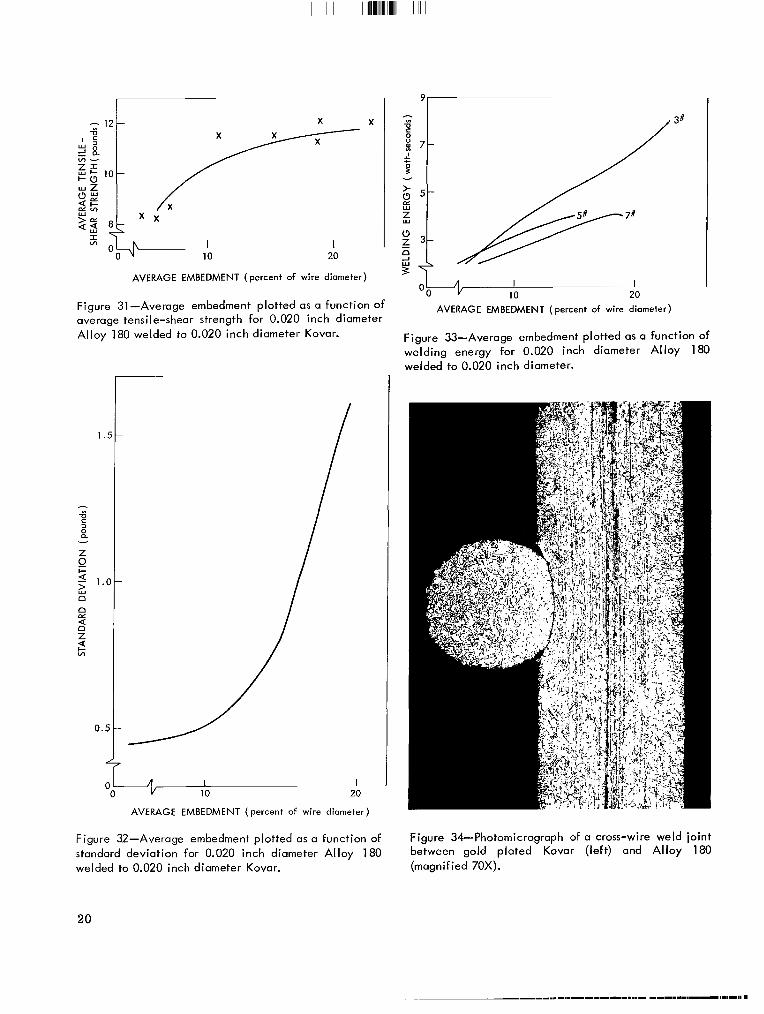
At low welding energies and low elec- trode forces, Alloy 180 produces braze type joints with the copper sheath on the Dumet. These joints are low in strength and have poor reproducibility, therefore, the welding energy should be increased until braze joints are no longer obtained. Figure 27 illustrates the strength level obtainable in brazed joints. A maximum of 12.2 pounds average tensile- shear strength was obtained, but with a slight increase in standard deviation. Figure 28 sho.ws a minimum standard deviation at 18 percent embedment with an average tensile- shear strength of 11.8 pounds.
Again, the samples exhibiting high em- bedments were made on a different day. Some change in conditions had caused a higher energy setting to be required in order to produce a given embedment (Figure 29). The a v e r a g e tensile- shear strength and standard deviation curves remain unaffected because the energy setting required to pro- duce a particular embedment was not a consideration. A typical weld joint is shown in Figure 30.
9# \
I I I 10 20 30
AVERAGE EMBEDMENT (percent of wire diameter)
Figure 26-Average embedment plotted as a function of welding energy for 0.020 inch diameter Alloy 180 welded to 0.020 inch diameter Alloy 180.
BRAZEJ- RECRYSTALLIZED __ INTERFACE JOINTS
I I I 15 25 35
AVERAGE EMBEDMENT ( percent of wire diameter)
Figure 27-Average embedment plotted as a function of average tensile-shear strength for 0.020 inch diameter Alloy 180 welded to 0.020 inch diameter Dumet.
18

h 1.5c\
I 15 25 35
AVERAGE EMBEDMENT (percent of wire diameter)
Figure 28-Average embedment plotted as a function of standard deviation for 0.020 inch diameter Alloy 180 welded to 0.020 inch diameter Dumet.
Alloy 180 Welded to Kovar
Kovar, when welded to Alloy 180, produces sound welds over a narrow range of electrode forces and welding energies. No welds were obtained when embedments were less than 4.6 percent, and excessive sticking and spitting oc- curred at settings which produced more than 23 percent embedment (Figure 31). The stand- ard deviation rises sharply as the embedment is increased (Figure 32), however, the average strength level remains essentially constant above 10 percent embedment. Because of the limited range of welder settings which pro- duce sound welds, there was not enough data to produce a conclusive set of welding energy versus embedment curves for this alloy com- bination. Figure 33 presents the limited data that was produced and Figure 34 shows a typical weld joint.
Alloy 180 Welded t o Alloy 180 Ribbon
Micrometer measurements of forty-eight embedments at each machine setting indicate that the strength can be correlated with the joint
I I I 15 25 35
AVERAGE EMBEDMENT (percent of wire diameter)
Figure 29-Average embedment plotted as a function of welding energy for 0.020 inch diameter Alloy 180 welded to 0.020 inch diameter Dumet.
Figure 30-Photomicrograph of a cross-wire weld joint between Dumet (left) and Alloy 180 (magni- fied 70X).
19
I I I I l1l1111l1111lllIIllllll I I 1 I
I I
AVERAGE EMBEDMENT (percent of wire diameter)
X
Figure 31 -Average embedment plotted as a function of average tensile-shear strength for 0.020 inch diameter Alloy 180 welded to 0.020 inch diameter Kovar.
1 .!
', 7)
3
a - Z 0 2 2 - 1.t
0 0
2 Z 2 In
0 7 i o AVERAGE EMBEDMENT (percent of wire diameter)
Figure 32-Average embedment plotted as a function of standard deviation for 0.020 inch diameter Alloy 180 welded to 0.020 inch diameter Kovar.
20
I I ob 10 20
AVERAGE EMBEDMENT (percent of wire diameter)
Figure 33-Average embedment plotted as a function of welding energy for 0.020 inch diameter Alloy 180 welded to 0.020 inch diameter.
Figure 34-Photomicrograph of a cross-wire weld joint between gold plated Kovar (left) and Alloy 180 (magnified 70X).
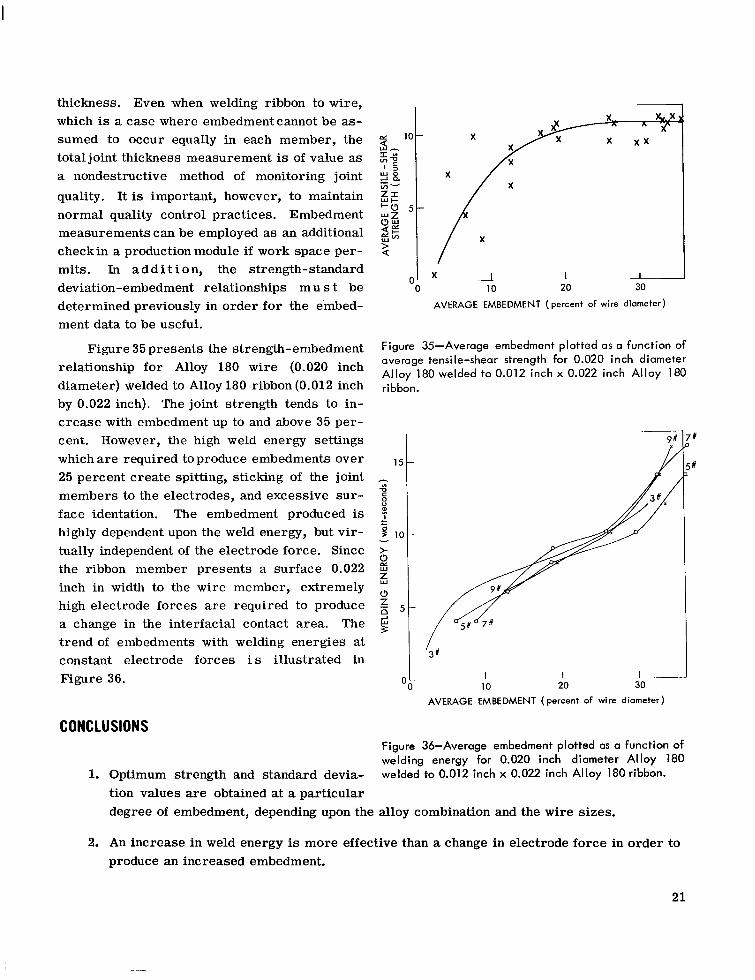
thickness. Even when welding ribbon to wire, which is a case where embedment cannot be as- sumed to occur equally in each member, the total joint thickness measurement is of value as a nondestructive method of monitoring joint quality. It is important, however, to maintain normal quality control practices. Embedment measurements can be employed as an additional checkin a production module if work space per- mits. In a d d i t i on, the strength-standard deviation-embedment relationships m u s t be determined previously in order for the embed- ment data to be useful.
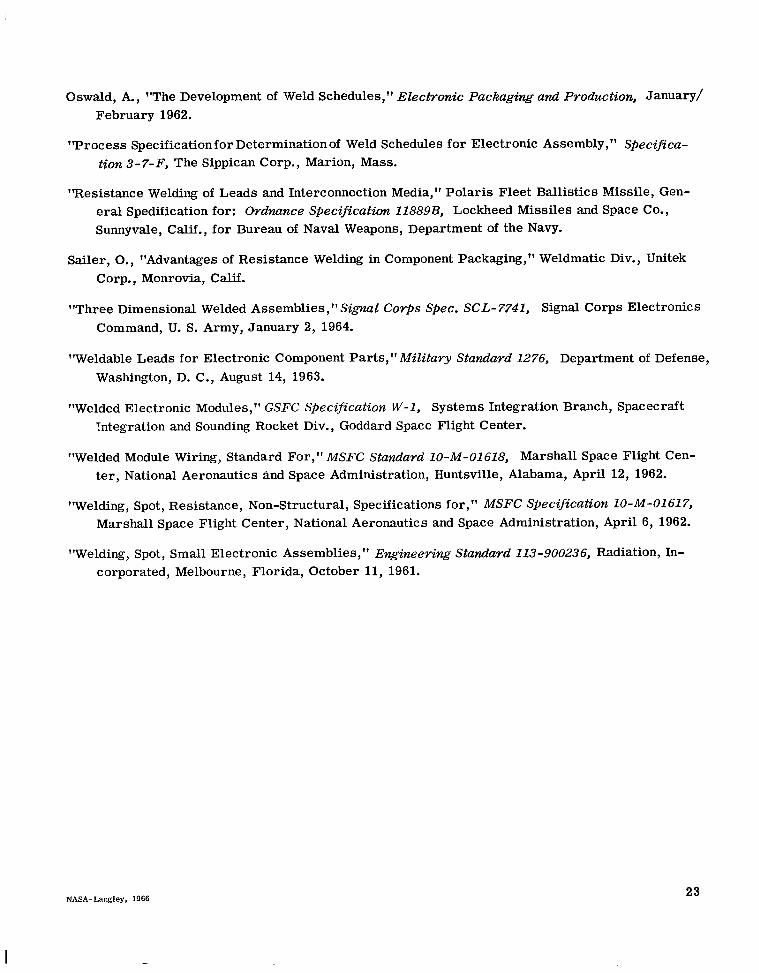
Figure 35 presents the strength-embedment relationship for Alloy 180 wire (0.020 inch diameter) welded to Alloy 180 ribbon (0.012 inch by 0.022 inch). The joint strength tends to in- crease with embedment up to and above 35 per- cent. However, the high weld energy settings which a re required to produce embedments over 25 percent create spitting, sticking of the joint members to the electrodes, and excessive sur- face identation. The embedment produced is highly dependent upon the weld energy, but vir- tually independent of the electrode force. Since the ribbon member presents a surface 0.022 inch in width to the wire member, extremely high electrode forces are required to produce a change in the interfacial contact area. The trend of embedments with welding energies at constant electrode forces i s illustrated in Figure 36.
15
h
a s 2 +
2 10- - > 2 t
z
w
(3 z D 2
1 I 0 10 20 30
AVERAGE EMBEDMENT (percent of wire diameter)
-
5 -
Figure 35-Average embedment plotted as a function of average tensile-shear strength for 0.020 inch diameter Alloy 180 welded to 0.012 inch x 0.022 inch Alloy 180 ribbon.
9ff
/
I 10
I 1 3 # OO
I I-- 20 30
AVERAGE EMBEDMENT (percent of wire diameter)
CONCLUSIONS
1. Optimum strength and standard devia- tion values are obtained at a particular
Figure 36-Average embedment plotted as a function of welding energy for 0.020 inch diameter Alloy 180 welded to 0.012 inch x 0.022 inch Alloy 180 ribbon.
degree of embedment, depending upon the alloy combination and the wire sizes.
2. An increase in weld energy is more effective than a change in electrode force in order to produce an increased embedment.
21

3. Increased electrode force produces a larger interfacial contact area which, due to the lower resistance, produces less heat in the joint. The end result may be a decreased em- bedment with an increase in electrode force if the weld energy settings remain unchanged. An opposite effect may be observed at the high electrode forces.
4. Braze type joints generally have lower strengths and poorer reproducibility than solid state bonds o r fusion nuggets. The fusion nuggets are generally more reliable since clean- liness becomes less important.
5. Coatings with low melting points such an tin, lead, o r solder, have no adverse effect on microcircuitry weld joints if the base metal has good weldability. If sufficient weld energy is used, these coatings are quickly melted and forced out of the interface.
6. Measurements of embedment with micrometers can be useful as an inspection aid after strength-variation-embedment relationships have been established.
Goddard Space Flight Center National Aeronautics and Space Administration
Greenbelt, Maryland, July 1, 1966 125-25-04-01-51
BIBLIOGRAPHY
Allen, G., and Wettstein, J., "Microwelding Electronic Modules," Lockheed Missiles and Space Co., Sunnyvale, Calif.
Armstrong, Lloyd D., "Adoption of Welded Electronic Circuits for Missile and Space Vehicles," ASTIA 272642 Space Technology Laboratory, Los Angeles, Calif., March 24, 1961.
Ayer, W., "System Packaging Analysis and Development,'' Electronic Packaging and Production, May, June, July, 1963.
"Description and Requirements-Resistance Welding (Spot) for Electronic Lead Connections (Gen- eral)," Ordnance Specification 10272A, Bureau of Naval Weapons, Department of the Navy, June 12, 1962.
"Design and Fabrication of Resistance Welded Electronic Circuit Modules and Assemblies," Ordnance Document 20576A, Bureau of Naval Weapons, Department of the Navy, December 21, 1962.
Heindl, Joseph C., Alberts, Joseph N., and Brock, Bert D., "Resistance Welding of Electronic Components," Metal Profless , June 1962.
"High Density Packaging-Welding," Mamfactwing Research Investigation 243.01, Lockheed Air- craft Corporation, Missiles and Space Division, Sunnyvale, Calif., March 1961.
Novak, D., and Hanna, J., "Fabrication Methods and Techniques for Welded Module Production," El-Pac Co., Inc., Morristown, Pa.
22
Oswald, A., "The Development of Weld Schedules," Electronic Packaging and Production, January/ February 1962.
T r o c e s s Specification for Determination of Weld Schedules for Electronic Assembly," Specifica- tion 3-7-F, The Sippican Corp., Marion, Mass.
%esistance Welding of Leads and Interconnection Media," Polaris Fleet Ballistics Missile, Gen- eral Spedification for: Ordnance Specification 11889B, Lockheed Missiles and Space Co., Sunnyvale, Calif., for Bureau of Naval Weapons, Department of the Navy.
Sailer, O., "Advantages of Resistance Welding in Component Packaging," Weldmatic Div., Unitek Corp., Monrovia, Calif.
"Three Dimensional Welded Assemblies," Sigml Corps Spec. SCL-7741, Signal Corps Electronics Command, U. S. Army, January 2, 1964.
"Weldable Leads for Electronic Component Parts," Military Standard 1276, Department of Defense, Washington, D. C., August 14, 1963.
"Welded Electronic Modules," GSFC Specification W-1, Systems Integration Branch, Spacecraft Tntegration and Sounding Rocket Div., Goddard Space Flight Center.
"Welded Module Wiring, Standard For," MSFC Standard 10-M-01618, Marshall Space Flight Cen- ter, National Aeronautics and Space Administration, Huntsville, Alabama, April 12, 1962.
"Welding, Spot, Resistance, Non-Structural, Specifications for," MSFC Specification 10-M-02617, Marshall Space Flight Center, National Aeronautics and Space Administration, April 6, 1962.
"Welding, Spot, Small Electronic Assemblies," Engineering Standard 113-900236, Radiation, In- corporated, Melbourne, Florida, October 11, 1961.
23

“The aeronautical 2nd space activities of the United States shall be conducted so AT t o contribute . . . to the expansion of human knowl- edge of phenomena in the atmosphere and space. The Administfation shall provide for the widest practicable and appropriate dissemination of information concerning its activities and the results thereof .”
-NATIONAL AERONAUTICS AND SPACE ACT OF 1958
NASA .SCIENTIFIC AND TECHNICAL PUBLICATIONS
TECHNICAL REPORTS: important, complete, and a lasting contribution to existing knowledge.
Scientific and technical information considered
TECHNICAL NOTES: of importance as a contribution to existing knowledge.
TECHNICAL MEMORANDUMS: Information receiving limited distri- bution because of preliminary data, security classification, or other reasons.
CONTRACTOR REPORTS: Technical information ’ generated in con- nection with a NASA contract or grant and released under NASA auspices.
TECHNICAL TRANSLATIONS: Information published in a foreign language considered to merit NASA distribution in English.
TECHNICAL REPRINTS: Information derived from NASA activities and initially.published in the form of journal articles.
SPECIAL PUBLICATIONS: Information derived from or of value to NASA activities but not necessarily reporting the results .of individual NASA-programmed scientific efforts. Publications include conference .. proceedings, monographs, data compilations, handbooks, sourcebooks, and spe $a1 bibliographies .
Information less broad in scope but nevertheless
. . . .
Details on the availability o f these publications may be obtained from:
SCIENTIFIC AND TECHNICAL INFORMATION DIVISION
NATIONAL AERONAUTICS AND SPACE ADMINISTRATION
Washington, D.C. PO546