a study on customers’ satisfaction of rich …ijirms.com/downloads/211120162016010510.pdf ·...
TRANSCRIPT
International Journal of Innovative Research in Management Studies (IJIRMS) ISSN (Online): 2455-7188, Impact Factor: 0.7261 Volume 1 | Issue 5 | June 2016
www.ijirms.com Page | 98
A STUDY ON CUSTOMERS’ SATISFACTION OF RICH DAIRY
PRODUCTS (INDIA) PRIVATE LIMITED, NAMAKKAL
Dr.M.Gurusamy* R.Dheerghadharishini**
*Associate Professor, Department of Management Studies, Paavai Engineering College, Pachal, Namakkal.
**II MBA Student, Department of Management Studies, Paavai College of Engineering, Pachal, Namakkal
ABSTRACT
This article is focused on Customer Satisfaction of Rich Dairy Products (India) Private Limited,
Namakkal. The primary data were collected from the respondents by using well-structured
questionnaire through the survey method. The secondary data is collected from the company
profiles, magazines, journals, publications and web sites. The sampling technique adopted for the
study was convenience sampling. A sample of 110 customers were selected from namakkal. The
data collected was classified for the purpose of analysis by using tools like sample percentage
analysis and chi-square test, and this research provides a reasonable suggestion.
KEY WORDS: Advertisement, Customer, Behavior, Economic Group, Satisfaction.
INTRODUCTION
Customer satisfaction is an ultimate aim of all economic activity. Customer is the largest
economic group who are affected by public and private economic decision. Customer satisfaction
is an ultimate aim of any business. Both survival and growth of depend on customer satisfaction.
The customer satisfaction is the relationship between the customers’ exception and the mobile
perceived performance. If it exceeds them, the customer is highly satisfied; if it falls short the
customer is dissatisfied. A satisfied customer is more likely to purchase the mobile next time and
will say good things about the mobile to others. According to marketers, “A satisfied customer is
our best advertisement.”
REVIEW OF LITERATURE
Those who buy the goods or services provided by companies are customers. In other
words, a customer is a stakeholder of an organization who provides payment in exchange for the
offer provided to him by the organization with the aim of fulfilling a need and to maximize
satisfaction. Sometimes the term customer and consumer are confusing. A customer can be a
consumer, but a consumer may not necessarily be a customer. Another author explained this
International Journal of Innovative Research in Management Studies (IJIRMS) ISSN (Online): 2455-7188, Impact Factor: 0.7261 Volume 1 | Issue 5 | June 2016
www.ijirms.com Page | 99
difference. I.e. a customer is the person who does the buying of the products and the consumer is
the person who ultimately consumes the product (Solomon, 2009, p. 34.).
When a consumer/customer is contented with either the product or services it is termed
satisfaction. Satisfaction can also be a person’s feelings of pleasure or disappointment that results
from comparing a product’s perceived performance or outcome with their expectations (Kotler &
Keller, 2009, p. 789). As a matter of fact, satisfaction could be the pleasure derived by someone
from the consumption of goods or services offered by another person or group of people; or it can be
the state of being happy with a situation. Satisfaction varies from one person to another because it is
utility. “One man’s meal is another man’s poison,” an old adage stated describing utility; thus
highlighting the fact that it is sometimes very difficult to satisfy everybody or to determine
satisfaction among group of individuals.
NEED FOR THE SYUDY
In the present era there is a high competition in Textile Industry. There is no substitute for
the textiles. Because textile products have high demand in the market. In Karur, there is heavy
competition from other more textile brands. Customers are very important for any industry. If
customers are satisfied, then the sales of the product increased. Because customer’s satisfaction is
very important. The customers are satisfied with the Price, Quality, lifetime, Transportation
facility, Credit facility, Margins with the product, etc., and then they use more number of products.
For this reason, we make a study on the customer satisfaction towards Smart Home Customers are
the pillars of any business of the organization. Customer awareness and satisfaction leads to
customer loyalty. Which is highly essential. In order to survive in the market, companies have to
take care of customer awareness and satisfaction. So the present study is carried bout in the Textile
industry regarding the customer preference and satisfaction, for further improvement in the aspects
of products, sales…etc.
OBJECTIVES OF THE STUDY
1. PRIMARY OBJECTIVE
To assess the awareness of RICH product brand in the market.
To obtain apparent views regarding quality of RICH brand.
To study the marketing policy which linked with performance goals
International Journal of Innovative Research in Management Studies (IJIRMS) ISSN (Online): 2455-7188, Impact Factor: 0.7261 Volume 1 | Issue 5 | June 2016
www.ijirms.com Page | 100
2. SECONDARY OBJECTIVES;
To assess the kind of recommendations made towards the brand to others.
To identify the reason for the brand preference over the competing brands.
To appraise the customer satisfaction level by choosing the particular brand.
To assess the attractiveness of the RICH brand.
To capturing the market practicability.
SCOPE OF THE STUDY
It assists the firm to understand the consumer psychology on choosing the brand stability to
the alternatives.
It also helps to assess the real opinion and mindset of consumers and aids to meet out their
expectation in future in turn that will increases the volume of sales.
The study helps us to know about the Customers brand awareness level towards other
competing brands.
To recognize the drawbacks in the existing system.
It also helps to find the loyalty of the customers in choosing the brand.
The study helps to the company to pick the alternatives in marketing the products.
It helps to scrutinize the interaction among various level of management.
The project helps to know the efforts taking in future towards the progress of the company.
LIMITATION OF THE STUDY
Time constraints were one of the most important factors that imposed restrictions on
conducting the study extensively.
Some of the respondents were unwillingness to answer the question.
Some of the respondents were afraid to give true information in some cases.
The data provided by the respondents may be false at times.
Privacy or reluctance to disclose confidential data was another important problem.
Cost constraints.
Lack of experience of group members.
The analysis, evaluation, finding and suggestion are made solely on the basis of data
provided by the concert. So the accuracy depends on the dada provided.
International Journal of Innovative Research in Management Studies (IJIRMS) ISSN (Online): 2455-7188, Impact Factor: 0.7261 Volume 1 | Issue 5 | June 2016
www.ijirms.com Page | 101
During the busy hour’s people are not ready to respond.
RESEARCH METHODOLOGY
To fulfill any task, it is necessary to follow a systematic method. Research methodology
is the main aspect of research studies. The methodology follow by research is detailed here. In
general, “RESEARCH” can be termed as an inquiry in to the nature of, the reasons for, and the
consequences of any particular set of circumstances. It is the process of finding solution for a
problem after a thorough study and analysis of the situational factors. It tries to solve a complex
and complicated problem through use of various tools and techniques. These tools and techniques
try to bring out a logical, accurate and scientific solution to given problem.
“METHODOLOGY” as the name suggests is the method through which the problem or
situation is tackled. Managers in organization constantly engage themselves in studying and
analyzing issues and hence are involved in some form of research activity as they make decisions
at the work place. It involves a lot of factor like the research design, sample size, segment,
techniques of sampling, tools used etc all these steps and factors put together to bring out a clear
and accurate result.
DATE ANALYSIS AND INTERPRETATION
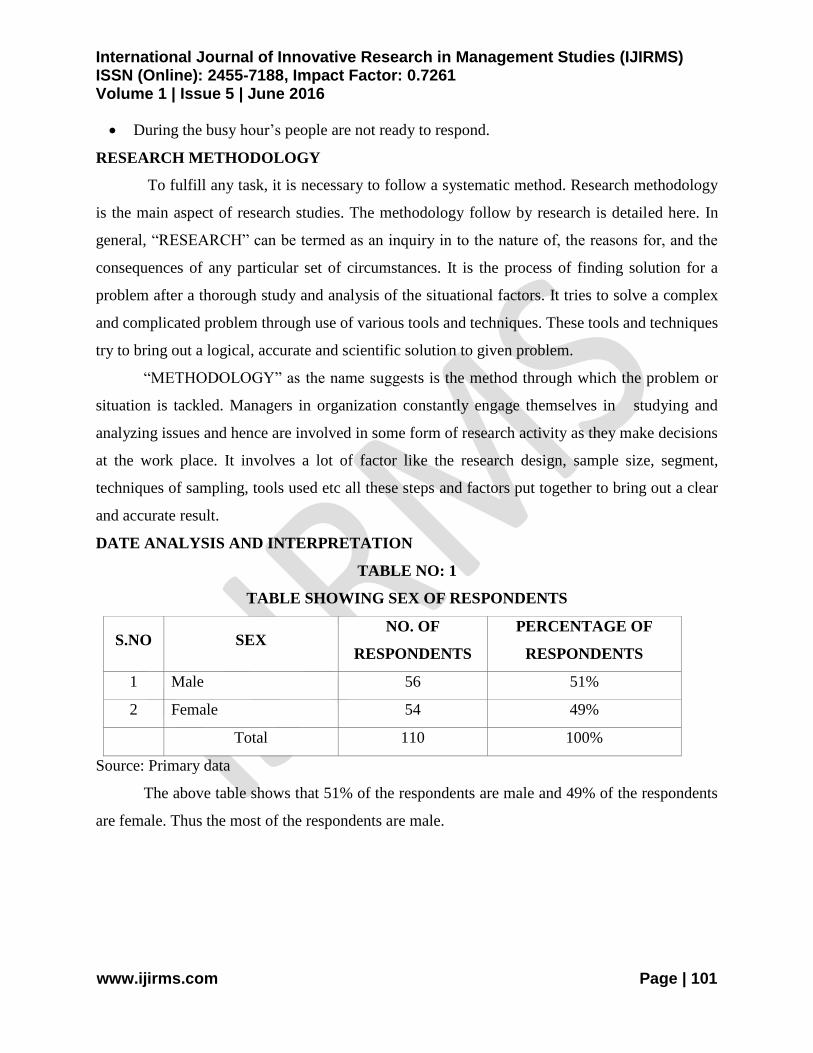
TABLE NO: 1
TABLE SHOWING SEX OF RESPONDENTS
S.NO SEX NO. OF
RESPONDENTS
PERCENTAGE OF
RESPONDENTS
1 Male 56 51%
2 Female 54 49%
Total 110 100%
Source: Primary data
The above table shows that 51% of the respondents are male and 49% of the respondents
are female. Thus the most of the respondents are male.
International Journal of Innovative Research in Management Studies (IJIRMS) ISSN (Online): 2455-7188, Impact Factor: 0.7261 Volume 1 | Issue 5 | June 2016
www.ijirms.com Page | 102
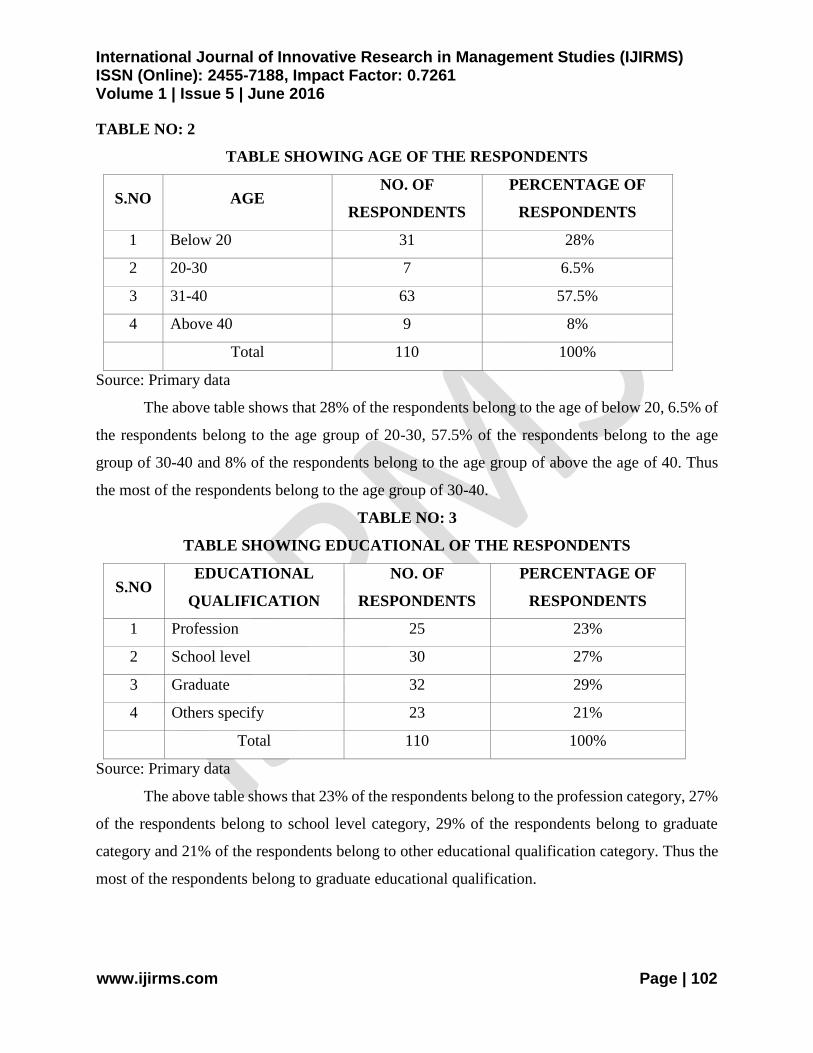
TABLE NO: 2
TABLE SHOWING AGE OF THE RESPONDENTS
S.NO AGE NO. OF
RESPONDENTS
PERCENTAGE OF
RESPONDENTS
1 Below 20 31 28%
2 20-30 7 6.5%
3 31-40 63 57.5%
4 Above 40 9 8%
Total 110 100%
Source: Primary data
The above table shows that 28% of the respondents belong to the age of below 20, 6.5% of
the respondents belong to the age group of 20-30, 57.5% of the respondents belong to the age
group of 30-40 and 8% of the respondents belong to the age group of above the age of 40. Thus
the most of the respondents belong to the age group of 30-40.
TABLE NO: 3
TABLE SHOWING EDUCATIONAL OF THE RESPONDENTS
S.NO EDUCATIONAL
QUALIFICATION
NO. OF
RESPONDENTS
PERCENTAGE OF
RESPONDENTS
1 Profession 25 23%
2 School level 30 27%
3 Graduate 32 29%
4 Others specify 23 21%
Total 110 100%
Source: Primary data
The above table shows that 23% of the respondents belong to the profession category, 27%
of the respondents belong to school level category, 29% of the respondents belong to graduate
category and 21% of the respondents belong to other educational qualification category. Thus the
most of the respondents belong to graduate educational qualification.
International Journal of Innovative Research in Management Studies (IJIRMS) ISSN (Online): 2455-7188, Impact Factor: 0.7261 Volume 1 | Issue 5 | June 2016
www.ijirms.com Page | 103
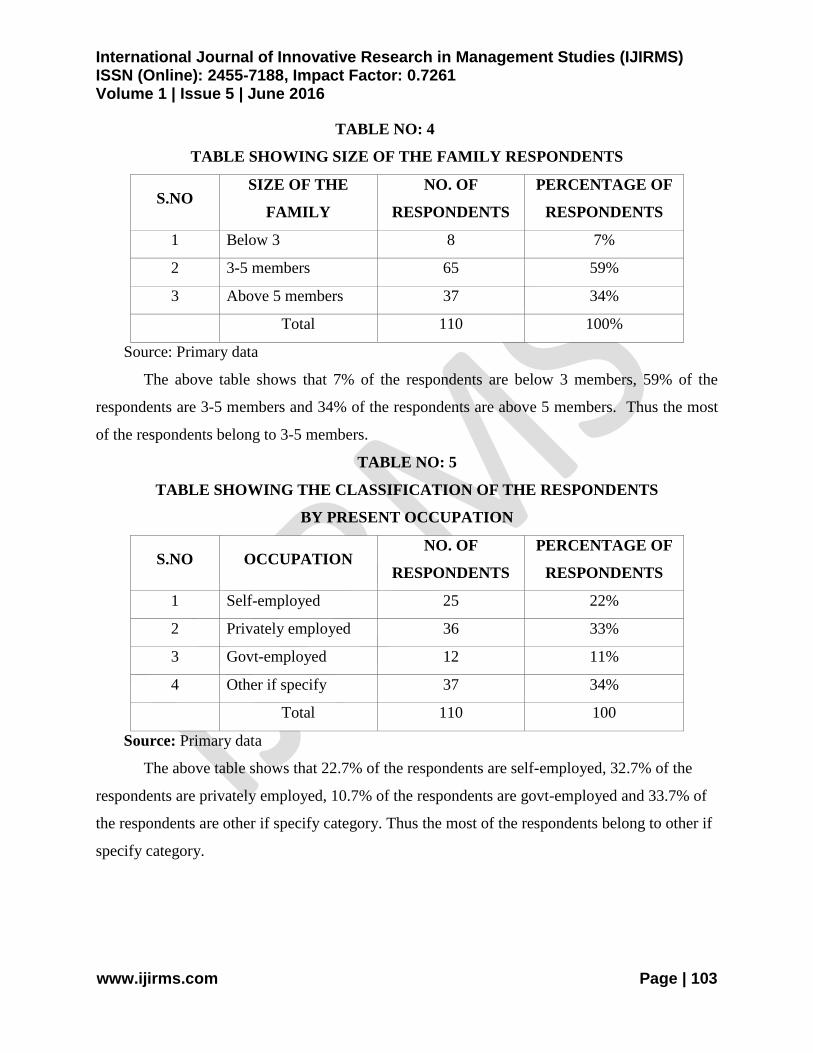
TABLE NO: 4
TABLE SHOWING SIZE OF THE FAMILY RESPONDENTS
S.NO SIZE OF THE
FAMILY
NO. OF
RESPONDENTS
PERCENTAGE OF
RESPONDENTS
1 Below 3 8 7%
2 3-5 members 65 59%
3 Above 5 members 37 34%
Total 110 100%
Source: Primary data
The above table shows that 7% of the respondents are below 3 members, 59% of the
respondents are 3-5 members and 34% of the respondents are above 5 members. Thus the most
of the respondents belong to 3-5 members.
TABLE NO: 5
TABLE SHOWING THE CLASSIFICATION OF THE RESPONDENTS
BY PRESENT OCCUPATION
S.NO OCCUPATION NO. OF
RESPONDENTS
PERCENTAGE OF
RESPONDENTS
1 Self-employed 25 22%
2 Privately employed 36 33%
3 Govt-employed 12 11%
4 Other if specify 37 34%
Total 110 100
Source: Primary data
The above table shows that 22.7% of the respondents are self-employed, 32.7% of the
respondents are privately employed, 10.7% of the respondents are govt-employed and 33.7% of
the respondents are other if specify category. Thus the most of the respondents belong to other if
specify category.
International Journal of Innovative Research in Management Studies (IJIRMS) ISSN (Online): 2455-7188, Impact Factor: 0.7261 Volume 1 | Issue 5 | June 2016
www.ijirms.com Page | 104
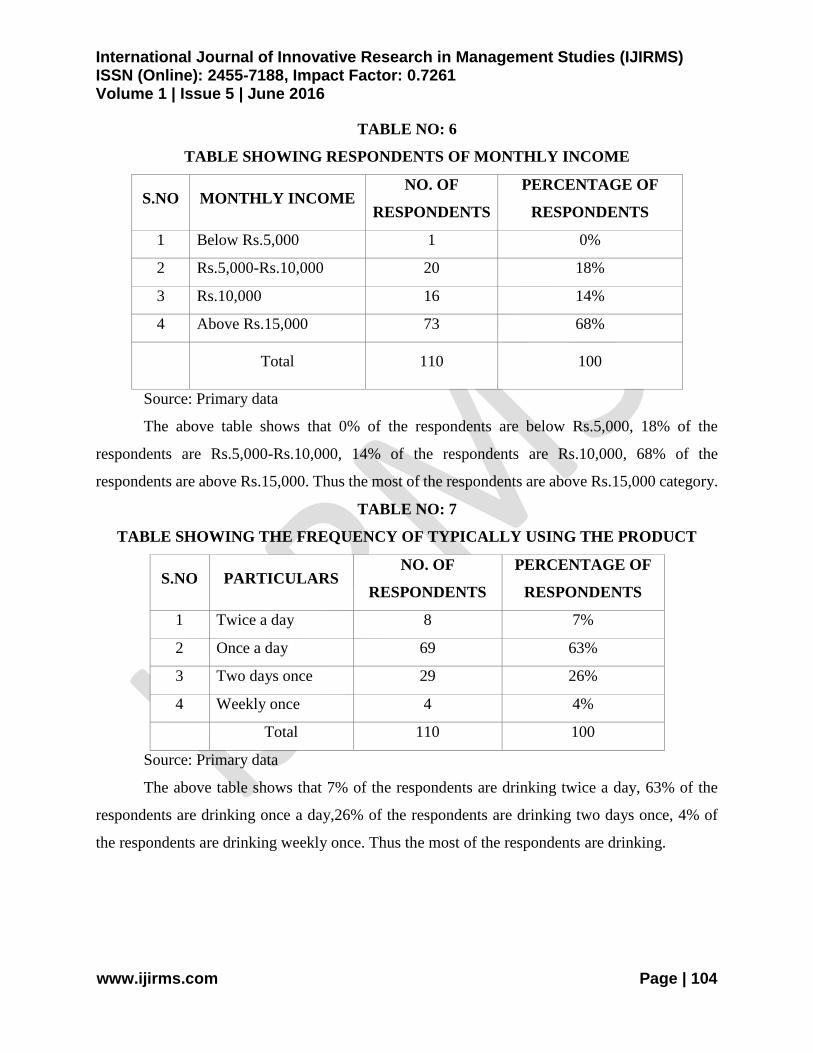
TABLE NO: 6
TABLE SHOWING RESPONDENTS OF MONTHLY INCOME
S.NO MONTHLY INCOME NO. OF
RESPONDENTS
PERCENTAGE OF
RESPONDENTS
1 Below Rs.5,000 1 0%
2 Rs.5,000-Rs.10,000 20 18%
3 Rs.10,000 16 14%
4 Above Rs.15,000 73 68%
Total 110 100
Source: Primary data
The above table shows that 0% of the respondents are below Rs.5,000, 18% of the
respondents are Rs.5,000-Rs.10,000, 14% of the respondents are Rs.10,000, 68% of the
respondents are above Rs.15,000. Thus the most of the respondents are above Rs.15,000 category.
TABLE NO: 7
TABLE SHOWING THE FREQUENCY OF TYPICALLY USING THE PRODUCT
S.NO PARTICULARS NO. OF
RESPONDENTS
PERCENTAGE OF
RESPONDENTS
1 Twice a day 8 7%
2 Once a day 69 63%
3 Two days once 29 26%
4 Weekly once 4 4%
Total 110 100
Source: Primary data
The above table shows that 7% of the respondents are drinking twice a day, 63% of the
respondents are drinking once a day,26% of the respondents are drinking two days once, 4% of
the respondents are drinking weekly once. Thus the most of the respondents are drinking.
International Journal of Innovative Research in Management Studies (IJIRMS) ISSN (Online): 2455-7188, Impact Factor: 0.7261 Volume 1 | Issue 5 | June 2016
www.ijirms.com Page | 105
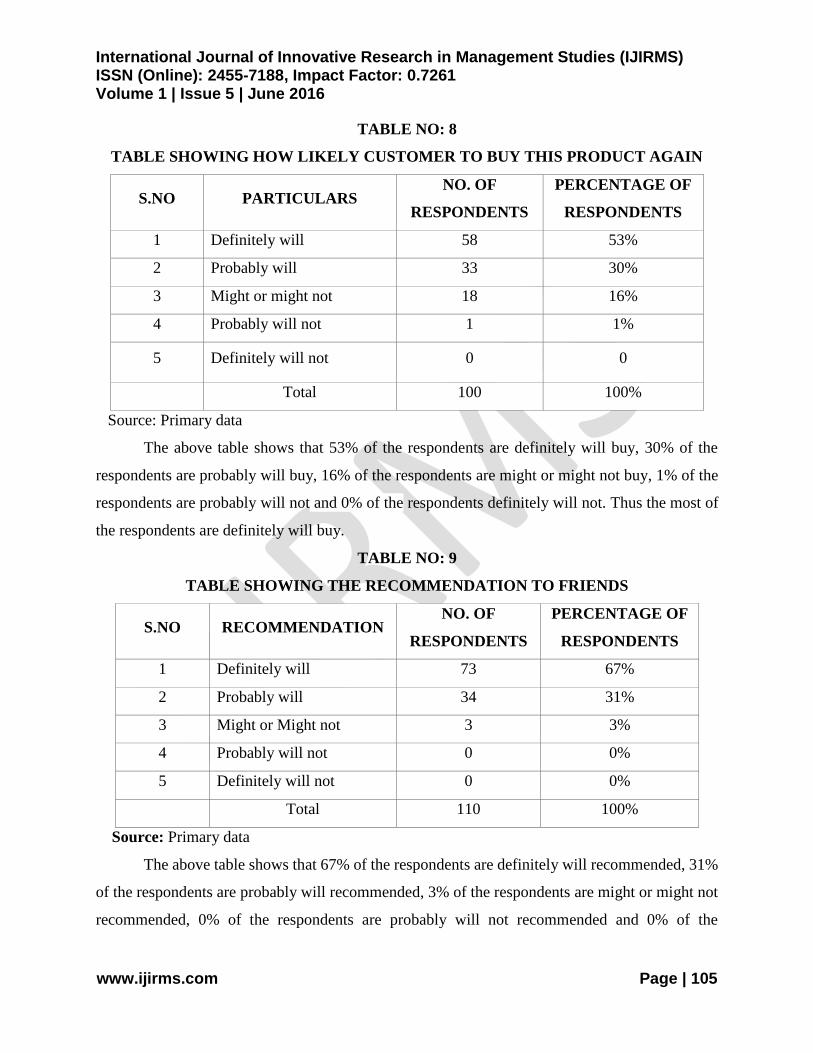
TABLE NO: 8
TABLE SHOWING HOW LIKELY CUSTOMER TO BUY THIS PRODUCT AGAIN
S.NO PARTICULARS NO. OF
RESPONDENTS
PERCENTAGE OF
RESPONDENTS
1 Definitely will 58 53%
2 Probably will 33 30%
3 Might or might not 18 16%
4 Probably will not 1 1%
5 Definitely will not 0 0
Total 100 100%
Source: Primary data
The above table shows that 53% of the respondents are definitely will buy, 30% of the
respondents are probably will buy, 16% of the respondents are might or might not buy, 1% of the
respondents are probably will not and 0% of the respondents definitely will not. Thus the most of
the respondents are definitely will buy.
TABLE NO: 9
TABLE SHOWING THE RECOMMENDATION TO FRIENDS
S.NO RECOMMENDATION NO. OF
RESPONDENTS
PERCENTAGE OF
RESPONDENTS
1 Definitely will 73 67%
2 Probably will 34 31%
3 Might or Might not 3 3%
4 Probably will not 0 0%
5 Definitely will not 0 0%
Total 110 100%
Source: Primary data
The above table shows that 67% of the respondents are definitely will recommended, 31%
of the respondents are probably will recommended, 3% of the respondents are might or might not
recommended, 0% of the respondents are probably will not recommended and 0% of the
International Journal of Innovative Research in Management Studies (IJIRMS) ISSN (Online): 2455-7188, Impact Factor: 0.7261 Volume 1 | Issue 5 | June 2016
www.ijirms.com Page | 106
respondents are definitely will not recommended to their friends. Thus the most of the respondents
are definitely will recommended to their friends.
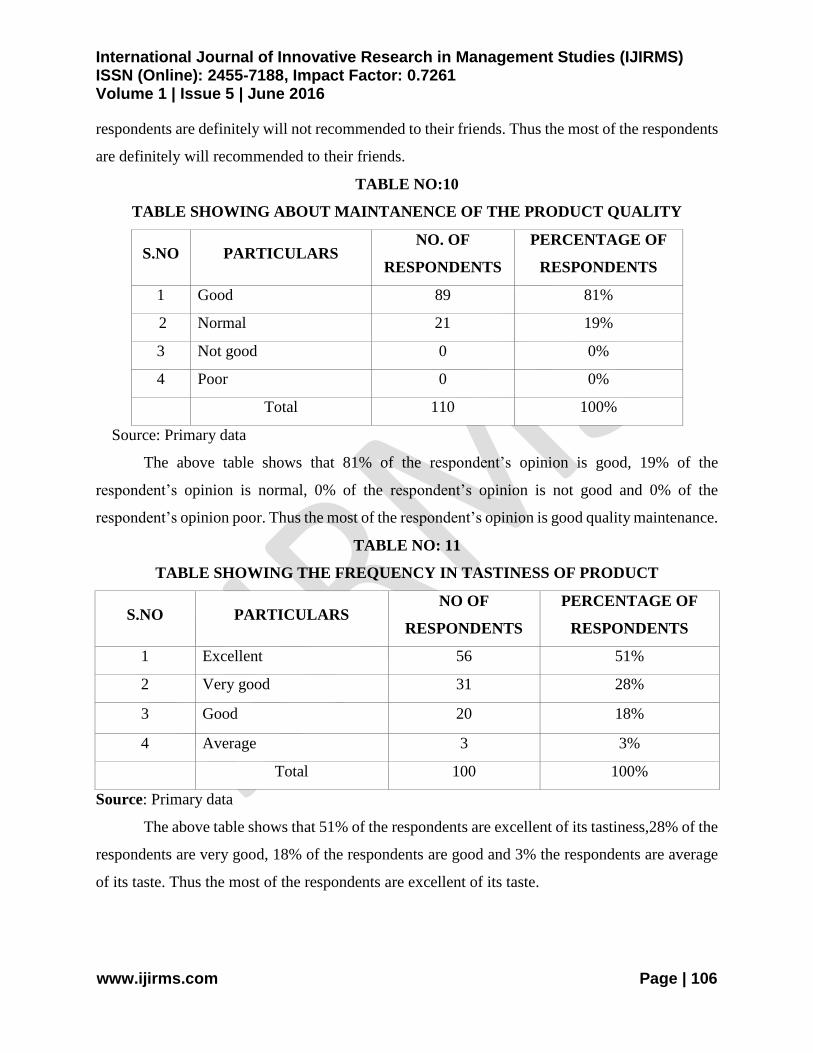
TABLE NO:10
TABLE SHOWING ABOUT MAINTANENCE OF THE PRODUCT QUALITY
S.NO PARTICULARS NO. OF
RESPONDENTS
PERCENTAGE OF
RESPONDENTS
1 Good 89 81%
2 Normal 21 19%
3 Not good 0 0%
4 Poor 0 0%
Total 110 100%
Source: Primary data
The above table shows that 81% of the respondent’s opinion is good, 19% of the
respondent’s opinion is normal, 0% of the respondent’s opinion is not good and 0% of the
respondent’s opinion poor. Thus the most of the respondent’s opinion is good quality maintenance.
TABLE NO: 11
TABLE SHOWING THE FREQUENCY IN TASTINESS OF PRODUCT
S.NO PARTICULARS NO OF
RESPONDENTS
PERCENTAGE OF
RESPONDENTS
1 Excellent 56 51%
2 Very good 31 28%
3 Good 20 18%
4 Average 3 3%
Total 100 100%
Source: Primary data
The above table shows that 51% of the respondents are excellent of its tastiness,28% of the
respondents are very good, 18% of the respondents are good and 3% the respondents are average
of its taste. Thus the most of the respondents are excellent of its taste.
International Journal of Innovative Research in Management Studies (IJIRMS) ISSN (Online): 2455-7188, Impact Factor: 0.7261 Volume 1 | Issue 5 | June 2016
www.ijirms.com Page | 107
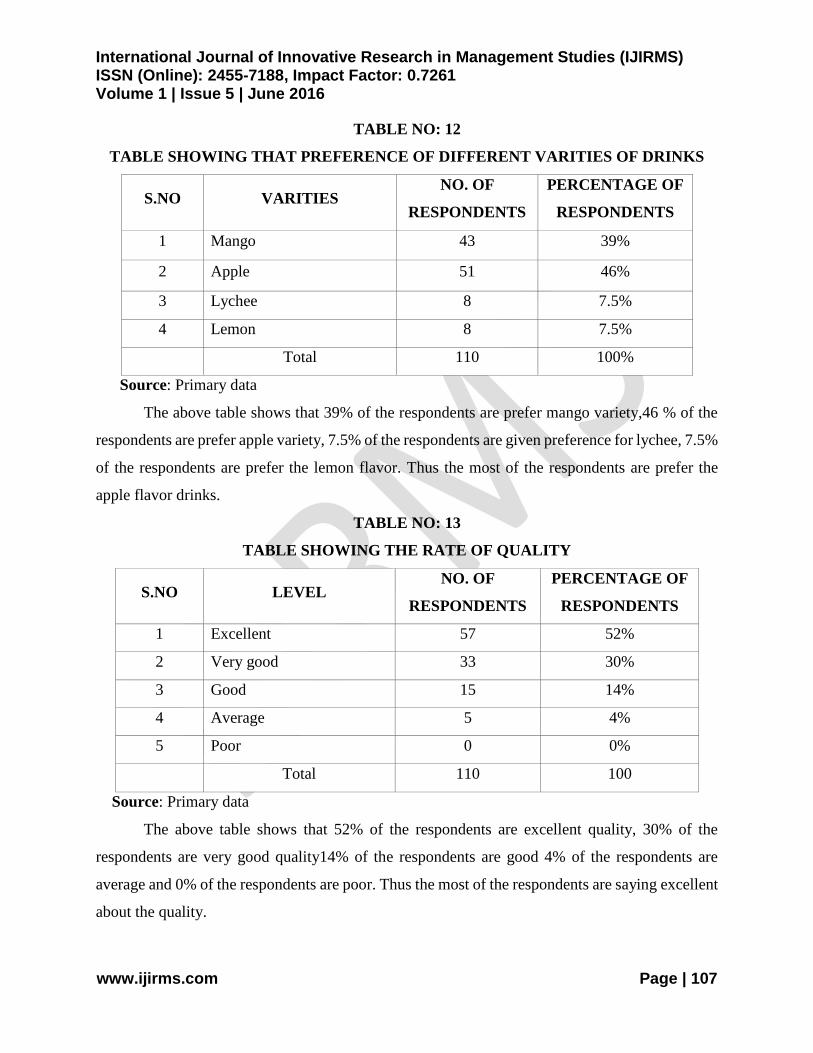
TABLE NO: 12
TABLE SHOWING THAT PREFERENCE OF DIFFERENT VARITIES OF DRINKS
S.NO VARITIES NO. OF
RESPONDENTS
PERCENTAGE OF
RESPONDENTS
1 Mango 43 39%
2 Apple 51 46%
3 Lychee 8 7.5%
4 Lemon 8 7.5%
Total 110 100%
Source: Primary data
The above table shows that 39% of the respondents are prefer mango variety,46 % of the
respondents are prefer apple variety, 7.5% of the respondents are given preference for lychee, 7.5%
of the respondents are prefer the lemon flavor. Thus the most of the respondents are prefer the
apple flavor drinks.
TABLE NO: 13
TABLE SHOWING THE RATE OF QUALITY
S.NO LEVEL NO. OF
RESPONDENTS
PERCENTAGE OF
RESPONDENTS
1 Excellent 57 52%
2 Very good 33 30%
3 Good 15 14%
4 Average 5 4%
5 Poor 0 0%
Total 110 100
Source: Primary data
The above table shows that 52% of the respondents are excellent quality, 30% of the
respondents are very good quality14% of the respondents are good 4% of the respondents are
average and 0% of the respondents are poor. Thus the most of the respondents are saying excellent
about the quality.
International Journal of Innovative Research in Management Studies (IJIRMS) ISSN (Online): 2455-7188, Impact Factor: 0.7261 Volume 1 | Issue 5 | June 2016
www.ijirms.com Page | 108
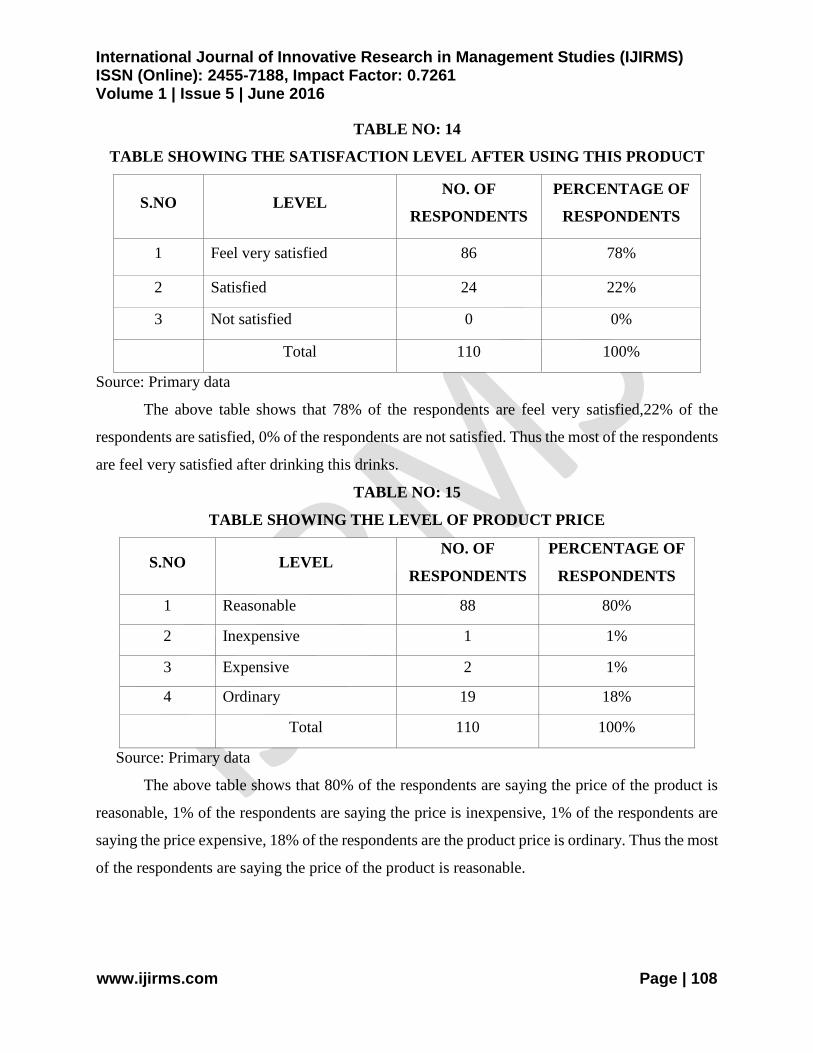
TABLE NO: 14
TABLE SHOWING THE SATISFACTION LEVEL AFTER USING THIS PRODUCT
S.NO LEVEL NO. OF
RESPONDENTS
PERCENTAGE OF
RESPONDENTS
1 Feel very satisfied 86 78%
2 Satisfied 24 22%
3 Not satisfied 0 0%
Total 110 100%
Source: Primary data
The above table shows that 78% of the respondents are feel very satisfied,22% of the
respondents are satisfied, 0% of the respondents are not satisfied. Thus the most of the respondents
are feel very satisfied after drinking this drinks.
TABLE NO: 15
TABLE SHOWING THE LEVEL OF PRODUCT PRICE
S.NO LEVEL NO. OF
RESPONDENTS
PERCENTAGE OF
RESPONDENTS
1 Reasonable 88 80%
2 Inexpensive 1 1%
3 Expensive 2 1%
4 Ordinary 19 18%
Total 110 100%
Source: Primary data
The above table shows that 80% of the respondents are saying the price of the product is
reasonable, 1% of the respondents are saying the price is inexpensive, 1% of the respondents are
saying the price expensive, 18% of the respondents are the product price is ordinary. Thus the most
of the respondents are saying the price of the product is reasonable.
International Journal of Innovative Research in Management Studies (IJIRMS) ISSN (Online): 2455-7188, Impact Factor: 0.7261 Volume 1 | Issue 5 | June 2016
www.ijirms.com Page | 109
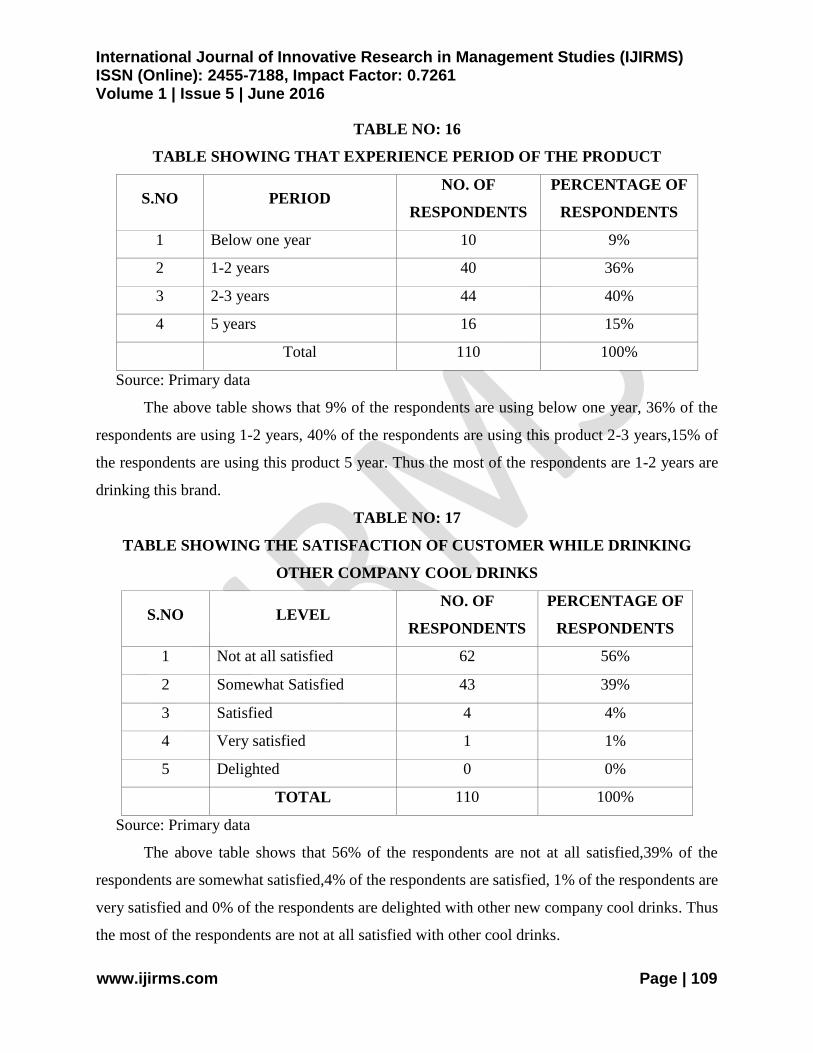
TABLE NO: 16
TABLE SHOWING THAT EXPERIENCE PERIOD OF THE PRODUCT
S.NO PERIOD NO. OF
RESPONDENTS
PERCENTAGE OF
RESPONDENTS
1 Below one year 10 9%
2 1-2 years 40 36%
3 2-3 years 44 40%
4 5 years 16 15%
Total 110 100%
Source: Primary data
The above table shows that 9% of the respondents are using below one year, 36% of the
respondents are using 1-2 years, 40% of the respondents are using this product 2-3 years,15% of
the respondents are using this product 5 year. Thus the most of the respondents are 1-2 years are
drinking this brand.
TABLE NO: 17
TABLE SHOWING THE SATISFACTION OF CUSTOMER WHILE DRINKING
OTHER COMPANY COOL DRINKS
S.NO LEVEL NO. OF
RESPONDENTS
PERCENTAGE OF
RESPONDENTS
1 Not at all satisfied 62 56%
2 Somewhat Satisfied 43 39%
3 Satisfied 4 4%
4 Very satisfied 1 1%
5 Delighted 0 0%
TOTAL 110 100%
Source: Primary data
The above table shows that 56% of the respondents are not at all satisfied,39% of the
respondents are somewhat satisfied,4% of the respondents are satisfied, 1% of the respondents are
very satisfied and 0% of the respondents are delighted with other new company cool drinks. Thus
the most of the respondents are not at all satisfied with other cool drinks.
International Journal of Innovative Research in Management Studies (IJIRMS) ISSN (Online): 2455-7188, Impact Factor: 0.7261 Volume 1 | Issue 5 | June 2016
www.ijirms.com Page | 110
FINDINGS
As per the survey consumers consider quality as the major factor preferring Rich Dairy’s
products.
From the survey it was found that most of the consumers are use the Rich Dairy drinks once
a day.
Surveys shows that majority of the respondents are recommend this drinks to their friends.
From the survey it was found that most of the consumers are definitely will buy the cool
drinks again based on their experience.
From the study we can understand that the demand of apple flavor is higher as compared to
other varieties of drinks.
Survey shows that Rich Dairy quality is good while comparing to other factory cool drinks.
Survey shows that mango flavor is also preferred by most of the respondents.
Survey shoes that most of the respondents are rate the quality of Rich Dairy products is
excellent.
Survey shows that majority or respondents are using the Rich Dairy cool drinks 2-3 years.
SUGGESTIONS
Based on the findings reached the following are made. In order to with stand consumer
confidence and also for increasing market share.
The management should take adequate steps in improving advertisements of the products in
local TV channel through celebrities and in newspapers and also increase the frequency of
advertisement. This will help to increase the turnover.
By reducing the price of products, company can able to achieve more sales because it is not
affordable to low income group of the society.
The firm should undertake continuous market research to analyze the problems and improve
performance.
The management should introduce more number of outlets and make the distribution
channels more effective and increase sales volume.
CONCLUSION
RICH DAIRY PRODUCYS (INDIA) PRIVATE LIMITED plays an important role to
provide varieties of cool drinks with quality. This group of companies has been concentrated in
International Journal of Innovative Research in Management Studies (IJIRMS) ISSN (Online): 2455-7188, Impact Factor: 0.7261 Volume 1 | Issue 5 | June 2016
www.ijirms.com Page | 111
research and development for the existing standard along with customer satisfaction and to avoid
the problems faced by the users of their cool drinks. Hence it is concluded that the “customer
focus” is the key factor in the modern market environment. This will lead the satisfaction among
all the users and customers of the Rich Dairy products and to enhance the market share.
BIBLIOGRAPHY
BOOK
Philip Kotler, “Marketing Management” Prentice Hall of India Pvt. Ltd., Millennium
Edition (2000).
Subash C. Jain, “Marketing Planning & Strategy “, South Western College Publishing,
Sixth Edition (2000).
WEBSITE
www.google . com
www. [email protected],
www.richdairyproducts.com
*****