a technical assessment energy, paducah gaseous …
TRANSCRIPT

A TECHNICAL ASSESSMENT OF THE CURRENT WATER POLICY BOUNDARY AT THE U.S. DEPARTMENT OF ENERGY, PADUCAH GASEOUS DIFFUSION PLANT, PADUCAH, KENTUCKY Prepared by Oak Ridge Associated Universities and I2M Associates, LLC Prepared for the U.S. Department of Energy
Approved for public release; further dissemination unlimited.

Oak Ridge Associated Universities manages the Oak Ridge Institute for Science and Education (ORISE) contract for the U.S. Department of Energy. ORISE focuses on scientific initiatives to research health risks from occupational hazards, assess environmental cleanup, respond to radiation medical emergencies, support national security and emergency preparedness, and educate the next generation of scientists.
NOTICES The opinions expressed herein do not necessarily reflect the opinions of the sponsoring institutions of Oak Ridge Associated Universities. This report was prepared as an account of work sponsored by the United States Government. Neither the United States Government nor the U.S. Department of Energy, nor any of their employees, makes any warranty, expressed or implied, or assumes any legal liability or responsibility for the accuracy, completeness, or usefulness of any information, apparatus, product, or process disclosed, or represents that its use would not infringe on privately owned rights. Reference herein to any specific commercial product, process, or service by trade name, mark, manufacturer, or otherwise, does not necessarily constitute or imply its endorsement or recommendation, or favor by the U.S. Government or any agency thereof. The views and opinions of authors expressed herein do not necessarily state or reflect those of the U.S. Government or any agency thereof.

Paducah TCE 5194-TR-01-0
A TECHNICAL ASSESSMENT OF THE CURRENT WATER POLICY BOUNDARY AT U.S. DEPARTMENT OF ENERGY,
PADUCAH GASEOUS DIFFUSION PLANT, PADUCAH, KENTUCKY
Prepared by Oak Ridge Associated Universities
Independent Environmental Assessment and Verification Program Oak Ridge, Tennessee
and
I2M Associates, LLC Houston, Texas, and Seattle, Washington
DECEMBER 2012
Prepared for the U.S. Department of Energy
Prepared by Oak Ridge Associated Universities under the Oak Ridge Institute for Science and Education contract, number DE-AC05-06OR23100, with the U.S. Department of Energy.

Paducah TCE i 5194-TR-01-0
CONTENTS
FIGURES ........................................................................................................................................................... ii 1. EXECUTIVE SUMMARY ......................................................................................................................... 1
2. INTRODUCTION ....................................................................................................................................... 2
3. ASSESSMENT METHODS ....................................................................................................................... 3
3.1 Geological Data ................................................................................................................................. 4
3.2 Hydrogeological Data ....................................................................................................................... 6
3.3 Contaminant Plume Development ................................................................................................. 6
3.4 Calibrated Groundwater Modeling ................................................................................................. 8
4. CONCLUSIONS .......................................................................................................................................... 9
5. REFERENCES ........................................................................................................................................... 12
APPENDIX A. FIGURES

Paducah TCE ii 5194-TR-01-0
FIGURES
Fig. A-1. Cross-section of General Geology around the PGDP Facility ............................................. A-1 Fig. A-2. Location of Cross-section of General Geology around the PGDP Facility........................ A-2 Fig. A-3. 1993 Plume Map ........................................................................................................................... A-3 Fig. A-4. 1994 Plume Map ........................................................................................................................... A-4 Fig. A-5. 1996 Plume Map ........................................................................................................................... A-5 Fig. A-6. 2000 Plume Map ........................................................................................................................... A-6 Fig. A-7. 2005 Plume Map ........................................................................................................................... A-7 Fig. A-8. 2009 Plume Map ........................................................................................................................... A-8 Fig. A-9. 2010 Plume Map ........................................................................................................................... A-9 Fig. A-9A. Northwest Plume Map ........................................................................................................... A-10 Fig. A-9B. Northeast Plume Map ............................................................................................................. A-11 Fig. A-10. Water Policy Boundary and Monitoring Wells at Residential Sites in
Context with the TCE Plumes ............................................................................................... A-12 Fig. A-11A. Calibrated Groundwater Model—25 Year Basis .............................................................. A-13 Fig. A-11B. Calibrated Groundwater Model—Forward Particle Traces ............................................ A-13 Fig. A-12. TCE Plume Footprint: 1991–2010, Flow Path Boundary and Adjusted
Water Policy Boundary ............................................................................................................ A-14 Fig. A-13. Potentiometric Surface Map, 2001—1st Quarter ................................................................. A-15 Fig. A-14. Potentiometric Surface Map, 2001—2nd Quarter ................................................................ A-16 Fig. A-15. Potentiometric Surface Map, 2001—3rd Quarter ................................................................. A-17 Fig. A-16. Potentiometric Surface Map, 2001—4th Quarter ................................................................. A-18 Fig. A-17. Potentiometric Surface Map, 2002—1st Quarter ................................................................. A-19 Fig. A-18. Potentiometric Surface Map, 2002—2nd Quarter ................................................................ A-20 Fig. A-19. Potentiometric Surface Map, 2002—3rd Quarter ................................................................. A-21 Fig. A-20. Potentiometric Surface Map, 2002—4th Quarter ................................................................. A-22 Fig. A-21. Potentiometric Surface Map, 2003—1st Quarter ................................................................. A-23 Fig. A-22. Potentiometric Surface Map, 2003—2nd Quarter ................................................................ A-24 Fig. A-23. Potentiometric Surface Map, 2003—3rd Quarter ................................................................. A-25 Fig. A-24. Potentiometric Surface Map, 2003—4th Quarter ................................................................. A-26 Fig. A-25. Potentiometric Surface Map, 2004—1st Quarter ................................................................. A-27 Fig. A-26. Potentiometric Surface Map, 2004—2nd Quarter ................................................................ A-28 Fig. A-27. Potentiometric Surface Map, 2004—3rd Quarter ................................................................. A-29 Fig. A-28. Potentiometric Surface Map, 2004—4th Quarter ................................................................. A-30 Fig. A-29. Potentiometric Surface Map, 2005—1st Quarter ................................................................. A-31 Fig. A-30. Potentiometric Surface Map, 2005—2nd Quarter ................................................................ A-32 Fig. A-31. Potentiometric Surface Map, 2005—3rd Quarter ................................................................. A-33 Fig. A-32. Potentiometric Surface Map, 2005—4th Quarter ................................................................. A-34 Fig. A-33. Modeled Surface of RGA W/NW and NE Plumes ........................................................... A-35

Paducah TCE 1 5194-TR-01-0
1. EXECUTIVE SUMMARY
In 1988, groundwater contaminated with trichloroethene (TCE) and technetium-99 (Tc-99) was
identified in samples collected from residential water wells withdrawing groundwater from the
Regional Gravel Aquifer (RGA) north of the Paducah Gaseous Diffusion Plant (PGDP) facility. In
response, the U.S. Department of Energy (DOE) provided temporary drinking water supplies to
approximately 100 potentially affected residents by initially supplying bottled water, water tanks, and
water-treatment systems, and then by extending municipal water lines, all at no cost, to those
persons whose wells could be affected by contaminated groundwater. The Water Policy boundary
was established in 1993 (ERWM 1993). In the Policy, DOE agreed to pay the reasonable monthly
cost of water for homes and businesses and, in exchange, many of the land owners signed license
agreements committing to cease using the groundwater via rural water wells.
In 2012, DOE requested that Oak Ridge Associated Universities (ORAU), managing contractor of
Oak Ridge Institute for Science and Education (ORISE), provide an independent assessment of the
quality and quantity of the existing groundwater monitoring data and determine if there is sufficient
information to support a modification to the boundary of the current Water Policy. As a result of
the assessment, ORAU concludes that sufficient groundwater monitoring data exists to determine
that a shrinkage and/or shift of the plume(s) responsible for the initial development of this policy
has occurred. Specifically, there is compelling evidence that the TCE plume is undergoing shrinkage
due to natural attenuation and associated degradation. The plume shrinkage (and migration) has also
been augmented in local areas where large volumes of groundwater were recovered by pump-and-
treat remedial systems along the eastern and western boundaries of the Northwest Plume, and in
other areas where pump-and-treat systems have been deployed by DOE to remove source
contaminants. The available evidence supports adjusting the western and northwestern Water Policy
boundary.
Based on the historical and modeled hydrogeological data reflecting past flow and plume
attenuation, along with associated plume migration toward the northeast, the establishment of a new
boundary along the westernmost margin of the earliest indication of the TCE plume is proposed and
justified on hydrogeological grounds. Approximately 30% of the original area would remain within

Paducah TCE 2 5194-TR-01-0
the adjusted Water Policy area west and northwest of the PGDP facility. This modification would
release about 70% of the area, although individual properties would overlap the new boundary.
2. INTRODUCTION
In 1988, groundwater contaminated with TCE and Tc-99 was identified off-site of the PGDP
facility. DOE responded by providing temporary water supplies to approximately 100 potentially
affected residents by initially supplying bottled water, water tanks, and water-treatment systems, and
then by extending municipal water lines, all at no cost, to those persons whose wells could be
affected by contaminated groundwater. The Water Policy boundary was established in 1993. In the
Policy, DOE agreed to pay the reasonable monthly cost of water for homes and businesses and, in
exchange, the land owners signed license agreements committing to cease using the groundwater via
rural water wells. Since that time, data indicate a shrinkage and/or shift of the plume(s) responsible
for the initial development of this policy.
In association with this assessment, a number of historical documents were received from DOE for
review. These documents provided investigative reports relating to the TCE and Tc-99
contamination of groundwater in and around the PGDP facility ranging from the early 1990s to
present. As is typical of environmental investigations over the past 30 years, there are continuous
improvements in methods of investigation and associated technology, as well as advancements of
the geosciences and biosciences involved in subsurface processes. These advancements hold
especially true regarding solvents like TCE. Over the years, the nature and extent of the PGDP TCE
and Tc-99 plumes have been extensively investigated. To do so, an increasing number of monitoring
wells have been installed and subsequently monitored both onsite and offsite between the PGDP
facility and the Tennessee Valley Authority (TVA) Shawnee Power Plant to the north.
The conclusions of ORAU’s review are that:
1. There are sufficient existing data in both quantity and quality to guide the decisions
regarding the water boundary.
2. There are sufficient existing data to develop the criteria for relocation of the boundary or
removal of properties from the Water Policy.

Paducah TCE 3 5194-TR-01-0
3. There are sufficient existing data to assess if any areas should be added to or removed from
the Water Policy.
These conclusions are based on an assessment of the historical documentation and on interviews
conducted with members of the DOE PGDP facility staff and personnel of Los Alamos Technical
Associates, Inc—Environmental Services of Kentucky, LLC (LATA) on August 13 and 14, 2012.
These discussions included historical reports of groundwater contaminated with TCE and Tc-99,
current understanding of subsurface conditions, and the professional qualifications of the geological
and engineering staff of those involved in recent investigations. Other topics included current plume
mapping, sampling results and methods, groundwater flow modeling and associated calibration, and
the current model of groundwater flow behavior in the general area of (and surrounding) the PGDP
facility. A site tour provided context of the rural locations of properties currently within the Water
Policy boundary.
The following sections of this report assess the history of the plumes’ delineations since their
discovery in 1988 and discuss the plumes’ likely locations in the foreseeable future. The methods of
assessment applied are presented in some detail in order to evaluate the historical behavior of the
TCE and Tc-99 plumes’ migration toward the north and northeast of the PGDP facility as the basis
for predicting their likely future behavior.
3. ASSESSMENT METHODS
In order to assess plume development and its likely migration in the future, three types of
information help characterize the subsurface and the groundwater system therein.
1. The geological and geophysical information available on the underlying structural
trends in the subject area, and of that obtained during the drilling of monitoring wells to
characterize the subsurface geological conditions, such as the type of sediment or rock unit,
and their thickness, permeability, porosity, and mineralogical content
2. The hydrogeological data consisting of water-level measurements obtained from
monitoring wells screened in the Regional Gravel Aquifer (RGA) and in the overlying units
used to generate potentiometric surface maps, which indicate the direction of groundwater
flow within the RGA and potential flow rate as snap-shots in time

Paducah TCE 4 5194-TR-01-0
3. The hydrochemical data for the dissolved constituents present in the groundwater;
these data are primarily obtained from groundwater monitoring wells in order to construct
plume maps at the particular time of sampling and for assessment of plume attenuation,
retardation, or other processes of constituent degradation.
3.1 GEOLOGICAL DATA
Based on the number of monitoring wells drilled and installed over the years of investigation (at
least 330) and associated reports, the site geology is well known on and around the PGDP facility.
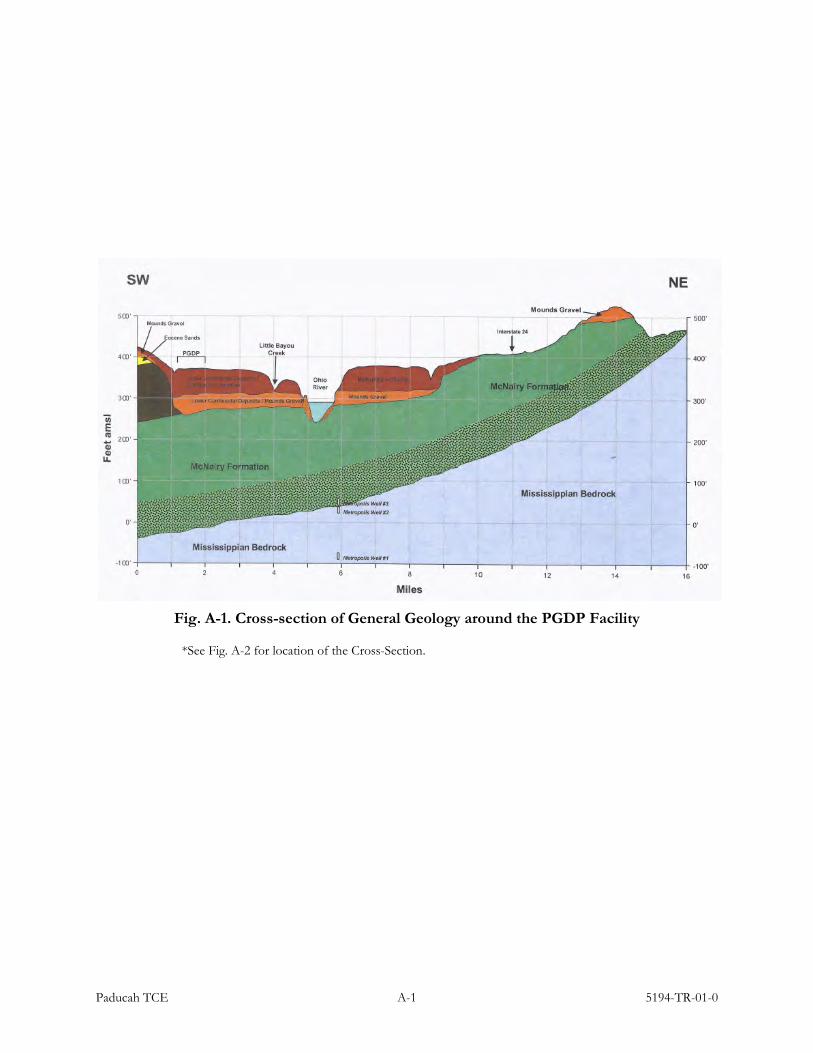
The general geology is illustrated in the cross-section presented as Fig. A-1. This illustrates that beds
of the Upper Continental Beds—consisting of alternating sands, silts, and clays of fluvial origin that
include braided-stream deposits—provide recharge to the underlying units and transmit the
contaminants to the underlying, semi-confined Lower Continental Beds (BJC 1997– 2005;
LATA 2011).
The underlying Lower Continental Beds are also of fluvial origin but consist primarily of relatively
coarse-grained sediments referred to as the Mounds Gravel Unit or RGA, which contains and
transmits the subject contaminants in co-mingled plumes of dissolved TCE and Tc-99. The RGA
flow rate has been reported to average from 1 foot to 3 feet/day. Some indications suggest that flow
rates can locally be as high as 6 feet/day within the southern TCE source areas of the PGDP facility
(Richards 2012). Historically, this provides more than adequate time for groundwater from the
PGDP facility to reach the Ohio River years before contaminants could arrive at the river. As a
general example, assuming an average horizontal groundwater flow rate of 2 feet/day within the
RGA, and discounting any retardation of flow of the subject contaminants, a slug of groundwater
introduced in the early 1980s outside the plume at the PGDP facility would not reach the Ohio
River until some 30 years later; i.e., groundwater that departed PGDP in 1981 would likely arrive at
the Ohio River in 2011. The contaminant plume would arrive a number of years later, but natural
attenuation and associated degradation of the TCE and Tc-99 plumes have been shrinking the
plumes for many years, to the extent that it is not likely that the plumes would have reached the
Ohio River. Even if the northernmost leading edge of the plumes reached the Little Bayou Creek via
springs or the Ohio River, early academic research conducted from 1999 to 2002 shows that the
contaminants are volatilized and/or diluted in the surface water well below detection limits, and

Paducah TCE 5 5194-TR-01-0
hence do not present continuing concerns regarding the surface water (Fryar, et al. 2000; Mukherjee,
et al. 2005; LaSage, et al. 2008a and b).
Recent preliminary academic work in the area on old geophysical seismic data suggests possible
deep, reactivated faulting in Mesozoic and Paleozoic rocks below the RGA. The faulting shows a
Northeast trend (Woolery 2012), which creates preferred pathways for both the Northwest and
Northeast Plumes in the RGA as the groundwater flow migrates toward the north and northeast
from the PGDP facility.
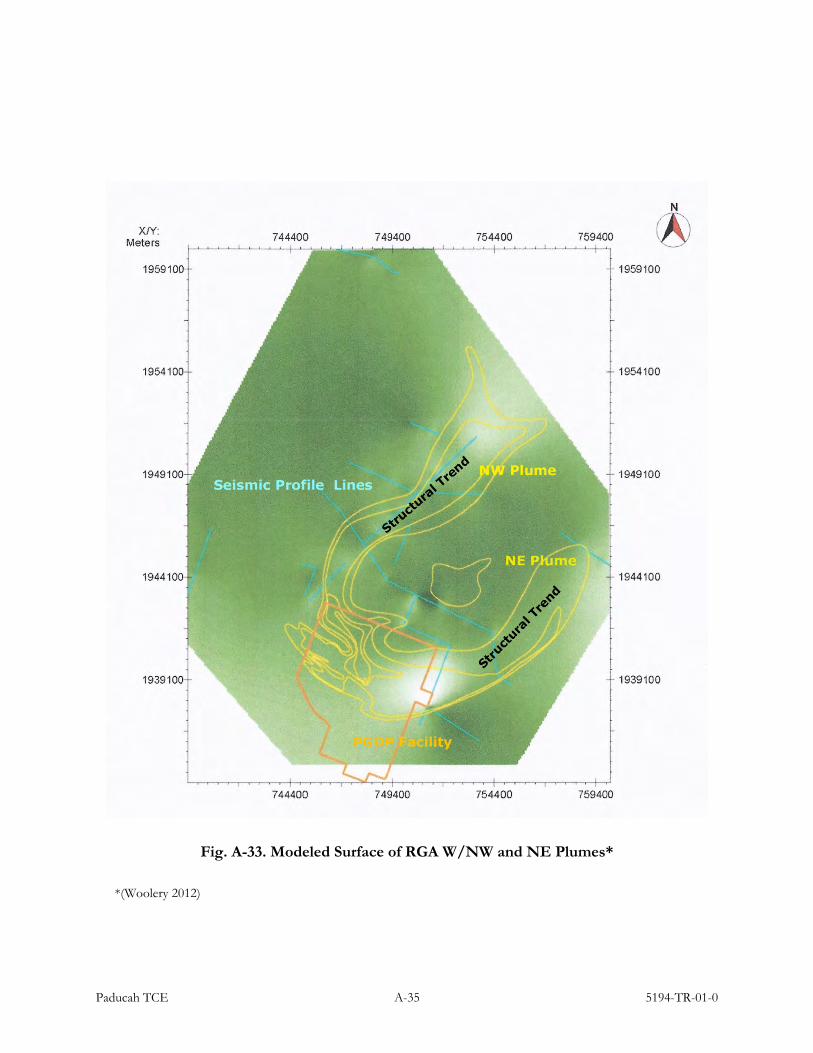
The general geographical locations of seismic sections used to generate elevations of the top of the
RGA are indicated in the map of Fig. A-33. This figure is a preliminary computer-generated model
of the available seismic data and therefore illustrates only relative elevations. The deeper elevations
of the top the RGA appear as light shades of green, while the more shallow elevations of the top of
the RGA appear as darker shades of green. The faulting extends upward from deep Paleozoic rocks
through the Cretaceous McNairy Formation to the Mounds Gravel (the RGA) of Tertiary age.
Further, field work in the area north of the PGDP facility to the Ohio River have found no
indications to date of liquefaction features (or other indications of surface sediment disruption) that
would suggest the area has been subjected to shallow sediment faulting or associated
depressurization of groundwater in confined sediments within or above the RGA. Taken together,
this suggests that the age of faulting was some time after the RGA sediments were deposited.
The impact of such faulting and associated disruption of the beds within the RGA would likely
increase the local permeability of the sediments in the disrupted zone(s) and redirect local
groundwater flow paths down the hydraulic gradient of the RGA along the structural trend
introduced by the faulting (see Fig. A-33). The flow-patterns of the Northwest and Northeast
Plumes are illustrated in Fig. A-33 as migrating along the two structural trends toward the northeast.
They provide the primary pathways for the two plumes.
If the overlying sediments of the Metropolis Formation were also affected by one or more faulting
events, this would likely permit leakage of groundwater flow in the deeper confined sections of the
Metropolis Formation and in the underlying confined sections of the upper RGA to reach the
surface as springs and streams along, and limited to, the preferred pathways at depth of disrupted

Paducah TCE 6 5194-TR-01-0
sediments along the structurally faulted trends where both the NW and NE Plumes now migrate in
the RGA. This is the likely explanation for the very low concentrations of the TCE sampled in
springs along the Little Bayou Creek (see Fig. A-1 where Little Bayou Creek has cut deeply into the
Metropolis Formation, almost reaching the RGA), as reported by Fryar, et al. 2000; Mukherjee, et al.
2005; and LaSage, et.al. 2008a and b.
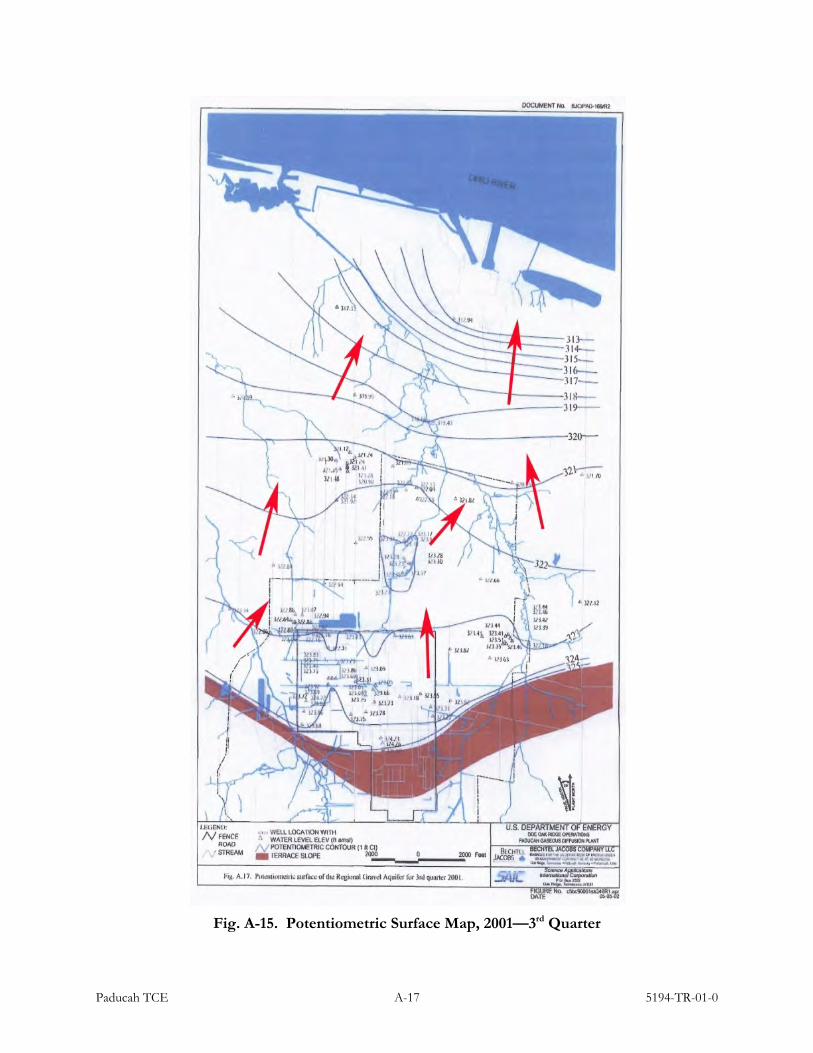
3.2 HYDROGEOLOGICAL DATA
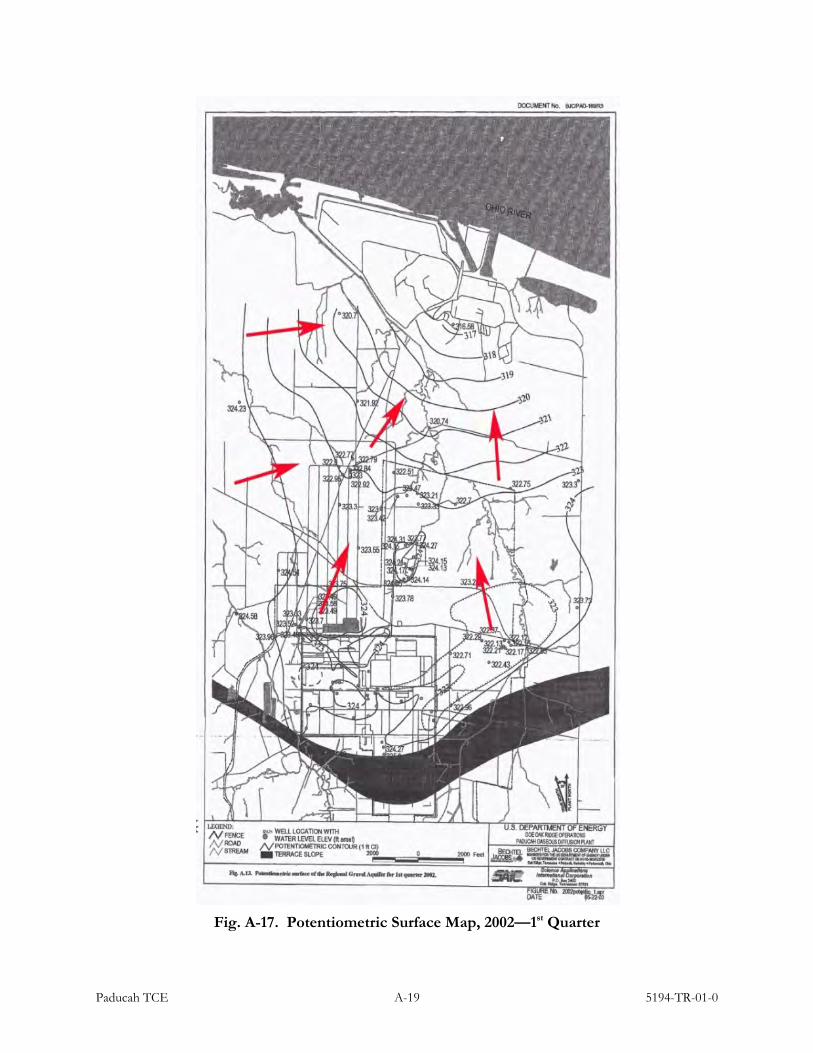
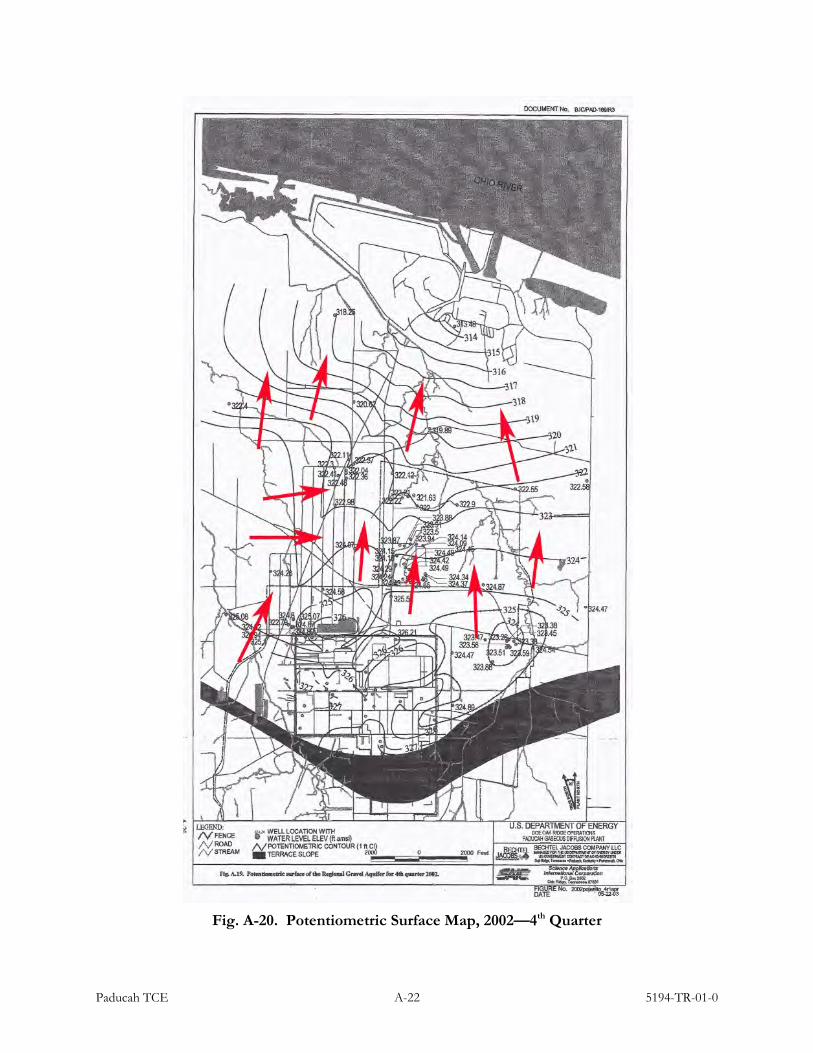
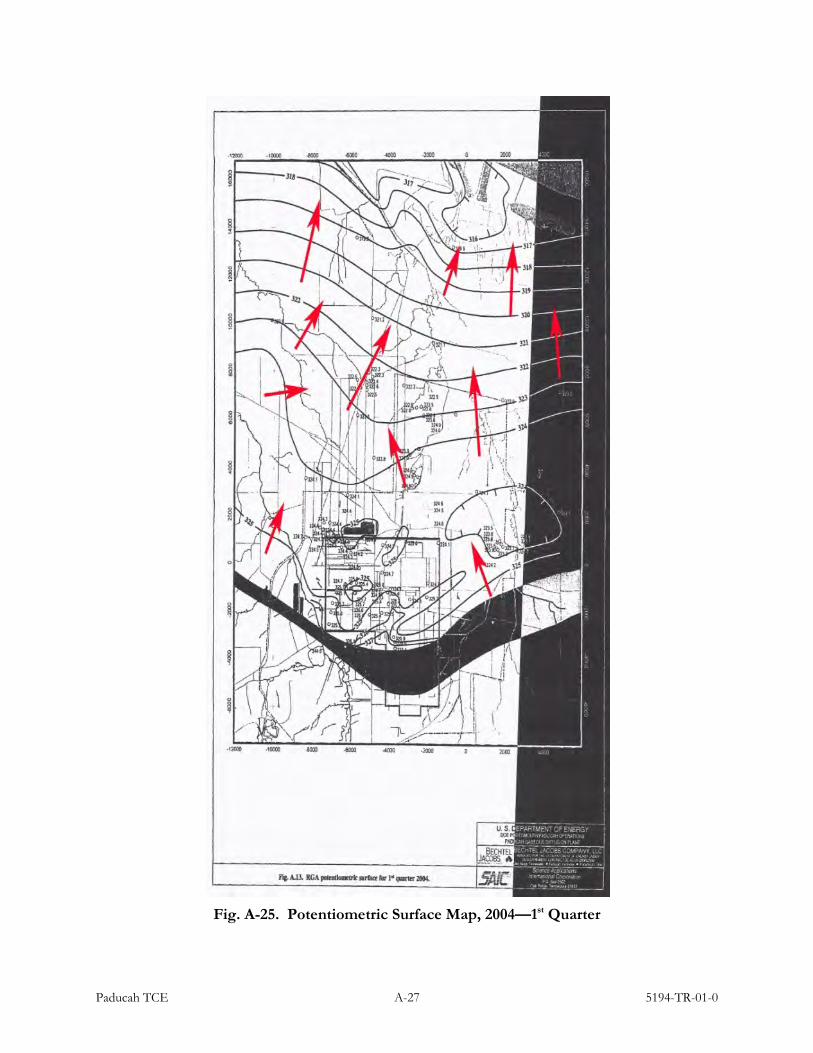
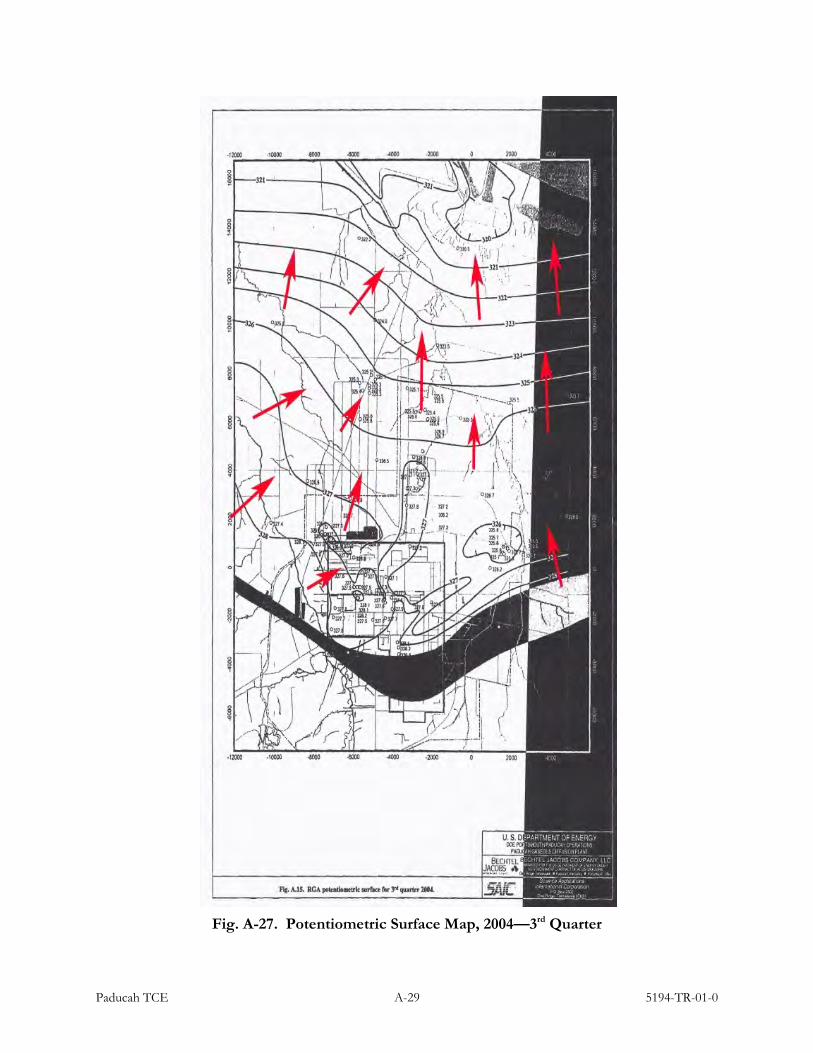
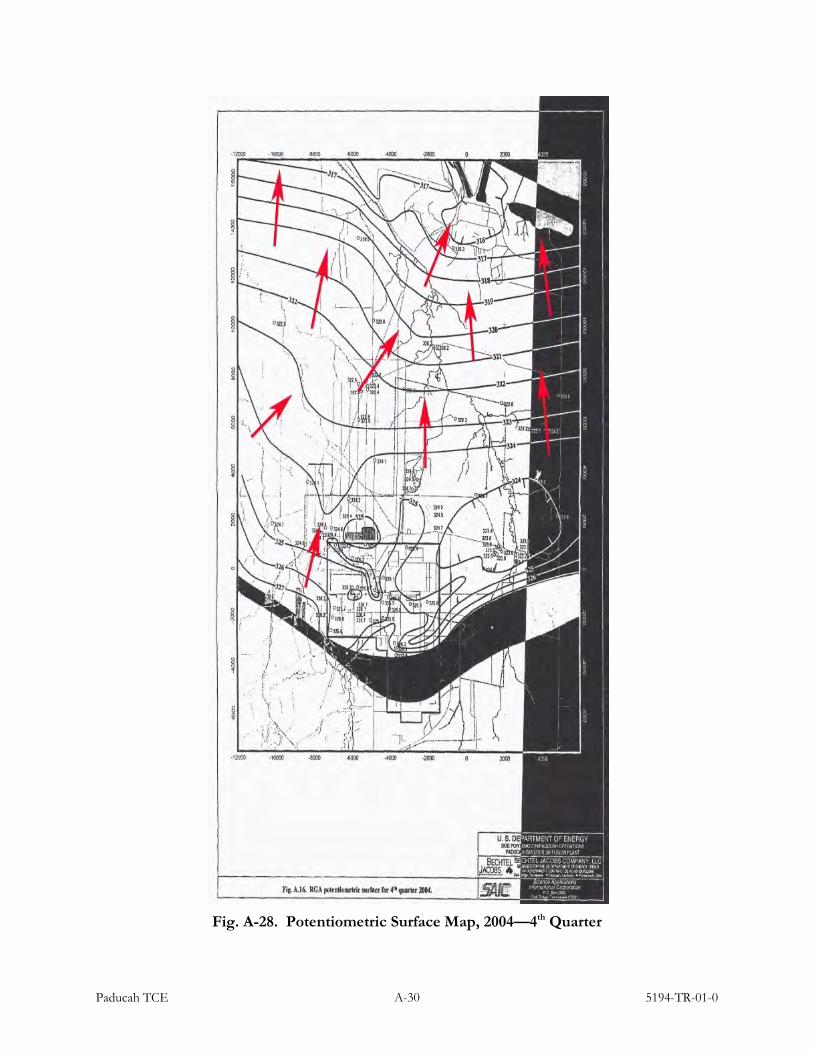
A series of quarterly potentiometric surface maps (also known as groundwater flow maps) from
various reports developed from 2001 through 2005 are assembled in Appendix A (Figs. A-13
through A-32). These maps show the impact of local precipitation and anthropogenic recharge from
various plant-site sources in the locally irregular configuration of the equipotential lines. Local,
shallow groundwater mounding of the water table in the near-surface sediments is to be expected
below such point-source recharge areas. Recharge migrates through the Upper Continental Beds to
the underlying RGA and such recharge is likely to require years, if not decades, to reach the RGA,
especially when flowing through fine-grained sediments. Once reaching the RGA, groundwater
flows at 90 degrees to the equipotential lines, which were constructed from water-level monitoring
data obtained from monitoring wells screened in the RGA as shown in Appendix A.
These maps also illustrate and confirm that groundwater within the RGA has not migrated from the
PGDP contaminant source areas toward the west or northwest. Rather, the migration is generally
from the west, south, and east toward the north and the Ohio River. Conditions prior to 2001 are
assumed to be similar on the basis that past meteorological conditions have not deviated to any
significant extent and hence natural recharge has been generally the same throughout the 1980s and
1990s. These maps show the prevailing hydraulic system that controls groundwater flow within the
structural trends, as discussed in Section 3.1.
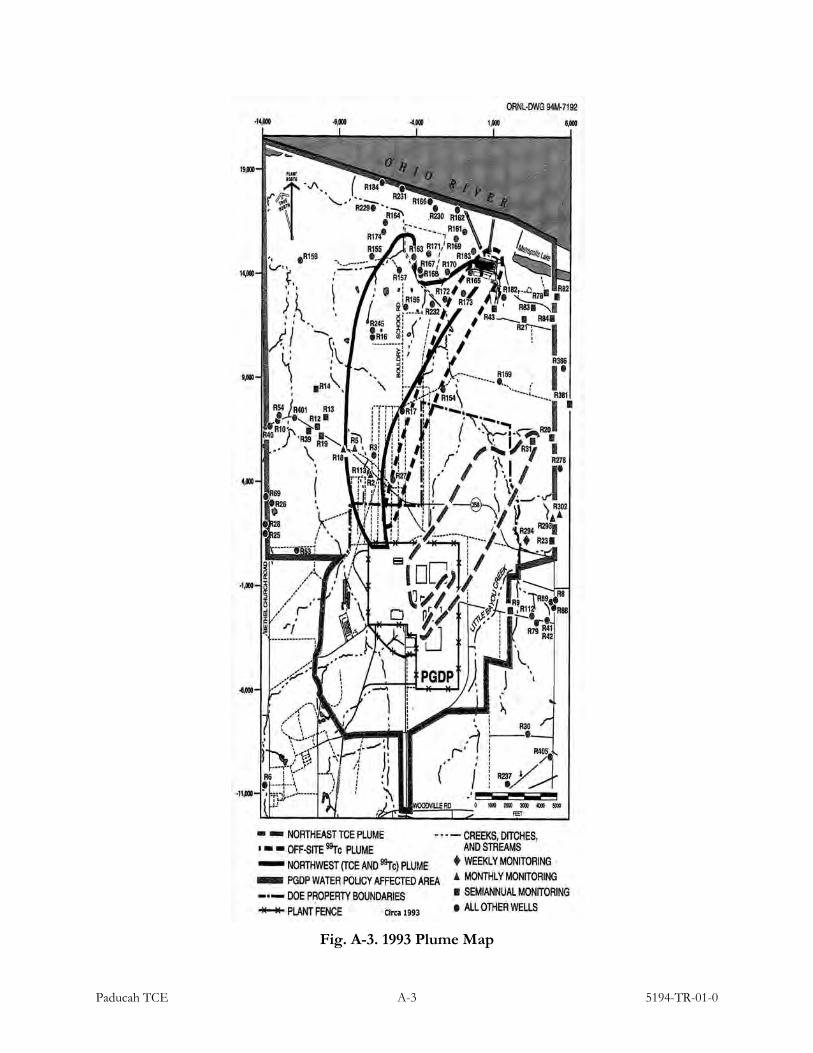
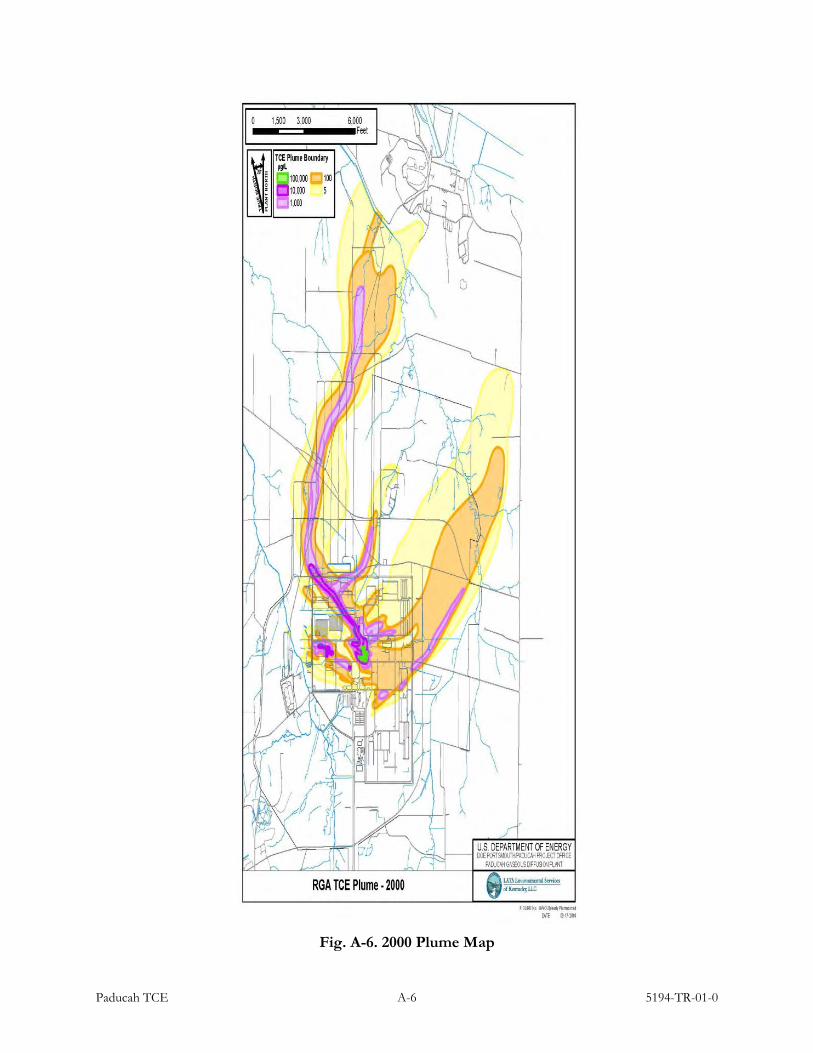
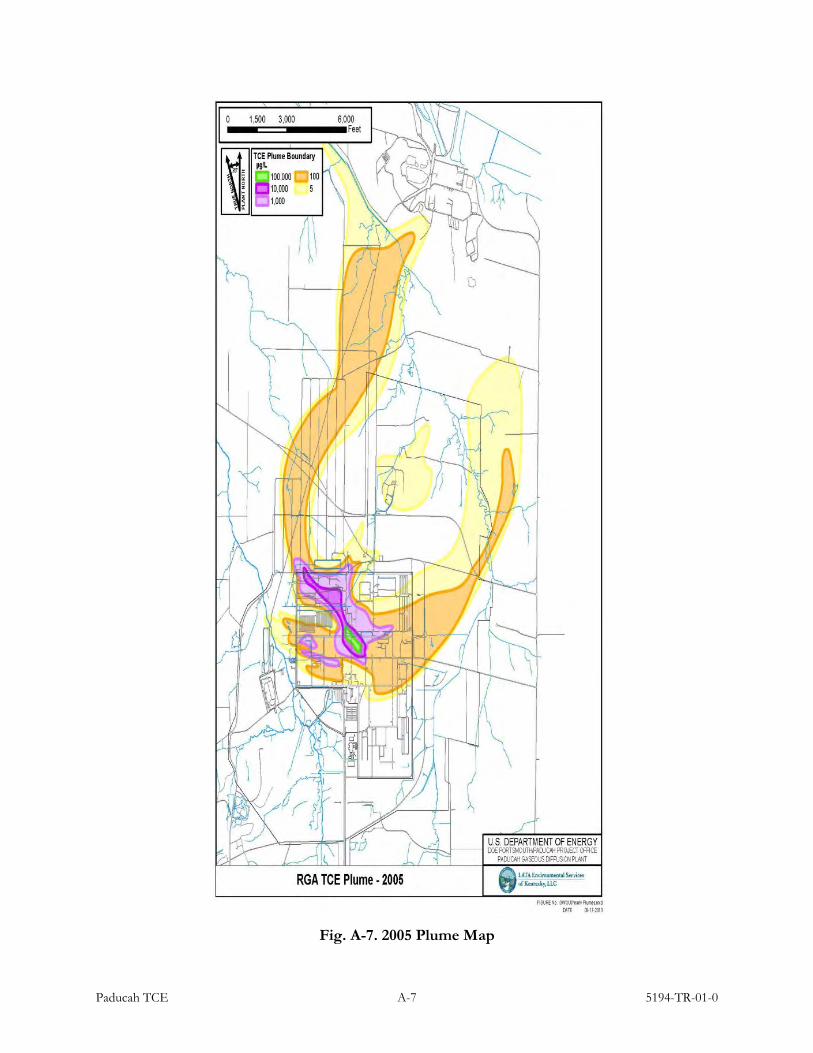
3.3 CONTAMINANT PLUME DEVELOPMENT
To develop an understanding of the conditions within and north of the PGDP facility, a series of
TCE and Tc-99 plume maps have been assembled from various reports issued from 1993 through
2010 (see Figs. A-3 through A-9B). These maps illustrate and confirm that the TCE and Tc-99
plumes have not migrated from the PGDP contaminant source areas toward the west or northwest

Paducah TCE 7 5194-TR-01-0
beyond the western boundary of the earliest 1993 plume. However, the western boundary of the
1993 plume map has very little basis or constraints and appears to have been only an approximation.
Only one residential well found to contain TCE during the initial sampling activities in the 1980s
remains within the Water Policy area. Specifically, this well remains within the Northwest Plume
boundary (see Residential Well designated R2 in Fig. A-9).
Site investigations began in the early 1990s and only a few monitoring wells had been installed prior
to that time. Selected rural water wells, located east of the Northeast Plume, were sampled by PGDP
personnel, some of which were found to contain TCE. Historically speaking, TCE was commonly
used as a degreasing agent by auto and truck repair shops, dry cleaners, and individuals.
One principal observation upon reviewing the series of plume maps is that historical plume
development is marked by shrinkage in the area of the inner high-concentration core boundary for
TCE and Tc-99 plumes. This fact appears evident based on a review of data from 2000 to 2011 and
is primary evidence for natural attenuation of the constituents involved. The occurrence of
attenuation is supported by Lee (2007), who suggests that aerobic cometabolic degradation is
occurring in the northwest plume at the PGDP. These results also suggest that aerobic
cometabolism may be contributing to the natural attenuation of TCE within this plume. Other
processes of attenuation may also be involved.
Based on the use of “oxygenase”-specific enzyme activity probes, Lee has concluded that the
bacteria present in the RGA are capable of aerobically biodegrading TCE. This work also suggests
that the distribution and number of bacteria are sufficient to significantly biodegrade the plumes
present in the plume core, inside the plume boundary, and outside the core in the surrounding
Northwest and Northeast Plumes north of the PGDP. Both Viswanathan (2007) and the Kentucky
Research Consortium for Energy and Environment team (KRCEE 2008) support the view that
degradation and attenuation are occurring within the PGDP plumes. However, Ormsbee (2007)
incorporates the impact of plume dispersion (lateral migration of contaminants) and illustrates the
“modeled extent” without attenuation and associated degradation. The historical behavior of the
plumes indicates that dispersion of the contaminants has not occurred to any significant extent
within the RGA. This is also confirmed by the presence of the structural trends along which both
the Northwest and Northeast Plumes have been migrating at a high rate of flow since the

Paducah TCE 8 5194-TR-01-0
contaminants’ flows have been tracked (see Fig. A-33 in context with the groundwater flow system
illustrated by the potentiometric surface maps). The decline of TCE along the western boundary is
shown by the insert plot of Fig. A-9A. The shift to the northeast is also apparent in Fig. A-9A and,
to some extent, in Fig. A-9B. The impact of the pump-and-treat TCE extraction systems
augmenting the natural attenuation of the TCE is apparent in both figures. The differences between
the 2007 and 2010 TCE concentrations confirm that attenuation and degradation of TCE are
occurring. Also, if the TCE source areas can be controlled by continuing remediation (including
pump-and-treat systems), the subject plumes of dissolved contaminants will likely continue to
degrade in lateral and downgradient extent and in concentration since the site is underlain by a
shallow aquifer of unusually high hydraulic conductivity (i.e., the RGA), which supports the removal
of large volumes of TCE and Tc-99 at their respective sources and the attenuation of the dissolved
plumes downgradient.
In the 2010 TCE plume configuration shown in Fig. A-9, only one residential well (R2) is within the
Northwest Plume boundary. One well (R294) is just east of the Northeast Plume boundary. Another
well, R20, would be considered “at risk,” assuming the plumes continue to migrate and shift in a
northeastern direction, as demonstrated by comparison of past and present plume maps.
3.4 CALIBRATED GROUNDWATER MODELING
The 2008 groundwater flow model was used to conduct the optimization of the Northwest Plume
extraction system using water-level targets from February, 1995. A need to recalibrate the flow
model was based upon: quarterly water-level surveys (beginning in late 2010), hydraulic performance
data from the optimized Northwest Plume extraction well system, and the requirement to optimize
the plume extraction system. The 25-year case involving reverse particle traces from residential wells
concur with the potentiometric surface maps in that although groundwater flow originates from near
the PGDP TCE source areas, the dissolved contaminants within the plume did not migrate further
west than the 1993 plume boundary. The marker particle trace shown in Figs. A-11A and A-12
confirms that although groundwater migrated along the indicated particle tracks, the TCE and Tc-99
plumes did not. This suggests that topography of the RGA’s base likely offers preferred paths to a
partly density-driven plume of TCE, with Tc-99 in some areas. The modeling results, shown in
Fig. A-11B, suggest the preferred paths for plume migration as is indicated by the closely spaced

Paducah TCE 9 5194-TR-01-0
particle traces. Preferred pathways within the RGA may also be influenced by the underlying
geological structural trends toward the northeast below the RGA in the area north of the PGDP
facility, as suggested by Woolery 2012. See Fig. A-33, and Section 3.1 for a discussion of the
associated modeling of the recently identified geological structural trends in the vicinity of the
PGDP facility.
4. CONCLUSIONS
Based on a review of available data, associated reports, maps, input from PGDP site personnel, and
independent research of the relevant technical literature, ORAU concludes that the TCE plume has
not expanded further than the western boundary of the 1993 plume and is not likely to do so in the
future. The boundaries of the plume were not well constrained in 1993 because only one confirmed
report was known of TCE in samples from a rural water well (R2) located within the Northwest
Plume. This suggests that the plume did not migrate west of this point. However, other outliers east
of the Northeast Plume can be traced to other causes and cannot be assumed to be associated with
PGDP activities.
Compelling evidence exists that plume attenuation processes have been operating within the core
concentrations and in the surrounding areas within the plumes during the history of plume
migration. The information provided in Figs. A-9, A-9A, A-9B, and associated reports provide a
sound basis for predicting likely future behaviors of both the TCE and Tc-99 plumes; it is expected
both plumes will continue to attenuate and degrade the associated products for decades to come.
This assumes that no new sources of TCE or Tc-99 are introduced or discovered within the
impacted areas. Figure A-12 illustrates a composite view of the TCE plume since 1991. The shift
and migration toward the northeast of the Northwest Plume is clearly evident. Behavior of the
plumes leading edge is illustrated by plume maps developed from 2000 through 2010. Figures A-9A
and A-9B illustrate the contraction and degradation of the interior core of the plume and of the
migration of the boundary toward the east.
Based on the technical information available to date, an adjustment of the Water Policy boundary is
justified on the basis of the historical behavior of the TCE Northwest Plume. The hydrogeological
and hydrochemical data show that groundwater flow from the PGDP facility is toward the Ohio

Paducah TCE 10 5194-TR-01-0
River and both TCE plumes (the Northwest and Northeast) are likely responding to preferred
structural trends within and below the RGA, thereby controlling the groundwater to flow down the
hydraulic gradient within the RGA toward the Ohio River. These subsurface conditions would likely
also allow upward leakage of groundwater flow from the deeper confined sections of the overlying
Metropolis Formation and from the underlying confined sections of the upper RGA. This leakage
would likely reach the surface as springs and streams along the preferred pathways from depths
where disrupted sediments occur within and along the structurally faulted trends within the RGA
where both the Northwest and Northeast Plumes now migrate. This is the likely explanation for the
very low concentrations of the TCE sampled in springs along the Little Bayou Creek originating
from the Northwest Plume in the RGA at depth. See Fig. A-1, where Little Bayou Creek has cut
deeply into the Metropolis Formation, almost reaching the RGA.
The westernmost groundwater flow path, which may have emanated from a historical contaminant
source area located in the southernmost part of the PGDP facility, has been highlighted in Fig. A-12
(dashed red line). The hydrogeological data (involved in constructing the potentiometric surface
maps), combined with the hydrochemical data (involved in constructing the historical TCE plume
maps), indicate that the TCE plume has been migrating and shifting toward the northeast since
records began to be accumulated in the early 1990s. These data also indicate that groundwater was
not known to migrate westward during the period of data collection since the early 2000s, and quite
likely well before records were available.
As indicated, the Water Policy boundary can be adjusted on the basis of the historical behavior of
the TCE plume boundary. A technically defensible boundary would be the apparent westernmost
boundary of the 1991 plume, as was known at that time. As indicated earlier in this report, there is
compelling evidence that the TCE plume is undergoing shrinkage due to attenuation and other
in-situ processes, and migrates in response to underlying geological structural trends. Hence, the
evidence supports the conclusion that the Northwest plume never posed a threat west of the
suggested boundary.
Based on the historical and modeled hydrogeological data reflecting past groundwater flow and
plume attenuation, along with the associated plume migrations toward the northeast, the
establishment of this new boundary along the westernmost margin of the earliest indication of the

Paducah TCE 11 5194-TR-01-0
TCE plume is proposed and justified on hydrogeological and geological grounds. Approximately
30% of the original northwest area would remain within the adjusted Water Policy area west and
northwest of the PGDP facility. This modification would release about 70% of the northwest area,
although individual properties overlap the suggested new boundary and would require boundary
registration.
Confirmatory groundwater sampling would be advisable to provide a protective measure of safety to
support the public interest prior to initiation of the boundary change; the wells involved should be
re-sampled every five years, or as appropriate, for similar reasons.
Paducah TCE 12 5194-TR-01-0
5. REFERENCES
BJC 1997. Comments on the Feasibility Evaluation for Trichloroethene-Contaminated Soil at SWMU 91. DOE/OR/06-1557&D2. Betchel Jacobs Company LLC. Paducah,
BJC 2001. Trichloroethene and Technetium-99 Groundwater Contamination in the Regional Gravel Aquifer for Calendar Year 2000 at the Paducah Gaseous Diffusion Plant, Paducah, Kentucky. BJC/PAD-169/R1; I-04600-0049-GRC01. Betchel Jacobs Company LLC. Paducah, Kentucky. April.
BJC 2002. Trichloroethene and Technetium-99 Groundwater Contamination in the Regional Gravel Aquifer for Calendar Year 2001 at the Paducah Gaseous Diffusion Plant, Paducah, Kentucky. BJC/PAD-169/R2; I-04600-0150-GRC01. Betchel Jacobs Company LLC. Paducah, Kentucky. June.
BJC 2003. Trichloroethene and Technetium-99 Groundwater Contamination in the Regional Gravel Aquifer for Calendar Year 2002 at the Paducah Gaseous Diffusion Plant Paducah, Kentucky. BJC/PAD-169/R3; I-04600-0284-GRC01. Betchel Jacobs Company LLC. Paducah, Kentucky. May.
BJC 2004. Trichloroethene and Technetium-99 Groundwater Contamination in the Regional Gravel Aquifer for Calendar Year 2003 at the Paducah Gaseous Diffusion Plant Paducah, Kentucky. BJC/PAD-169/R4; I-04600-0153-GRC01. Betchel Jacobs Company LLC. Paducah, Kentucky. May.
BJC 2005. Trichloroethene and Technetium-99 Groundwater Contamination in the Regional Gravel Aquifer for Calendar Year 2004 at the Paducah Gaseous Diffusion Plant Paducah, Kentucky. BJC/PAD-169/R5; I-04600-0650-GRC01. Betchel Jacobs Company LLC. Paducah, Kentucky. May.
DOE 1999c. Bench Scale In-Situ Chemical Oxidation Studies of Trichloroethene in Waste Area Grouping 6 at the Paducah Gaseous Diffusion Plant, Paducah, Kentucky. DOE/OR/07-1788&D1. U.S. Department of Energy. Paducah, Kentucky.
EPA 1994. Kentucky NPL/NPL Caliber Cleanup Site Summaries U.S. DOE Gaseous Diffusion Plant. EPA ID: KY8890008982. U.S. Environmental Protection Agency. Paducah, Kentucky. http://www.epa.gov/superfund/sites/nplfs/fs0404794.pdf.
EPA 2002. EPA Superfund Record of Decision: Paducah Gaseous Diffusion Plant (USDOE). EPA/ROD/R04-02-621; EPA ID: KY8890008982. U.S. Environmental Protection Agency. August.
Fryar, A.E., Wallin, E.J., and Brown, D.L. 2000, “Spatial and Temporal Variability in Seepage Between a Contaminated Aquifer and Tributaries to the Ohio River.” Ground Water Monitoring & Remediation, v. 20, no. 3, p. 129–146. http://dx.doi.org/10.1111/j.1745-6592.2000.tb00279.x.
ERWM 1993. “Information Bulletin, Paducah Gaseous Diffusion Plant.” Environmental Restoration and Waste Management – Kentucky. Vol 1, No. 2. December.
LaSage, D.M., Fryar, A.E., Mukherjee, A., Sturchio, N.C., and Heraty, L.J.,2008a. “Groundwater-derived Contaminant Fluxes along a Channelized Coastal Plain Stream.” Journal of Hydrology, v. 30, p. 265–280. http://dx.doi.org/10.1016/j.jhydrol.2008.07.026.
Paducah TCE 13 5194-TR-01-0
LaSage, D.M., Sexton, J.L., Mukherjee, A., Fryar, A.E., and Greb, S.F. 2008b. “Groundwater Discharge along a Channelized Coastal Plain Stream.” Journal of Hydrology, v. 30, p. 252–264. http://dx.doi.org/10.1016/j.jhydrol.2008.06.026.
LATA 2011. Trichloroethene and Technetium-99 Groundwater Contamination in the Regional Gravel Aquifer for Calendar Year 2010 at the Paducah Gaseous Diffusion Plant, Paducah, Kentucky. PAD/ENR/0130; ENV 4.D.4-00010-GRC01. Los Alamos Technical Associates, Inc—LATA Environmental Services of Kentucky. Kevil, Kentucky. August.
LATA 2011. Environmental Monitoring Plan Fiscal Year 2012 Paducah Gaseous Diffusion Plant, Paducah, Kentucky. PAD-ENM-0055/R1. Los Alamos Technical Associates, Inc—LATA Environmental Services of Kentucky. Kevil, Kentucky. November. 2012
LATA. Particle Trace Evaluation, Recalibrated Groundwater Model. Los Alamos Technical Associates, Inc—Lata Environmental Services of Kentucky. Kevil, Kentucky. April.
Lee, M. Hope 2007. “Application of Enzyme Activity Probes to Characterize Aerobic Microorganisms in Groundwater at PGDP, INL, & Elsewhere.” Proc. 2007 Scientific and Technical Symposium, October 30–31, University of Kentucky. p. 25. http://www.uky.edu/krcee/KRCEE%20 Presentations/6.%20New%20Technologies%20II/Application%20of%20Enzyme%20Hope%20Lee.pdf
KRCEE 2008. PGDP Trichloroethene Biodegradation Investigation Summary Report Regional Gravel Aquifer & Northwest Plume. P22.11 2008. Kentucky Research Consortium for Energy and Environment. November. http://www.uky.edu/krcee/Reports/ KRCEE%20Reports/KRCEE%2022.11.pdf
Mukherjee, A., Fryar, A.E., and LaSage, D.M. 2005. “Using Tracer Tests to Assess Natural Attenuation of Contaminants along a Channelized Coastal Plain Stream.” Environmental & Engineering Geoscience, v. 11, no. 4, p. 371–382, http://dx.doi.org/10.2113/11.4.371.
Ormsbee, L 2007. “PGDP Land Acquisition Study.” Proc. 2007 Scientific and Technical Symposium, October 30–31, University of Kentucky. p. 30. http://www.uky.edu/krcee/KRCEE%20Presentations/ 1.%20Data%20Management/Land%20Acquisition%20Study.pdf
PRS 2007. Trichloroethene and Technetium-99 Groundwater Contamination in the Regional Gravel Aquifer for Calendar Year 2004 at the Paducah Gaseous Diffusion Plant Paducah, Kentucky. PRS/PRO/0019; I-02100-0665-GRC01. Paducah Remediation Services. Kevil, Kentucky. May.
Richards, W. 2012. Personal Communication between Mr. Richards and Mr. Campbell by telephone on October 26, 2012 regarding reports he was aware that groundwater flow rates within the RGA can locally be as high as 6 feet/day within the southern TCE source areas of the PGDP facility, among other matters.
Viswanathan, C., Lingireddy, S., Ormsbee, L., and S. Hampson 2007. “PGDP Ground Water Model-Sensitivity Analyses.” Proc. 2007 Scientific and Technical Symposium, October 30–31, University of Kentucky. p. 27. http://www.uky.edu/krcee/KRCEE%20Presentations/7.%20GW%20 Modeling/KRCEE_SYMPOSIUM_Groundwater_presentation_skh_102507_short3.pdf

Paducah TCE 14 5194-TR-01-0
Woolery, E. W. 2012. Personal Communications between Dr. Woolery and Mr. Campbell regarding potential faulting and liquefaction in the area north of the PGDP facility held by telephone November 1, 2012, 1300 hrs. to 1340 hrs. and subsequently by e-mail.

Paducah TCE 5194-TR-01-0
APPENDIX A
FIGURES
Paducah TCE A-1 5194-TR-01-0
Fig. A-1. Cross-section of General Geology around the PGDP Facility
*See Fig. A-2 for location of the Cross-Section.

Paducah TCE A-2 5194-TR-01-0
Fig. A-2. Location of Cross-section of General Geology around the PGDP Facility
Paducah TCE A-3 5194-TR-01-0
Fig. A-3. 1993 Plume Map

Paducah TCE A-4 5194-TR-01-0
Fig. A-4. 1994 Plume Map

Paducah TCE A-5 5194-TR-01-0
Fig. A-5. 1996 Plume Map
Paducah TCE A-6 5194-TR-01-0
Fig. A-6. 2000 Plume Map
Paducah TCE A-7 5194-TR-01-0
Fig. A-7. 2005 Plume Map

Paducah TCE A-8 5194-TR-01-0
Fig. A-8. 2009 Plume Map

Paducah TCE A-9 5194-TR-01-0
Fig. A-9. 2010 Plume Map

Paducah TCE A-10 5194-TR-01-0
Fig. A-9A. Northwest Plume Map

Paducah TCE A-11 5194-TR-01-0
Fig. A-9B. Northeast Plume Map

Paducah TCE A-12 5194-TR-01-0
Fig. A-10. Water Policy Boundary and Monitoring Wells at Residential Sites in
Context with the TCE Plumes

Paducah TCE A-13 5194-TR-01-0
Fig. A-11A. Calibrated Groundwater Model—25 Year Basis
Fig. A-11B. Calibrated Groundwater Model—Forward Particle Traces

Paducah TCE A-14 5194-TR-01-0
Fig. A-12. TCE Plume Footprint: 1991–2010, Flow Path Boundary and Adjusted
Water Policy Boundary *Green = Properties currently within the Water Policy Boundary.

Paducah TCE A-15 5194-TR-01-0
Fig. A-13. Potentiometric Surface Map, 2001—1st Quarter

Paducah TCE A-16 5194-TR-01-0
Fig. A-14. Potentiometric Surface Map, 2001—2nd Quarter
Paducah TCE A-17 5194-TR-01-0
Fig. A-15. Potentiometric Surface Map, 2001—3rd Quarter

Paducah TCE A-18 5194-TR-01-0
Fig. A-16. Potentiometric Surface Map, 2001—4th Quarter
Paducah TCE A-19 5194-TR-01-0
Fig. A-17. Potentiometric Surface Map, 2002—1st Quarter

Paducah TCE A-20 5194-TR-01-0
Fig. A-18. Potentiometric Surface Map, 2002—2nd Quarter

Paducah TCE A-21 5194-TR-01-0
Fig. A-19. Potentiometric Surface Map, 2002—3rd Quarter
Paducah TCE A-22 5194-TR-01-0
Fig. A-20. Potentiometric Surface Map, 2002—4th Quarter

Paducah TCE A-23 5194-TR-01-0
Fig. A-21. Potentiometric Surface Map, 2003—1st Quarter

Paducah TCE A-24 5194-TR-01-0
Fig. A-22. Potentiometric Surface Map, 2003—2nd Quarter

Paducah TCE A-25 5194-TR-01-0
Fig. A-23. Potentiometric Surface Map, 2003—3rd Quarter

Paducah TCE A-26 5194-TR-01-0
Fig. A-24. Potentiometric Surface Map, 2003—4th Quarter
Paducah TCE A-27 5194-TR-01-0
Fig. A-25. Potentiometric Surface Map, 2004—1st Quarter

Paducah TCE A-28 5194-TR-01-0
Fig. A-26. Potentiometric Surface Map, 2004—2nd Quarter
Paducah TCE A-29 5194-TR-01-0
Fig. A-27. Potentiometric Surface Map, 2004—3rd Quarter
Paducah TCE A-30 5194-TR-01-0
Fig. A-28. Potentiometric Surface Map, 2004—4th Quarter

Paducah TCE A-31 5194-TR-01-0
Fig. A-29. Potentiometric Surface Map, 2005—1st Quarter

Paducah TCE A-32 5194-TR-01-0
Fig. A-30. Potentiometric Surface Map, 2005—2nd Quarter

Paducah TCE A-33 5194-TR-01-0
Fig. A-31. Potentiometric Surface Map, 2005—3rd Quarter

Paducah TCE A-34 5194-TR-01-0
Fig. A-32. Potentiometric Surface Map, 2005—4th Quarter
Paducah TCE A-35 5194-TR-01-0
Fig. A-33. Modeled Surface of RGA W/NW and NE Plumes*
*(Woolery 2012)
