about the asian development bank erd working paper series ... · this paper measures the impact of...
TRANSCRIPT
Economics and REsEaRch dEpaRtmEnt
Printed in the Philippines
has inflation hurt the poor?Regional analysis in the philippines
Hyun H. Son
May 2008
about the paper
Hyun H. Son measures the impact of price changes on poverty using the Philippines as an example, and develops an empirically operational price index called the price index for the poor, which indicates whether the price changes hurt the poor relatively more than the nonpoor.
Asian Development Bank6 ADB Avenue, Mandaluyong City1550 Metro Manila, Philippineswww.adb.org/economicsISSN: 1655-5252Publication Stock No.
about the asian development Bank
ADB’s vision is an Asia and Pacific region free of poverty. Its mission is to help its developing member countries substantially reduce poverty and improve the quality of life of their people. Despite the region’s many successes, it remains home to two thirds of the world’s poor. Nearly 1.7 billion people in the region live on $2 or less a day. ADB is committed to reducing poverty through inclusive economic growth, environmentally sustainable growth, and regional integration.
Based in Manila, ADB is owned by 67 members, including 48 from the region. Its main instruments for helping its developing member countries are policy dialogue, loans, equity investments, guarantees, grants, and technical assistance. In 2007, it approved $10.1 billion of loans, $673 million of grant projects, and technical assistance amounting to $243 million.
ERD WoRking PaPER SERiES no. 112

ERD Working Paper No. 112
Has InflatIon Hurt tHe Poor? regIonal analysIs In tHe PHIlIPPInes
Hyun H. son
May 2008
Hyun H. Son is Economist in the Economic Anlaysis and Operations Support Division of the Economics and Research Department, Asian Development Bank. The author thanks seminar participants at the ERD seminar series for comments and suggestions. In particular, she wants to acknowledge helpful comments by Ifzal Ali, William E. James, Rana Hasan, Shikha Jha, Eileen Capilit, Kaushal Joshi, Jackson Ubias, Sebastian Paust, and Nanak Kakwani. She also thanks the National Statistics Office of the Philippines for providing her with the detailed price data for the study.
Asian Development Bank6 ADB Avenue, Mandaluyong City1550 Metro Manila, Philippineswww.adb.org/economics
©2008 by Asian Development BankMay 2008ISSN 1655-5252
The views expressed in this paperare those of the author(s) and do notnecessarily reflect the views or policiesof the Asian Development Bank.
FoREWoRD
The ERD Working Paper Series is a forum for ongoing and recently completed research and policy studies undertaken in the Asian Development Bank or on its behalf. The Series is a quick-disseminating, informal publication meant to stimulate discussion and elicit feedback. Papers published under this Series could subsequently be revised for publication as articles in professional journals or chapters in books.

CoNtENts
I. Introduction 1
II. Impact of Price Changes on Average Standard of �ivingII. Impact of Price Changes on Average Standard of �iving 2
III. Regional Price Impact on Average Standard of �ivingIII. Regional Price Impact on Average Standard of �iving 4
I�. Impact of Price Changes on PovertyI�. Impact of Price Changes on Poverty 5
�. Regional Impact of Price Changes on Poverty�. Regional Impact of Price Changes on Poverty 7
�I. Price Index for the Poor�I. Price Index for the Poor 8
�II. Within and between Regional Inequality�II. Within and between Regional Inequality 9
�III. Empirical Illustration 1�III. Empirical Illustration 10
A. Data Source 1A. Data Source 10 B. Inflation Rates Faced by the Poor 11 C. Impact of Price Changes on Average Standard of �iving and Poverty 15
I�. Conclusions 2I�. Conclusions 22
Appendix Tables 23
References 3References 38

AbstRACt
This paper measures the impact of price changes on poverty using the Philippines as an example. The impact of price changes is captured by the price elasticity of poverty for three widely used poverty measures, namely, headcount ratio, poverty gap ratio, and severity of poverty. An empirically operational price index called the price index for the poor is developed, which indicates whether the price changes hurt the poor relatively more than the nonpoor. Furthermore, the paper develops formulae for aggregating regional price indices into the national price indices. The results show that since 2003, prices increases have led to greater suffering for the poor, particularly the ultra poor.

I. INtRoDuCtIoN
A recent wave of global food price inflation has pushed millions of people into poverty. Many people who were poor before these price increases may now be on the verge of hunger and malnutrition. In view of this development, the standard measures of inflation may have now become irrelevant because they do not take into account the consumption patterns of the poor.
Standard measures of inflation are calculated based on an average consumption basket. However, there is a significant variation in the consumption basket across the population, including by income level (Arrow 1958). This consumption basket consists of different commodities with different prices (i.e., the prices of different commodities change at different rates). Consequently, the impact of changes in prices on the poor will be different from that of the rich. If food prices go up at a faster rate than nonfood prices, this will hit the poor harder than the rich. This is because a higher proportion of the poor’s consumption basket is devoted to necessary goods and services such as food items. It is thus highly relevant for policymakers to identify the impact of relative prices changes on different segments of the population. This paper intends to address this issue using the Philippines as a case study.
The main objective of this paper is to define a measure that will systematically capture the impact of prices on poverty. Poverty can be measured by several indices. The most common among them are the class of Foster, Greer, and Thorbecke (FGT) poverty measures (Foster, Greer, and Thorbecke 1984). Every poverty measure gives different weights to the poor depending on how far below the poverty line they are. Therefore, the impact of prices on poverty will differ depending on what poverty measure is used. This paper develops a methodology to measure the impact of prices on poverty based on three most popular measures of poverty: headcount ratio, poverty gap, and severity of poverty.
In practice, the inflation rate is officially estimated based on the �aspeyres price index, which uses the average budget shares of goods in the consumer’s basket as weights. However, this index is completely insensitive to the distributional impact of price changes. Hence, to understand the impact of price changes on poverty, an alternative price index using weights that reflect the consumption patterns of the poor is needed. This paper derives a new price index for the poor (PIP) where the weights used are derived from the price elasticity of poverty. Thus, there will be a monotonic relationship between the PIP and the changes in poverty, implying that the higher the index is, the greater the increase in poverty.1 The PIP will be useful in assessing whether price changes hurt the poor relatively more (or less) than the nonpoor when measured against the commonly used �aspeyres price index.
Furthermore, this paper develops formulae for aggregating regional price indices into the national price indices. The formulae help derive national price indices that are consistent with the
1 It is possible to construct weights from the budget shares of the poor but this will be an ad hoc procedure because it does not have any relation to poverty measures. The main contribution of this paper is to determine weights that have a monotonic relationship with the chosen poverty measure.
2 May 2008
Has InflatIon Hurt tHe Poor? regIonal analysIs In tHe PHIlIPPInesHyun H. son
regional price indices. Thus, the national price indices presented for the Philippines are derived from the regional price indices. Such formulae are useful in identifying the regional contributions of price changes to the national inflation rate.
The remainder of the paper is structured as follows. Sections II—�II are devoted to the methodology to define and derive the impact of price changes on average standard of living as well as on poverty. The methodologies related to the new price index for the poor are also presented. Section �III presents the analysis of the empirical results. The final section offers some concluding remarks.
II. ImPACt oF PRICE ChANgEs oN AvERAgE stANDARD oF LIvINg2
Assume there are n items of consumption and x is the per capita total expenditure of a household. Further consider that if vi(x) is the per capita expenditure on the ith commodity of a household with per capita total expenditure equal to x, then
x v xii
n
= ( )=∑
1 (1)
The per capita expenditure x can also be written as an expenditure function e(u, p):
x = e(u, p) (2)
where p is the price vector. The expenditure function is the minimum expenditure needed to enjoy u level of utility given the price vector p. Suppose p increases to p*, then the consumer needs to be compensated so that he/she enjoys the same level of utility that he/she enjoyed before the price increase. This gives the change in real per capita expenditure as3
∆x e u e u= − ( ) − ( ) , ,*p p (3)
Using Taylor expansion on equation (3) gives
dxep
p pi
i ii
n
= − ∂∂
−=∑ ( )*
1 (4)
where the terms of higher order smallness have been dropped. Dropping these terms implies that we are assuming there is no substitution due to changes in relative prices. Thus, equation (4) gives the price elasticity of standard of living of an individual with income x:
px
xp
x
xi
i
i∂∂
= −( )ν
(5)
which shows that if the price of the ith commodity increases by 1%, the real standard of living of
a household with per capita expenditure x will reduce by v xx
i ( ) %.
2 The average standard of living is referred to as per capita real expenditure throughout the paper.3 This measures the price impact based on Hicks’ (1946) compensation variation.
sectIon IIIMPact of PrIce cHanges on average standard of lIvIng
erd WorkIng PaPer serIes no. 112 �
The average per capita expenditure of the whole population is given by
µ =∝
∫ xf x dx( )0 (6)
where f(x) is the density function of x.
Differentiating equation (6) with respect to pi and utilizing equation (5), the price elasticity of the average standard of living is obtained as
pp
wi
i
iiµ
µ µµ
∂∂
= − = − (7)
where µi is the average expenditure of the ith commodity of the whole population and wi is the average budget share of the ith commodity. This equation tells us that if the price of the ith commodity increases by 1%, the average per capita real expenditure of the whole population will decrease by wi percent. In other words, any increase in price leads to a reduction in average standard of living, where the magnitude of reduction is equal to the average budget share of the commodity.
The prices of different commodities do not change at a uniform rate. The prices of some commodities may increase while that of others may decrease. The changes in prices of different commodities have different impacts on the average standard of living. To determine the impact of or how much changes in prices have affected the average standard of living, we derive the formula in equation (8) below.
Suppose µ is the average standard of living when the base year price vector is p. Suppose p changes to p* and the average standard of living changes to µ*, then applying Taylor expansion and omitting the terms of higher order smallness, the proportional change in the real standard of living due to price changes is obtained as:
µ µµ
µµ
* **( )
( )− = − ∂
∂= − −
==∑∑ p p
p pp
p wi i
i i
ii i
i
n
i
n
111 (8)
where all prices have been normalized with respect to base year prices set equal to 100. In the derivation of equation (8), the result in equation (7) is applied. From equation (8), one can see that if all prices increase by r percent, i.e., p ri
* ( )= +1 , the average standard of living will decrease by r percent. − −( )*p wi i1 is the contribution of the ith price change on the average standard of living.
The most widely used price index is the �aspeyres price index, where base year prices normalized to 100 can be defined as
L p wi ii
n
==∑ *
1 (9)
which from equation (8) is related to the proportional change in the average standard of living:
µ µµ
*
( )− = − −L 1
(10)
� May 2008
Has InflatIon Hurt tHe Poor? regIonal analysIs In tHe PHIlIPPInesHyun H. son
This equation shows that there is a one-to-one relationship between changes in average standard of living and the �aspeyres price index: the larger the L is, the greater is the reduction in the average standard of living. The average standard of living has decreased (increased) over time when the calculated value of L is greater (less) than 1.
III. REgIoNAL PRICE ImPACt oN AvERAgE stANDARD oF LIvINg
Suppose a country is divided into k mutually exclusive regions. Since regional prices do not change by the same proportion, the impact of regional prices changes on the average standard of living will be different. This section derives the formulae that capture the impact of regional prices changes on the national average standard of living.
The average standard of living in a country is related to the average standard of living in its regions as:
µ µ==
∑ aj jj
k
1 (11)
where µj is the average standard of living in the jth region and αi is the population share of the jth region. Suppose pij is the price of the ith commodity in the jth region at base period. Suppose further that this price changes to pij
* , which will impact the average standard of living in the jth region. Assume that the average standard of living in the jth region changes to µ j
* , then from equation (8):
µ µµ
µµ
j j
j
ij ij
ij
j
ij
ij
jij ij
i
n
i
n p p
p p
pp w
* **( )
( )−
=− ∂
∂= − −
==∑∑ 1
11 (12)
where all regional prices have been normalized with respect to base year prices set equal to 100 and wij is the ith budget share in the jth region. Substituting equation (12) into (11) gives the proportional change in the national standard of living due to changes in regional prices:
µ µµ µ
µµ µ
µ µµ
* **− =
−
= − −( )= =
∑ ∑1 11
1 1
a a p wj jj
kj j
jj j ij ij
j
k
i==∑
1
n
(13)
Given the average budget shares for each region, the national budget share can be calculated as
w a wi j j ijj
k
==
∑1
1µµ
(14)
The national budget share is the weighted average of the regional budget shares with weights proportional to the regional shares of the total expenditure. Similarly, national prices of different commodities is defined as
p
a w p
a wi
j j ij ijj
k
j j ijj
k*
*
= =
=
∑
∑
µ
µ
1
1 (15)
sectIon IvIMPact of PrIce cHanges on Poverty
erd WorkIng PaPer serIes no. 112 �
which shows that the national prices of different commodities are the weighted average of the regional prices.
Using equations (14) and (15) into (13) gives the proportional change in the average standard of living as
µ µµ
**( )
− = − −=∑ p wi ii
n
11 (16)
where − −( )*p wi i1 is the contribution of the ith commodity to the proportional change in the national standard of living. It can be seen that if the ith commodity national price increases by 1%, the national average standard of living will decline by wi %.
Using equation (10), the �aspeyres index for the jth region can be rewritten as
Ljj j
j
= −−
1µ µ
µ
*
(17)
and the national �aspeyres index as
L = − −1
µ µµ
*
(18)
Combining equations (17) and (18) with (13),
L a Lj j jj
k
==
∑1
1µµ
(19)
which shows that the national �aspeyres index is the weighted average of the regional �aspeyres indices with weights proportional to the regions’ shares in total expenditure. a Lj j jµ
µ is the contribution
of the jth region to the national �aspeyres price index.
Iv. ImPACt oF PRICE ChANgEs oN PovERty
To measure the impact of prices changes on poverty, the specific measure of poverty must be chosen. There exist several poverty measures in the literature. Different poverty measures imply different value judgment. The choice of a measure depends on policymakers’ value judgment. Instead of making the judgment ourselves in choosing a poverty measure, the three most widely used poverty measures are used in this study, namely, headcount ratio (H), poverty gap ratio (g), and severity of poverty (s), which are respectively defined as:
H f x dx F zz
= ( ) = ( )∫0 (20)
gz x
zf x dx
z
= −
( )∫0 (21)
� May 2008
Has InflatIon Hurt tHe Poor? regIonal analysIs In tHe PHIlIPPInesHyun H. son
sz x
zf x dx
z
= −
( )∫2
0 (22)
where f(x) is the density function of income x and F(z) is the probability distribution function at the income level equal to the poverty line z.
The impact of price changes on poverty is captured by the price elasticity of poverty. Son and Kakwani (2008) have derived the price elasticity of poverty for an entire class of additive separable poverty measures, of which headcount ratio, poverty gap ratio, and severity of poverty are included. Using their general results, the poverty elasticity of these three measures were derived with respect to the price of the ith commodity as
ηHii
i iHp
pH
zf z w z
H= ∂
∂=
( ) ( ) (23)
ηgii
ii
zgp
pg g
xz
w x f x dx= ∂∂
=
( ) ( )∫1
0 (24)
ηsii
ii
zsp
ps s
xz
z xz
w x f x dx= ∂∂
=
−
( ) ( )∫2
0 (25)
As shown in Section II, an increase in the price of a commodity decreases the standard of living of everyone in society, which increases poverty. The magnitude of the increase in poverty depends on the price elasticity. For convenience, let us denote θ as any of the three poverty measures, with its elasticity with respect to pi given by ηθi . If the price of the ith commodity increases by 1%, then poverty measured by θ will increase by ηθi percent. If all prices increase by 1%, then θ will increase by ηθ percent, where ηθ is given by
η ηθ θ==∑ ii
n
1 (26)
Equation (26) is the total poverty elasticity, where n is the total number of commodities.
Suppose θ is the poverty measure when the price vector is p. Suppose further that p changes to p* and the poverty measure θ changes to θ*. Applying the Taylor expansion and omitting the terms of higher order smallness, the proportional change in poverty due to price changes is:
θ θθ
θθ
ηθ
* **( )
( )− = − ∂
∂= −
==∑∑ p p
p pp
pi i
i i
ii i
i
n
i
n
111 (27)
As before, all prices have been normalized with respect to base year prices, which is equal to 100. From (27), one can see that if all prices increase by r percent, i.e., p ri
* ( )= +1 , the poverty measure θ will increase by rηθ percent, where ηθ is the total poverty elasticity defined in (26). ( )*pi i− 1 ηθ is the contribution of the ith price change on the proportional change in poverty measured by θ.
sectIon vregIonal IMPact of PrIce cHanges on Poverty
erd WorkIng PaPer serIes no. 112 �
v. REgIoNAL ImPACt oF PRICE ChANgEs oN PovERty
Again, suppose a country is divided into k mutually exclusive regions. Since regional prices do not change by the same proportion, the impact of regional prices changes on poverty will also be different. This section derives the formulae that capture the impact of regional price changes on different poverty measures.
The three poverty measures used are additive and decomposable. With such property, the national poverty measure θ can be rewritten as the weighted average of regional poverty measures denoted as:
θ θ==
∑ aj jj
k
1 (28)
where θj is the poverty measure in the jth region and aj is the population share of the jth region. Suppose pij is the price of the ith commodity in the jth region in the base period and suppose this price changes to pij
* , which will have an impact on the poverty measure in the jth region. Consider that the poverty measure θj in the jth region changes to θ j
* , then from equation (27):
θ θθ
θθ
ηθj j
j
ij ij
ij
j
ij
ij
jij ij
i
n
i
n p p
p p
pp
* **( )
( )−
=− ∂
∂= −
==∑∑ 1
11 (29)
where all regional prices have been normalized with respect to base year prices set to 100 and ηθij is the ith price elasticity of poverty in the jth region. Substituting equation (29) into (28) gives the proportional change in the national poverty due to changes in regional prices:
θ θθ θ
θθ θ
θ θθ ηθ
* **− =
−
= −( )= =
∑ ∑1 11
1 1
a a pj jj
kj j
jj j ij ij
j
k
i==∑
1
n
(30)
Given the poverty elasticity of each region and using equation (28), national poverty elasticity can be calculated as
ηθ
θ ηθ θi j j ijj
k
a==
∑1
1 (31)
The national poverty elasticity is the weighted average of the regional poverty elasticities with weights proportional to the regional shares of poverty. Similarly, national prices of different commodities can be defined as
p
a p
ai
j j ij ijj
k
j j ijj
k*
*
= =
=
∑
∑
θ η
θ η
θ
θ
1
1 (32)
which shows that the national prices of different commodities are the weighted averages of regional prices of different commodities. Note that these national prices for various commodities will be different for each of the poverty measures.
� May 2008
Has InflatIon Hurt tHe Poor? regIonal analysIs In tHe PHIlIPPInesHyun H. son
Substituting equations (31) and (32) into (30) gives the proportional change in national poverty as
θ θθ
ηθ
**( )
− = −=∑ pi ii
n
11 (33)
where ( )* pi i− 1 ηθ is the contribution of the ith commodity to the proportional change in the national poverty. It can be seen that if the ith commodity national price increases by 1%, the national poverty will increase by ηθ i %.
vI. PRICE INDEx FoR thE PooR
Section II has demonstrated that the �aspeyres price index has a one-to-one relationship with the change in the average standard of living. This index is completely insensitive to how the changes in prices affect the poor. Son and Kakwani (2008) have derived a price index for the poor that has a one-to-one relationship with a poverty measure. The PIP can be derived for any poverty measure.
Assume a counterfactual situation where all prices change by the same proportion i.e., p pi i* = λ .
Then λ may be called as the price index for the poor if it gives the same change in the poverty measure θ, given that the price vector changes from p to p*. If all prices have been normalized with respect to base year prices set to 100, then pi
* = λ for all i, which by substituting in equation (27) gives
λη
ηθ
θ==∑1
1
pii
n
i*
(34)
where ηθ is the total poverty elasticity defined in (26). λ is the PIP. It is a weighted average of price indices of each commodity. Weights implied by this index are the poverty weights implicit in poverty measures. Different poverty measures imply different PIPs.
The relationship between the PIP and the proportional poverty reduction can be obtained from equations (27) and (34) as
θ θθ
λ ηθ
*
( )− = − 1
(35)
which in view of the fact that ηθ >0, shows that there is a one-to-one relationship between the proportional change in poverty and the PIP. To further explain, the larger the λ is, the greater is the increase in poverty. Poverty increased (decreased) over time when λ is greater (less) than 1.
A price increase in any commodity has two effects. One is that it reduces people’s real income, which leads to an increase in poverty. The other effect is related to changes in the distribution of income. As price changes affect individuals differently depending on their income, the changes in prices can either increase or decrease income inequality. The �aspeyres price index is responsive to changes in average standard of living but completely insensitive to changes in inequality. Conversely, the PIP is sensitive to changes in income distribution. Son and Kakwani (2008) have shown that the two indices are related as

sectIon vIIWItHIn and betWeen regIonal InequalIty
erd WorkIng PaPer serIes no. 112 �
λη
η ηθ
θ θ= + −=∑L p wi i ii
n1
1
*( ) (36)
The second term in the right hand side of this equation reveals whether the changes in prices increase or decrease income inequality. If the second term is positive (negative), then it implies that changes in prices increase (decrease) income inequality, i.e., changes in prices are inequality increasing (decreasing) if λ is less (greater) than L.
vII. WIthIN AND bEtWEEN REgIoNAL INEquALIty
Using equation (34), the PIP for the jth region can be written as
λη
ηθ
θjj
iji
n
ijp==∑1
1
*
(37)
where
η ηθ θj iji
n
==∑
1 is the total poverty elasticity of the jth region.
Similarly, the national price index of the poor can be given by
λη
ηθ
θ==∑1
1
pi ii
n*
(38)
where
η ηθ θ==∑ ii
n
1 is the national total poverty elasticity.
Substituting equations (31) and (32) into equation (38) and utilizing equation (37) gives
λθ η λ
θ η
θ
θ
= =
=
∑
∑
a
a
j j j jj
k
j j jj
k1
1 (39)
which shows that the national PIP is the weighted average of the regional PIPs and
a
a
j j j j
j j jj
k
θ η λ
θ η
θ
θ=
∑1
is the contribution of the jth region to the national PIP.
Combining equations (19) and (39) gives
λθ η λ
θ η
θ ηθ
θ
θ
− =−
+−
=
=
=∑
∑
∑L
a L
a
a L L
a
j j j j jj
k
j j jj
k
j j j jj
k
( ) ( )1
1
1
jj j jj
k
θ ηθ=
∑1 (40)
10 May 2008
Has InflatIon Hurt tHe Poor? regIonal analysIs In tHe PHIlIPPInesHyun H. son
The left hand side of this equation reveals how much changes in prices have affected the national income inequality. This impact is the sum of two components given in the right hand of this equation. The first component is the impact of price changes on the inequality within the region while the second component is the impact of price changes on the inequality between regions.
The impact of price changes in the jth region is captured by ( )λ j jL− and the first term in the right hand side of equation (40) is the weighted average of inequality impacts within each regions. Similarly, ( )L Lj − captures the deprivation of the jth region relative to the national deprivation caused by price changes in different regions. The second term in the right hand side of equation (40) is the weighted average of the relative deprivations suffered by different regions.
vIII. EmPIRICAL ILLustRAtIoN
A. Data source
The empirical illustration is largely based on the 2003 and 2006 Family Income and Expenditure Surveys (FIES) covering almost 40,000 households throughout the Philippines. The survey provides detailed household incomes and consumption expenditures. Unit record data were used to calculate the poverty weights. The poverty lines used for the study are developed by Balisacan (1999).
Monthly price data were obtained from the Philippine National Statistical Office (NSO). These data were collected for 17 regions over the period from January 2000 to March 2008. These regions are the National Capital Region (NCR), Cordillera Administrative Region (CAR), Ilocos, Cagayan �alley, Central �uzon, Calabarzon, Mimaropa, Bicol, Western �isayas, Central �isayas, Eastern �isayas, Zamboanga Peninsula, Northern Mindanao, Davao, Soccsksargen, Caraga, and Autonomous Region in Muslim Mindanao (ARMM).
For each of the 17 regions, the price data provided by the NSO contain detailed monthly prices for 29 commodity groups of household consumption including nine food and 20 nonfood commodity groups that represent wide ranges of goods and services consumed by the population. The next step was to match the price data with the household survey for the 29 commodity groups. As a result, 27 commodity groups were matched, of which nine groups represent food and 18 groups are nonfood.
The study used monthly price data available from January 2000 to March 2008. The impact of prices on the average standard of living, poverty, and inequality were analyzed over this period. As mentioned, the analysis started at the regional level to derive the national estimates for the Philippines. Since detailed information on disaggregated commodities is available for only one period from the household survey, substitution bias could not be considered, as this will require detailed household surveys for at least two periods. Nevertheless, the objective of this study to measure the impact of price changes on poverty would not be undermined since the magnitude of substitution bias will be small for the poor. The poor do not enjoy the luxury of substituting one commodity for another. They spend a large proportion of their incomes on necessities. Moreover, almost all countries in the world base their price indices using a fixed basket corresponding to the base period suggesting that in practice, the substitution bias is not factored in. Furthermore, the main purpose of the current study is to demonstrate that statistical offices can easily construct price indices for the poor using the household survey for the base period.
sectIon vIIIeMPIrIcal IllustratIon
erd WorkIng PaPer serIes no. 112 11
b. Inflation Rates Faced by the Poor
In practice, the official inflation rate is estimated based on the �aspeyres price index. As pointed out, the �aspeyres price index is constructed using the average budget shares of commodities as weights. The �aspeyres price index, however, uses weights that commonly reflect the consumption patterns of the average population. For the poverty impact analysis, it would be more appropriate to use an alternative price index that takes into account the consumption patterns of the poor. In this context, this paper has proposed a new PIP that is constructed based on weights relevant to any poverty measure. In the �aspeyres price index for the Philippines, the greatest weight is rendered to rentals, which is the major expenditure item for the average population. In contrast, rice is the item that is given the highest weight in constructing the PIP. The weights for the PIP are determined by the price elasticity of poverty measures. Thus, each poverty measure (headcount ratio, poverty gap ratio, and severity of poverty) will have a different PIP.
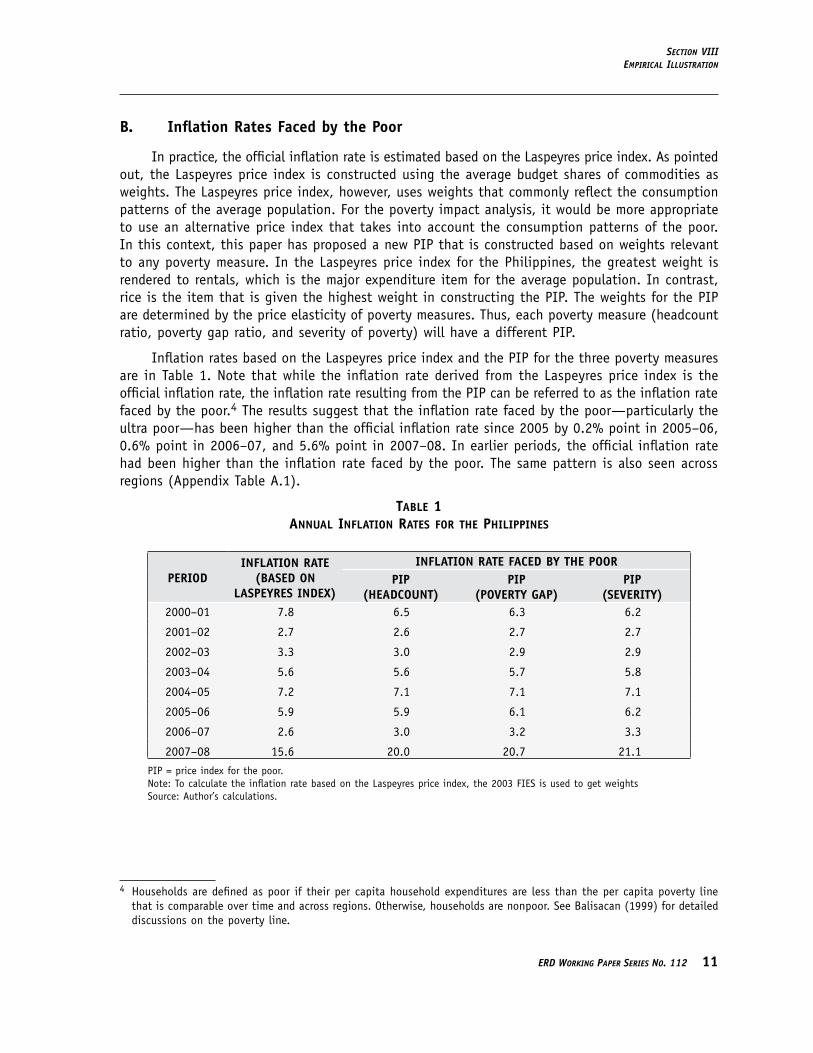
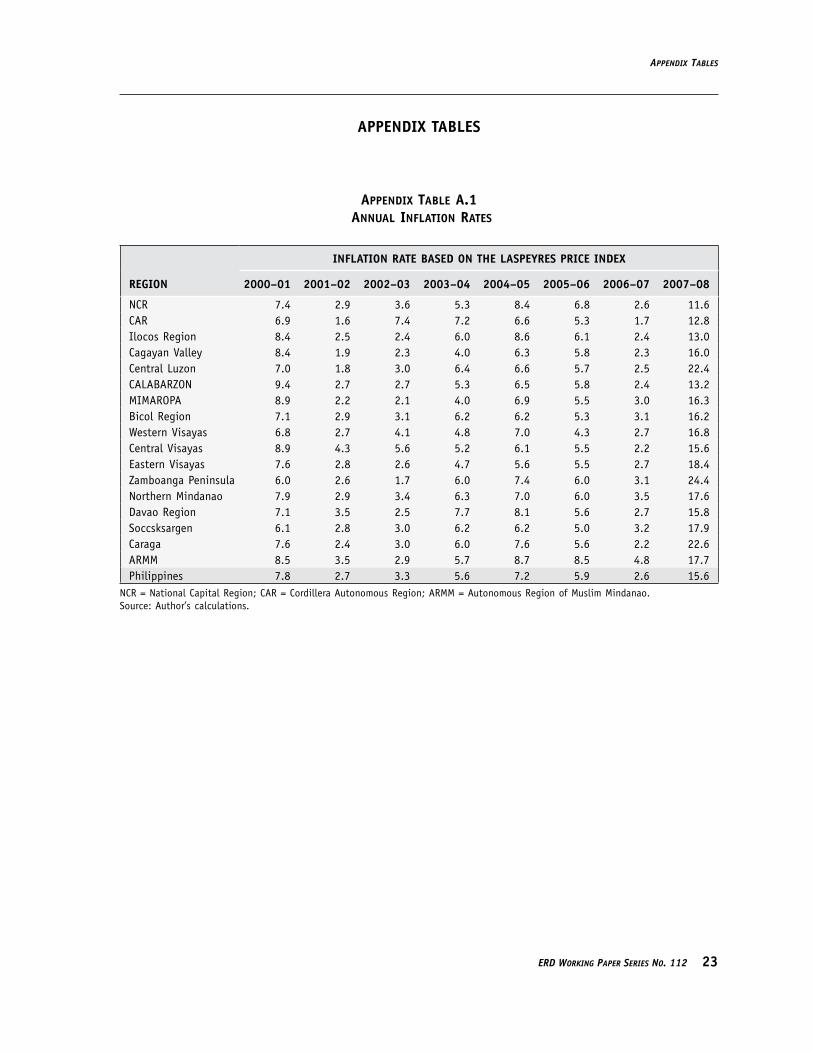
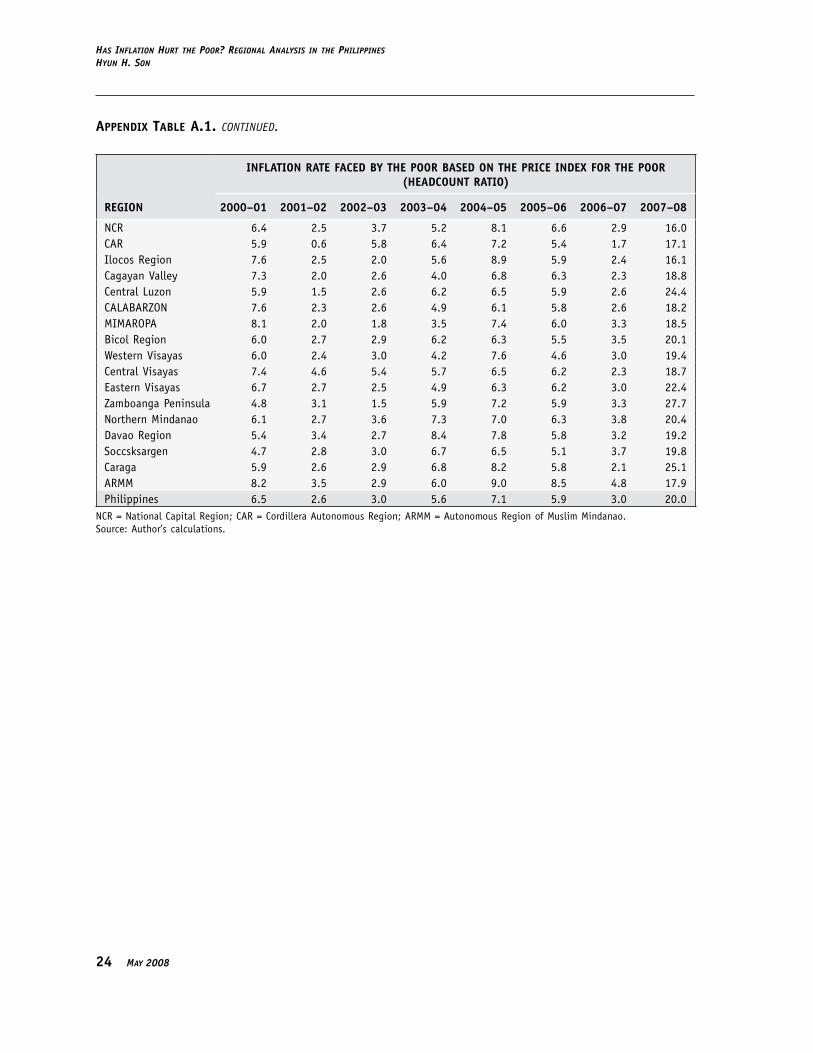
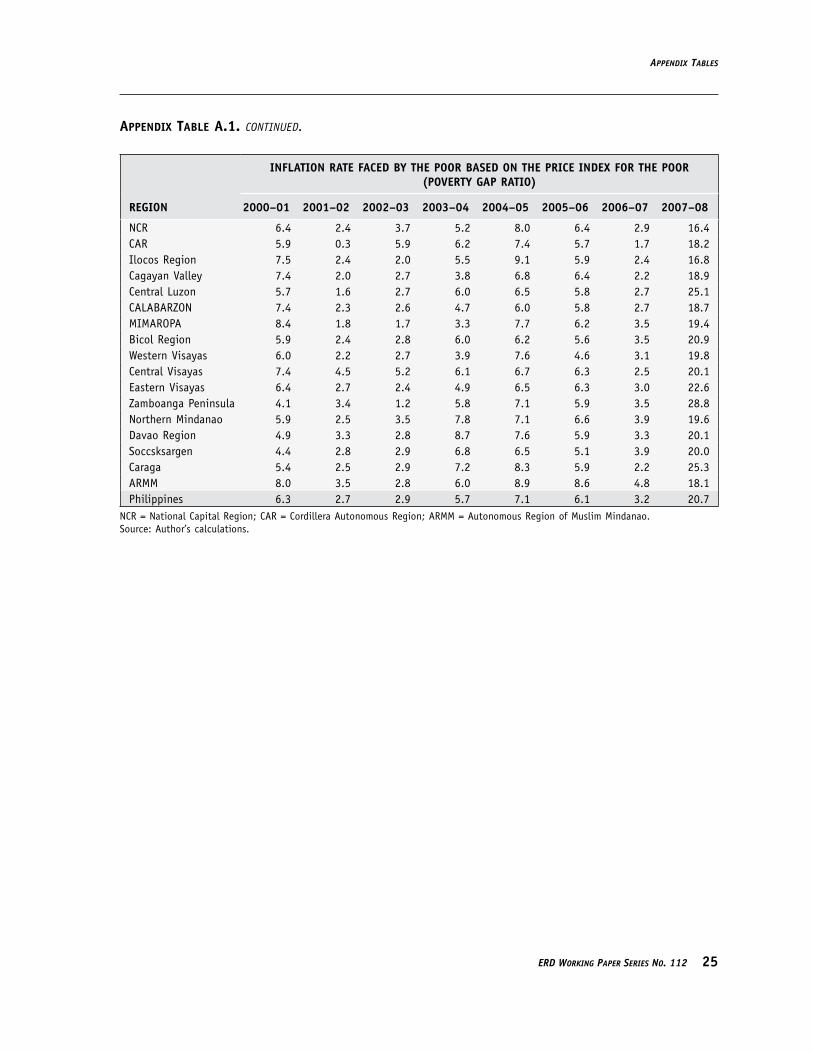
Inflation rates based on the �aspeyres price index and the PIP for the three poverty measures are in Table 1. Note that while the inflation rate derived from the �aspeyres price index is the official inflation rate, the inflation rate resulting from the PIP can be referred to as the inflation rate faced by the poor.4 The results suggest that the inflation rate faced by the poor—particularly the ultra poor—has been higher than the official inflation rate since 2005 by 0.2% point in 2005–06, 0.6% point in 2006–07, and 5.6% point in 2007–08. In earlier periods, the official inflation rate had been higher than the inflation rate faced by the poor. The same pattern is also seen across regions (Appendix Table A.1).
table 1annual InflatIon rates for tHe PHIlIPPInes
PERIoDINFLAtIoN RAtE
(bAsED oN LAsPEyREs INDEx)
INFLAtIoN RAtE FACED by thE PooRPIP
(hEADCouNt)PIP
(PovERty gAP)PIP
(sEvERIty)2000–01 7.8 6.5 6.3 6.2
2001–02 2.7 2.6 2.7 2.7
2002–03 3.3 3.0 2.9 2.9
2003–04 5.6 5.6 5.7 5.8
2004–05 7.2 7.1 7.1 7.1
2005–06 5.9 5.9 6.1 6.2
2006–07 2.6 3.0 3.2 3.3
2007–08 15.6 20.0 20.7 21.1PIP = price index for the poor.Note: To calculate the inflation rate based on the �aspeyres price index, the 2003 FIES is used to get weightsSource: Author’s calculations.
4 Households are defined as poor if their per capita household expenditures are less than the per capita poverty line that is comparable over time and across regions. Otherwise, households are nonpoor. See Balisacan (1999) for detailed discussions on the poverty line.
12 May 2008
Has InflatIon Hurt tHe Poor? regIonal analysIs In tHe PHIlIPPInesHyun H. son
As proven in equations (16) and (35), the inflation rate implied by the �aspeyres price index has a one-to-one relationship with changes in the average standard of living, whereas the inflation rate implied by the PIP has a direct relation with changes in poverty. Having said that, the results in Table 1 suggest that because of price increases, the average standard of living has fallen and poverty has increased in all periods. �ooking at the magnitude of the inflation rate, it can be concluded that the rate of decline in the average standard of living (and increase in poverty) has been the highest in the recent period, 2007–08.
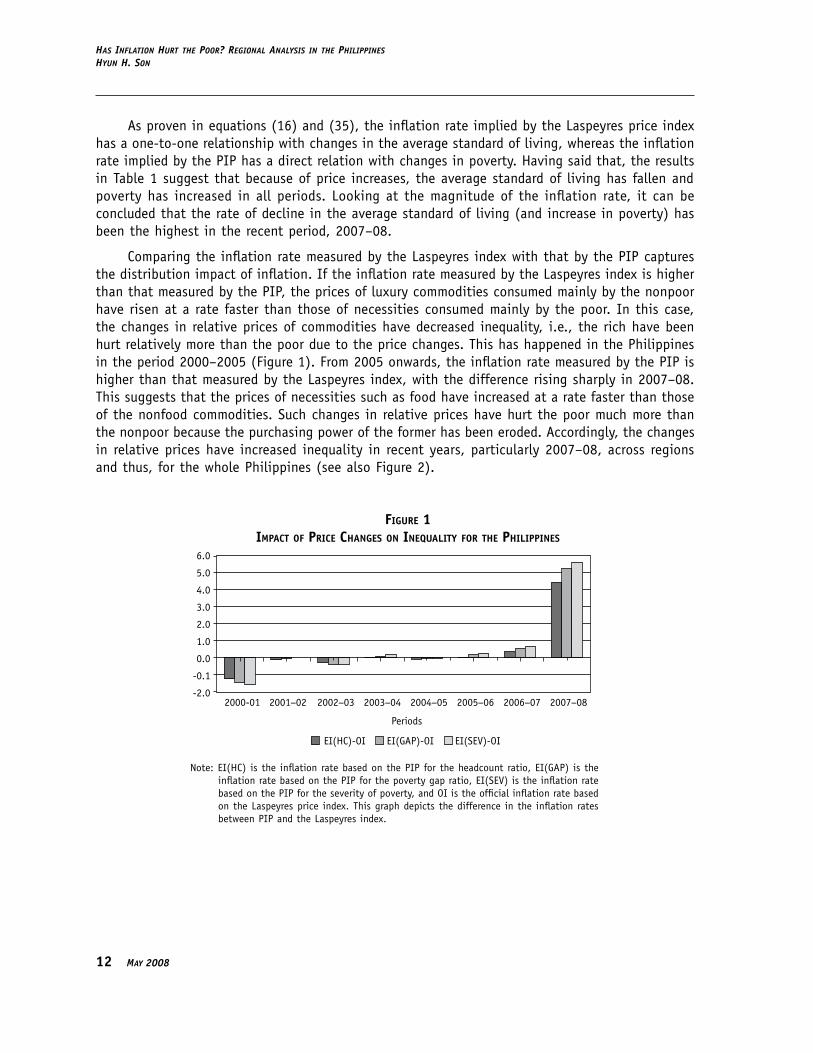
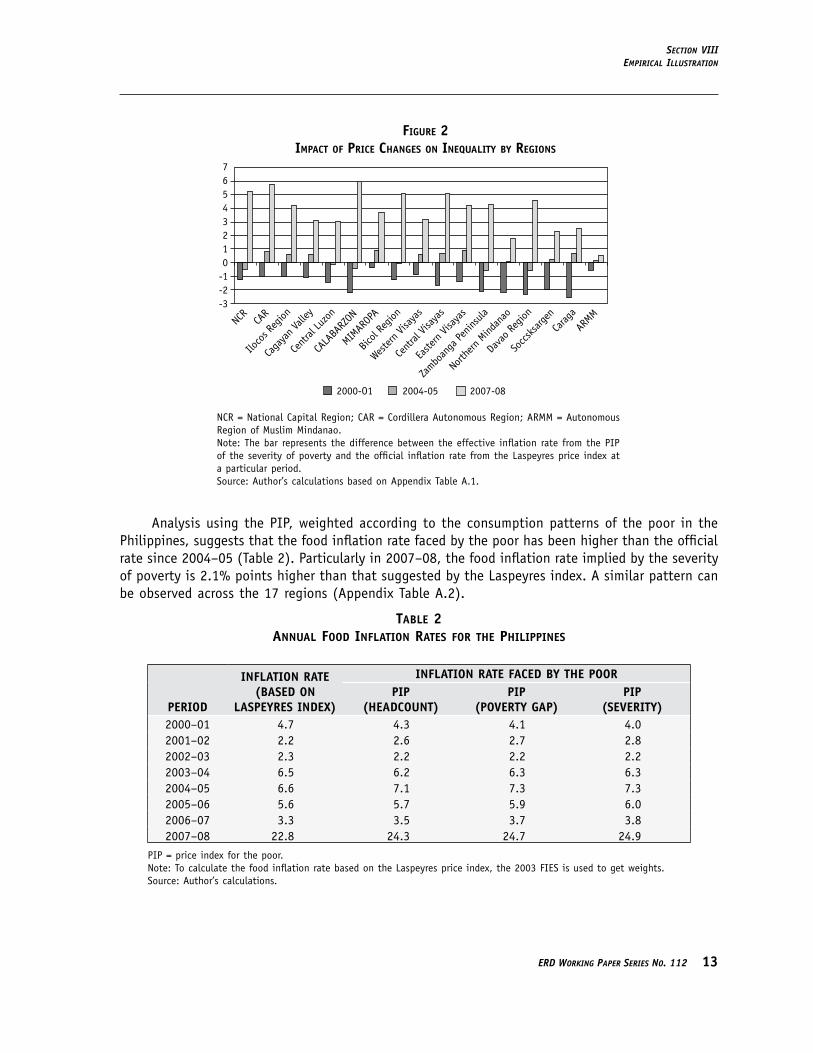
Comparing the inflation rate measured by the �aspeyres index with that by the PIP captures the distribution impact of inflation. If the inflation rate measured by the �aspeyres index is higher than that measured by the PIP, the prices of luxury commodities consumed mainly by the nonpoor have risen at a rate faster than those of necessities consumed mainly by the poor. In this case, the changes in relative prices of commodities have decreased inequality, i.e., the rich have been hurt relatively more than the poor due to the price changes. This has happened in the Philippines in the period 2000–2005 (Figure 1). From 2005 onwards, the inflation rate measured by the PIP is higher than that measured by the �aspeyres index, with the difference rising sharply in 2007–08. This suggests that the prices of necessities such as food have increased at a rate faster than those of the nonfood commodities. Such changes in relative prices have hurt the poor much more than the nonpoor because the purchasing power of the former has been eroded. Accordingly, the changes in relative prices have increased inequality in recent years, particularly 2007–08, across regions and thus, for the whole Philippines (see also Figure 2).
FIGURE 1IMPACT OF PRICE CHANGES ON INEQUALITY FOR THE PHILIPPINES
EI(HC)-OI EI(GAP)-OI EI(SEV)-OI
6.0
5.0
4.0
3.0
2.0
1.0
0.0
-0.1
-2.0
Periods
2000-01 2001−02 2002−03 2003−04 2004−05 2005−06 2006−07 2007−08
Note: EI(HC) is the inflation rate based on the PIP for the headcount ratio, EI(GAP) is the inflation rate based on the PIP for the poverty gap ratio, EI(SE�) is the inflation rate based on the PIP for the severity of poverty, and OI is the official inflation rate based on the �aspeyres price index. This graph depicts the difference in the inflation rates between PIP and the �aspeyres index.
sectIon vIIIeMPIrIcal IllustratIon
erd WorkIng PaPer serIes no. 112 1�
FIGURE 2IMPACT OF PRICE CHANGES ON INEQUALITY BY REGIONS
2000-O1 2004-05 2007-08
76543210
-1-2-3
NCR
CAR
Iloco
s Reg
ion
Caga
yan V
alley
Cent
ral Lu
zon
CALA
BARZ
ON
MIMAROPA
Bicol Region
Bicol
Regio
n
Cent
ral Vi
saya
s
Easte
rn Vi
saya
s
Zambo
anga
Penin
sula
North
ern M
indan
ao
Dava
o Reg
ion
Socc
sksa
rgen
Carag
a
ARMM
MIMAR
OPA
Wester
n Visa
yas
NCR = National Capital Region; CAR = Cordillera Autonomous Region; ARMM = Autonomous Region of Muslim Mindanao.Note: The bar represents the difference between the effective inflation rate from the PIP of the severity of poverty and the official inflation rate from the �aspeyres price index at a particular period. Source: Author’s calculations based on Appendix Table A.1.
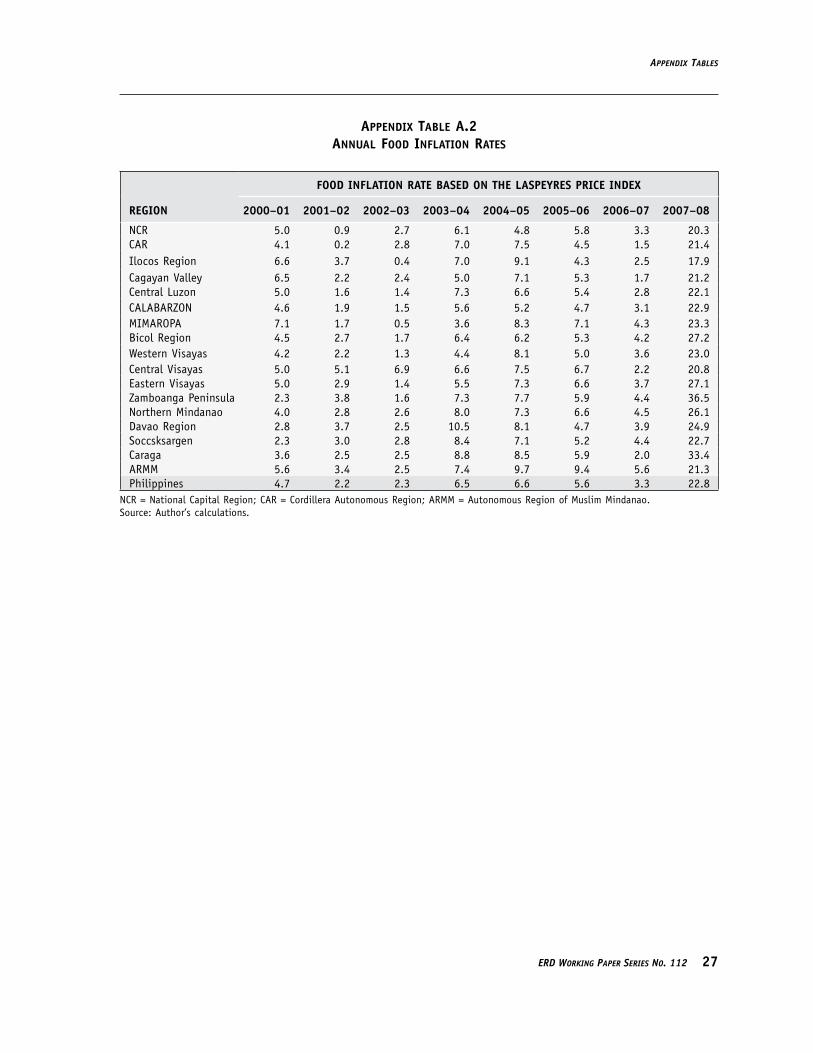
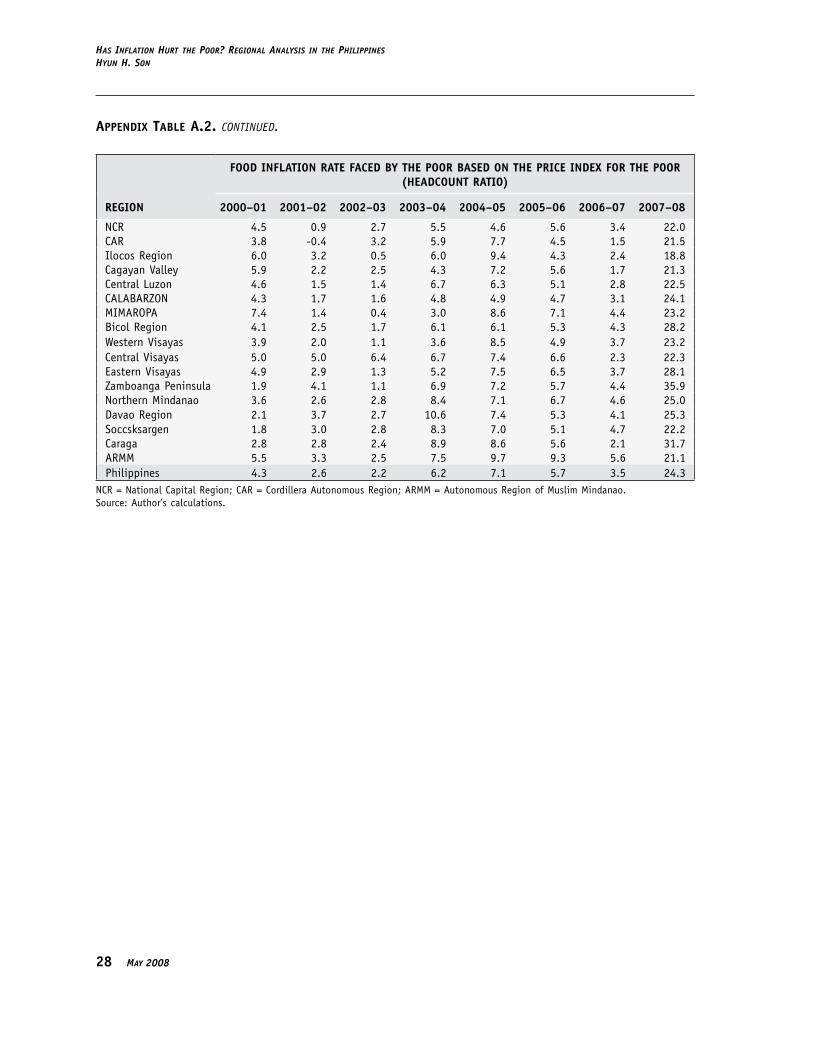
Analysis using the PIP, weighted according to the consumption patterns of the poor in the Philippines, suggests that the food inflation rate faced by the poor has been higher than the official rate since 2004–05 (Table 2). Particularly in 2007–08, the food inflation rate implied by the severity of poverty is 2.1% points higher than that suggested by the �aspeyres index. A similar pattern can be observed across the 17 regions (Appendix Table A.2).
table 2annual food InflatIon rates for tHe PHIlIPPInes
PERIoD
INFLAtIoN RAtE (bAsED oN
LAsPEyREs INDEx)
INFLAtIoN RAtE FACED by thE PooRPIP
(hEADCouNt)PIP
(PovERty gAP)PIP
(sEvERIty)2000–01 4.7 4.3 4.1 4.02001–02 2.2 2.6 2.7 2.82002–03 2.3 2.2 2.2 2.22003–04 6.5 6.2 6.3 6.32004–05 6.6 7.1 7.3 7.32005–06 5.6 5.7 5.9 6.02006–07 3.3 3.5 3.7 3.82007–08 22.8 24.3 24.7 24.9
PIP = price index for the poor. Note: To calculate the food inflation rate based on the �aspeyres price index, the 2003 FIES is used to get weights.Source: Author’s calculations.
1� May 2008
Has InflatIon Hurt tHe Poor? regIonal analysIs In tHe PHIlIPPInesHyun H. son
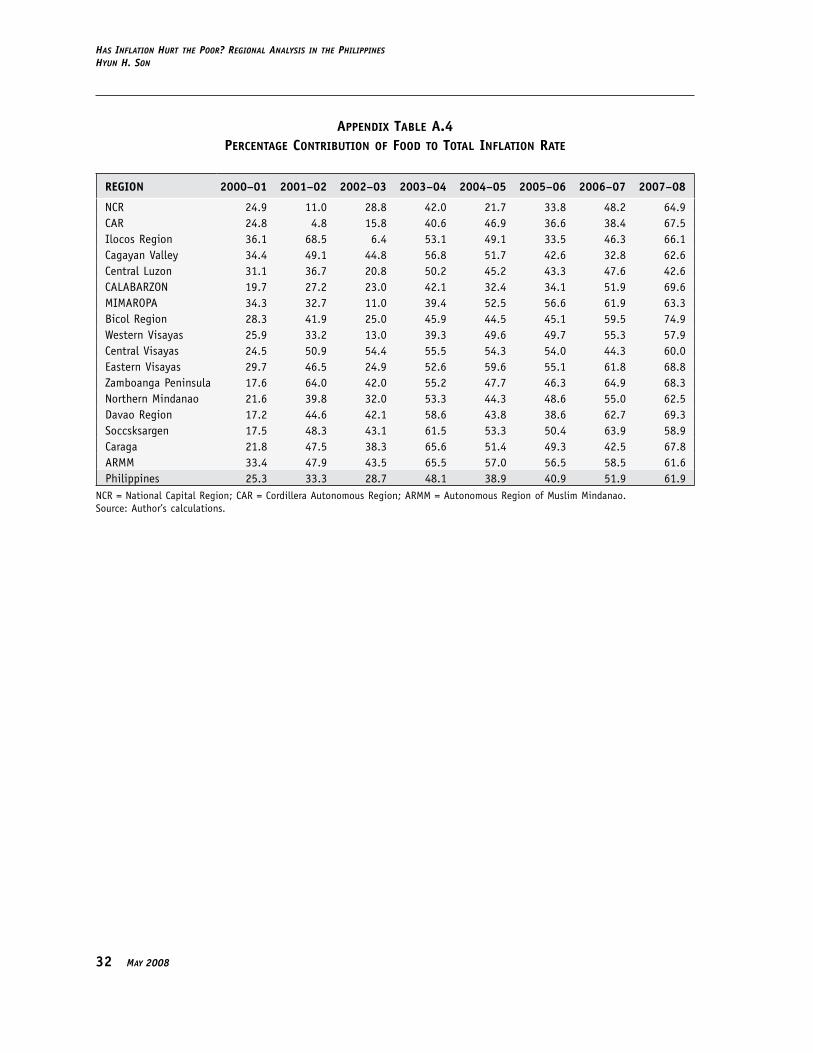
Table 3 shows the percentage contribution of food to the total inflation rate. In 2000–01, the increase in food prices contributed to the total inflation rate by 25.3%. In later periods, the contribution of food to total inflation has been increasing rapidly. In 2007–08, the food prices increase has accounted for almost 62% of the total inflation rate. The contribution of food to the total inflation rate has always been higher for the poor. In 2007–08, the contribution of food to the PIP using the severity of poverty measure accounts for almost 75% of total inflation. From these observations, it may be concluded that the increase in food prices has been the major factor fuelling inflation in the Philippines in recent periods. Nonfood items have played a relatively minor role. This suggests that government policies should be directed toward stabilizing food prices. It also implies that monetary policy may not be an effective tool to combat rising inflation in current periods. Such policies may push the economy into recession, which will hurt the poor even more.
table 3Percentage contrIbutIon of food to total InflatIon rate
for tHe PHIlIPPInes
PERIoD LAsPEyREs INDExPRICE INDEx FoR thE PooR
hEADCouNt PovERty gAP sEvERIty2000–01 25.3 37.6 38.9 39.42001–02 33.3 55.6 59.7 61.42002–03 28.7 42.0 45.2 47.02003–04 48.1 63.2 66.2 67.72004–05 38.9 58.6 62.5 64.12005–06 40.9 56.9 60.3 61.92006–07 51.9 67.0 70.6 72.12007–08 61.9 71.4 73.6 74.5
Note: Percentage contribution of food to total inflation rate by region is also presented in Appendix Table A.4.Source: Author’s calculations.
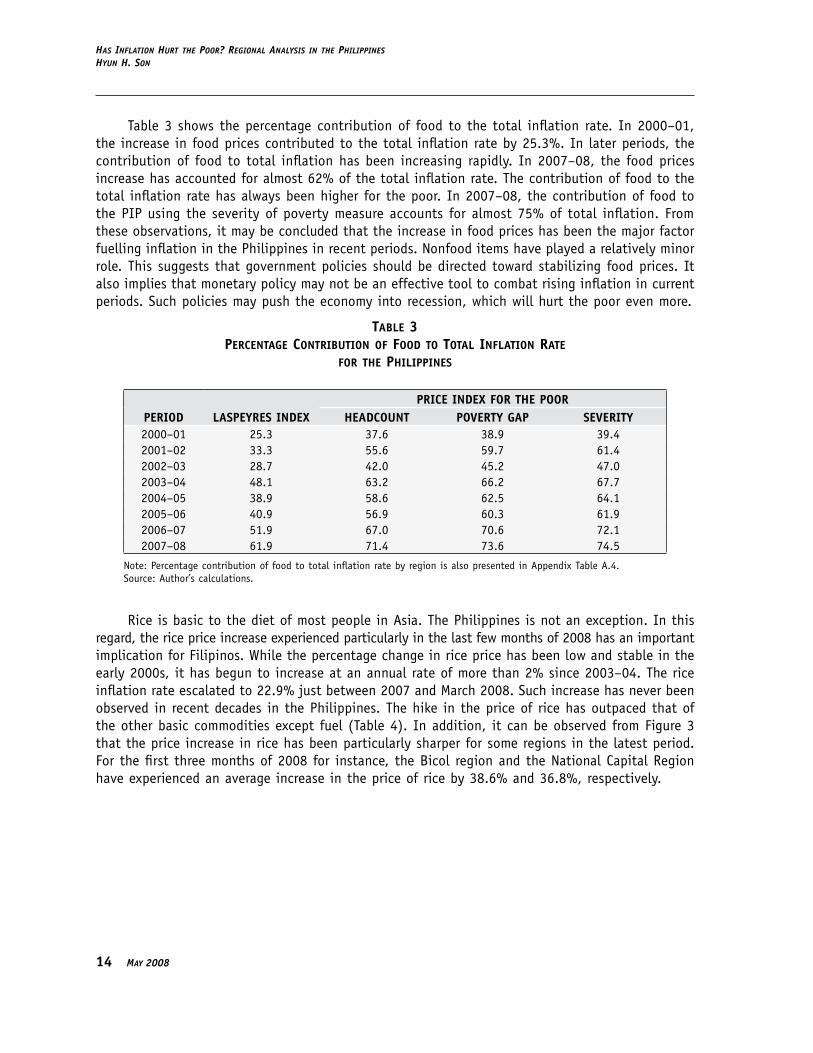
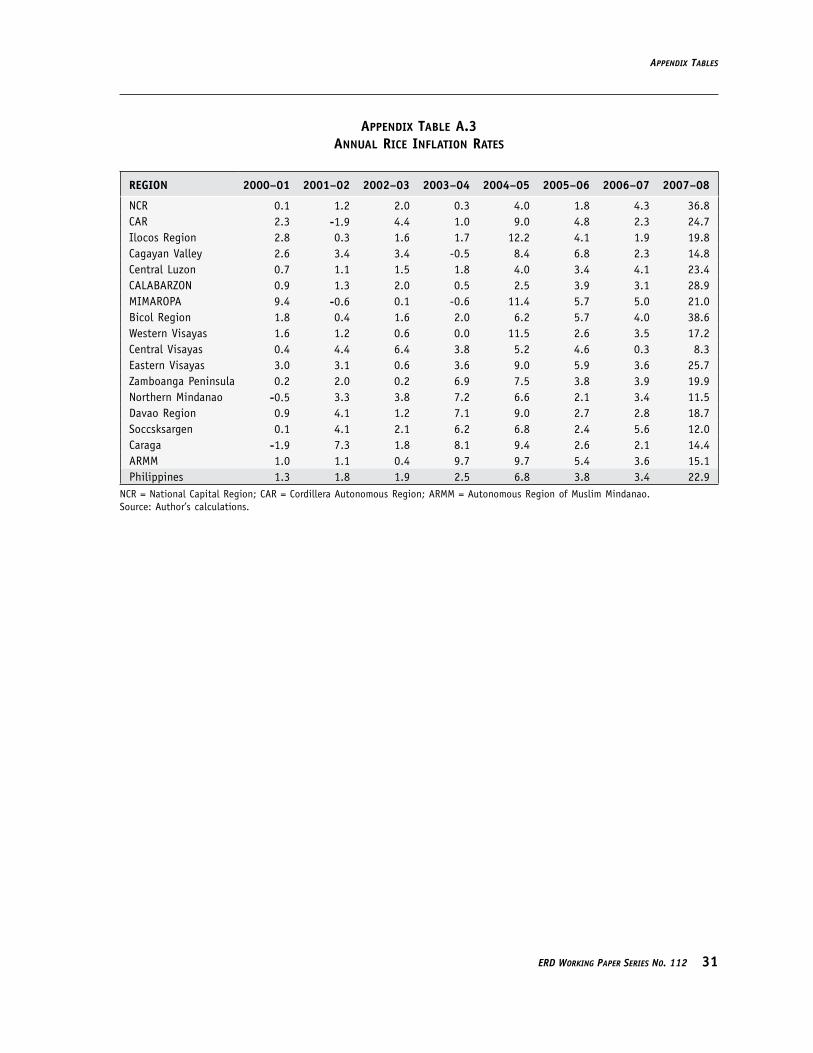
Rice is basic to the diet of most people in Asia. The Philippines is not an exception. In this regard, the rice price increase experienced particularly in the last few months of 2008 has an important implication for Filipinos. While the percentage change in rice price has been low and stable in the early 2000s, it has begun to increase at an annual rate of more than 2% since 2003–04. The rice inflation rate escalated to 22.9% just between 2007 and March 2008. Such increase has never been observed in recent decades in the Philippines. The hike in the price of rice has outpaced that of the other basic commodities except fuel (Table 4). In addition, it can be observed from Figure 3 that the price increase in rice has been particularly sharper for some regions in the latest period. For the first three months of 2008 for instance, the Bicol region and the National Capital Region have experienced an average increase in the price of rice by 38.6% and 36.8%, respectively.
sectIon vIIIeMPIrIcal IllustratIon
erd WorkIng PaPer serIes no. 112 1�
table 4annual InflatIon rates of basIc coMModItIes In tHe PHIlIPPInes
PERIoD RICE FuEL LIght WAtER EDuCAtIoN mEDICAL tRANsPoRt2000–01 1.3 10.1 14.8 12.0 11.0 9.2 12.42001–02 1.8 -0.1 2.3 12.3 8.8 6.7 1.02002–03 1.9 10.1 3.1 8.7 8.1 7.4 3.52003–04 2.5 13.5 4.8 1.7 8.6 4.8 12.62004–05 6.8 17.7 16.4 21.4 6.7 6.1 17.92005–06 3.8 17.5 11.3 7.0 5.4 6.7 12.12006–07 3.4 3.3 2.7 5.1 6.7 4.6 0.62007–08 22.9 52.6 -9.7 10.0 13.5 16.0 13.0
Source: Author’s calculations.
FIGURE 3ANNUAL RICE INFLATION RATE BY REGION, 2006–08
(PERCENT)
2006-O7 2007-08
40
35
30
25
20
15
10
5
0
NCR
CAR
Iloco
s Reg
ion
Caga
yan V
alley
Cent
ral Lu
zon
CALA
BARZ
ON
Bicol
Regio
n
Cent
ral Vi
saya
s
Easte
rn Vi
saya
s
Zambo
anga
Penin
sula
North
ern M
indan
ao
Dava
o Reg
ion
Socc
sksa
rgen
Carag
a
ARMM
MIMAR
OPA
Wester
n Visa
yas
Infla
tion
rat
e
NCR = National Capital Region; CAR = Cordillera Autonomous Region; ARMM = Autonomous Region of Muslim Mindanao. Source: Appendix Table A.3.
C. Impact of Price Changes on Average standard of Living and Poverty
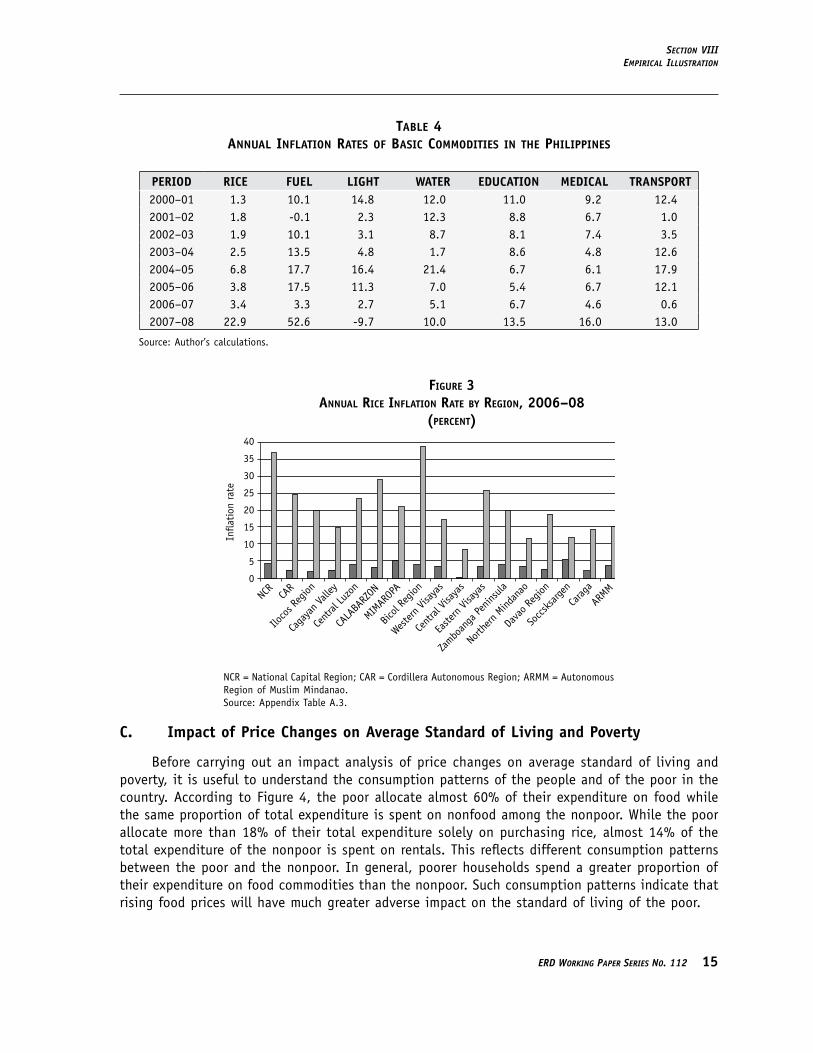
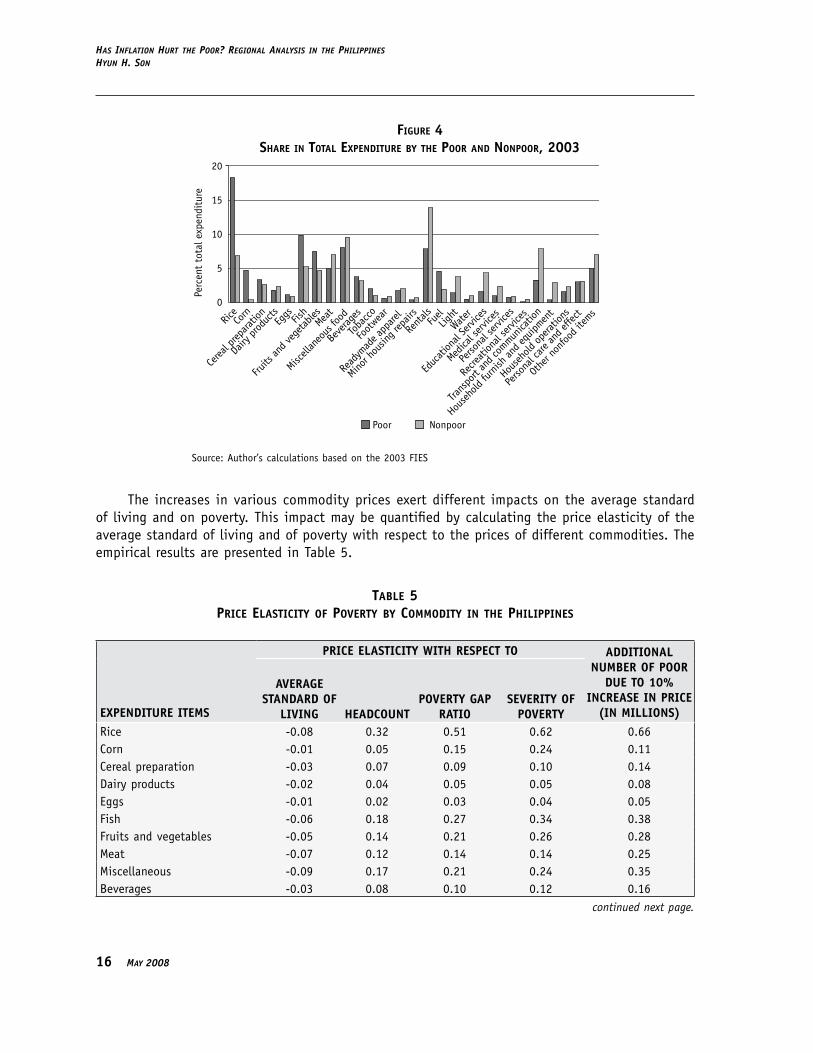
Before carrying out an impact analysis of price changes on average standard of living and poverty, it is useful to understand the consumption patterns of the people and of the poor in the country. According to Figure 4, the poor allocate almost 60% of their expenditure on food while the same proportion of total expenditure is spent on nonfood among the nonpoor. While the poor allocate more than 18% of their total expenditure solely on purchasing rice, almost 14% of the total expenditure of the nonpoor is spent on rentals. This reflects different consumption patterns between the poor and the nonpoor. In general, poorer households spend a greater proportion of their expenditure on food commodities than the nonpoor. Such consumption patterns indicate that rising food prices will have much greater adverse impact on the standard of living of the poor.
1� May 2008
Has InflatIon Hurt tHe Poor? regIonal analysIs In tHe PHIlIPPInesHyun H. son
FIGURE 4SHARE IN TOTAL EXPENDITURE BY THE POOR AND NONPOOR, 2003
20
15
10
5
0
Cerea
l prep
aratio
nRic
e
Fruits
and v
egeta
bles
Eggs
Poor Nonpoor
Miscell
aneo
us fo
od
Read
ymad
e app
arel
Toba
cco
Rent
als
Educ
ation
al Se
rvice
sLig
ht
Perso
nal s
ervice
s
Hous
ehold
opera
tions
Trans
port
and c
ommun
icatio
n
Othe
r non
food i
tems
Corn
Dairy
prod
ucts
Fish
Meat
Beve
rages
Foot
wear
Minor h
ousin
g rep
airs
Fuel
Water
Medica
l serv
ices
Recre
ation
al se
rvice
s
Hous
ehold
furnish
and e
quipm
ent
Perso
nal c
are an
d effe
ct
Perc
ent
tota
l exp
endi
ture
Source: Author’s calculations based on the 2003 FIES
The increases in various commodity prices exert different impacts on the average standard of living and on poverty. This impact may be quantified by calculating the price elasticity of the average standard of living and of poverty with respect to the prices of different commodities. The empirical results are presented in Table 5.
table 5PrIce elastIcIty of Poverty by coMModIty In tHe PHIlIPPInes
ExPENDItuRE ItEms
PRICE ELAstICIty WIth REsPECt to ADDItIoNALNumbER oF PooR
DuE to 10% INCREAsE IN PRICE
(IN mILLIoNs)
AvERAgE stANDARD oF
LIvINg hEADCouNtPovERty gAP
RAtIosEvERIty oF
PovERtyRice -0.08 0.32 0.51 0.62 0.66Corn -0.01 0.05 0.15 0.24 0.11Cereal preparation -0.03 0.07 0.09 0.10 0.14Dairy products -0.02 0.04 0.05 0.05 0.08Eggs -0.01 0.02 0.03 0.04 0.05Fish -0.06 0.18 0.27 0.34 0.38Fruits and vegetables -0.05 0.14 0.21 0.26 0.28Meat -0.07 0.12 0.14 0.14 0.25Miscellaneous -0.09 0.17 0.21 0.24 0.35Beverages -0.03 0.08 0.10 0.12 0.16
continued next page.
sectIon vIIIeMPIrIcal IllustratIon
erd WorkIng PaPer serIes no. 112 1�
Tobacco -0.01 0.04 0.05 0.06 0.08Footwear -0.01 0.01 0.02 0.02 0.03Readymade apparel -0.02 0.04 0.05 0.06 0.08Minor housing repairs -0.01 0.01 0.01 0.01 0.02Rentals -0.13 0.16 0.21 0.24 0.34Fuel -0.02 0.08 0.13 0.16 0.16�ight -0.04 0.04 0.04 0.04 0.07Water -0.01 0.01 0.01 0.01 0.02Educational services -0.04 0.03 0.05 0.05 0.07Medical services -0.02 0.03 0.03 0.03 0.05Personal services -0.01 0.02 0.02 0.02 0.03Recreational services -0.00 0.00 0.00 0.00 0.01Transport and communication -0.08 0.07 0.09 0.10 0.15Household furnishings and equipment -0.03 0.01 0.01 0.01 0.03Household operations -0.02 0.03 0.05 0.06 0.06Personal care and effects -0.03 0.06 0.08 0.09 0.13Other miscellaneous items -0.07 0.09 0.14 0.17 0.20Per capita total expenditure -1.00 1.92 2.74 3.29 4.00Food -0.42 1.10 1.66 2.04 2.30Nonfood -0.58 0.82 1.08 1.25 1.70
Source: Author’s calculations.
The price elasticity of the average standard of living suggests that a 10% increase in food prices will result in a decrease in average standard of living by 4.2%. On the other hand, a 10% increase in nonfood prices will lead to a 5.8% decline in the average standard of living in the Philippines. The impact of an increase in food prices on poverty is much larger. A 10% increase in food prices contributes to more than 11% increase in the headcount ratio. The impact on the severity of poverty is over 20%. Since the severity of poverty gives more weight to the poor who live far below the poverty line, the impact of increase in food prices on the ultra poor can be severe.
In the recent period from 2007 to March 2008, rice prices have increased at an annual rate of 22.9%. The price elasticity of rice for the average standard of living is only –0.08, which means that an increase in rice prices by 22.9% would result in a decline in average standard of living by only 1.8%. However, the impact of the rice price hike on poverty is much greater. The price elasticity of the severity of poverty is 0.62, suggesting that a 22.9% increase in rice price will result in an increase of the severity of poverty by 14.2%. This finding indicates that rising rice prices hit the ultra poor the hardest.
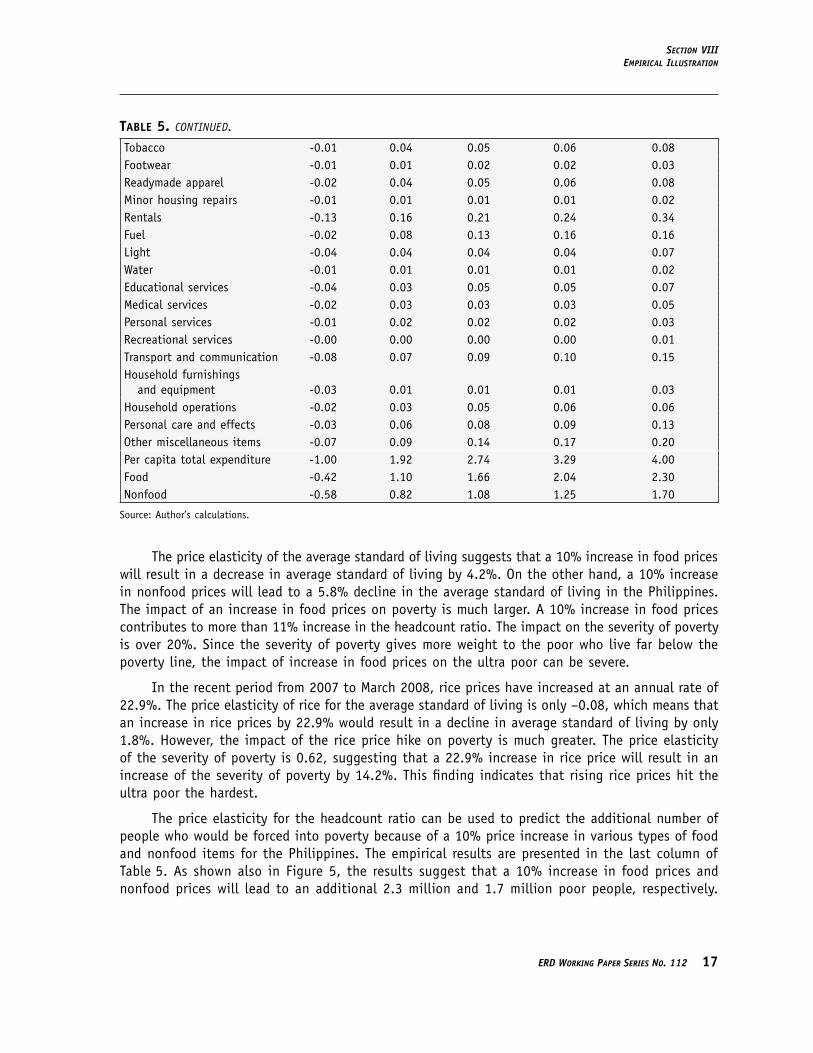
The price elasticity for the headcount ratio can be used to predict the additional number of people who would be forced into poverty because of a 10% price increase in various types of food and nonfood items for the Philippines. The empirical results are presented in the last column of Table 5. As shown also in Figure 5, the results suggest that a 10% increase in food prices and nonfood prices will lead to an additional 2.3 million and 1.7 million poor people, respectively.
table 5. continued.
1� May 2008
Has InflatIon Hurt tHe Poor? regIonal analysIs In tHe PHIlIPPInesHyun H. son
Applying the same analysis on rice and fuel, a 10% increase in the prices of these goods will result in an additional 0.66 million and 0.16 million poor people in the Philippines, respectively.
FIGURE 5CHANGE IN NUMBER OF POOR WITH A 10% INCREASE IN COMMODITY PRICES
(MILLIONS)0.7
0.6
0.5
0.4
0.3
0.2
0.1
0.0
Cerea
l prep
aratio
nRic
eCo
rn
Dairy
prod
ucts
Fish
Fruits
and v
egeta
bles
Eggs
Miscell
aneo
us fo
od
Read
ymad
e app
arel
Toba
cco
Rent
alsFuel
Water
Medica
l serv
ices
Recre
ation
al se
rvice
Educ
ation
al Se
rvice
sLig
ht
Perso
nal s
ervice
s
Hous
ehold
opera
tions
Trans
port
and c
ommun
icatio
n
Othe
r non
food i
tems
Chan
ge in
num
ber
of p
oor
Meat
Beve
rages
Foot
wear
Minor h
ousin
g rep
air
Hous
ehold
furnish
ing an
d equ
ipmen
t
Perso
nal c
are an
d effe
ct
Source: Table 5.
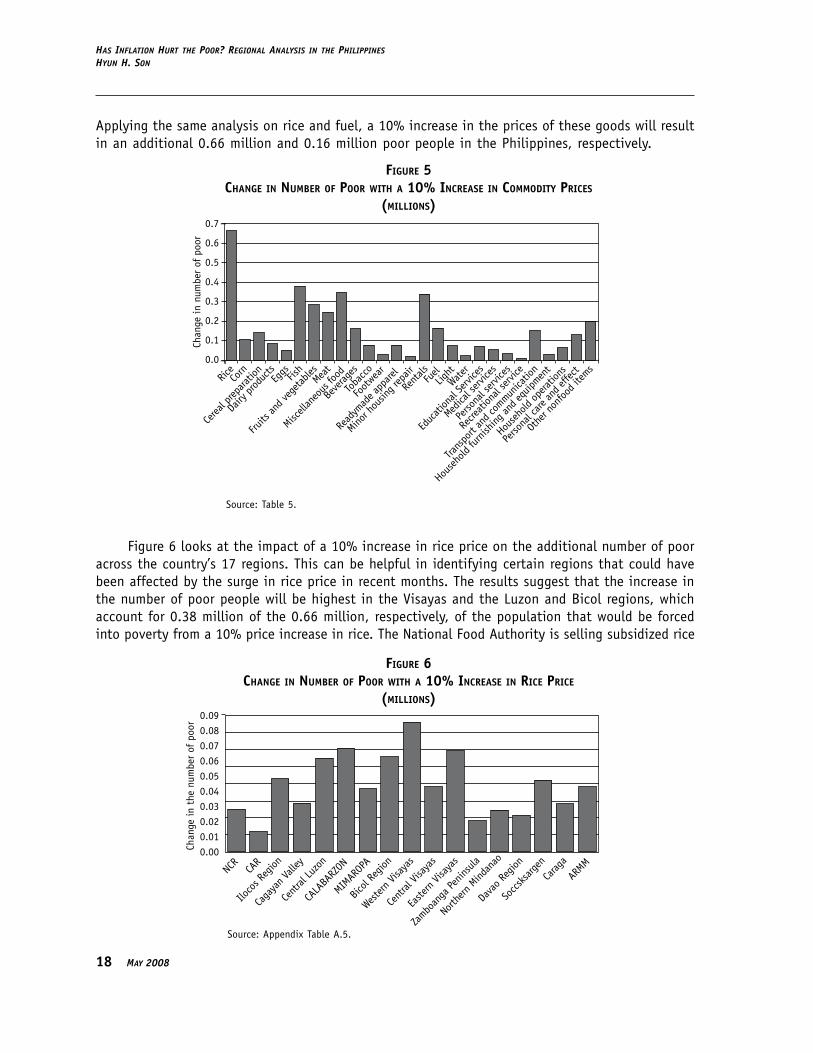
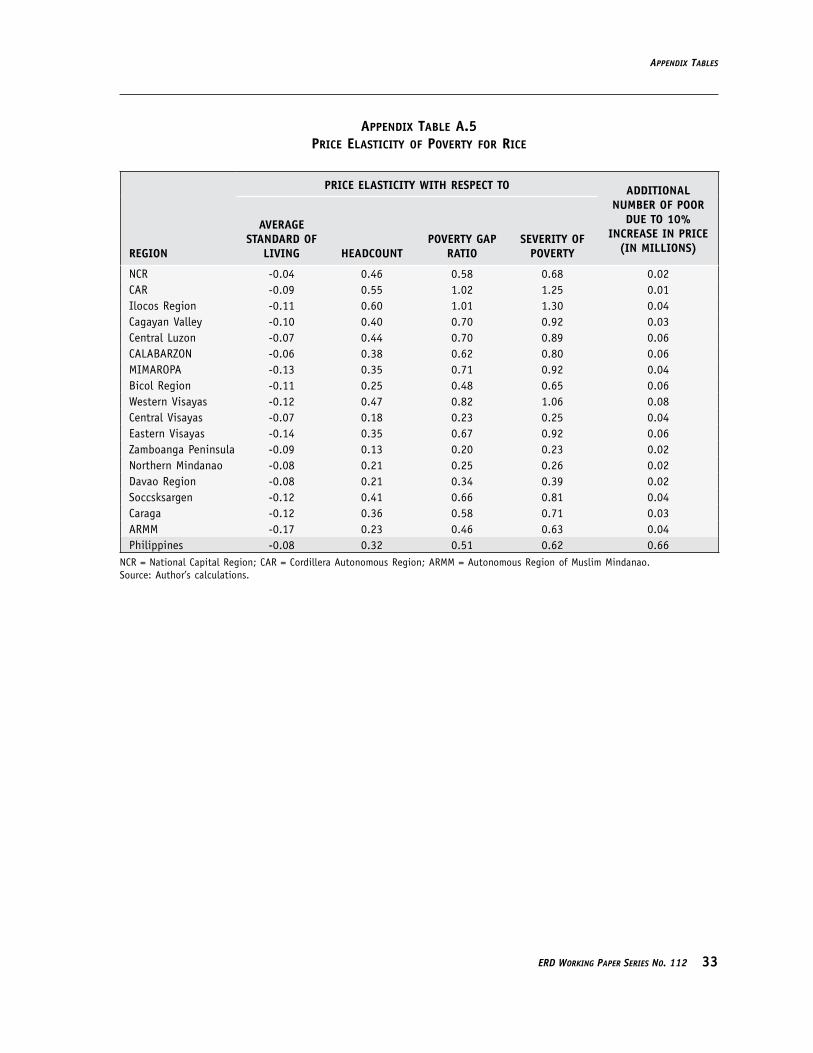
Figure 6 looks at the impact of a 10% increase in rice price on the additional number of poor across the country’s 17 regions. This can be helpful in identifying certain regions that could have been affected by the surge in rice price in recent months. The results suggest that the increase in the number of poor people will be highest in the �isayas and the �uzon and Bicol regions, which account for 0.38 million of the 0.66 million, respectively, of the population that would be forced into poverty from a 10% price increase in rice. The National Food Authority is selling subsidized rice
FIGURE 6CHANGE IN NUMBER OF POOR WITH A 10% INCREASE IN RICE PRICE
(MILLIONS)0.090.080.070.060.050.040.030.020.010.00
CAR
NCR
Caga
yan V
alley
Iloco
s Reg
ion
Cent
ral Lu
zon
MIMAR
OPA
CALA
BARZ
ON
Bicol
Regio
n
Cent
ral Vi
saya
s
Wester
n Visa
yas
Easte
rn Vi
saya
s
North
ern M
indan
ao
Zambo
anga
Penin
sula
ARMM
Chan
ge in
the
num
ber
of p
oor
Dava
o Reg
ion
Socc
sksa
rgen
Carag
a
Source: Appendix Table A.5.
sectIon vIIIeMPIrIcal IllustratIon
erd WorkIng PaPer serIes no. 112 1�
to vulnerable groups in the Philippines at a much lower price than the market price. If the subsidies are removed, then rice will be sold at the market price. The adverse impact of this scenario would be far greater for the three regions of �isayas, �uzon, and Bicol. In particular, the change in rice price is likely to increase the number of poor the most in Western �isayas.
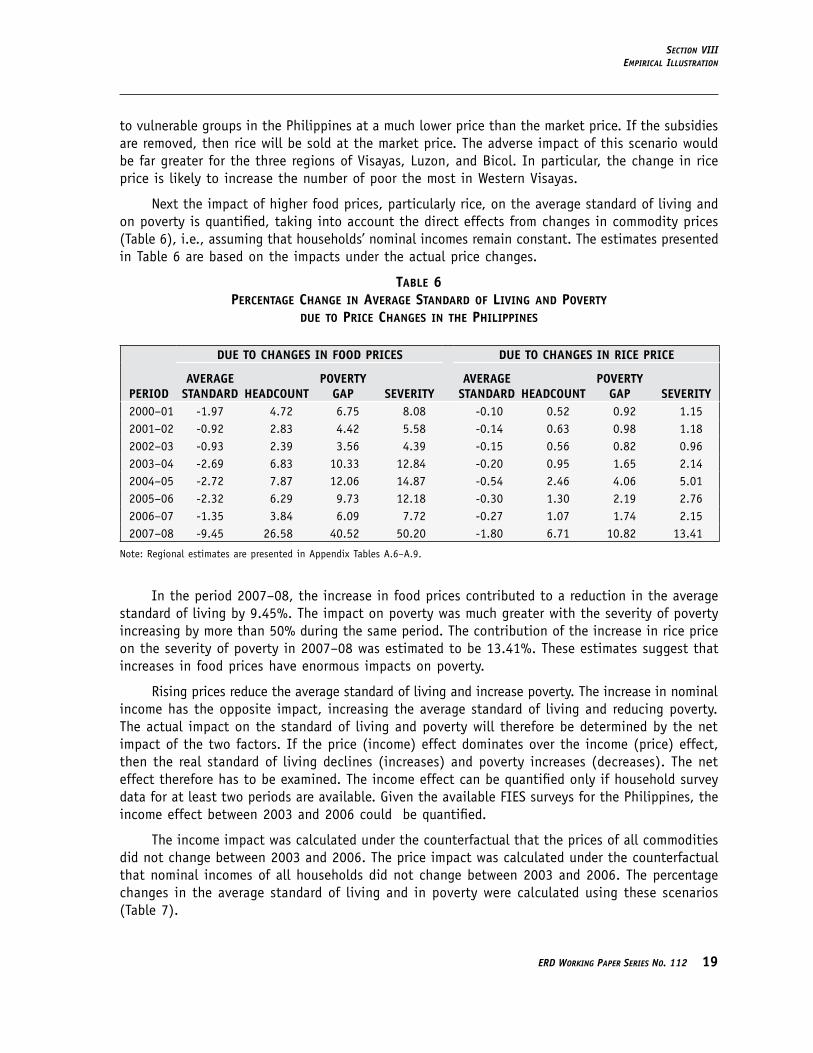
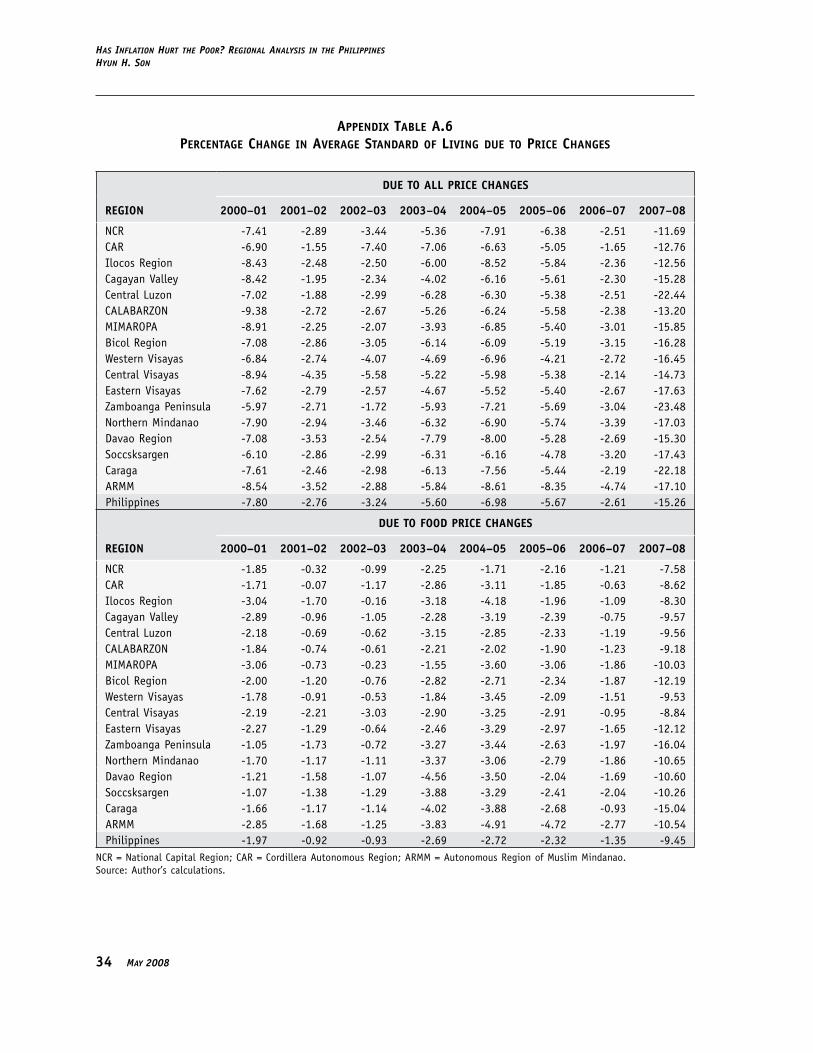
Next the impact of higher food prices, particularly rice, on the average standard of living and on poverty is quantified, taking into account the direct effects from changes in commodity prices (Table 6), i.e., assuming that households’ nominal incomes remain constant. The estimates presented in Table 6 are based on the impacts under the actual price changes.
table 6Percentage cHange In average standard of lIvIng and Poverty
due to PrIce cHanges In tHe PHIlIPPInes
PERIoD
DuE to ChANgEs IN FooD PRICEs DuE to ChANgEs IN RICE PRICE
AvERAgEstANDARD hEADCouNt
PovERty gAP sEvERIty
AvERAgEstANDARD hEADCouNt
PovERty gAP sEvERIty
2000–01 -1.97 4.72 6.75 8.08 -0.10 0.52 0.92 1.152001–02 -0.92 2.83 4.42 5.58 -0.14 0.63 0.98 1.182002–03 -0.93 2.39 3.56 4.39 -0.15 0.56 0.82 0.962003–04 -2.69 6.83 10.33 12.84 -0.20 0.95 1.65 2.142004–05 -2.72 7.87 12.06 14.87 -0.54 2.46 4.06 5.012005–06 -2.32 6.29 9.73 12.18 -0.30 1.30 2.19 2.762006–07 -1.35 3.84 6.09 7.72 -0.27 1.07 1.74 2.152007–08 -9.45 26.58 40.52 50.20 -1.80 6.71 10.82 13.41
Note: Regional estimates are presented in Appendix Tables A.6–A.9.
In the period 2007–08, the increase in food prices contributed to a reduction in the average standard of living by 9.45%. The impact on poverty was much greater with the severity of poverty increasing by more than 50% during the same period. The contribution of the increase in rice price on the severity of poverty in 2007–08 was estimated to be 13.41%. These estimates suggest that increases in food prices have enormous impacts on poverty.
Rising prices reduce the average standard of living and increase poverty. The increase in nominal income has the opposite impact, increasing the average standard of living and reducing poverty. The actual impact on the standard of living and poverty will therefore be determined by the net impact of the two factors. If the price (income) effect dominates over the income (price) effect, then the real standard of living declines (increases) and poverty increases (decreases). The net effect therefore has to be examined. The income effect can be quantified only if household survey data for at least two periods are available. Given the available FIES surveys for the Philippines, the income effect between 2003 and 2006 could be quantified.
The income impact was calculated under the counterfactual that the prices of all commodities did not change between 2003 and 2006. The price impact was calculated under the counterfactual that nominal incomes of all households did not change between 2003 and 2006. The percentage changes in the average standard of living and in poverty were calculated using these scenarios (Table 7).
20 May 2008
Has InflatIon Hurt tHe Poor? regIonal analysIs In tHe PHIlIPPInesHyun H. son
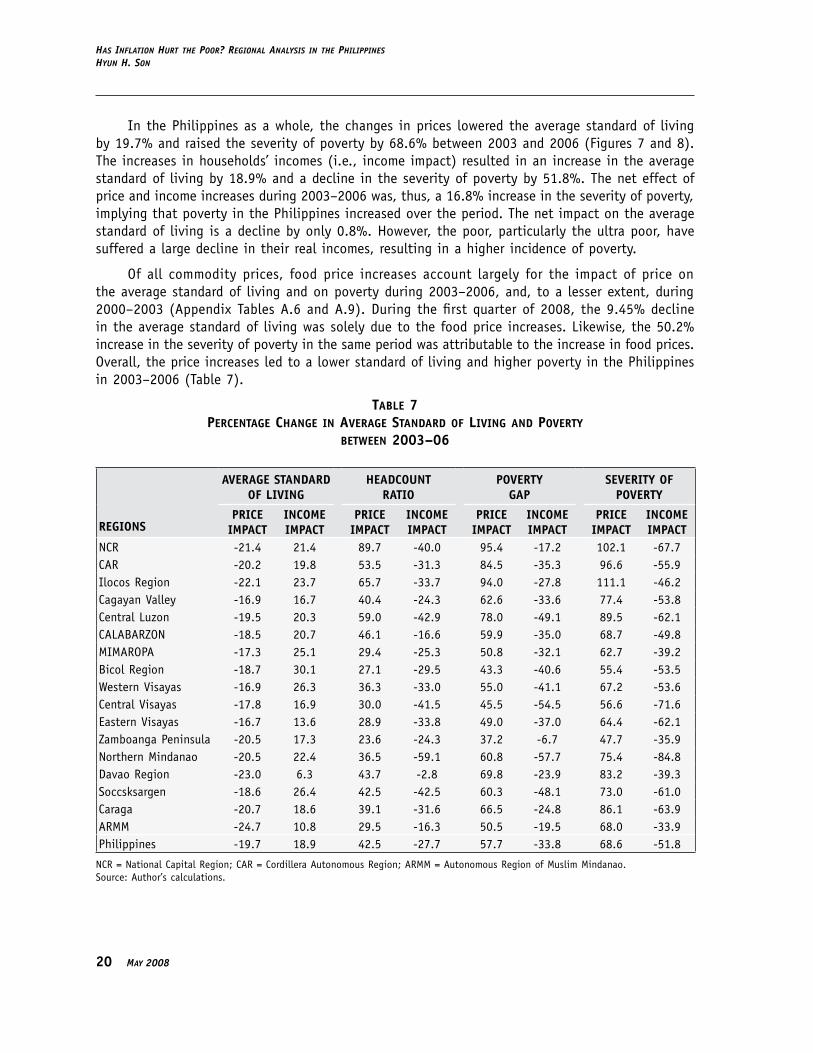
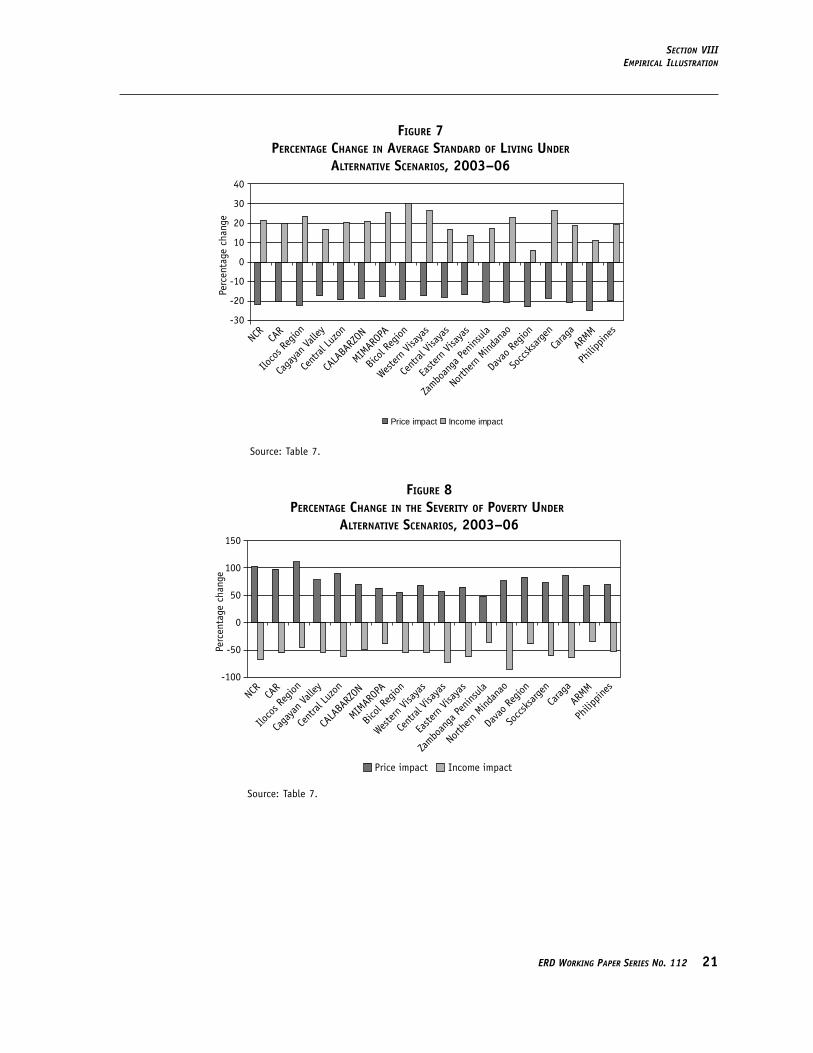
In the Philippines as a whole, the changes in prices lowered the average standard of living by 19.7% and raised the severity of poverty by 68.6% between 2003 and 2006 (Figures 7 and 8). The increases in households’ incomes (i.e., income impact) resulted in an increase in the average standard of living by 18.9% and a decline in the severity of poverty by 51.8%. The net effect of price and income increases during 2003–2006 was, thus, a 16.8% increase in the severity of poverty, implying that poverty in the Philippines increased over the period. The net impact on the average standard of living is a decline by only 0.8%. However, the poor, particularly the ultra poor, have suffered a large decline in their real incomes, resulting in a higher incidence of poverty.
Of all commodity prices, food price increases account largely for the impact of price on the average standard of living and on poverty during 2003–2006, and, to a lesser extent, during 2000–2003 (Appendix Tables A.6 and A.9). During the first quarter of 2008, the 9.45% decline in the average standard of living was solely due to the food price increases. �ikewise, the 50.2% increase in the severity of poverty in the same period was attributable to the increase in food prices. Overall, the price increases led to a lower standard of living and higher poverty in the Philippines in 2003–2006 (Table 7).
table 7Percentage cHange In average standard of lIvIng and Poverty
between 2003–06
REgIoNs
AvERAgE stANDARDoF LIvINg
hEADCouNtRAtIo
PovERtygAP
sEvERIty oFPovERty
PRICE ImPACt
INComE ImPACt
PRICE ImPACt
INComE ImPACt
PRICE ImPACt
INComE ImPACt
PRICE ImPACt
INComE ImPACt
NCR -21.4 21.4 89.7 -40.0 95.4 -17.2 102.1 -67.7CAR -20.2 19.8 53.5 -31.3 84.5 -35.3 96.6 -55.9Ilocos Region -22.1 23.7 65.7 -33.7 94.0 -27.8 111.1 -46.2Cagayan �alley -16.9 16.7 40.4 -24.3 62.6 -33.6 77.4 -53.8Central �uzon -19.5 20.3 59.0 -42.9 78.0 -49.1 89.5 -62.1CA�ABARZON -18.5 20.7 46.1 -16.6 59.9 -35.0 68.7 -49.8MIMAROPA -17.3 25.1 29.4 -25.3 50.8 -32.1 62.7 -39.2Bicol Region -18.7 30.1 27.1 -29.5 43.3 -40.6 55.4 -53.5Western �isayas -16.9 26.3 36.3 -33.0 55.0 -41.1 67.2 -53.6Central �isayas -17.8 16.9 30.0 -41.5 45.5 -54.5 56.6 -71.6Eastern �isayas -16.7 13.6 28.9 -33.8 49.0 -37.0 64.4 -62.1Zamboanga Peninsula -20.5 17.3 23.6 -24.3 37.2 -6.7 47.7 -35.9Northern Mindanao -20.5 22.4 36.5 -59.1 60.8 -57.7 75.4 -84.8Davao Region -23.0 6.3 43.7 -2.8 69.8 -23.9 83.2 -39.3Soccsksargen -18.6 26.4 42.5 -42.5 60.3 -48.1 73.0 -61.0Caraga -20.7 18.6 39.1 -31.6 66.5 -24.8 86.1 -63.9ARMM -24.7 10.8 29.5 -16.3 50.5 -19.5 68.0 -33.9Philippines -19.7 18.9 42.5 -27.7 57.7 -33.8 68.6 -51.8
NCR = National Capital Region; CAR = Cordillera Autonomous Region; ARMM = Autonomous Region of Muslim Mindanao.Source: Author’s calculations.
sectIon vIIIeMPIrIcal IllustratIon
erd WorkIng PaPer serIes no. 112 21
FIGURE 7PERCENTAGE CHANGE IN AVERAGE STANDARD OF LIVING UNDER
ALTERNATIVE SCENARIOS, 2003–0640
30
20
10
0
-10
-20
-30
CAR
NCR
Caga
yan V
alley
Iloco
s Reg
ion
Cent
ral Lu
zon
MIMAR
OPA
CALA
BARZ
ON
Bicol
Regio
n
Cent
ral Vi
saya
s
Wester
n Visa
yas
Easte
rn Vi
saya
s
North
ern M
indan
ao
Zambo
anga
Penin
sula
ARMM
Perc
enta
ge c
hang
e
Dava
o Reg
ion
Socc
sksa
rgen
Carag
a
Price impact Income impact
Philip
pines
Source: Table 7.
FIGURE 8PERCENTAGE CHANGE IN THE SEVERITY OF POVERTY UNDER
ALTERNATIVE SCENARIOS, 2003–06150
100
50
0
-50
-100
CAR
NCR
Caga
yan V
alley
Iloco
s Reg
ion
Cent
ral Lu
zon
MIMAR
OPA
CALA
BARZ
ON
Bicol
Regio
n
Cent
ral Vi
saya
s
Wester
n Visa
yas
Easte
rn Vi
saya
s
North
ern M
indan
ao
Zambo
anga
Penin
sula
ARMM
Perc
enta
ge c
hang
e
Dava
o Reg
ion
Socc
sksa
rgen
Carag
a
Philip
pines
Price impact Income impact
Source: Table 7.

22 May 2008
Has InflatIon Hurt tHe Poor? regIonal analysIs In tHe PHIlIPPInesHyun H. son
Ix. CoNCLusIoNs
The effects of rising food prices will differ across households (ADB 2008). On one hand, there will be some households that may benefit from higher prices. On the other hand, other households may be adversely affected. Rising food prices may lead to income gains for net producers. However, many urban and rural poor who are food consumers and not necessarily producers will suffer the most from rising food prices. In this context, it would be interesting to examine the number of poor individuals who stand to lose from such price increases. For policymakers in developing countries, it is imperative to investigate what would be the net impact of food price increase on poverty. In addition, concerns over rising food prices are mounting because such increase can undermine the gains from poverty reduction and human development that developing countries have experienced over the last decade or so.
Using household surveys and detailed price data, the study analyzed the impacts of higher food prices on the average standard of living and on poverty for the Philippines. The study showed the dominating effect of rising food prices on poverty over the period 2003–2006. In particular, the severity of poverty rose by 16.8% while the standard of living declined by about 1% over the period. The study also suggested that the decline in the standard of living due to food price increases was particularly greater for the poorest of the poor. At worse, these households struggling to meet the minimum standards of living might have no choice but to cut down their expenditures on health and children’s education.
Hence, safety measures will be required particularly for the poorest of the poor to be able to cushion the negative impact of higher food prices.
The study proposed an alternative price index for the poor called price index for the poor, which takes into account the consumption patterns of the poor. The most widely used �aspeyres price index is derived based on higher weights to commodities that are largely consumed by the rich. In this respect, the study argued that the PIP could be the more appropriate price index compared to the �aspeyres price index in assessing the effect of price changes on poverty. Based on PIP, the inflation rate faced by the poor was higher than the official rate that is based on the �aspeyres price index, by 0.2, 0.6, and 5.6 percentage points during the periods 2005–06, 2006–07, and 2007–2008, respectively. The PIP suggests that the inflation rate faced by the poor has been lower than the official inflation rate in the earlier period.
The study also found that compared to nonpoor consumers, inflation hits poor consumers harder. Specifically, the poor are highly sensitive to price changes in food, particularly staple food items such as rice. Estimates on the price elasticity of poverty by commodity suggest that a 10% increase in food prices will create an additional 2.3 million poor people, while a 10% increase in nonfood prices will drive an additional 1.7 million people into poverty. A 10% increase in the price of rice will force an additional 0.66 million people into poverty, while a 10% increase in fuel prices will cause an additional 0.16 million poor people.
Finally, the study found that the increase in food prices has been the major factor causing high inflation in the Philippines in recent periods. The nonfood items of consumption have played a relatively minor role. It is wiser thus to direct government policies toward stabilizing food prices. Moreover, given these current trends, monetary policy may not be an effective tool to combat rising inflation. Such policies may push the economy into recession, which will hurt the poor even more.
aPPendIx tables
erd WorkIng PaPer serIes no. 112 2�
APPENDIx tAbLEs
aPPendIx table a.1 annual InflatIon rates
REgIoN
INFLAtIoN RAtE bAsED oN thE LAsPEyREs PRICE INDEx
2000−01 2001−02 2002−0� 200�−0� 200�−0� 200�−0� 200�−0� 200�−0�
NCR 7.4 2.9 3.6 5.3 8.4 6.8 2.6 11.6CAR 6.9 1.6 7.4 7.2 6.6 5.3 1.7 12.8Ilocos Region 8.4 2.5 2.4 6.0 8.6 6.1 2.4 13.0Cagayan �alley 8.4 1.9 2.3 4.0 6.3 5.8 2.3 16.0Central �uzon 7.0 1.8 3.0 6.4 6.6 5.7 2.5 22.4CA�ABARZON 9.4 2.7 2.7 5.3 6.5 5.8 2.4 13.2MIMAROPA 8.9 2.2 2.1 4.0 6.9 5.5 3.0 16.3Bicol Region 7.1 2.9 3.1 6.2 6.2 5.3 3.1 16.2Western �isayas 6.8 2.7 4.1 4.8 7.0 4.3 2.7 16.8Central �isayas 8.9 4.3 5.6 5.2 6.1 5.5 2.2 15.6Eastern �isayas 7.6 2.8 2.6 4.7 5.6 5.5 2.7 18.4Zamboanga Peninsula 6.0 2.6 1.7 6.0 7.4 6.0 3.1 24.4Northern Mindanao 7.9 2.9 3.4 6.3 7.0 6.0 3.5 17.6Davao Region 7.1 3.5 2.5 7.7 8.1 5.6 2.7 15.8Soccsksargen 6.1 2.8 3.0 6.2 6.2 5.0 3.2 17.9Caraga 7.6 2.4 3.0 6.0 7.6 5.6 2.2 22.6ARMM 8.5 3.5 2.9 5.7 8.7 8.5 4.8 17.7Philippines 7.8 2.7 3.3 5.6 7.2 5.9 2.6 15.6
NCR = National Capital Region; CAR = Cordillera Autonomous Region; ARMM = Autonomous Region of Muslim Mindanao.Source: Author’s calculations.
2� May 2008
Has InflatIon Hurt tHe Poor? regIonal analysIs In tHe PHIlIPPInesHyun H. son
aPPendIx table a.1. continued.
REgIoN
INFLAtIoN RAtE FACED by thE PooR bAsED oN thE PRICE INDEx FoR thE PooR (hEADCouNt RAtIo)
2000−01 2001−02 2002−0� 200�−0� 200�−0� 200�−0� 200�−0� 200�−0�
NCR 6.4 2.5 3.7 5.2 8.1 6.6 2.9 16.0CAR 5.9 0.6 5.8 6.4 7.2 5.4 1.7 17.1Ilocos Region 7.6 2.5 2.0 5.6 8.9 5.9 2.4 16.1Cagayan �alley 7.3 2.0 2.6 4.0 6.8 6.3 2.3 18.8Central �uzon 5.9 1.5 2.6 6.2 6.5 5.9 2.6 24.4CA�ABARZON 7.6 2.3 2.6 4.9 6.1 5.8 2.6 18.2MIMAROPA 8.1 2.0 1.8 3.5 7.4 6.0 3.3 18.5Bicol Region 6.0 2.7 2.9 6.2 6.3 5.5 3.5 20.1Western �isayas 6.0 2.4 3.0 4.2 7.6 4.6 3.0 19.4Central �isayas 7.4 4.6 5.4 5.7 6.5 6.2 2.3 18.7Eastern �isayas 6.7 2.7 2.5 4.9 6.3 6.2 3.0 22.4Zamboanga Peninsula 4.8 3.1 1.5 5.9 7.2 5.9 3.3 27.7Northern Mindanao 6.1 2.7 3.6 7.3 7.0 6.3 3.8 20.4Davao Region 5.4 3.4 2.7 8.4 7.8 5.8 3.2 19.2Soccsksargen 4.7 2.8 3.0 6.7 6.5 5.1 3.7 19.8Caraga 5.9 2.6 2.9 6.8 8.2 5.8 2.1 25.1ARMM 8.2 3.5 2.9 6.0 9.0 8.5 4.8 17.9Philippines 6.5 2.6 3.0 5.6 7.1 5.9 3.0 20.0
NCR = National Capital Region; CAR = Cordillera Autonomous Region; ARMM = Autonomous Region of Muslim Mindanao.Source: Author’s calculations.
aPPendIx tables
erd WorkIng PaPer serIes no. 112 2�
aPPendIx table a.1. continued.
REgIoN
INFLAtIoN RAtE FACED by thE PooR bAsED oN thE PRICE INDEx FoR thE PooR(PovERty gAP RAtIo)
2000−01 2001−02 2002−0� 200�−0� 200�−0� 200�−0� 200�−0� 200�−0�
NCR 6.4 2.4 3.7 5.2 8.0 6.4 2.9 16.4CAR 5.9 0.3 5.9 6.2 7.4 5.7 1.7 18.2Ilocos Region 7.5 2.4 2.0 5.5 9.1 5.9 2.4 16.8Cagayan �alley 7.4 2.0 2.7 3.8 6.8 6.4 2.2 18.9Central �uzon 5.7 1.6 2.7 6.0 6.5 5.8 2.7 25.1CA�ABARZON 7.4 2.3 2.6 4.7 6.0 5.8 2.7 18.7MIMAROPA 8.4 1.8 1.7 3.3 7.7 6.2 3.5 19.4Bicol Region 5.9 2.4 2.8 6.0 6.2 5.6 3.5 20.9Western �isayas 6.0 2.2 2.7 3.9 7.6 4.6 3.1 19.8Central �isayas 7.4 4.5 5.2 6.1 6.7 6.3 2.5 20.1Eastern �isayas 6.4 2.7 2.4 4.9 6.5 6.3 3.0 22.6Zamboanga Peninsula 4.1 3.4 1.2 5.8 7.1 5.9 3.5 28.8Northern Mindanao 5.9 2.5 3.5 7.8 7.1 6.6 3.9 19.6Davao Region 4.9 3.3 2.8 8.7 7.6 5.9 3.3 20.1Soccsksargen 4.4 2.8 2.9 6.8 6.5 5.1 3.9 20.0Caraga 5.4 2.5 2.9 7.2 8.3 5.9 2.2 25.3ARMM 8.0 3.5 2.8 6.0 8.9 8.6 4.8 18.1Philippines 6.3 2.7 2.9 5.7 7.1 6.1 3.2 20.7
NCR = National Capital Region; CAR = Cordillera Autonomous Region; ARMM = Autonomous Region of Muslim Mindanao.Source: Author’s calculations.

2� May 2008
Has InflatIon Hurt tHe Poor? regIonal analysIs In tHe PHIlIPPInesHyun H. son
aPPendIx table a.1. continued.
REgIoN
INFLAtIoN RAtE FACED by thE PooR bAsED oN thE PRICE INDEx FoR thE PooR(sEvERIty oF PovERty)
2000−01 2001−02 2002−0� 200�−0� 200�−0� 200�−0� 200�−0� 200�−0�
NCR 6.2 2.4 3.6 5.2 7.9 6.3 2.9 16.8CAR 5.8 0.3 5.8 6.1 7.4 5.7 1.7 18.6Ilocos Region 7.4 2.4 1.9 5.4 9.2 5.9 2.4 17.2Cagayan �alley 7.3 2.0 2.8 3.8 6.9 6.5 2.2 19.1Central �uzon 5.6 1.6 2.8 5.9 6.4 5.8 2.7 25.5CA�ABARZON 7.2 2.3 2.7 4.6 6.0 5.8 2.7 19.2MIMAROPA 8.5 1.7 1.6 3.2 7.8 6.3 3.6 20.0Bicol Region 5.8 2.3 2.8 6.0 6.2 5.5 3.6 21.3Western �isayas 6.0 2.2 2.5 3.9 7.6 4.5 3.1 19.9Central �isayas 7.3 4.4 5.1 6.4 6.8 6.4 2.5 20.7Eastern �isayas 6.3 2.7 2.3 4.9 6.6 6.3 3.0 22.6Zamboanga Peninsula 3.9 3.5 1.1 5.7 6.9 5.9 3.5 28.7Northern Mindanao 5.8 2.4 3.5 8.1 7.1 6.7 4.0 19.4Davao Region 4.7 3.2 2.8 8.9 7.5 6.1 3.3 20.4Soccsksargen 4.1 2.8 2.9 6.9 6.5 5.1 4.0 20.2Caraga 5.1 2.4 2.9 7.3 8.3 6.0 2.2 25.1ARMM 8.0 3.5 2.8 6.0 8.9 8.6 4.8 18.2Philippines 6.2 2.7 2.9 5.8 7.1 6.2 3.3 21.1
NCR = National Capital Region; CAR = Cordillera Autonomous Region; ARMM = Autonomous Region of Muslim Mindanao.Source: Author’s calculations.
aPPendIx tables
erd WorkIng PaPer serIes no. 112 2�
aPPendIx table a.2annual food InflatIon rates
REgIoN
FooD INFLAtIoN RAtE bAsED oN thE LAsPEyREs PRICE INDEx
2000−01 2001−02 2002−0� 200�−0� 200�−0� 200�−0� 200�−0� 200�−0�
NCR 5.0 0.9 2.7 6.1 4.8 5.8 3.3 20.3CAR 4.1 0.2 2.8 7.0 7.5 4.5 1.5 21.4Ilocos Region 6.6 3.7 0.4 7.0 9.1 4.3 2.5 17.9Cagayan �alley 6.5 2.2 2.4 5.0 7.1 5.3 1.7 21.2Central �uzon 5.0 1.6 1.4 7.3 6.6 5.4 2.8 22.1CA�ABARZON 4.6 1.9 1.5 5.6 5.2 4.7 3.1 22.9MIMAROPA 7.1 1.7 0.5 3.6 8.3 7.1 4.3 23.3Bicol Region 4.5 2.7 1.7 6.4 6.2 5.3 4.2 27.2Western �isayas 4.2 2.2 1.3 4.4 8.1 5.0 3.6 23.0Central �isayas 5.0 5.1 6.9 6.6 7.5 6.7 2.2 20.8Eastern �isayas 5.0 2.9 1.4 5.5 7.3 6.6 3.7 27.1Zamboanga Peninsula 2.3 3.8 1.6 7.3 7.7 5.9 4.4 36.5Northern Mindanao 4.0 2.8 2.6 8.0 7.3 6.6 4.5 26.1Davao Region 2.8 3.7 2.5 10.5 8.1 4.7 3.9 24.9Soccsksargen 2.3 3.0 2.8 8.4 7.1 5.2 4.4 22.7Caraga 3.6 2.5 2.5 8.8 8.5 5.9 2.0 33.4ARMM 5.6 3.4 2.5 7.4 9.7 9.4 5.6 21.3Philippines 4.7 2.2 2.3 6.5 6.6 5.6 3.3 22.8
NCR = National Capital Region; CAR = Cordillera Autonomous Region; ARMM = Autonomous Region of Muslim Mindanao.Source: Author’s calculations.
2� May 2008
Has InflatIon Hurt tHe Poor? regIonal analysIs In tHe PHIlIPPInesHyun H. son
aPPendIx table a.2. continued.
REgIoN
FooD INFLAtIoN RAtE FACED by thE PooR bAsED oN thE PRICE INDEx FoR thE PooR(hEADCouNt RAtIo)
2000−01 2001−02 2002−0� 200�−0� 200�−0� 200�−0� 200�−0� 200�−0�
NCR 4.5 0.9 2.7 5.5 4.6 5.6 3.4 22.0CAR 3.8 -0.4 3.2 5.9 7.7 4.5 1.5 21.5Ilocos Region 6.0 3.2 0.5 6.0 9.4 4.3 2.4 18.8Cagayan �alley 5.9 2.2 2.5 4.3 7.2 5.6 1.7 21.3Central �uzon 4.6 1.5 1.4 6.7 6.3 5.1 2.8 22.5CA�ABARZON 4.3 1.7 1.6 4.8 4.9 4.7 3.1 24.1MIMAROPA 7.4 1.4 0.4 3.0 8.6 7.1 4.4 23.2Bicol Region 4.1 2.5 1.7 6.1 6.1 5.3 4.3 28.2Western �isayas 3.9 2.0 1.1 3.6 8.5 4.9 3.7 23.2Central �isayas 5.0 5.0 6.4 6.7 7.4 6.6 2.3 22.3Eastern �isayas 4.9 2.9 1.3 5.2 7.5 6.5 3.7 28.1Zamboanga Peninsula 1.9 4.1 1.1 6.9 7.2 5.7 4.4 35.9Northern Mindanao 3.6 2.6 2.8 8.4 7.1 6.7 4.6 25.0Davao Region 2.1 3.7 2.7 10.6 7.4 5.3 4.1 25.3Soccsksargen 1.8 3.0 2.8 8.3 7.0 5.1 4.7 22.2Caraga 2.8 2.8 2.4 8.9 8.6 5.6 2.1 31.7ARMM 5.5 3.3 2.5 7.5 9.7 9.3 5.6 21.1Philippines 4.3 2.6 2.2 6.2 7.1 5.7 3.5 24.3
NCR = National Capital Region; CAR = Cordillera Autonomous Region; ARMM = Autonomous Region of Muslim Mindanao.Source: Author’s calculations.

aPPendIx tables
erd WorkIng PaPer serIes no. 112 2�
aPPendIx table a.2. continued.
REgIoN
FooD INFLAtIoN RAtE FACED by thE PooR bAsED oN thE PRICE INDEx FoR thE PooR(PovERty gAP RAtIo)
2000−01 2001−02 2002−0� 200�−0� 200�−0� 200�−0� 200�−0� 200�−0�
NCR 4.3 0.8 2.7 5.6 4.7 5.3 3.4 23.2CAR 3.8 -0.5 3.3 5.5 7.8 4.6 1.4 21.7Ilocos Region 5.8 3.0 0.5 5.6 9.6 4.3 2.4 18.8Cagayan �alley 5.9 2.2 2.5 3.9 7.3 5.8 1.7 21.1Central �uzon 4.4 1.5 1.4 6.4 6.2 5.0 2.9 22.8CA�ABARZON 4.0 1.8 1.6 4.4 4.8 4.7 3.1 24.3MIMAROPA 7.6 1.3 0.3 2.7 8.8 7.1 4.5 23.4Bicol Region 4.0 2.3 1.7 5.8 6.0 5.3 4.3 28.6Western �isayas 4.0 2.0 1.0 3.4 8.4 4.7 3.8 22.7Central �isayas 5.0 4.9 6.0 7.3 7.5 6.5 2.5 23.5Eastern �isayas 4.7 2.8 1.2 5.0 7.6 6.5 3.7 27.2Zamboanga Peninsula 1.5 4.2 0.7 6.5 6.8 5.5 4.4 34.3Northern Mindanao 3.2 2.4 2.7 9.0 7.0 7.0 4.7 23.0Davao Region 1.8 3.6 2.7 10.7 7.1 5.5 4.1 25.5Soccsksargen 1.4 3.0 2.7 8.3 6.9 5.1 4.9 22.0Caraga 2.1 2.6 2.4 9.2 8.6 5.7 2.2 31.0ARMM 5.3 3.2 2.3 7.5 9.7 9.3 5.5 21.0Philippines 4.1 2.7 2.2 6.3 7.3 5.9 3.7 24.7
NCR = National Capital Region; CAR = Cordillera Autonomous Region; ARMM = Autonomous Region of Muslim Mindanao. Source: Author’s calculations.

�0 May 2008
Has InflatIon Hurt tHe Poor? regIonal analysIs In tHe PHIlIPPInesHyun H. son
aPPendIx table a.2. continued.
REgIoN
FooD INFLAtIoN RAtE FACED by thE PooR bAsED oN thE PRICE INDEx FoR thE PooR(sEvERIty oF PovERty)
2000−01 2001−02 2002−0� 200�−0� 200�−0� 200�−0� 200�−0� 200�−0�
NCR 4.1 0.7 2.6 5.6 4.6 5.2 3.3 23.7CAR 3.7 -0.6 3.3 5.4 7.9 4.6 1.4 21.8Ilocos Region 5.6 2.9 0.4 5.4 9.7 4.3 2.3 18.8Cagayan �alley 5.9 2.3 2.6 3.8 7.3 5.8 1.7 21.1Central �uzon 4.3 1.5 1.3 6.2 6.1 5.0 2.9 22.9CA�ABARZON 3.9 1.7 1.7 4.1 4.6 4.7 3.2 24.5MIMAROPA 7.6 1.2 0.2 2.5 8.9 7.1 4.5 23.7Bicol Region 4.1 2.1 1.7 5.8 6.0 5.3 4.4 28.6Western �isayas 4.1 1.9 1.0 3.3 8.2 4.6 3.8 22.5Central �isayas 5.0 4.7 5.9 7.7 7.6 6.4 2.6 24.0Eastern �isayas 4.5 2.7 1.2 4.9 7.6 6.5 3.7 26.9Zamboanga Peninsula 1.3 4.3 0.5 6.2 6.6 5.3 4.3 33.4Northern Mindanao 3.0 2.3 2.7 9.3 7.0 7.1 4.8 22.1Davao Region 1.6 3.6 2.8 10.9 6.8 5.7 4.1 25.4Soccsksargen 1.3 3.0 2.7 8.4 6.9 5.1 5.0 22.0Caraga 1.7 2.5 2.5 9.3 8.6 5.8 2.3 30.4ARMM 5.3 3.2 2.3 7.4 9.7 9.3 5.5 20.9Philippines 4.0 2.8 2.2 6.3 7.3 6.0 3.8 24.9
NCR = National Capital Region; CAR = Cordillera Autonomous Region; ARMM = Autonomous Region of Muslim Mindanao.Source: Author’s calculations.
aPPendIx tables
erd WorkIng PaPer serIes no. 112 �1
aPPendIx table a.3annual rIce InflatIon rates
REgIoN 2000−01 2001−02 2002−0� 200�−0� 200�−0� 200�−0� 200�−0� 200�−0�
NCR 0.1 1.2 2.0 0.3 4.0 1.8 4.3 36.8CAR 2.3 -1.9 4.4 1.0 9.0 4.8 2.3 24.7Ilocos Region 2.8 0.3 1.6 1.7 12.2 4.1 1.9 19.8Cagayan �alley 2.6 3.4 3.4 -0.5 8.4 6.8 2.3 14.8Central �uzon 0.7 1.1 1.5 1.8 4.0 3.4 4.1 23.4CA�ABARZON 0.9 1.3 2.0 0.5 2.5 3.9 3.1 28.9MIMAROPA 9.4 -0.6 0.1 -0.6 11.4 5.7 5.0 21.0Bicol Region 1.8 0.4 1.6 2.0 6.2 5.7 4.0 38.6Western �isayas 1.6 1.2 0.6 0.0 11.5 2.6 3.5 17.2Central �isayas 0.4 4.4 6.4 3.8 5.2 4.6 0.3 8.3Eastern �isayas 3.0 3.1 0.6 3.6 9.0 5.9 3.6 25.7Zamboanga Peninsula 0.2 2.0 0.2 6.9 7.5 3.8 3.9 19.9Northern Mindanao -0.5 3.3 3.8 7.2 6.6 2.1 3.4 11.5Davao Region 0.9 4.1 1.2 7.1 9.0 2.7 2.8 18.7Soccsksargen 0.1 4.1 2.1 6.2 6.8 2.4 5.6 12.0Caraga -1.9 7.3 1.8 8.1 9.4 2.6 2.1 14.4ARMM 1.0 1.1 0.4 9.7 9.7 5.4 3.6 15.1Philippines 1.3 1.8 1.9 2.5 6.8 3.8 3.4 22.9
NCR = National Capital Region; CAR = Cordillera Autonomous Region; ARMM = Autonomous Region of Muslim Mindanao. Source: Author’s calculations.
�2 May 2008
Has InflatIon Hurt tHe Poor? regIonal analysIs In tHe PHIlIPPInesHyun H. son
aPPendIx table a.4Percentage contrIbutIon of food to total InflatIon rate
REgIoN 2000−01 2001−02 2002−0� 200�−0� 200�−0� 200�−0� 200�−0� 200�−0�
NCR 24.9 11.0 28.8 42.0 21.7 33.8 48.2 64.9CAR 24.8 4.8 15.8 40.6 46.9 36.6 38.4 67.5Ilocos Region 36.1 68.5 6.4 53.1 49.1 33.5 46.3 66.1Cagayan �alley 34.4 49.1 44.8 56.8 51.7 42.6 32.8 62.6Central �uzon 31.1 36.7 20.8 50.2 45.2 43.3 47.6 42.6CA�ABARZON 19.7 27.2 23.0 42.1 32.4 34.1 51.9 69.6MIMAROPA 34.3 32.7 11.0 39.4 52.5 56.6 61.9 63.3Bicol Region 28.3 41.9 25.0 45.9 44.5 45.1 59.5 74.9Western �isayas 25.9 33.2 13.0 39.3 49.6 49.7 55.3 57.9Central �isayas 24.5 50.9 54.4 55.5 54.3 54.0 44.3 60.0Eastern �isayas 29.7 46.5 24.9 52.6 59.6 55.1 61.8 68.8Zamboanga Peninsula 17.6 64.0 42.0 55.2 47.7 46.3 64.9 68.3Northern Mindanao 21.6 39.8 32.0 53.3 44.3 48.6 55.0 62.5Davao Region 17.2 44.6 42.1 58.6 43.8 38.6 62.7 69.3Soccsksargen 17.5 48.3 43.1 61.5 53.3 50.4 63.9 58.9Caraga 21.8 47.5 38.3 65.6 51.4 49.3 42.5 67.8ARMM 33.4 47.9 43.5 65.5 57.0 56.5 58.5 61.6Philippines 25.3 33.3 28.7 48.1 38.9 40.9 51.9 61.9
NCR = National Capital Region; CAR = Cordillera Autonomous Region; ARMM = Autonomous Region of Muslim Mindanao.Source: Author’s calculations.
aPPendIx tables
erd WorkIng PaPer serIes no. 112 ��
aPPendIx table a.5PrIce elastIcIty of Poverty for rIce
REgIoN
PRICE ELAstICIty WIth REsPECt to ADDItIoNALNumbER oF PooR
DuE to 10% INCREAsE IN PRICE
(IN mILLIoNs)
AvERAgE stANDARD oF
LIvINg hEADCouNtPovERty gAP
RAtIosEvERIty oF
PovERty
NCR -0.04 0.46 0.58 0.68 0.02CAR -0.09 0.55 1.02 1.25 0.01Ilocos Region -0.11 0.60 1.01 1.30 0.04Cagayan �alley -0.10 0.40 0.70 0.92 0.03Central �uzon -0.07 0.44 0.70 0.89 0.06CA�ABARZON -0.06 0.38 0.62 0.80 0.06MIMAROPA -0.13 0.35 0.71 0.92 0.04Bicol Region -0.11 0.25 0.48 0.65 0.06Western �isayas -0.12 0.47 0.82 1.06 0.08Central �isayas -0.07 0.18 0.23 0.25 0.04Eastern �isayas -0.14 0.35 0.67 0.92 0.06Zamboanga Peninsula -0.09 0.13 0.20 0.23 0.02Northern Mindanao -0.08 0.21 0.25 0.26 0.02Davao Region -0.08 0.21 0.34 0.39 0.02Soccsksargen -0.12 0.41 0.66 0.81 0.04Caraga -0.12 0.36 0.58 0.71 0.03ARMM -0.17 0.23 0.46 0.63 0.04Philippines -0.08 0.32 0.51 0.62 0.66
NCR = National Capital Region; CAR = Cordillera Autonomous Region; ARMM = Autonomous Region of Muslim Mindanao. Source: Author’s calculations.
�� May 2008
Has InflatIon Hurt tHe Poor? regIonal analysIs In tHe PHIlIPPInesHyun H. son
aPPendIx table a.6Percentage cHange In average standard of lIvIng due to PrIce cHanges
REgIoN
DuE to ALL PRICE ChANgEs
2000−01 2001−02 2002−0� 200�−0� 200�−0� 200�−0� 200�−0� 200�−0�
NCR -7.41 -2.89 -3.44 -5.36 -7.91 -6.38 -2.51 -11.69CAR -6.90 -1.55 -7.40 -7.06 -6.63 -5.05 -1.65 -12.76Ilocos Region -8.43 -2.48 -2.50 -6.00 -8.52 -5.84 -2.36 -12.56Cagayan �alley -8.42 -1.95 -2.34 -4.02 -6.16 -5.61 -2.30 -15.28Central �uzon -7.02 -1.88 -2.99 -6.28 -6.30 -5.38 -2.51 -22.44CA�ABARZON -9.38 -2.72 -2.67 -5.26 -6.24 -5.58 -2.38 -13.20MIMAROPA -8.91 -2.25 -2.07 -3.93 -6.85 -5.40 -3.01 -15.85Bicol Region -7.08 -2.86 -3.05 -6.14 -6.09 -5.19 -3.15 -16.28Western �isayas -6.84 -2.74 -4.07 -4.69 -6.96 -4.21 -2.72 -16.45Central �isayas -8.94 -4.35 -5.58 -5.22 -5.98 -5.38 -2.14 -14.73Eastern �isayas -7.62 -2.79 -2.57 -4.67 -5.52 -5.40 -2.67 -17.63Zamboanga Peninsula -5.97 -2.71 -1.72 -5.93 -7.21 -5.69 -3.04 -23.48Northern Mindanao -7.90 -2.94 -3.46 -6.32 -6.90 -5.74 -3.39 -17.03Davao Region -7.08 -3.53 -2.54 -7.79 -8.00 -5.28 -2.69 -15.30Soccsksargen -6.10 -2.86 -2.99 -6.31 -6.16 -4.78 -3.20 -17.43Caraga -7.61 -2.46 -2.98 -6.13 -7.56 -5.44 -2.19 -22.18ARMM -8.54 -3.52 -2.88 -5.84 -8.61 -8.35 -4.74 -17.10Philippines -7.80 -2.76 -3.24 -5.60 -6.98 -5.67 -2.61 -15.26
REgIoN
DuE to FooD PRICE ChANgEs
2000–01 2001–02 2002–0� 200�–0� 200�–0� 200�–0� 200�–0� 200�–0�
NCR -1.85 -0.32 -0.99 -2.25 -1.71 -2.16 -1.21 -7.58CAR -1.71 -0.07 -1.17 -2.86 -3.11 -1.85 -0.63 -8.62Ilocos Region -3.04 -1.70 -0.16 -3.18 -4.18 -1.96 -1.09 -8.30Cagayan �alley -2.89 -0.96 -1.05 -2.28 -3.19 -2.39 -0.75 -9.57Central �uzon -2.18 -0.69 -0.62 -3.15 -2.85 -2.33 -1.19 -9.56CA�ABARZON -1.84 -0.74 -0.61 -2.21 -2.02 -1.90 -1.23 -9.18MIMAROPA -3.06 -0.73 -0.23 -1.55 -3.60 -3.06 -1.86 -10.03Bicol Region -2.00 -1.20 -0.76 -2.82 -2.71 -2.34 -1.87 -12.19Western �isayas -1.78 -0.91 -0.53 -1.84 -3.45 -2.09 -1.51 -9.53Central �isayas -2.19 -2.21 -3.03 -2.90 -3.25 -2.91 -0.95 -8.84Eastern �isayas -2.27 -1.29 -0.64 -2.46 -3.29 -2.97 -1.65 -12.12Zamboanga Peninsula -1.05 -1.73 -0.72 -3.27 -3.44 -2.63 -1.97 -16.04Northern Mindanao -1.70 -1.17 -1.11 -3.37 -3.06 -2.79 -1.86 -10.65Davao Region -1.21 -1.58 -1.07 -4.56 -3.50 -2.04 -1.69 -10.60Soccsksargen -1.07 -1.38 -1.29 -3.88 -3.29 -2.41 -2.04 -10.26Caraga -1.66 -1.17 -1.14 -4.02 -3.88 -2.68 -0.93 -15.04ARMM -2.85 -1.68 -1.25 -3.83 -4.91 -4.72 -2.77 -10.54Philippines -1.97 -0.92 -0.93 -2.69 -2.72 -2.32 -1.35 -9.45
NCR = National Capital Region; CAR = Cordillera Autonomous Region; ARMM = Autonomous Region of Muslim Mindanao. Source: Author’s calculations.
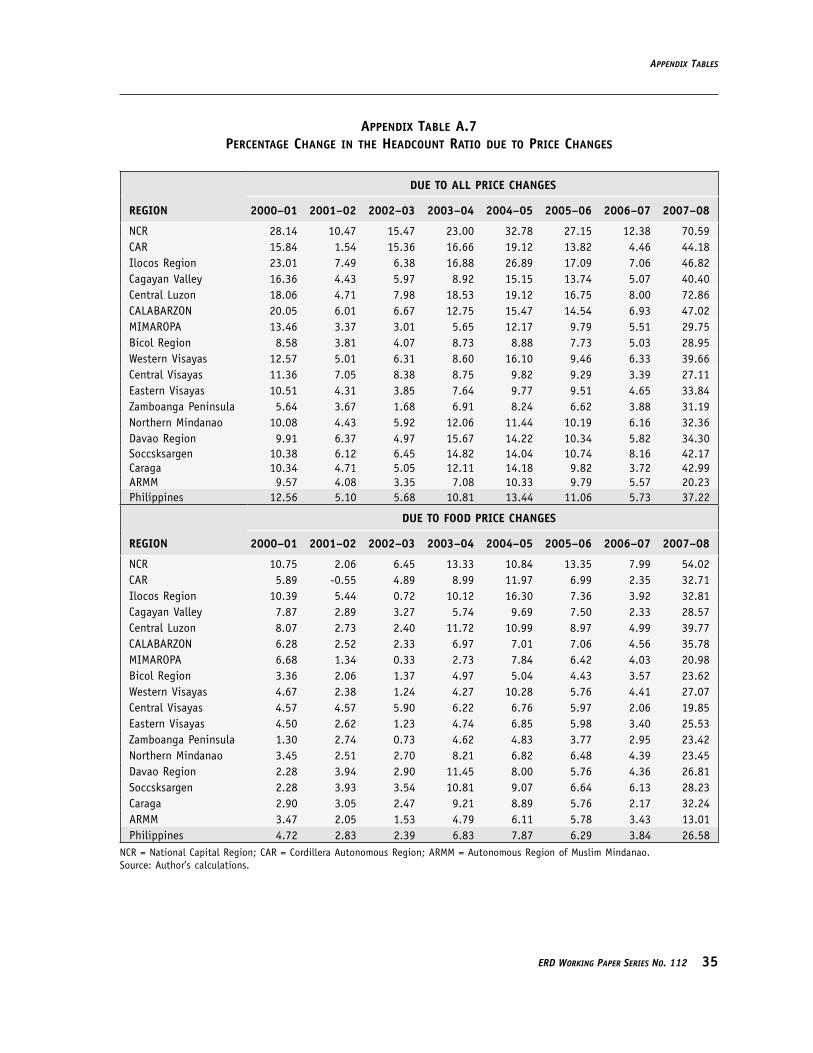
aPPendIx tables
erd WorkIng PaPer serIes no. 112 ��
aPPendIx table a.7Percentage cHange In tHe Headcount ratIo due to PrIce cHanges
REgIoN
DuE to ALL PRICE ChANgEs
2000−01 2001−02 2002−0� 200�−0� 200�−0� 200�−0� 200�−0� 200�−0�
NCR 28.14 10.47 15.47 23.00 32.78 27.15 12.38 70.59CAR 15.84 1.54 15.36 16.66 19.12 13.82 4.46 44.18Ilocos Region 23.01 7.49 6.38 16.88 26.89 17.09 7.06 46.82Cagayan �alley 16.36 4.43 5.97 8.92 15.15 13.74 5.07 40.40Central �uzon 18.06 4.71 7.98 18.53 19.12 16.75 8.00 72.86CA�ABARZON 20.05 6.01 6.67 12.75 15.47 14.54 6.93 47.02MIMAROPA 13.46 3.37 3.01 5.65 12.17 9.79 5.51 29.75Bicol Region 8.58 3.81 4.07 8.73 8.88 7.73 5.03 28.95Western �isayas 12.57 5.01 6.31 8.60 16.10 9.46 6.33 39.66Central �isayas 11.36 7.05 8.38 8.75 9.82 9.29 3.39 27.11Eastern �isayas 10.51 4.31 3.85 7.64 9.77 9.51 4.65 33.84Zamboanga Peninsula 5.64 3.67 1.68 6.91 8.24 6.62 3.88 31.19Northern Mindanao 10.08 4.43 5.92 12.06 11.44 10.19 6.16 32.36Davao Region 9.91 6.37 4.97 15.67 14.22 10.34 5.82 34.30Soccsksargen 10.38 6.12 6.45 14.82 14.04 10.74 8.16 42.17Caraga 10.34 4.71 5.05 12.11 14.18 9.82 3.72 42.99ARMM 9.57 4.08 3.35 7.08 10.33 9.79 5.57 20.23Philippines 12.56 5.10 5.68 10.81 13.44 11.06 5.73 37.22
REgIoN
DuE to FooD PRICE ChANgEs
2000−01 2001−02 2002−0� 200�−0� 200�−0� 200�−0� 200�−0� 200�−0�
NCR 10.75 2.06 6.45 13.33 10.84 13.35 7.99 54.02CAR 5.89 -0.55 4.89 8.99 11.97 6.99 2.35 32.71Ilocos Region 10.39 5.44 0.72 10.12 16.30 7.36 3.92 32.81Cagayan �alley 7.87 2.89 3.27 5.74 9.69 7.50 2.33 28.57Central �uzon 8.07 2.73 2.40 11.72 10.99 8.97 4.99 39.77CA�ABARZON 6.28 2.52 2.33 6.97 7.01 7.06 4.56 35.78MIMAROPA 6.68 1.34 0.33 2.73 7.84 6.42 4.03 20.98Bicol Region 3.36 2.06 1.37 4.97 5.04 4.43 3.57 23.62Western �isayas 4.67 2.38 1.24 4.27 10.28 5.76 4.41 27.07Central �isayas 4.57 4.57 5.90 6.22 6.76 5.97 2.06 19.85Eastern �isayas 4.50 2.62 1.23 4.74 6.85 5.98 3.40 25.53Zamboanga Peninsula 1.30 2.74 0.73 4.62 4.83 3.77 2.95 23.42Northern Mindanao 3.45 2.51 2.70 8.21 6.82 6.48 4.39 23.45Davao Region 2.28 3.94 2.90 11.45 8.00 5.76 4.36 26.81Soccsksargen 2.28 3.93 3.54 10.81 9.07 6.64 6.13 28.23Caraga 2.90 3.05 2.47 9.21 8.89 5.76 2.17 32.24ARMM 3.47 2.05 1.53 4.79 6.11 5.78 3.43 13.01Philippines 4.72 2.83 2.39 6.83 7.87 6.29 3.84 26.58
NCR = National Capital Region; CAR = Cordillera Autonomous Region; ARMM = Autonomous Region of Muslim Mindanao. Source: Author’s calculations.
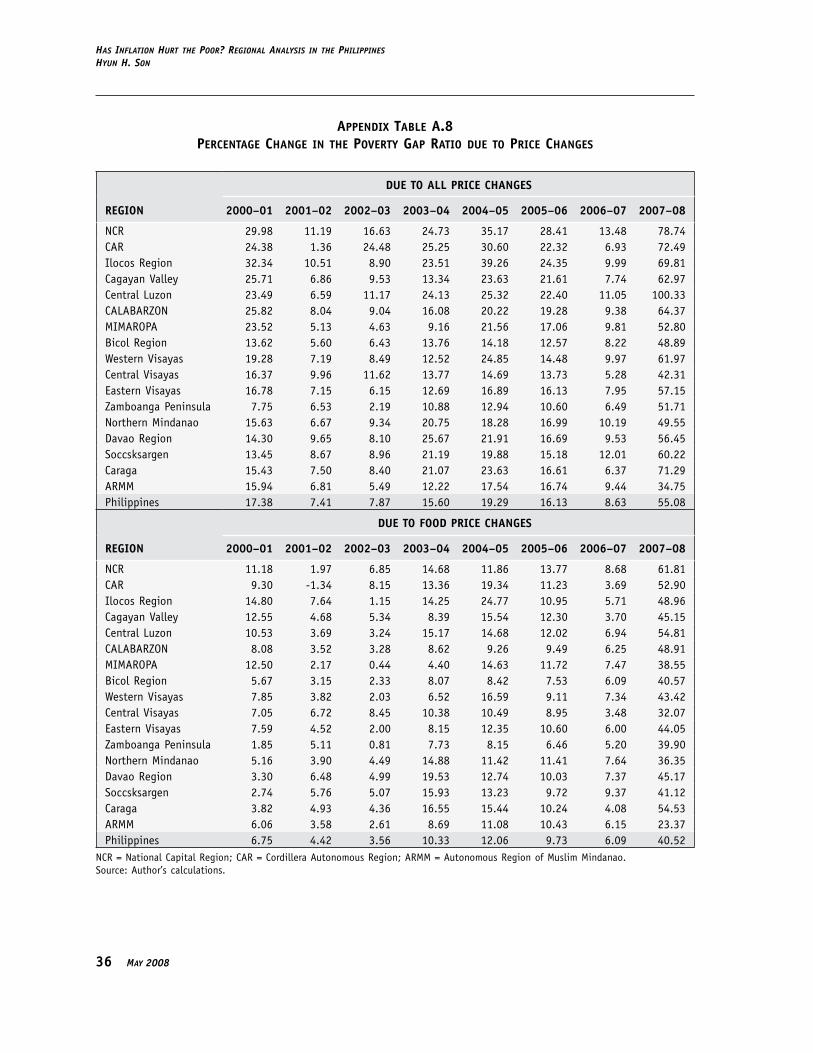
�� May 2008
Has InflatIon Hurt tHe Poor? regIonal analysIs In tHe PHIlIPPInesHyun H. son
aPPendIx table a.8Percentage cHange In tHe Poverty gaP ratIo due to PrIce cHanges
REgIoN
DuE to ALL PRICE ChANgEs
2000−01 2001−02 2002−0� 200�−0� 200�−0� 200�−0� 200�−0� 200�−0�
NCR 29.98 11.19 16.63 24.73 35.17 28.41 13.48 78.74CAR 24.38 1.36 24.48 25.25 30.60 22.32 6.93 72.49Ilocos Region 32.34 10.51 8.90 23.51 39.26 24.35 9.99 69.81Cagayan �alley 25.71 6.86 9.53 13.34 23.63 21.61 7.74 62.97Central �uzon 23.49 6.59 11.17 24.13 25.32 22.40 11.05 100.33CA�ABARZON 25.82 8.04 9.04 16.08 20.22 19.28 9.38 64.37MIMAROPA 23.52 5.13 4.63 9.16 21.56 17.06 9.81 52.80Bicol Region 13.62 5.60 6.43 13.76 14.18 12.57 8.22 48.89Western �isayas 19.28 7.19 8.49 12.52 24.85 14.48 9.97 61.97Central �isayas 16.37 9.96 11.62 13.77 14.69 13.73 5.28 42.31Eastern �isayas 16.78 7.15 6.15 12.69 16.89 16.13 7.95 57.15Zamboanga Peninsula 7.75 6.53 2.19 10.88 12.94 10.60 6.49 51.71Northern Mindanao 15.63 6.67 9.34 20.75 18.28 16.99 10.19 49.55Davao Region 14.30 9.65 8.10 25.67 21.91 16.69 9.53 56.45Soccsksargen 13.45 8.67 8.96 21.19 19.88 15.18 12.01 60.22Caraga 15.43 7.50 8.40 21.07 23.63 16.61 6.37 71.29ARMM 15.94 6.81 5.49 12.22 17.54 16.74 9.44 34.75Philippines 17.38 7.41 7.87 15.60 19.29 16.13 8.63 55.08
REgIoN
DuE to FooD PRICE ChANgEs
2000−01 2001−02 2002−0� 200�−0� 200�−0� 200�−0� 200�−0� 200�−0�
NCR 11.18 1.97 6.85 14.68 11.86 13.77 8.68 61.81CAR 9.30 -1.34 8.15 13.36 19.34 11.23 3.69 52.90Ilocos Region 14.80 7.64 1.15 14.25 24.77 10.95 5.71 48.96Cagayan �alley 12.55 4.68 5.34 8.39 15.54 12.30 3.70 45.15Central �uzon 10.53 3.69 3.24 15.17 14.68 12.02 6.94 54.81CA�ABARZON 8.08 3.52 3.28 8.62 9.26 9.49 6.25 48.91MIMAROPA 12.50 2.17 0.44 4.40 14.63 11.72 7.47 38.55Bicol Region 5.67 3.15 2.33 8.07 8.42 7.53 6.09 40.57Western �isayas 7.85 3.82 2.03 6.52 16.59 9.11 7.34 43.42Central �isayas 7.05 6.72 8.45 10.38 10.49 8.95 3.48 32.07Eastern �isayas 7.59 4.52 2.00 8.15 12.35 10.60 6.00 44.05Zamboanga Peninsula 1.85 5.11 0.81 7.73 8.15 6.46 5.20 39.90Northern Mindanao 5.16 3.90 4.49 14.88 11.42 11.41 7.64 36.35Davao Region 3.30 6.48 4.99 19.53 12.74 10.03 7.37 45.17Soccsksargen 2.74 5.76 5.07 15.93 13.23 9.72 9.37 41.12Caraga 3.82 4.93 4.36 16.55 15.44 10.24 4.08 54.53ARMM 6.06 3.58 2.61 8.69 11.08 10.43 6.15 23.37Philippines 6.75 4.42 3.56 10.33 12.06 9.73 6.09 40.52
NCR = National Capital Region; CAR = Cordillera Autonomous Region; ARMM = Autonomous Region of Muslim Mindanao. Source: Author’s calculations.
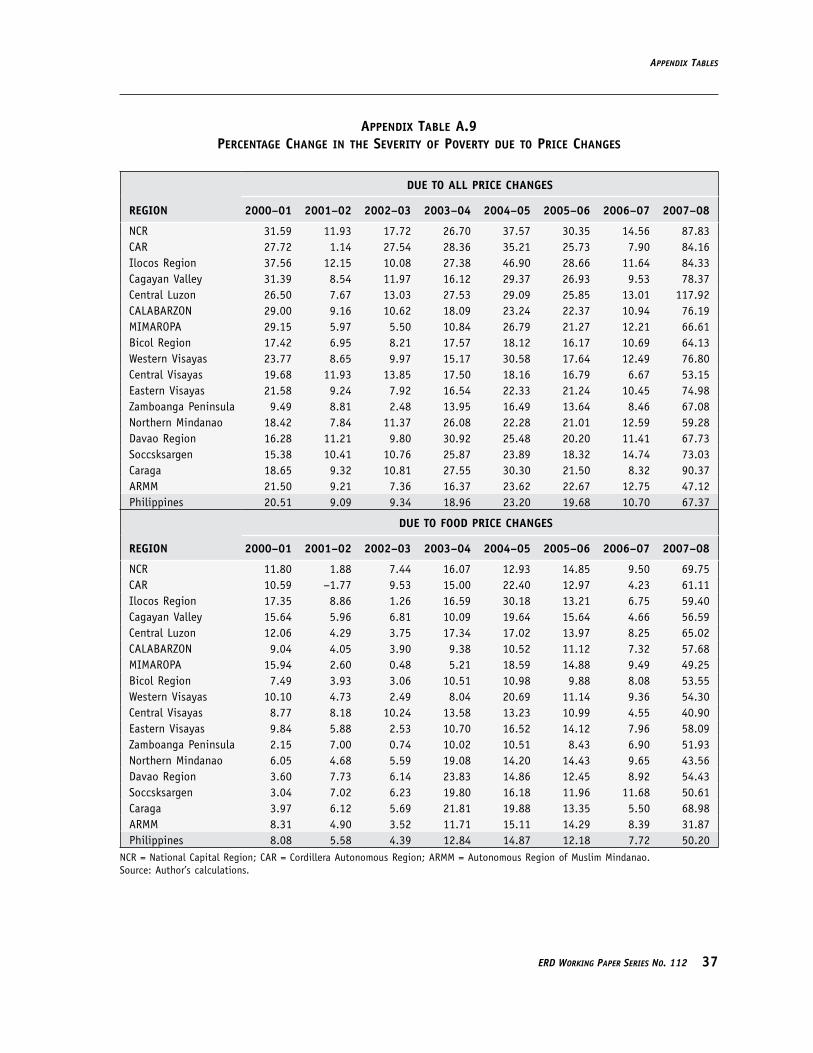
aPPendIx tables
erd WorkIng PaPer serIes no. 112 ��
aPPendIx table a.9Percentage cHange In tHe severIty of Poverty due to PrIce cHanges
REgIoN
DuE to ALL PRICE ChANgEs
2000−01 2001−02 2002−0� 200�−0� 200�−0� 200�−0� 200�−0� 200�−0�
NCR 31.59 11.93 17.72 26.70 37.57 30.35 14.56 87.83CAR 27.72 1.14 27.54 28.36 35.21 25.73 7.90 84.16Ilocos Region 37.56 12.15 10.08 27.38 46.90 28.66 11.64 84.33Cagayan �alley 31.39 8.54 11.97 16.12 29.37 26.93 9.53 78.37Central �uzon 26.50 7.67 13.03 27.53 29.09 25.85 13.01 117.92CA�ABARZON 29.00 9.16 10.62 18.09 23.24 22.37 10.94 76.19MIMAROPA 29.15 5.97 5.50 10.84 26.79 21.27 12.21 66.61Bicol Region 17.42 6.95 8.21 17.57 18.12 16.17 10.69 64.13Western �isayas 23.77 8.65 9.97 15.17 30.58 17.64 12.49 76.80Central �isayas 19.68 11.93 13.85 17.50 18.16 16.79 6.67 53.15Eastern �isayas 21.58 9.24 7.92 16.54 22.33 21.24 10.45 74.98Zamboanga Peninsula 9.49 8.81 2.48 13.95 16.49 13.64 8.46 67.08Northern Mindanao 18.42 7.84 11.37 26.08 22.28 21.01 12.59 59.28Davao Region 16.28 11.21 9.80 30.92 25.48 20.20 11.41 67.73Soccsksargen 15.38 10.41 10.76 25.87 23.89 18.32 14.74 73.03Caraga 18.65 9.32 10.81 27.55 30.30 21.50 8.32 90.37ARMM 21.50 9.21 7.36 16.37 23.62 22.67 12.75 47.12Philippines 20.51 9.09 9.34 18.96 23.20 19.68 10.70 67.37
REgIoN
DuE to FooD PRICE ChANgEs
2000−01 2001−02 2002−0� 200�−0� 200�−0� 200�−0� 200�−0� 200�−0�
NCR 11.80 1.88 7.44 16.07 12.93 14.85 9.50 69.75CAR 10.59 −1.77 9.53 15.00 22.40 12.97 4.23 61.11Ilocos Region 17.35 8.86 1.26 16.59 30.18 13.21 6.75 59.40Cagayan �alley 15.64 5.96 6.81 10.09 19.64 15.64 4.66 56.59Central �uzon 12.06 4.29 3.75 17.34 17.02 13.97 8.25 65.02CA�ABARZON 9.04 4.05 3.90 9.38 10.52 11.12 7.32 57.68MIMAROPA 15.94 2.60 0.48 5.21 18.59 14.88 9.49 49.25Bicol Region 7.49 3.93 3.06 10.51 10.98 9.88 8.08 53.55Western �isayas 10.10 4.73 2.49 8.04 20.69 11.14 9.36 54.30Central �isayas 8.77 8.18 10.24 13.58 13.23 10.99 4.55 40.90Eastern �isayas 9.84 5.88 2.53 10.70 16.52 14.12 7.96 58.09Zamboanga Peninsula 2.15 7.00 0.74 10.02 10.51 8.43 6.90 51.93Northern Mindanao 6.05 4.68 5.59 19.08 14.20 14.43 9.65 43.56Davao Region 3.60 7.73 6.14 23.83 14.86 12.45 8.92 54.43Soccsksargen 3.04 7.02 6.23 19.80 16.18 11.96 11.68 50.61Caraga 3.97 6.12 5.69 21.81 19.88 13.35 5.50 68.98ARMM 8.31 4.90 3.52 11.71 15.11 14.29 8.39 31.87Philippines 8.08 5.58 4.39 12.84 14.87 12.18 7.72 50.20
NCR = National Capital Region; CAR = Cordillera Autonomous Region; ARMM = Autonomous Region of Muslim Mindanao. Source: Author’s calculations.
�� May 2008
Has InflatIon Hurt tHe Poor? regIonal analysIs In tHe PHIlIPPInesHyun H. son
REFERENCEs
Arrow, K. J. 1958. “The Measurement of Price Changes.” In Joint Economic Committee, US Congress, The Relationship of Prices to Economic Stability and Growth. Washington, DC.
ADB. 2008. “Food Prices and Inflation in Developing Asia: Is Poverty Reduction Coming to an End?” A Special Report by the Economics and Research Department. Asian Development Bank, Manila.
Balisacan, A. 1999. “Poverty Profile in the Philippines.” University of the Philippines, Manila. Unpublished.Foster, J., J. Greer, and E. Thorbecke. 1984. “A Class of Decomposable Poverty Measures.” Econometrica
52(3):761–66.Hicks, J. R. 1946. Value and Capital. Oxford: Clarendon Press.Son, H. H., and N. Kakwani. 2008. “Measuring the Impact of Price Changes on Poverty.” The Journal of
Economic Inequality. Forthcoming.
Economics and REsEaRch dEpaRtmEnt
Printed in the Philippines
has inflation hurt the poor?Regional analysis in the philippines
Hyun H. Son
May 2008
about the paper
Hyun H. Son measures the impact of price changes on poverty using the Philippines as an example, and develops an empirically operational price index called the price index for the poor, which indicates whether the price changes hurt the poor relatively more than the nonpoor.
Asian Development Bank6 ADB Avenue, Mandaluyong City1550 Metro Manila, Philippineswww.adb.org/economicsISSN: 1655-5252Publication Stock No.
about the asian development Bank
ADB’s vision is an Asia and Pacific region free of poverty. Its mission is to help its developing member countries substantially reduce poverty and improve the quality of life of their people. Despite the region’s many successes, it remains home to two thirds of the world’s poor. Nearly 1.7 billion people in the region live on $2 or less a day. ADB is committed to reducing poverty through inclusive economic growth, environmentally sustainable growth, and regional integration.
Based in Manila, ADB is owned by 67 members, including 48 from the region. Its main instruments for helping its developing member countries are policy dialogue, loans, equity investments, guarantees, grants, and technical assistance. In 2007, it approved $10.1 billion of loans, $673 million of grant projects, and technical assistance amounting to $243 million.
ERD WoRking PaPER SERiES no. 112