abstract of childhood stunting in malawi
TRANSCRIPT
ABSTRACT
Title of Dissertation: RELATIVE IMPACTS OF DETERMINANTS
OF CHILDHOOD STUNTING IN MALAWI Jasbir Kaur, Doctor of Philosophy, 2019 Dissertation directed by: Dr. Mira Mehta, Department of Nutrition and
Food Science, and Prof. Sonalde Desai, Department of Sociology
Background: High rates of stunting have persisted in Malawi for several decades. There
is a need to better understand trends and determinants of childhood stunting in the
population to inform effective policies and programmatic interventions.
Objective: To analyze levels, trends, and distribution of stunting in a nationally-
representative population of Malawian children under age five, and to analyze
determinants and micronutrient levels associated with stunting in subset of children under
age two.
Design: The study analyzes data from the Malawi Demographic and Health Surveys in
2000, 2004, 2010 and 2015–16 and the Malawi Micronutrient Survey in 2015–16.
Stunting in children is defined as height-for-age index more than two standard deviations
below the reference medium. Bivariate and multivariate analyses are used to estimate the
change in stunting by socio-demographic variables, and impact of environmental
enteropathy, water sanitation and hygiene, access to food, infant and young child feeding
practices, women’s empowerment, domestic violence, and biomarkers of nutrition,
specifically iron- deficiency anemia and vitamin A deficiency controlled for
inflammation in children ages 0–59 months, adjusted for sampling design effects.
Setting: Malawi is a landlocked country, divided into three regions: the northern, central,
and southern regions.
Subjects: Children ages 0–59 months with data on anthropometric measurements from
the MDHS survey in 2000 (n=9,188), 2004 (n=8,090), 2010 (n=4,586), and 2016
(n=5,149), and from the MNS survey in 2015–16 (n=2,018).
Results: The prevalence of stunting decreased in children from 54.3 percent in 2000 to
36.6 percent in 2016. Child’s household structure (a finished roof), child’s age, gender,
birth order and birth interval, household wealth, land ownership, mother’s education,
mother’s stature and BMI, and mother’s age appear to be the strongest determinants of
childhood stunting. With addition of biomarkers of nutrition, inflammation, and inherited
disorders, age of the child, birth order, and mother’s report of child’s size at birth and
household hunger are major determinants of childhood stunting. At the cellular level,
serum ferritin, retinol binding protein, and sickle cell disease and alpha-thalassemia are
strongly associated with stunting in children.
RELATIVE IMPACTS OF DETERMINANTS OF CHILDHOOD STUNTING IN
MALAWI
by
Jasbir Kaur
Dissertation submitted to the Faculty of the Graduate School of the University of Maryland, College Park, in partial fulfillment
of the requirements for the degree of Doctor of Philosophy
2019 Advisory Committee: Dr. Mira Mehta, Chair Prof. Sonalde Desai, Co-chair Prof. Reeve Vanneman Prof. Nadine Sahyoun Prof. Joseph Sullivan

© Copyright by
Jasbir Kaur 2019
ii
Table of Contents Table of Contents ................................................................................................................ ii List of Abbreviations ........................................................................................................ vii Chapter 1: Introduction ....................................................................................................... 1
Malawi ............................................................................................................................ 2 Demographic and Health Surveys .................................................................................. 3 Malawi Micronutrient Survey ......................................................................................... 4 Research Objectives ........................................................................................................ 5
Chapter 2: Background and Review of Literature .............................................................. 7 Infant and young child feeding practices ........................................................................ 9 Household wealth, Food Access & Hunger .................................................................. 13 Environmental enteropathy and Water Sanitation and Hygiene (WASH)\ .................. 14 Maternal factors and women’s empowerment .............................................................. 19 Markers of nutrition, infection and inflammation ......................................................... 20
Chapter 3: Methods and Procedures ................................................................................. 26 Research Population...................................................................................................... 26 Variable Definitions ...................................................................................................... 28 Statistical Analysis ........................................................................................................ 39 Sampling, Weighting, and Stratification ....................................................................... 41 Ethical Approval ........................................................................................................... 43
Chapter 4: Results ............................................................................................................. 44 Paper I: Trends in childhood stunting: findings from Malawi, 2000-2016 .................. 44
Abstract ..................................................................................................................... 44 Introduction ............................................................................................................... 45 Methods..................................................................................................................... 46 Results ....................................................................................................................... 49 Discussion ................................................................................................................. 56 Conclusion ................................................................................................................ 61
Paper II: Determinants of Childhood Stunting in Malawi – an analysis of the data .... 62 from the Malawi Demographic and Health Survey, 2015-16 ....................................... 62
Abstract ..................................................................................................................... 62 Introduction ............................................................................................................... 63 Methods..................................................................................................................... 65 Results ....................................................................................................................... 70 Discussion ................................................................................................................. 78 Conclusion ................................................................................................................ 81
Paper III: Biomarkers of Nutrition, Infection, Inflammation and Childhood Stunting in Malawi .......................................................................................................................... 84
Abstract ..................................................................................................................... 84 Introduction ............................................................................................................... 85 Methods..................................................................................................................... 87 Results ....................................................................................................................... 94 Discussion ............................................................................................................... 102
iii
Conclusion .............................................................................................................. 110 Chapter 5: Discussion .................................................................................................... 112
Stunting – a health priority ......................................................................................... 112 Stunting trends ............................................................................................................ 113 Socio-demographic factors ......................................................................................... 113 Infant and young child feeding practices .................................................................... 115 Maternal factors, empowerment and decisiomaking .................................................. 118 Household hunger ....................................................................................................... 120 Biomarker of nutrition, inflammation, and inherited disorders .................................. 121 Infection and fever ...................................................................................................... 122 Birthweight, size at birth and MUAC ......................................................................... 122 Therapeutic supplements ............................................................................................ 123 Limitations .................................................................................................................. 125
iv
List of Tables Table 1.1 Stunting (HAZ <2 SD) in children age 0-59 months by background characteristics, Malawi Demographic and Health Survey (MDHS), 2000-2016 ........... 130 Table 1.2 Coefficient of change in HAZ for children 0-59 months for comparison years, MDHS 2000-2016 ........................................................................................................... 130 Table 1.3 Trend of odds of being stunted by survey year and other background characteristics in children 0-59 months, MDHS 2000-2016 .......................................... 130 Table 1.4 Change in stunting by background characteristics, MDHS 2000 - 2016........ 130 Table 1.5 Change in stunting (<2 SD) in children age 0-59 between survey years, MDHS 2000-2016 ....................................................................................................................... 130 Table 2.1 Number of children by anthropometric measurements, Malawi 2015-16 ...... 130 Table 2.2 Stunting in children 0-23 months by socio-demographic variables, Malawi 2015-16 ........................................................................................................................... 130 Table 2.3 Stunting in children 0-23 months by household environment and WASH practices, Malawi 2015-16 .............................................................................................. 130 Table 2.4 Stunting in children 0-23 months by infant and young child feeding practices, Malawi 2015-16 .............................................................................................................. 130 Table 2.5 Stunting in children 0-23 months by maternal factors, Malawi 2015-16 ....... 130 Table 2.6 Stunting in children age 0-23 months by maternal decisionmaking and empowerment, Malawi 2015-16 ..................................................................................... 130 Table 2.7 Model I: Logistic regression model for association of socio-demographic factors and stunting in children 0-23 months, Malawi 2015-16 ..................................... 130 Table 2.8a Model II: Logistic regression model for association of access to food and stunting in children 0-23 months, Malawi 2015-16 ........................................................ 130 Table 2.9a Model III: Logistic regression model for association of children's environment/WASH and stunting in children 0-23 months, Malawi 2015-16 ............... 130 Table 2.10a Model IV: Logistic regression model for association of IYCF practices and stunting in children 0-23 months, Malawi 2015-16 ........................................................ 130 Table 2.11a Model V: Logistic regression model for association of maternal factors including empowerment and stunting in children in children 0-23 months, Malawi 2015-16..................................................................................................................................... 130 Table 2.8b Stepwise Model II: Logistic regression model for association of socio-demographic and access to food variables and stunting in children 0-23 months, Malawi 2015-16 ........................................................................................................................... 131 Table 2.9b Stepwise Model II: Logistic regression model for association of socio-demographic, access to food, household environment, sanitation and stunting in children 0-23 months, Malawi 2015-16 ........................................................................................ 131 Table 2.10b Stepwise Model II: Logistic regression model for association of socio-demographic, access to food, household environment, sanitation, child feeding practices and stunting in children 0-23 months, Malawi 2015-16 ................................................. 131 Table 2.11b Stepwise Model II: Logistic regression model for association of socio-demographic, access to food, household environment, sanitation, maternal factors,
v
empowerment, child feeding practices and stunting in children 0-23 months, Malawi 2015-16 ........................................................................................................................... 131 Table 2.12 Model V: Logistic regression model for association of maternal factors including empowerment and stunting in children in children 0-23 months, Malawi 2015-16..................................................................................................................................... 131 Table 3.0 Prevalence of stunting, wasting and underweight, MNS Survey 2015-16 ..... 131 Table 3.1 Prevalence of stunting by socio-demographic variables, MNS Survey 2015-16......................................................................................................................................... 131 Table 3.2a Prevalence of stunting among children age 0-5 years by infant and young child feeding practices, MNS Survey 2015-16 ............................................................... 131 Table 3.2b Prevalence of stunting among children age 0-2 years by infant and young child feeding practices, MNS Survey 2015-16 ............................................................... 131 Table 3.3 Prevalence of stunting in children by maternal factors, MNS Survey 2015-16......................................................................................................................................... 131 Table 3.4 Estimated mean and linearized standard errors of biomarkers of nutrition, MNS Survey 2015-16 ............................................................................................................... 131 Table 3.5 Prevalence of stunting in children by micronutrient status, MNS Survey, 2015-16..................................................................................................................................... 131 Table 3.6 Prevalence of stunting in children by household hunger, MNS Survey 2015-16......................................................................................................................................... 131 Table 3.7 Prevalence of stunting in children age 0-5 years by mother's perception of child size at birth, birthweight, and MUAC, MNS Survey 2015-16 ....................................... 131 Table 3.8 Prevalence of stunting by common infections and fever in children age 0-5 years, MNS Survey, 2015-16 .......................................................................................... 132 Table 3.9 Prevalence of stunting in children by therapeutic supplements and prevention to infection, MNS Survey, 2015-16 .................................................................................... 132 Table 3.10 Prevalence of stunting among children age 0-5 years by social intervention programs, MNS Survey 2015-16 .................................................................................... 132 Table 3.11 Multivariate analysis of determinates of childhood stunting, MNS Survey 2015-16 ........................................................................................................................... 132 Table 3.12 Multivariate analysis of biomarkers on childhood stunting, MNS Survey 2015-16 ........................................................................................................................... 132
vi
List of Figures
Figure 1.1 Stunting in children 0-59 months by age groups, MDHS 2000-16 ................. 50 Figure 1.2 Normal distribution curve for HAZ scores, MDHS 2000-16 .......................... 52 Figure 1.3 Mean HAZ score by survey year, MDHS 2000-16 ......................................... 53 Figure 1.4 Trend of odds being stunted by age-groups, MDHS 2000-16 ......................... 54 Figure 1.5 Stunting in children by wealth index, MDHS 2000-16 ................................... 54 Figure 2.1 Stunting in children by maternal factors, MDHS 2015-16 .............................. 74 Figure 3.1 Prevalence of stunting by age groups, MDHS 2015-16 .................................. 94 Figure 3.2 Odds of stunting in children by biomarkers, MDHS 2015-16 ...................... 102
vii
List of Abbreviations
AGP alpha-1-acid glycoprotein AIDS acquired immunodeficiency syndrome EA enumeration area CDC Centers for Disease Control and Prevention CHSU Community Health Services Unit CRP C-reactive protein DBS dried blood spots DHS Demographic and Health Survey FISP farm input subsidy program G6PD glucose 6-phosphate dehydrogenase GOM Government of Malawi GPS Global Positioning System HAZ Height-for-age Z-score HHS household hunger scale HIV human immunodeficiency virus HPLC high performance liquid chromatography IDA iron deficiency anemia IRB Institutional Review Board LNS lipid based nutrient supplement MAM Moderate acute malnutrition MDHS Malawi Demographic and Health Survey MRDR modified relative dose response NCHS National Center for Health Statistics NSO National Statistical Office RBP retinol binding protein SAM severe acute malnutrition SD standard deviation sTfr soluble transferrin receptor sTfR serum transferrin receptor
viii
UNICEF United Nations Children’s Fund USAID United States Agency for International Development WAZ Weight-for-age Z-score ZOI Zone of Influence
1
Chapter 1: Introduction
Stunting, or low height-for-age, develops in the critical first thousand days of life
(from conception to 24 months postpartum). This is the critical period for child growth
[1]. Children who are stunted not only have short stature; stunting affect’s adult height,
and has devastating long-term consequences and suboptimal function, including impaired
health, survival, educational and economic performance later in life [2]. Other
consequences of stunting include a compromised immune system [3] and impaired
cognitive ability [4]. A growing body of research shows that stunting in the first two
years increases the risk of obesity due to impaired fat oxidation [5] and elevated blood
pressure [6]. In countries with high childhood stunting, prevalence of stunting starts to
rise at the age of about three months, and process of stunting slows down at around three
years of age. Thereafter, the mean height runs parallel to the reference. For younger
children (under 3 years), therefore, height-for-age reflects a process of “failing to grow”
or “stunting.”
In Sub-Saharan Africa, stunting rates are as high as 60 percent in children under
age 5. Yet in the past 2 decades, there has been minimal impact of nutritional programs
on stunting outcomes at the programmatic level, and the overall levels of stunting in Sub-
Saharan Africa have not changed much [1]. Earlier interventions in the nutrition field
assumed that children were not growing well because they were not eating foods dense in
protein and calories [7]. Findings from a review of over 35 efficacy trials and
intervention studies showed that children receiving dietary interventions grew an average
of 1.7 cm taller by 12–24 months than children who did not receive any nutrition
2
interventions. However, children receiving nutritional interventions did not achieve
“normal growth” [8].
Given the recent evolution in thinking about the causes of stunting and
undernutrition – i.e., that multiple dietary and non-dietary factors intersect and interact to
produce child nutritional outcomes, it is now globally recognized that multi-sectoral
nutrition approaches, including both nutrition-specific and nutrition-sensitive
interventions are required for accelerated progress.
The nutrition-specific interventions address the immediate determinants of
malnutrition such as dietary diversification, breastfeeding, complementary feeding,
micronutrient supplementation, feeding and care practice, food safety and food
processing among others. Whereas the nutrition-sensitive interventions address the
underlying and systemic causes of nutrition such as agriculture and food security, water,
sanitation, hygiene (WASH), women’s empowerment, girl’s and women’s education,
social safety nets, etc. [9, 10].
Malawi
Malawi has the fifth highest stunting rate in the world, and more than 53 percent
of children below the age of five were stunted in 2000 and 2004. The prevalence of
stunting decreased to 47 percent in 2010. Although the prevalence of stunting remains
high, the recent Demographic and Health Surveys (DHS) survey in 2015-16 in Malawi
showed a remarkable decrease in the stunting levels (37 percent) in children under age 5.
Stunting is typically caused by chronic inadequate diet and illness. Malawian diets
consist of staple foods, maize, followed by rice and cassava. While maize and other
3
staple crops ae high in carbohydrates, they are low in vitamins and minerals. As a result,
meals are often adequate in terms of total calories or quantity. Consequently, in terms of
nutrient adequacy at the household level, some of the Malawian children may be getting
enough to eat in terms of total calories but consumption of nutrient-rich foods such as
meat, fish, eggs, dairy, legumes, fruits and vegetables is low, on a regular basis. Adequate
nutrition requires both – sufficient total calories (quantity) and enough total vitamins and
minerals per calorie (quality). Studies have shown that without a high-quality diet, even
those children who are able to get sufficient food and calories suffer from undernutrition
[11].
Demographic and Health Surveys
The MEASURE DHS (Demographic and Health Surveys) project is a United
States Agency for International Development (USAID)-funded survey program that is
considered the gold standard for population and health data collection in the developing
world. The nationally- and regionally- representative household surveys are carefully
designed to collect reliable, representative, and cross-nationally comparable data on a
wide range of key population and health variables at specific levels of disaggregation,
qualified by confidence intervals that show the precision of the survey estimates. The
data from these surveys have been critically important both to host country institutions
and to donor agencies in planning, monitoring and evaluating population, health, and
nutrition programs. Women age 15–49 years and men age 15–54 years are interviewed on
a wide range of topics, including their socio-demographic status, fertility levels and
desires, contraceptive use, and use of maternal and child health services.
4
The DHS surveys use model questionnaires and standardized data formats to
ensure that data are comparable across countries. Female respondents are asked detailed
questions about health and nutrition including, diet of their children born in the last five
years. DHS questionnaire includes questions on whether a child ate foods from various
food groups in the previous 24 hours. The nutritional status of children and women is
determined through anthropometry and anemia testing. Studies have also shown that
information available in the DHS datasets can be used effectively to create indices with
sufficient variability, are generally normally distributed and are associated with
nutritional status of the population [12].
Malawi Micronutrient Survey
The Malawi Micronutrient Survey (MNS) 2015–16 was designed to determine the
prevalence of micronutrient deficiencies, specifically, vitamin A, vitamin B12, folate,
iron, iodine, and zinc. Other biomarkers tested included markers of inflammation,
infection, and inherited blood disorders. In addition to evaluating the prevalence of
anemia in children and adults, the survey also estimated the coverage of micronutrient
supplementation and fortification. Data collected from preschool children (6–59 months)
comprises of the study sample.
Given the very high prevalence of stunting in the country, and need for multi-
sectoral nutrition approaches, including both nutrition-specific and nutrition-sensitive
interventions, as well as the availability of rich datasets for a very large sample size, data
from the Malawi Demographic and Health Surveys (MDHS), 2000, 2004, 2010 and
2015–16 and MNS Survey 2015–16, the study investigates individual and combined
effects of proximate determinants of stunting including dietary diversity, water, sanitation
5
and hygiene (WASH), infant and young child feeding (IYCF) practices, environmental
enteropathy (EE), and household access to methods of food production (landownership),
women’s status (participation in decision-making and domestic violence) and their
relative impacts in children ages 0-23 months. In addition, the study examines the
relationship between stunting and biomarkers of nutrition, specifically iron deficiency
anemia and vitamin A deficiency in children ages 0–59 months.
Research Objectives
The objective of the current research is to investigate the individual and
combined effects of the proximate determinants of childhood stunting in Malawi using
the DHS datasets from four survey cycles between 2000 and 2015, and the data from the
MNS Survey (2015–16) . The specific objectives are as follows:
1. To evaluate trends in stunting and provide key insights into specific demographic
variables associated with stunting in children ages 0–59 months using data from
the MDHS surveys in 2000, 2004, 2010 and 2015–16.
2. To investigate individual and combined effects of proximate and distal
determinants of childhood stunting in children ages 0–23 months using data from
the MDHS survey 2015-16.
3. To assess the relationship between childhood stunting, proximate and distal
determinants of stunting and biomarkers of nutrition, specifically iron deficiency
anemia, vitamin A deficiency, zinc deficiency, selenium, markers of infection,
and inherited blood disorders in children ages 0–59 months.
6
The study contributes to the exploration of the various determinants of stunting in
children. Finding of the study is expected to have a significant potential programmatic
benefit in terms of providing empirical support for re-orientating nutrition programs to
include other proximate determinants of food security, more specifically nutrition-
specific and nutrition-sensitive factors, as well as biological markers, as contributors to
child growth.
7
Chapter 2: Background and Review of Literature
Malawi is a small land-locked Sub-Saharan African country that is located south
of the equator. It borders Tanzania, Mozambique and Zambia. Malawi’s economy is
primarily agriculture based providing 85 percent of Malawi’s domestic exports.
Agriculture in Malawi is mainly rain-fed and hence makes it vulnerable to climatic
shocks. Malawi’s ability to maintain food security and its overall economic development
have been stifled due to high rates of undernutrition, human immunodeficiency virus
(HIV) and acquired immunodeficiency syndrome (AIDS), malaria, poverty (53 percent of
population lives below the poverty line), underdeveloped markets, and low agricultural
productivity. Food insecure months are generally January through April, and the annual
harvest generally occurs in April-May [13].
Malawi has one of the highest rates of chronic malnutrition in Africa and fifth
highest stunting rate in the world, affecting more than half of children under age five.
Prevalence of stunting is 47 percent and about 20 percent of children are severely stunted
[14]. Stunting results from persistent lack of nutritious food and infectious diseases
accompanied by inadequate child and maternal care [1]. The key determinants of child
undernutrition are food insecurity, poverty and high rates of illiteracy, especially among
women [15]. Other underlying factors have also been identified, including infections and
illnesses such as malaria, diarrhea, respiratory infections, and HIV/AIDS. Poor infant and
young child feeding practices are also known contributors to child undernutrition.
Identification of these variables and the fact that nutrition interventions in past 3 decades
have had marginal impact have prompted researchers to investigate other pathways that
could lead to child undernutrition, specifically stunting [16, 17].
8
Life expectancy in Malawi is only 53 years. Approximately 57 percent of children
suffer from vitamin A deficiency [14] and 13 percent of infants are born with low birth
weight. The prevalence of anemia in children 6–59 months of age is 63 percent and more
than 80 percent of children age 6–11 months have hemoglobin levels less than 11 g/dl
[14]. Malawi’s outlook on food security and nutrition has been shaped by its challenge
with hunger and the Government of Mali (GOM) strong commitment to achieve food
self-sufficiency and improve nutritional status of children [18].
Malawians generally eat a maize based dish (nsima), rice, cassava, and potatoes.
Fufu made from cassava root, kandowole made from cassava flour, sorghum, and
mandasi (doughnut) are also consumed as the source of energy. Nsima in the shape of
patties is served with ndiwo, a sauce that is made of beans or vegetables. Vegetables
generally comprise of cassava leaves, sweet potato leaves, bean leaves, pumpkin leaves,
cabbage, mustard leaves, rape leaves, or kale leaves and cabbage. In the wealthier
households, ndiwo is prepared with vegetables, meat (goat) or fish. In addition, some
insects and termites are consumed [19-21].
Maize (corn) is the dominant crop and food consumed in Malawi while fishing in
Lake Malawi is practiced as an important source of income and contributes to two-third
of the animal protein intake. Livestock ownership and its consumption is low [19]. About
half of Malawi’s available food supply is comprised of maize and only 15 percent of the
population consumes milk, meat, or eggs on a consistent basis [22]. Arimond and Ruel
[23], in their analysis of data from 11 DHS countries, found an inverse relationship
between dietary diversity and stunting in Malawian children ages 6–23 months.
9
Infant and young child feeding practices
In the domain of nutrition and food security, information is frequently unavailable
at the household level because most routine surveys do not include questions on food
insecurity (WFP, 2006). As stated earlier, Malawian diets consist of staple foods, maize,
followed by rice and cassava. While maize and other staple crops ae high in
carbohydrates, they are low in vitamins and minerals. As a result, meals are often
adequate in terms of total calories or quantity. Therefore, in terms of nutrient adequacy
at the household level, some of the Malawian children may be getting enough to eat in
terms of total calories but consumption of nutrient-rich foods such as meat, fish, eggs,
dairy, legumes, fruits and vegetables is low on a regular basis. Adequate nutrition
requires both – sufficient total calories (quantity) and enough total vitamins and minerals
per calorie (quality). Studies have shown that without a high-quality diet, even those
children who are able to get sufficient food and calories suffer from undernutrition [11].
For instance, Uganda is considered the “bread basket” of the region with plenty of local
production and access, yet stunting is as high as 47 percent in some regions [24].
Dietary diversity and indices can be used as proxies for measuring overall dietary
quality in different countries. Various studies have developed scoring systems to explore
dietary diversity at the household level [25]. Food variety and dietary diversity scores
derived from DHS-type surveys that include qualitative recall of consumed food items
have served as simple scoring tools and have been validated to clearly reflect dietary
quality [26, 27].
Dietary diversity is defined as the number of different foods or food groups
consumed over a given reference period. Consistent associations have been found
10
between dietary diversity and indicators of food consumption and food availability;
higher diversity of diets is positively associated with child’s anthropometric status and
hemoglobin concentrations, and highly correlated with caloric and protein adequacy.
There is overwhelming evidence that dietary diversity has a consistent positive
association with child’s growth and nutritional status [28].
Other studies have shown that dietary diversity is positively associated with
anthropometric outcome measures, including stunting [29, 30]. In fact, lack of diversity is
a strong predictor of stunting after controlling for breastfeeding status, morbidity, gender,
and mother and household characteristics in children under age 5 [30].
The IYCF interventions thus far have proven to be the most preventive health and
nutrition intervention with the greatest impact on child survival. The early initiation of
breastfeeding impacts neonatal mortality, six months of exclusive breastfeeding has a
significant effect in reduction in infant deaths caused by diarrhea and pneumonia, and
continued breastfeeding from 6 to 23 months offer protection against illnesses such as
diarrhea and respiratory infection [31-33]. Studies have shown that appropriate infant
feeding practices are associated with increases in height and weight among children age
0–24 months [34]. Dietary diversity, timely introduction of solid foods and consumption
of iron rich foods in children under 24 months of age results in significant reduction in
both underweight and stunting [8, 35].
There is strong evidence that young child feeding practices affect the nutritional
status of children under 2 years of age [32]. For example, analysis of the National Family
Health Survey, 2005-06 data for over 18,000 Indian children revealed that it is not the
early initiation or duration of breastfeeding that is associated with nutritional outcomes
11
but the consumption of solid foods or semi-solid foods between 6–9 months that is
significantly associated with being underweight. The study also found that having a
minimum dietary diversity score, i.e., consumption of 4 or more food groups was
significantly associated with stunting and wasting [36]. Similar observations on timely
introduction of complementary foods and height-for-age Z-score (HAZ) have been found
in other studies [37]. Data from Peru indicate that consumption of milk and milk products
are highly correlated with linear growth [38].
A study in Malawi showed that children in the intervention group consumed more
diverse diets, had higher proportion of energy, and protein (from animal sources)
compared to children receiving habitual rural maize-based diets. The intervention
increased the Z-scores for mid-upper arm circumference (MUAC), arm muscle area, and
hemoglobin, but the intervention had no impact on height or weight gain of children 30-
90 months [39]. Similarly, Malawian children ages 6-18 months that received energy-
dense complementary food showed a modest increase in weight gain, but no gains were
observed for linear growth [40].
Of the eight core indicators of infant and young child feeding practices, the study
will analyze 1) early initiation of breastfeeding, 2) Age appropriate breastfeeding, 3)
Minimum Dietary Diversity, 4) Continued breastfeeding at 1 year, 5) Consumption of
iron-rich or iron-fortified foods. The indicator on minimum dietary diversity will be
analyzed as a separate independent variable. Using the DHS data, it is not possible to
calculate the indicators on meal frequency and minimum acceptable diet [33].
12
IYCF status report in Malawi indicates that the rate of early initiation of
breastfeeding is 58 percent, exclusive breastfeeding in children under age6 months is 57
percent and, continued breastfeeding is about 72 percent. About 89 percent of children
ages 6–9 months who are breastfed consume complementary foods. Malawi seems to
have adequate IYCF health service counseling, but community level actions and
comprehensive IYCF monitoring and evaluation remain poor [41].
Breastfeeding is almost universal in Malawi but exclusive breastfeeding for the
first six months is low. The main complementary food for infants is a plain porridge,
which is low in energy and nutrition content and is offered at low meal frequency. The
adult diet is bulky but has a low meal frequency too. Rural diets are generally dominant
in maize – Malawians get enough calories to stave off hunger (from grains and cereals),
but do not have diverse diets leading to micronutrient deficiencies, often called as
“hidden hunger” because it occurs even when the diets include adequate amount of
energy (calories) [42].
Most iron comes from vegetable sources and foods from animal sources are rarely
eaten. Despite limited dietary diversity, large within-person variation in nutrient intake is
observed among pregnant women in rural Malawi. The study suggest that poor
individuals may have higher intra-individual variability because of irregular access of
locally produced foods. Energy intakes (fat, carbohydrates, protein) and zinc, vitamin A
and C are significantly higher during harvest and post-harvest seasons; however, calcium
and vitamin C intakes are significantly higher during the pre-harvest season [20].
Arimond and Ruel [23], in their analysis of 11 DHS countries, concluded that
dietary diversity may even be more important for children who rely on complementary
13
foods rather than breastmilk for their energy and nutrient requirements. The analysis was
based on a 7-day dietary recall as opposed to a 24-hour recall of foods consumed by
children –recall bias from 7-day dietary recall has implications for data quality and 24-
hour dietary recalls are considered more accurate [43]. The study did not explore other
pathways (described below) that are likely determinants of stunting.
Household wealth, Food Access & Hunger
Food access is having sufficient resources, both economic and physical, to obtain
appropriate foods for a nutritious diet. Even though food may be available in the market,
it may not be accessible to households that cannot afford it. In fact, some of the major
famines in the world, including the one in Malawi in 2002 were a result of market shocks
resulting in inability of the households to buy food even when food was available in the
market. Therefore, purchasing power of the household is exceedingly important in
mitigating the effects of food insecurity on nutritional status of children.
About half of children (47.1 percent) in Malawi are undernourished and though
wealth is inversely related to stunting levels, stunting is high even in the highest wealth
quintile (36 percent) [14]. In addition, 90 percent of population lives in rural areas [19],
and 75 percent of rural households in Malawi have no access to markets. A distance of at
least 10 km needs to be covered to reach the nearest market. In fact, only 41 percent of
rural households’ food consumption is based on purchases, whereas, about half (49
percent) of the rural households in Malawi depend on their own production. However,
increasing on-farm diversity is not always the most effective way to improve dietary
diversity in smallholder households. In fact, market access has positive effects on dietary
diversity, which are larger than those of increased production diversity [44].
14
Environmental enteropathy and Water Sanitation and Hygiene (WASH)\
Researchers believe that there are biologically plausible pathways including
enteric infections that may be responsible for continued growth faltering in children
despite nutrition interventions [45, 46]. Inadequate or poor nutrition can lead to reduced
immunity to infection. Malnutrition and infection interact synergistically to form a
vicious cycle of growth faltering. Infections such as diarrhea lead to pathogenic damage
to the intestinal lining leading to increased nutrient requirements, maldigestion and
malabsorption of food further resulting in less absorption of energy. The damage and
inflammation of the mucosal lining also stimulate inflammatory and immune response to
repair damaged tissue and fight infection and therefore, leaving less energy available for
growth [47, 48]. It is estimated that children with diarrhea in the first 1000 days are likely
to have an 8 cm growth shortfall and impaired cognitive development (10 IQ point
decrement) by the time they are 7–9 years of age [46]. Weisz et al (2011) found that
greater duration of diarrhea was associated with greater reductions in HAZ. [49]. A
pooled analysis of 9 studies between 1978 to 1998 from Africa, Asia and Americas
showed a cumulative impact of diarrheal episodes on stunting by 2 years of age [16].
With mounting evidence of the role of diarrhea in childhood stunting, there is
much focus on diseases or infection control programs such as WASH. Poor WASH
practices lead to a sub-clinical disorder called environmental or tropical enteropathy.
WASH interventions reduce episodes of diarrhea – with 99 percent coverage –it reduces
15
prevalence of stunting by 2.4 percent (entirely modeled through reductions in diarrhea).
Children living in very poor conditions do not recover from the chronic effects of EE, and
hence EE may be an important pathway to stunting than diarrhea.
EE is a subclinical condition caused by constant fecal-oral contamination that
results in blunting of intestinal villi (decreased villous height) and intestinal inflammation
leading to impair intestinal absorptive and immunologic functions [50]. EE is almost
universal in developing countries due to chronic exposure to feco-oral bacteria [51]. In
addition, EE also leads to ‘leaky gut’ i.e., an increased permeability of the intestinal tract
and impaired ability to prevent pathogens from breaching the intestinal barrier. This leads
to an elevated immune response, within which nutrients gets further diverted from growth
to fighting infection [46].
EE is not found in fetuses or newborns suggesting that it is the unhygienic
conditions during early childhood that initiates a chronic intestinal pathology that only
resolves when living conditions are improved. The cause of EE is likely to be
multifactorial, including microbial contamination of food and poor hygiene practices
[52]. EE occurs when young children ingest large quantities of fecal bacteria, which then
harbor in the small intestine and induce EE through a T-cell mediated process. The
increased permeability of the atrophied villous facilitates translocation of microbes,
which in turn triggers the metabolic changes of the immune response. EE is a universal
condition among children in developing countries and may mediate stunting [16, 51]. In a
recent study in Bangladesh, fecal samples of children were tested monthly from birth to
until two years. The study computed microbiota-for-age Z- score that significantly
correlated with the chronological age of children with healthy growth phenotypes.
16
Applying the metrics, it was found that moderate acute malnutrition (MAM) and severe
acute malnutrition (SAM) have gut microbiota that are immature, i.e., the representation
of the age-discriminatory taxa in their gut communities was more similar to younger
instead of age-matched healthy children of the same locale. The degree of immaturity
was greater in SAM than MAM [53].
EE is commonly observed in preschool age Malawian children living in poverty
and is associated with stunting [52, 54]. By transplanting microbiota from 6- and 18-
months healthy and undernourished Malawian children into young germ-free mice fed a
Malawian diet, showed that immature microbiota from undernourished children ages 0-3
years, transmitted impaired growth phenotypes. This study provides evidence that
microbiota immaturity is causally related to undernutrition [53], and gut microbiome as a
causal factor in Kwashiorkor [55, 56]. A similar study in Malawi found that IgA
responses to several bacterial taxa correlated with anthropometric measurements of
nutritional status in longitudinal studies and hence bacterial targets to IgA responses may
have etiologic, diagnostic, and therapeutic implications for childhood undernutrition [57].
It has been estimated that up to 43 percent of growth faltering is attributable to long term
intestinal lesions in children ages 2–15 months[45]. EE together with reduced nutrient
absorption leads to growth faltering in the first 2 years of life due to high growth
demands during this period [58]. In a multi-country analysis of the effects of diarrhea on
stunting, it was observed that every episode of diarrhea led to a 1.5 percent increase in the
probability of stunting in children at 2 years of age [59]. In addition to malabsorption,
inadequate dietary diversity further results in growth faltering and lowered immunity to
17
infections. This is evident by the fact that micronutrients reduces EE in rural children in
Malawi [52].
Children with severe acute malnutrition have higher mean stool weight and higher
lactic acid content that are consistent with carbohydrate malabsorption. A pH of less than
5.5 and presence of reducing substances in the feces are indicative of carbohydrate
intolerance and malabsorption (both monosaccharides and disaccharides) because of
villous atrophy[60]. Resistant starch has been shown to decrease intestinal inflammation
in some animal and human studies. However, it did not reduce gut inflammation in rural
Malawian children [61].
Malawians diets are heavily dominated by staple foods, maize, followed by rice
and cassava. Plant based diets consumed by Malawian children are important sources of
phytic acid which complexes with divalent cations, forming insoluble compounds in the
intestine which inhibit the absorption of certain trace elements, particularly zinc. Dietary
studies of Malawian children have documented that high phytate content of the maize
diet leads to zinc deficiency [62]. The intestinal permeability is known increase with zinc
deficiency, mainly due to lactulose permeation. Abnormal permeability of the intestine
also leads to higher obligate endogenous fecal zinc losses [62]. Thus, zinc deficiency and
EE are interacting factors that may propagate overt clinical condition in children with
overlapping causes of enteropathy [54].
Children with poor quality diets may be exposed to aflatoxin, a fungal metabolite
that contaminates inadequately stored crops such as maize and peanuts. Aflatoxin impairs
intestinal integrity in animal models and is associated with stunting in children,
potentially through the same pathway as EE [16]. On the other hand, micronutrients
18
found in commonly consumed grain legumes such as cowpea and common beans may
reduce stunting and EE in high-risk population [63]. From these studies, it is becoming
increasingly apparent that childrens diet, environment, gut microbiota, and health are
inextricably linked [64].
According to the World Health Organization (WHO), repeated diarrhea or
intestinal worm infections caused by unsafe water, inadequate sanitation or insufficient
hygiene is associated with about half of malnutrition worldwide. Recent literature
suggests that EE may be attributed to the failure of nutritional interventions and oral
vaccines in developing countries [65]. More than 43 percent of growth faltering in
Gambian children is associated with chronic inflammation of the mucosa of the small
intestine caused by EE [66]. Similarly, after adjusting for potential confounders, a study
in Bangladesh observed that children from clean households had 22 percent lower
stunting prevalence compared with children from contaminated households. These
households were examined for water, sanitation, and hygiene conditions. Distinction
between clean and contaminated households was based on stool collection and parasite
assays [67].
Diarrhea is one of the most important mediators through which poor sanitation
affects nutritional status [68]. The high prevalence of common childhood illnesses,
especially diarrhea, can have a negative effect on linear growth in children [34]. Even
when food consumption is sufficient, unsafe water, poor sanitation and hygiene leads to
diarrhea, inhibiting nutrient absorption. If diarrhea does not kill a child, repeated bouts
create a vicious cycle of diarrhea and undernutrition (underweight and stunting), reducing
a child’s resistance to infections. This phenomenon, which leads to stunting in children,
19
has been observed in Asia, Africa and Latin America [16, 46, 69]. In a pooled analysis of
nine community based studies showed that the odds of stunting at 24 months of age
increased multiplicatively with each diarrheal episode or day of diarrhea. The proportion
of stunting attributed to five previous episodes of diarrhea was 25 percent [70].
WASH interventions include a provision to clean piped drinking water, facilities
for excreta disposal, promotion of handwashing with soap after defecation, and disposal
of child feces, prior to preparing and handling food and before eating [71]. In Malawi,
access to safe water is 74 percent, access to improved sanitation is 47 percent, while
access to basic sanitation, including traditional latrines is as high as 88 percent, but good
hygiene practices are low with only 37 percent of the population practicing better hygiene
[72].
Maternal factors and women’s empowerment
Among the non-nutritional factors, gender equality and women’s empowerment
have a strong impact on children’s nutrition. Women’s empowerment, mother’s
emotional and mental health is highly associated with child nutrition and development
[73]. The nutrition-sensitive program and approaches highlights the critical importance of
female empowerment given the role that women play as mothers, caregivers, farmers and
income earners [10].
Women’s empowerment or autonomy is most often measured by women’s
participation in household decision-making, which is most frequently associated with
nutritional outcomes in children under five [74, 75]. Mother’s participation in making
household decisions is associated with 15 percent less stunting, 16 percent less wasting
20
and 32 percent less underweight children [76]. Women’s empowerment is significantly
associated with length-for-age, specifically the domains of access to and decisions
regarding credit, autonomy in production, and satisfaction with leisure time [77].
On the other hand, domestic violence against women is an indicator of
disempowerment [78]. Children’s exposure to domestic violence, whether direct prenatal
exposure (altered uterine exposure as a result of pregnant mother’s experience with
domestic violence), and direct or indirect post-natal involvement is significantly
associated with higher odds of stunting and severe stunting in Kenyan children ages 6-59
months whose mothers were exposed to any or only physical domestic violence [79].
Data from 42 DHS surveys from 29 countries showed that stunting was positively
associated with mothers’ exposure to physical violence and sexual intimate partner
violence [80]. A longitudinal study of pregnant women in Bangladesh observed lower
height and weight at birth, smaller changes in weight-for-age Z-score (WAZ) and HAZ
from ages 0–24 months, and lower WAZ and HAZ at 24 months of age with exposure to
any domestic violence [79]. Similar observations from other studies [78] underscores the
effect of domestic violence on nutrition and growth of young children.
Markers of nutrition, infection and inflammation
Stunting is primarily due to chronic deficiency of energy, protein and
micronutrients, especially iodine or zinc. Nutritional biomarkers offer physiological
evidence of micronutrient deficiencies and stunting.
21
The nutritional biomarkers1 provide a more objective assessment of nutritional
status since they are highly correlated with dietary intake and are independent of errors
associated with questionnaire data, including the recall bias [81]. A national
micronutrient survey in Malawi found that 80 percent of preschool children have anemia
and 58 percent have iron deficiency anemia, and 59 percent have iron deficiency anemia
(IDA) by Hb and transferrin receptor. Hence, WHO classifies anemia as a public health
problem in Malawi. Similarly, vitamin A deficiency is also considered a clinical public
health problem as 60 percent of preschool children have serum retinol values of less
than20µg/dl.
Findings from epidemiological studies indicate that current infections and
micronutrient deficiencies are proximal determinants of stunting [82]. Hemoglobin (Hb)
level is the most reliable indicator for diagnosis of anemia. Iron deficiency anemia is the
common cause of anemia and stunting [83-85] and impair immunity in children [84] , but
the impact of iron supplementation on linear growth has been inconsistent. Likewise,
retinol binding protein (RBP) is associated with Hb, and vitamin A deficiency co-exists
with iron-deficiency [86]. Clinical vitamin A deficiency is associated with poor growth,
but a few studies have reported increase in height when children with severe deficiency
of vitamin A were given supplements [22], and most studies have not reported any
significant effect on linear growth or weight gain [15].
C-reactive protein (CRP) and alpha-1-acid glycoprotein (AGP) are acute-phase
proteins that are significantly lower in non-stunted children compared to stunted children
1 A nutritional biomarker is a biochemical indicator of intake and/or status of a given nutrient or food component.
22
[82, 87, 88]. Similarly, vitamin A and zinc are associated with stunting in children [89].
Vitamin A deficiency decreases zinc-binding proteins and impaired absorption of zinc.
Further, zinc plays an important role in the metabolism of vitamin A. Zinc
supplementation alone, or in combination with iron, and vitamin A has been associated
with lower HAZ scores [90]. It has been shown that food insecure children have higher
levels of anemia and are on average 2 cm shorter than food secure children [85].
Relationship between consumption of energy dense foods, micronutrients and
stunting is complex. Siyame et al [91] found that Malawian women from Zomba and
Mikalango had higher zinc deficiency (90 percent) than iron deficiency anemia (6
percent). This was attributed to diets low in zinc (median 5.7 mg/day) with high
phytate:zinc molar ratios (20.0) but high in iron (21.0 mg/day) as a form of contaminated
(soil) iron. Zinc is Malawian children is also found to be deficient – even after a
supplementation of 7 mg Zn/day, the low plasma zinc in children rose from 23 percent at
6 months to 37 percent at 12 months [40]. It has been found that supplementation of zinc
with iron and vitamin A, rather than zinc alone increases the linear growth of stunted
children with low hemoglobin [92]. Research indicates that pre- and postnatal
micronutrient intake results in improvements in length-for-age z-score and reduction in
stunting in newborns until three months [93]. A meta-analysis of randomized controlled
trials also show that zinc supplementation has a significant effect on the linear growth of
children with a gain a 0.37 cm in zinc-supplemented group [70].
A recent study assessed the relationship between dietary energy density and
nutritional status in children ages 1–10 years. The study found that stunting, but not other
growth problems were associated with higher dietary energy density [94]. For Malawian
23
children, the predominantly consumed corn porridge (as opposed to energy dense corn
dough consumed by adults) lacks in micronutrients, particularly zinc, iron, and selenium,
and has low-energy density. The addition of peanut andsoy based fortified spread to the
corn porridge only increased the weight but not height in the Malawian children [40].
Similarly, in a randomized controlled study, complementing diets of Malawian children
with lipid-based nutrient supplements, and supplementing diets of Malawian women
during pregnancy and six months postpartum with small quantity lipid-based nutrient did
not promote child growth or prevented stunting in children ages 6–18 months[95, 96].
In a randomized controlled trial, a sustained supplementation of lipid-based
nutrient supplement, called FS50 containing milk protein from cow’s milk, sugar, and a
mixture of micronutrients, embedded in lipid base had a positive impact upon the
incidence of severe stunting [97]. Similarly, when micronutrients were added to a
fortified porridge spread in Ghana, linear growth was observed among the children [40].
Whereas, Congolese and Burkinabe infants given different quantities of mono- and poly-
unsaturated fatty acids showed increases in weight gain but not the length.
In a quasi-experimental design, efficacy of dietary diversification and
modification was assessed in Malawian children ages 30-90 months. After a year of
intervention, children in the intervention group consumed more diverse diets. They had
lower risk of inadequate intakes of all nutrients examined –significant differences were
observed for protein, folate, vitamin B 12, calcium and zinc,
Since most of these nutrients have a critical role in immune competence and
linear growth, it is not surprising that deficiency of these nutrients has been associated in
24
part with the high prevalence of morbidity and stunting reported in Malawian children
(ibid)[39].
Zinc is essential for many physiological processes, and severe zinc deficiency
leads to dwarfism [12]. Zinc deficiency is common in many populations [13]. Two out of
three recent meta- analyses [14– 16] of clinical trials of zinc supplementation in children
report a large and significant effect of daily oral zinc supplements on linear growth,
especially in stunted children and in developing countries. Imdad and Bhutta [16]
reported the greatest impact when zinc was given alone–children under 5 there had a net
gain of 0.37 ± 0.25 cm for a dose of 10 mg zinc daily for 24 weeks.
Antenatal zinc supplementation increases fetal long bone growth [17] –this is of
particular relevance because nutritional stunting is due to short femur length [18]. A
study in Nepal showed a small but significant increase in height among school children
whose mothers received antenatal zinc supplements [19], whereas a large study of
antenatal zinc supplements had no effect on postnatal growth, but infants had reduced
prevalence of diarrhea and other infections [20]. Zinc supplements have been repeatedly
shown to prevent respiratory complications and diarrhea in infancy, which is also
associated with stunting. A study combining zinc and anti-parasite treatment reported a
positive effect of zinc on linear growth that was reduced by the presence of Giardia
lamblia and Ascaris lumbricoides [21]. This indicates that the benefit of zinc may be
limited because of continuing infection or by the presence of other nutrient deficiencies.
.
25
In summary, ongoing degradation in the quality of children’s diets leads to
malnutrition and micronutrient deficiencies, which are exacerbated by the health
consequences of poor water quality and inadequate sanitation. This vicious cycle of
malnutrition is compounded by enteric infectious diseases, which alters gut integrity and
impair absorption of nutrients, resulting in further malnutrition.
The approach of USAID’s and United Nation’s flagship nutrition and food
security initiatives in Malawi is to integrate nutrition into the value chain through
nutrition-sensitive agricultural productivity, finance and local capacity development.
Programs are targeted at the local level, focusing on increased agricultural productivity,
conservation, behavior change, dietary diversification, and improved feeding for pregnant
women, young children, and infants [19, 98]. Most of these programs (Feed the Future,
Food for Peace, Scaling Up Nutrition, Counting to 2015, World Food Programme,
International Fund for Agriculture Development, World Bank Group, Food and
Agriculture Organzation’s Green Belt Program etc.), started around 2010-2011 and are
currently ongoing [19]. Therefore, data from MDHS 2010 and MDHS 2015, respectively,
may provide key insight into variables that are associated with food insecurity before and
after implementation of national programs that included interventions, in addition to
nutrition, to reduce undernutrition in young children.
26
Chapter 3: Methods and Procedures
Research Population
DHS surveys use multi-stage cluster sampling. The sampling is in two stages.
First, the whole population is divided, on paper, into smaller discrete geographical areas,
such as villages, that are called clusters. For each cluster, the population size is known or
can be estimated. Clusters are then randomly selected; the chance of being selected is
proportional to the cluster’s population size. In other words, this is sampling with
“probability proportional to population size.” In the second stage, a fixed number of
households are chosen at random from within each cluster area or village. Thus each
household and each person in the whole area have an equal chance of being selected [99].
DHS surveys have large sample size, usually between 5,000 to 30,000
households. The selection of primary sampling units or PSUs and number of households
selected is based on the core domains, including anthropometry, anemia and fertility rate.
The cluster size is the number of households per women to be selected per PSU or
cluster. The DHS uses a cluster size of about 30-40 women in the rural areas, and about
20-25 women in the urban sector [100]. Based on experiences of actual surveys, a study
was conducted to investigate the optimal sample sizes in DHS surveys. The findings
show that the optimal second-stage sample size is about 20 women per cluster. Hence, for
most DHS surveys, the sample sizes meet the optimal standard or are within tolerable
limits of relative precision loss [101]. The proposed study will examine the DHS data
from Malawi for survey years 2000, 2004, 2010, and 2015-16.
27
The MNS Survey (2015-16) was conducted jointly with the MDHS 2015-16. The
National Statistical Office (NSO), the Community Health Services Unit of the Ministry
of Health (CHSU), and the Department of Nutrition, HIV and AIDS (funding from Irish
Aid), World Bank, and the Emory Global Health Institute, and United Nations Children’s
Fund (UNICEF) implemented the MNS survey. The technical assistance for the survey
was provided by the Centers for Disease Control and Prevention (CDC), and Emory
University. The MNS Survey 2015-16 was designed to determine the prevalence of
micronutrient deficiencies, specifically, vitamin A, vitamin B12, folate, iron, iodine, and
zinc. Other biomarkers tested included markers of inflammation, infection, and inherited
blood disorders. In addition to evaluating the prevalence of anemia in children and adults,
the survey also estimated the coverage of micronutrient supplementation and
fortification. Data was collected for preschool children (6–59 months), school-aged
children (6–14 years), women of reproductive age (15–49 years), and men (20–54 years).
Using nutrition data from MDHS 2000, 2004, 2010 and 2015-16 , and MNS
survey, 2015-16 , the study investigates individual and combined effects of proximate
determinants of household-level food security on stunting in children ages 0–23 months.
The study also assesses the relationship between food security and biomarkers of
nutrition specifically iron deficiency anemia and vitamin A deficiency in children ages 0–
59 months.
28
Variable Definitions
To assess the impact of proximate determinants of food insecurity on child
nutritional status (stunting) the following dependent and independent variables were
examined:
Dependent Variable The height-for-age index provides an indicator of linear growth.
Children whose height-for-age are below minus two standard deviations (-2 SD) from the
median of the reference population are considered short for their age, or stunted. Children
who are below minus three standard deviations (-3 SD) from the reference population are
considered severely stunted. Stunting reflects a failure to receive adequate nutrition over
a long period and is also affected by recurrent and chronic illness [102]. Height
measurements in MDHS (2000, 2004, 2010 & 2015-16) were carried out in children 0–5
years using a measuring board developed by Shorr productions. Recumbent length was
measured for children under two years of age [14].
The WHO Global Database on Child Growth and Malnutrition uses a Z-score cut
off point of less than -2SD for low height-for-age and less than -3SD to define severe
undernutrition [102]. However, the dependent variable, stunting was defined as
moderate-to-severe. If a child’s height-for-age is 2 SD below the reference median
(moderate-to-severe), it was coded as ‘1’, otherwise ‘0’.
Independent Variables: Variables that have been shown to be associated with childhood
nutritional status in previous research was drawn from the household and woman’s data
file [103]. The independent variables included in the analyses, and their definitions are as
follows:
29
The individual dietary diversity scores for both women and children are part of
DHS surveys. The survey included questions on whether a child ate foods from various
food groups in the previous 24 hours. The dietary diversity indicator used for the analysis
was created from 24-hour recall of consumption of foods listed in the DHS questionnaire.
These food groups emphasize micronutrient intake and not just economic access to food
[31-33].
Dietary diversity was calculated as a dichotomous variable reflecting whether a
child age 6-23 month has consumed four or more of the seven food group listed below:
1. Grains, roots and tubers
2. Legumes and nuts
3. Dairy products (milk, yogurt, cheese)
4. Flesh foods (meat, fish, poultry and liver/organ meats)
5. Eggs
6. Vitamin-A rich fruits and vegetables
7. Other fruits and vegetables
The variable on consumption of iron-rich food was also dichotomous, reflecting a
child’s consumption of organ meat, flesh meat, or fish.
To derive the dietary diversity score, each food group was first computed to
include all foods eaten in that food group. For example, all foods in the grains, roots and
tubers group were identified. In Malawi, children generally eat baby cereal, porridge,
breads, and noodles, other foods made from grains, potatoes, cassava, and other tubers.
Each food item identified was then computed as ‘0’ for not consumed and ‘1’ for
30
consumed in the past 24 hours. Therefore, a child who consumed any of the foods, i.e.,
‘1’ for baby cereal, ‘1’ for porridge, ‘1’ for noodles, ‘1’ for bread, ‘1’ for other grains, ‘1’
for potatoes, ‘1’ for cassava and ‘1’ for other tubers was grouped as ‘yes’ or ‘1’ for
grains, roots and tubers. Similarly, foods in other food groups were identified and
computed. In all, eight food group variables were computed. The dietary diversity score
was created by summing the number of different food groups that were consumed by a
child in the 24 hours preceding the survey interview.
Based on the consumption, children were dichotomized into the following
categories:
- Low dietary diversity (≤ 3 food groups), coded ‘0’
- High dietary diversity (≥ 4 food groups), coded ‘1’.
The household interview asked respondents about the source of drinking water, and
sanitation. From the Malawi datasets (MDHS 2000, 2004, 2010, and 2015-16), the
following WASH variables were calculated:
a) Whether the household used an improved drinking water source: Improved
drinking water sources are piped water into dwelling, plot, or yard; public
tap/standpipe, tube well/borehole, protected dug well, protected spring and
rainwater collection.
b) Whether the household had access to an improved sanitation facility: Improved
sanitation is defined as having flush or pour/flush, facilities connected to a piped

31
sewer system, septic system, or a pit latrine; pit latrines with a slab, composting
toilets or ventilated improved pit latrines.
The following variables on infant and young child feeding practices was calculated
for these analyses:
a) Early initiation of breastfeeding: Whether the child was put to the breast within
one hour of birth.
b) Age appropriate breastfeeding: Whether infants 0–5 months of age received only
breast milk during the previous day and whether children 6–23 months of age
received breastmilk, as well as solid, semi-solid or soft foods during the previous
day.
c) Minimum Dietary Diversity: Whether children received foods from ≥4 food
groups (calculated as separate independent variable).
d) Continued breastfeeding at 1 year: Proportion of children 12–15 months of age
who are fed breast milk.
e) Consumption of iron-rich or iron-fortified foods: Proportion of children 6–23
months of age who receive an iron-rich food or iron-fortified food that is
specially designed for infants and children, or that is fortified in the home.
Escherichia Coli (E.coli) are widely distributed among poultry and are primarily
related to poor hygienic conditions. Farm animals can also carry Salmonella and
Cryptosporidium, a protozoan, is more virulent than E.coli in causing diarrhea in children
= under two years of age. It is commonly found in cattle, poultry and other farm animals
[104]. These organisms are transmitted to children and infants either through animal
feces, contaminated water and food or even by direct person-to-person contact [105].
32
Therefore, the proposed study will analyze ownership of animals, especially poultry and
cattle, and its association with stunting in children.
Ownership of animals was used as a proxy for environmental enteropathy since
in the rural landscape of Malawi, households with livestock share close proximity of
animals and children. Animals often share the area where children play or where food is
being cooked and eaten. Ownership of livestock was computed as ‘1’ if the household
had goats; ‘1’ if the household had pigs; ‘1’ if the household had cattle; ‘1’ if the
household had sheep; ‘1’ if the household had poultry (chickens, ducks, pigeons).
A composite indicator of the above variables was computed as ‘1’ if the
household had goats, pigs, cattle, sheep or poultry; else 0.
Since data on income and expenditures are not available from DHS surveys, data
on ownership of assets was used as a proxy for market access and purchasing power. The
DHS wealth index measures household wealth using an index derived from asset
variables using principal component’s analysis (PCA) by placing individual households
on a continuous scale of relative wealth. Studies have found that these indices are robust
and provide similar poverty rankings of households as income or consumption
expenditure measures [42].
The DHS Wealth Index was used as a proxy for household economic status. It is a
composite measure of household’s cumulative living standard. The wealth index quintiles
include: lowest, second, middle, fourth and highest [106]. As a measure of economic
status, the wealth index was validated against the consumption expenditures using the
World Bank’s Living Standard Measurement Surveys. The results from the validation
33
concluded that the wealth index, in fact, performed better than the traditional
consumption expenditure index for key survey variables [106].
Household assets are good predictors of child nutritional status. The index is
based on whether the household owns common items such as radio, television, bicycle,
motorcycle, car, refrigerator, toilet, and has access to piped water, etc.
The DHS has two sets of women’s empowerment indicators: (a) Women’s
participation in household decisionmaking either alone or jointly with husband or partner.
The index is constructed based on woman’s response to her say in large household
purchases, her own healthcare, the spending of money she earned, and visits to relatives.
The index ranges from 0 to 3. (b) Women’s attitudes towards wife beating are the number
of reasons for which a woman thinks it is justified to beat wife. The index ranges from 0
to 5; a lower score reflects a higher status of women.
The MDHS survey 2015-16 also included the domestic violence module in one-
third of the sampled households. Physical, sexual, and emotional violence was measured
by asking a series of questions to all ever-married women. The variables were coded as
‘0’ for No and ‘1’ for Yes for each type of violence.
Micronutrient testing and sample collection
The MNS Survey (2015-16) collected information on food accessibility and the
experience of food deprivation using the Household Hunger Scale (HHS). The HHS
scale developed by Food and Nutrition Technical Assistance II project was used to
calculate the prevalence of households with moderate or severe hunger. It has been
34
validated for cross-cultural equivalence. The recall period is 30 days or four weeks for
the questions that are used to create the HHS indicator [107].
Two types of indicators – a categorical HHS indicator and a median HHS score
for the households were calculated. For occurrence questions, for example, “Was there
ever no food to eat of any kind in your house because of lack of resources to get food?”,
“0” was coded for households that answered “No” and “1” was coded for households that
answered “Yes”. Similarly, frequency-to-occurrence questions, “rarely” =1; “sometimes”
= 2; “often” = 3 were recoded to as “rarely” =0; “rarely or sometimes” = 1; “often” = 2
(new recoded value). Values were summed for each household to calculate the HHS
score. Each household received a HHS score between 0 and 6.
• Households scoring 0–1 were classified as households experiencing little to no
hunger.
• Households scoring 2–3 were classified as households experiencing moderate
hunger.
• Households scoring 4–6 were classified as households experiencing severe hunger
[108].
Using the above classification, a binary HHS indicator was computed and coded
as “0” (little to none), and “1” (moderate-to-severe).
In each of the clusters selected for the MNS survey, nurses and laboratory
technicians in a temporary field laboratory collected blood samples through venipuncture.
Approximately 7 ml of blood was collected into a trace element free (blue top), and an
EDTA (purple top) vacutainer tube per child. Whole blood collected in the EDTA
35
vacutainer tube was used for hemoglobin and malaria testing. Dried blood spots (DBS)
were made from 100 µl of whole blood. The DBS cards were dried, stored, and
transferred to the central laboratory for inherited blood disorder testing. The remaining
blood from the vacutainer tube was centrifuged, and plasma was aliquoted and stored at
CHSU of the Ministry of Health, and serum was harvested from the blue top vacutainer
tube and was used for various micronutrient biochemical analyses. In a subset of eligible
sample, an additional 3 ml of blood sample was collected in a third EDTA vacutainer
tube for modified relative dose response (MRDR) and retinol laboratory testing using
high performance liquid chromatography (HPLC). Venous blood was collected after the
child had consumed a small challenge dose of retinol analog and a fatty snack in the form
of a granola bar. The sample was centrifuged for plasma, which was aliquoted into two
sterile cryovials.
The processed serum and plasma specimens were labeled, stored in portable
freezers in the field, and transported along with the specimen tracking forms to the
nearest district laboratory for temporary storage at -20° C to the district laboratory and
finally to the central laboratory at CHSU, where the samples were stored at -70° C until
their transfer for further analysis.
Approximately 10 ml of urine was collected in sterile collection cups from all
eligible children. The urine samples were tested for the presence of hematuria as a proxy
for diagnosis for urinary schistosomiasis using a urine dipstick.
Anemia
36
Anemia is characterized by low levels of hemoglobin in the blood. Likewise, iron
status is assessed by measuring serum ferritin. Serum ferritin is an acute phase protein
and increases as part of the inflammatory response. Adjusting for inflammation leads to
an increase in the estimated prevalence of iron deficiency using ferritin concentrations.
Therefore, prevalence estimates of inflammation-corrected iron deficiency are more
accurate and presented in this research.
• Hemoglobin concentrations were adjusted based on altitude of the cluster in all
children.
o ≥11 g/dl coded as “0” (not anemic), and
o <11 g/dl coded as “1” (anemic)
• Serum ferritin results were adjusted for CRP and AGP concentrations using the
Biomarkers Reflecting Inflammation and Nutritional Determinants of Anemia
internal country-specific regression correction approach. Serum ferritin values are
reported as both unadjusted and adjusted for inflammation.
o ≥12 µg/L coded as “0” (No, Iron deficiency), and
o <12 µg/L coded as “1” (Yes, Iron deficiency).
• Iron deficiency anemia or IDA (inflammation corrected iron deficiency and
anemia).
o ≥11 g/dl coded as “0” (No, IDA), and
o <11 g/dl coded as “1” (Yes, IDA)
Vitamin A Deficiency
Vitamin A status was assessed using RBP as a surrogate measure for serum retinol. Since
the molar ration of RBP and retinol is not always 1:1, a sub-sample of serum was also
37
analyzed for serum retinol to adjust the RBP cut-points. Although it is well known that
inflammation affects vitamin status, there are no global recommendations on how to
account for inflammation and hence the RBP and retinol concentrations were not adjusted
for inflammation.
• Retinol Binding Protein (RBP):
o ≥0.46 µmol/L coded as “0” (Not VA deficient), and
o <0.46 µmol/L coded as “1” (VA deficient).
Zinc Deficiency
Since serum zinc concentrations may be affected by physiologic factors, including fasting
status, time of blood collection, and inflammation, the zinc concentrations were corrected
for fasting and time of collection. No corrections or adjustments were made for
inflammation, as there are no current recommendations for adjustment.
• Serum zinc corrected for fasting and time of collection:
o Morning, non-fasting <65 µg/dL coded “1” (Zn deficient), otherwise not
deficient.
o Afternoon, non-fasting <57 µg/dL coded as “1” (Zn deficient), otherwise
not deficient in Zinc.
Markers of inflammation/infection
Markers of inflammation, malaria, and schistosomiasis were assessed to evaluate
common causes of infection and subclinical inflammation that may be associated with
nutritional status and influence the interpretation of biomarkers. Inflammation was
38
assessed using CRP, which measures acute inflammation, and AGP which measures
chronic inflammation.
• C-reactive protein (CRP): ≤ 5 mg/L coded “0” (normal), and > 5mg/L coded as
“1” (abnormal)
• Alpha-1-acid glycoprotein (AGP): ≤ 1 g/L coded “0” (normal), and >1 g/L coded
as “1” (abnormal)
• Any inflammation: CRP or AGP coded as “0” (no inflammation), and CRP or
AGP coded as “1” (any inflammation).
Plasmodium falciparum is the most common cause of malaria infection in Malawi that
contributes to high morbidity and mortality, hence data was assessed to determine the
presence of malaria in children. Similarly, urinary schistosomiasis is common in Malawi
due to Lake Malawi’s water infested with snails.
Markers of inflammation/infection
Inherited blood disorders, such as alpha-thalassemia, sickle cell disease, and glucose 6-
phosphate dehydrogenase (G6PD) deficiencies are common among children in Africa,
including Malawi. The prevalence of these disorders and their relationship with stunting
has not been explored.
Confounding Variables
The analysis controlled for other independent variables, including mother’s
education, which is significantly (p<0.001) associated with higher probability of
reduction in both underweight and stunting in children who received timely introduction
of solid foods, and improved dietary diversity [35]. Mother’s education was categorized
39
as no schooling, primary or less and secondary or more. Studies have shown that after
controlling for other confounding factors, maternal height is associated with stunting in
children [109-111]. In fact, maternal height is a composite indicator that represents
genetic and environmental effects on the child’s growth [70] and maternal short stature
and underweight is associated with fetal growth restriction [70]. In addition, child’s
height is also associated with birthweight [112, 113]. Therefore, the study controlled for
mother’s height and BMI.
The other covariates included child’s age, previous birth interval and sex. In
addition, since dietary diversity and other determinants of food security are highly
correlated with income and may be confounded by socio-economic factors [114], analysis
was controlled for household wealth, and land ownership.
Statistical Analysis
The study incorporated cross-sectional analysis of secondary data using the
women’s dataset from the MDHS Survey (2000, 2004, 2010 & 2015-16), and Malawi
MNS (2015-16). The data was analyzed using STATA 15.0 (STATA Corp, College
Station, TX USA). Independent and control variables were derived from the standard
recode data.
Diagnostics
Since some predictors in the model may give redundant information, collinearity
statistics were tested to examine multicollinearity. Moderate collinearity is common since
any correlation among the independent variables is an indication of collinearity. If
multicollinearity increases, the regression model estimates of the coefficients become
40
unstable, and the standard errors of the coefficients may be large (inflated). As part of the
collinearity statistics, ‘tolerance’ and ‘Variance Inflation Factor’ (VIF) tests are
performed to indicate variables that contain redundant information. Tolerance (1-R2), an
indicator of how much collinearity that a regression analysis can tolerate and VIF
(1/tolerance), an indicator of how much of the inflation of the standard error could be
caused by collinearity were tested.
Descriptive statistics included analysis of socio-demographic characteristics,
stunting and other covariates. Bivariate analysis (Chi-square tests) was performed to
study the relationship between proximate determinants of food security (dietary diversity,
WASH, IYCF practices, EE, wealth index etc.) and stunting. Separate multiple logistic
regression models examined the association between the determinants of food security
and stunting while controlling for the confounding factors. Cases with missing values on
any of the dependent or independent variables were excluded from the logistic regression
analysis. Results of the multivariate analysis are presented as the odds ratios. The
outcome variables for nutritional status was defined as binary variables taking the value
one if the child was stunted and zero if the child was not stunted.
Since DHS surveys are conducted using a cluster sample design, observations
within a cluster are expected to be more alike than observations in different clusters.
Since proposed determinates of food security may vary with other variables such as
mother’s education, models were constructed to test interactions between determinates of
stunting and other factors such as mother’s education and child’s age, etc. These were
included in the final model if they were significant at the 5 percent level. All of the

41
significant variables (potential confounders) from the bivariate analysis were introduced
in the multivariate model.
Sampling, Weighting, and Stratification
MDHS data were collected using two-stage stratified cluster sample and not
simple random sampling. First, enumeration areas (EAs)from the census were randomly
selected from a list of all such areas. These are also called ‘clusters’ or ‘primary sampling
units’. These were town or villages, or census tracts in cities. Next, all the households in
the cluster were counted and labeled. Then, a random-selection was used to select
households within each cluster. These households were visited for data collection.
While cluster sampling as done for MDHS surveys is much more practical, it
also means that the selected households are not statistically independent. Instead, the
characteristics of a given household (and its household members) are more like those of
other households in the same cluster, and are less like households in other clusters. This
effect of a non-independent sampling process, called the "sample survey design effect,"
shows up in the standard error of estimation statistics (means, regression coefficients).
Clustering tends to decrease the size of standard errors, leading to a greater likelihood of
rejecting the null hypothesis. In other words, it is more conservative to correct
statistically for the design effect.
The MNS Survey 2015-16 sample clusters were randomly selected from the
MDHS Survey 2015-16 sample clusters, which were selected according to a non-
proportional allocation of sample to different districts to their urban and rural areas, and
due to the possible differences in response rates. Thus, household level sampling weights
42
were used in the analyses presented for micronutrients to ensure that the results are
representative at the national and regional levels. Standard errors were calculated taking
into account clustering within and between households.
For data analyses, the cluster or primary sampling unit is v021 in women and
children’s files. STATA command pweight (probability weight) will be used for robust
standard errors: [pweight=weight]. Since separate samples were selected from each
stratum (regions in Malawi, urban/rural residence, education level, etc.), like clustering,
the observations within strata are not statistically independent, and adjusting for
stratification is required for more conservative inferences about statistical significance.
The stratification used to design the sample is based on the variable v023. It will be
computed using STATA is: strata(strata).
Each observation in the MDHS sample is chosen using a method of random
selection. Using this method, the probability of selection may not be equal for all
members of the population. Therefore, sampling weight for each observation is computed
as the inverse of the selection probability. Additional adjustments (such as household
non-response) is also made to the sampling weights and hence sampling weights is used
to estimate the characteristics of the target population from the reports of the sample.
Therefore, DHS sample weights were used in all analyses to make sample data
representative of the entire population and for computing both the population estimates
(such as means and regression coefficients) and their standard errors. There are different
weights for different sample selections or unit of analysis. For MDHS, sample weights
for women or child variable is “v005”. For analysis, the sampling weight were divided by
1,000,000. A global command, a single line of code at the start of analysis was used to
43
specify the complex survey design of the MDHS dataset: svyset [pweight=weight],
psu(v021) strata(strata).
All subsequent analyses, descriptive and bivariate analyses, accounted for survey
design to produce unbiased mean and accurate variance estimates by using svy: before
the rest of the command.
Ethical Approval
All procedures and questionnaires for MDHS surveys were reviewed and approved
by the Macro International and ICF International’s Institutional Review Boards (IRB).
The ICF International IRB ensured that the survey complied with the U.S. Department of
Health and Human Services regulations for the protection of human subjects (45 CFR
46), while the Malawi IRB ensured that the survey complied with laws and norms of the
country. A joint proposal for MDHS and MNS surveys was submitted and approved by
the National Health Sciences Research Committee, Malawi. As part of MDHS surveys,
an informed consent was administered to all respondents before implementing the survey
questionnaire, anthropometric measurements or anemia testing. For the MNS survey,
consent for both paper questionnaire, food collection, anthropometry, and biological
testing was asked from parents or guardians of children 0–5 years. The MDHS and MNS
surveys ensure confidentiality of the survey respondents by removing any personal
identifiers from the survey data.
This study is based on secondary analysis of existing data from MDHS surveys from
2000 to 2015-16, and MNS survey 2015-16. Ethical approval from the IRB of University
of Maryland, College Park was sought before data analysis was conducted.
44
Chapter 4: Results
This chapter presents the results of the study in the form of three research papers.
Paper I: Trends in childhood stunting: findings from Malawi, 2000-2016
Abstract
Objective: High rates of stunting have persisted in Malawi for several decades. This study
examined trends in stunting among pre-school children in Malawi.
Design: The study examined the data for trend analysis using the cross-sectional
population-based surveys in Malawi from 2000 to 2016. Stunting in children was defined
as height-for-age index more than two standard deviations below the reference median.
Bivariate and multivariate analyses are used to estimate the change in stunting by socio-
demographic variables, adjusted for sampling design effects.
Setting: Malawi Demographic and Health Surveys (MDHS) data collected in 2000, 2004-
05, 2010, and 2015-16.
Subjects: Children ages 0–59 months with data on anthropometric measurements from
the Malawi Demographic and Health Surveys in 2000 (n=18,685), 2004 (n=15,751),
2010 (n=9,119), and 2016 (n=5,159).
Results: The prevalence of stunting decreased in children from 54.3 percent in 2000 to
36.6 percent in 2016. The change in the levels of stunting from 2000 to 2004 was not
highly statistically significant (t=2.09, p=0.037), compared to decreases in the levels of
stunting from 2004 to 2010 (t=4.51, p=0.000), and 2010 to 2016 (t=6.13, p=0.000).
45
Compared to 2000, the odds of stunting in children ages 0–59 months decreased by 14
percent in 2004, and by a remarkable 46 percent in 2016.
Conclusion: Stunting decreased linearly among children in Malawi from 2000 to 2016.
Age, sex, birth interval, wealth, region, residence, and mothers educational and
nutritional status are independently associated with stunting among children. Trends were
statistically significant for all variables and sub-groups examined. The prevalence of
childhood stunting remains a significant public health issue in Malawi.
Keywords
Stunting, trends, Malawi, pre-school children
Introduction
Stunting is a marker of multiple pathological conditions and is associated with
severe physical and cognitive damage. It is one of the most significant impediments to
human development, affecting approximately 162 million children under age 5 [115].
The global trend in stunting prevalence and the number of stunted children is decreasing,
but in Africa, although there has been some progress the number of stunted children is
rising [116]. In Sub-Saharan Africa Burundi (57.7 percent) has the highest rate of
stunting followed by Malawi (47.1 percent). However, unlike Burundi and other
countries under conflict, Malawi has benefited from decades of peace and political
stability [117]. Despite this stability, Malawi has one of the highest prevalence rates of
stunting among children under age 5. The stunting levels have largely remained
unchanged in the past two decades [118].
46
Among sub-Saharan countries, landlocked countries such as Malawi have higher
rates of stunting than coastal, central, or southern African countries. Research indicates
that there are hotspots within countries, and different populations have varying levels of
stunting within countries [115, 119, 120]. To implement targeted interventions to reduce
stunting, there is a need to identify the prevalence and trends in stunting regionally and
by socio-demographic groups. The national level of stunting may not reflect the trends
among socio-demographic groups over the years. Therefore, this study examined the
trends in stunting as they relate to nutrition, socio-demographic and socio-economic
factors, which may help design public policies and interventions to reduce childhood
undernutrition in Malawi.
Previous studies have shown that demographic characteristics, including age, sex,
birth interval, mother’s education, nutritional status, improved sources of drinking water
and sanitation facilities, and household wealth has been associated with stunting in
children [116, 121, 122]. To understand sub-group differences in Malawi, this study
disaggregates the national-level data to socio-demographic sub-groups and presents
changes in stunting among children ages 0–59 months over time from 2000 to 2016.
Methods
The study conducted a secondary analysis of four Malawi Demographic and
Health Surveys (MDHS) from 2000 to 2016. The surveys were conducted by the NSO of
Malawi with technical assistance from Macro International/ICF and funded by the United
States Agency for International Development. The surveys used a two-stage cluster
sampling design with EAs as primary sampling units and households as secondary
sampling units. The sample for the MDHS surveys was large enough for robust national
47
prevalence estimates. In total, the four survey datasets comprised 48,714 children with
anthropometry data. The weighted sample sizes of children ages 0–59 months were
18,685 in 2000, 15,751 in 2004, 9,119 in 2010, and 5,159 in 2016. For MDHS 2000,
anthropometry data were collected from all children if their mothers were eligible for the
interview, for the subsequent years, all children who slept in a household the night before
the interview were eligible regardless of the mother’s eligibility or interview status.
Anthropometric measurements: Height-for-age/length-for-age is defined as
height or length of a child relative to the height or length of a child of the same age in a
reference population, expressed either as a Z-score or as a percentage relative to the
median of the reference population. A child who has low height-for-age is described as
being “stunted.” Standing height measurements in all four surveys were carried out in
children ages 0–59 months using a measuring board developed by Shorr productions.
Recumbent length was measured for children less than 24 months of age. The 2000 and
2004 MDHS datasets for height-for-age with previously used National Center for Health
Statistics/World Health Organization (WHO) reference population were made
comparable to the WHO Child Growth Standards, released in 2006. Subsequently, the
height-for-age Z-scores were calculated based on WHO growth standards for all four
surveys [123]. The datasets were cleaned and extreme values (<-6 standard deviation
[SD] or >+6SD) that were likely to represent measurement or data entry errors, or
biologically implausible values were eliminated. Stunting was defined as height-for-age
Z-score <-2SD from the WHO Child Growth Standards.
Socio-demographic variables: Common household, child, and maternal variables
were included in the trend analysis. Some of the variables were recoded into categories
48
for a meaningful comparison. The household variables included residence (urban, rural),
region (northern, central, and southern), wealth index (asset-based index grouped into
five categories—poorest, poorer, middle, richer, and richest), and source of drinking
water (improved and unimproved sources of drinking water) and sanitation facility
(availability of improved and unimproved toilet facility). Child characteristics included in
the study were age in months (<6, 6–9, 10–11, 12–15, 16–23, 24–35, 36–47, and 48–59
months), sex (male, female), birth order (1, 2–3, 4–5, 6+), and birth interval (first birth,
<24 months, 24–35 months, 36–47 months, and 48+ months). Whereas the maternal
variables included in the analysis were mother’s education (no education, primary,
secondary or higher), and body mass index (BMI) (weight in kilograms divided by square
of height in meters). Based on the BMI cutoff, women were defined as underweight (BMI
<18.5 kg/m2), normal weight (BMI =18.5 – 24.9 kg/m2), and overweight or obese (BMI
≥25 kg/m2).
Data analysis: Data were analyzed using STATA version 14.0 (StataCorp., TX).
Datasets for the last four DHS surveys were combined by merging the data, and sample
weights were used to account for unequal probability of sampling for non-response. In
addition to exploring the height-for-age Z scores in children ages 0_59 months, children
were also classified as stunted (<-2SD) or not stunted (>-2SD) for comparison across
surveys and across various socio-demographic groups. We performed bivariate analysis
using chi-square to find out the association between pairs of variables, that is, between
stunting and select explanatory and background variables. We performed the chi-square
test for homogeneity and calculated the standard errors and confidence intervals for the
prevalence estimates. We also performed a multivariate logistic regression of stunting
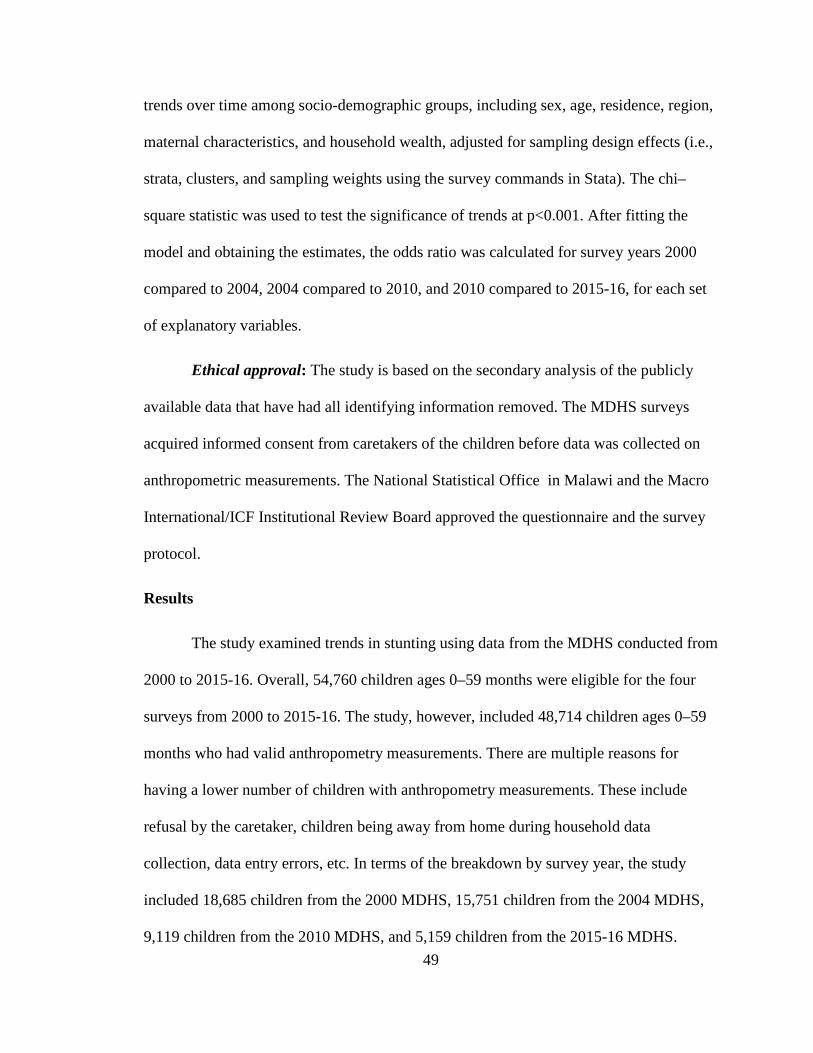
49
trends over time among socio-demographic groups, including sex, age, residence, region,
maternal characteristics, and household wealth, adjusted for sampling design effects (i.e.,
strata, clusters, and sampling weights using the survey commands in Stata). The chi–
square statistic was used to test the significance of trends at p<0.001. After fitting the
model and obtaining the estimates, the odds ratio was calculated for survey years 2000
compared to 2004, 2004 compared to 2010, and 2010 compared to 2015-16, for each set
of explanatory variables.
Ethical approval: The study is based on the secondary analysis of the publicly
available data that have had all identifying information removed. The MDHS surveys
acquired informed consent from caretakers of the children before data was collected on
anthropometric measurements. The National Statistical Office in Malawi and the Macro
International/ICF Institutional Review Board approved the questionnaire and the survey
protocol.
Results
The study examined trends in stunting using data from the MDHS conducted from
2000 to 2015-16. Overall, 54,760 children ages 0–59 months were eligible for the four
surveys from 2000 to 2015-16. The study, however, included 48,714 children ages 0–59
months who had valid anthropometry measurements. There are multiple reasons for
having a lower number of children with anthropometry measurements. These include
refusal by the caretaker, children being away from home during household data
collection, data entry errors, etc. In terms of the breakdown by survey year, the study
included 18,685 children from the 2000 MDHS, 15,751 children from the 2004 MDHS,
9,119 children from the 2010 MDHS, and 5,159 children from the 2015-16 MDHS.
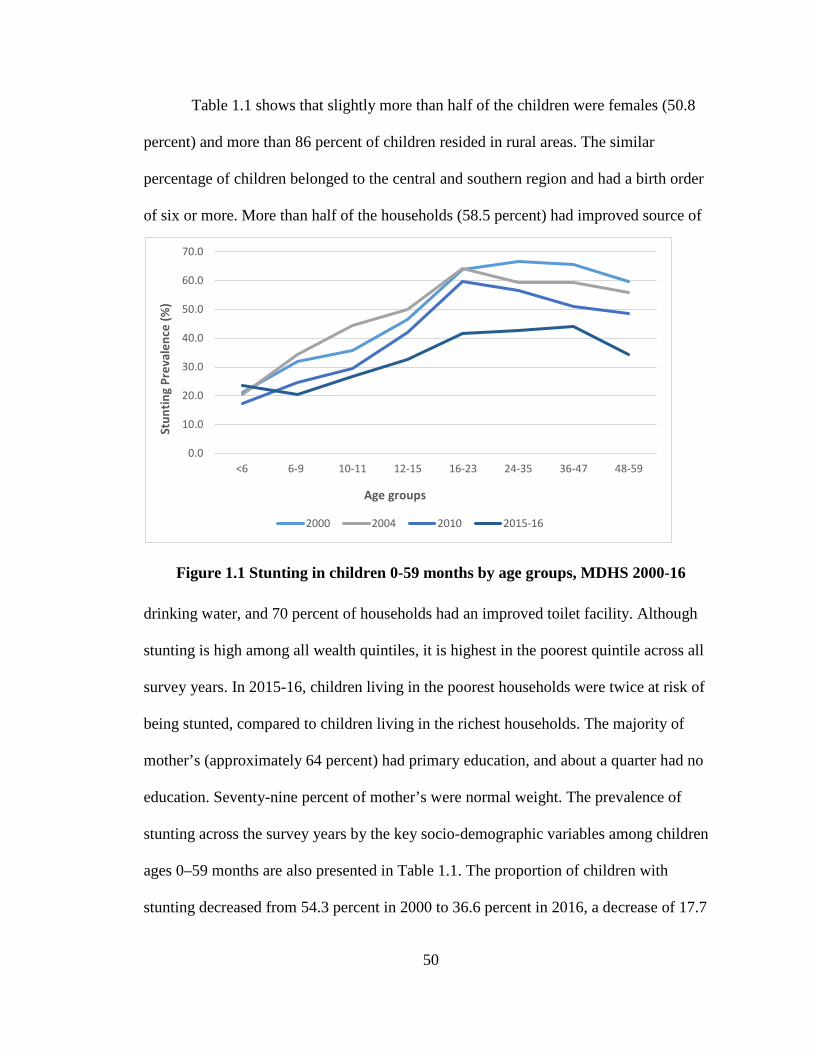
50
Table 1.1 shows that slightly more than half of the children were females (50.8
percent) and more than 86 percent of children resided in rural areas. The similar
percentage of children belonged to the central and southern region and had a birth order
of six or more. More than half of the households (58.5 percent) had improved source of
Figure 1.1 Stunting in children 0-59 months by age groups, MDHS 2000-16
drinking water, and 70 percent of households had an improved toilet facility. Although
stunting is high among all wealth quintiles, it is highest in the poorest quintile across all
survey years. In 2015-16, children living in the poorest households were twice at risk of
being stunted, compared to children living in the richest households. The majority of
mother’s (approximately 64 percent) had primary education, and about a quarter had no
education. Seventy-nine percent of mother’s were normal weight. The prevalence of
stunting across the survey years by the key socio-demographic variables among children
ages 0–59 months are also presented in Table 1.1. The proportion of children with
stunting decreased from 54.3 percent in 2000 to 36.6 percent in 2016, a decrease of 17.7
0.0
10.0
20.0
30.0
40.0
50.0
60.0
70.0
<6 6-9 10-11 12-15 16-23 24-35 36-47 48-59
Stun
ting
Prev
alen
ce (%
)
Age groups
2000 2004 2010 2015-16
51
percentage points. Age-specific data on stunting (Table 1.1 and Figure 1.1) show a steady
increase in the prevalence of stunting by age group. For all surveys combined, the
stunting rates reach a peak for the age group of 16–23 months, and then plateau and
increase again for the age group 36–47 months with the exception of survey year 2010.
Although for all survey years, as expected, the prevalence of stunting in low in
children under six months of age, it is perplexing to note that stunting is higher among
this age group for the 2015–16 survey year, and the levels reach a nadir at ages 6–9
months.
Figure 1.2 shows the distribution of mean height-for-age Z-scores for the pooled
data from 2000 to 2016 in children ages 0–59 months in Malawi. It shows that during that
16-year period, half the children in Malawi are stunted. Although stunting remains high
in 2016, the mean height-for-age Z–scores significantly decreased from -205.811 in 2000
to -152.916 in 2016 (Figure 1.3).
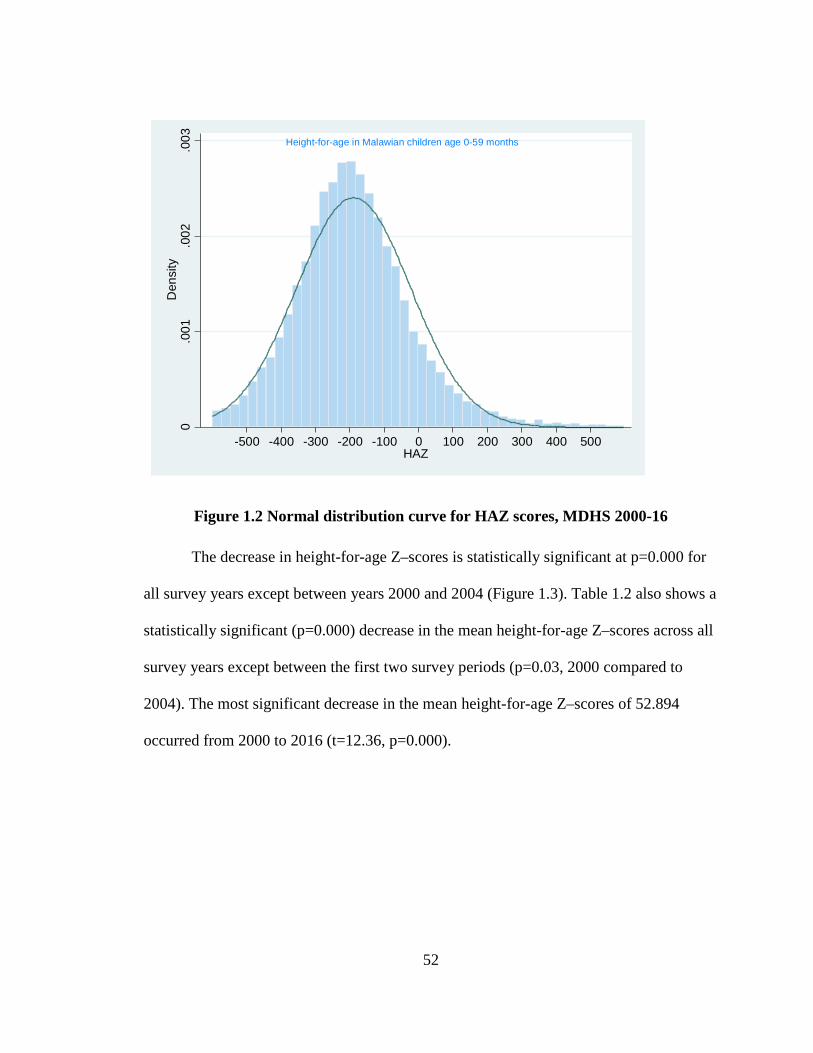
52
Figure 1.2 Normal distribution curve for HAZ scores, MDHS 2000-16
The decrease in height-for-age Z–scores is statistically significant at p=0.000 for
all survey years except between years 2000 and 2004 (Figure 1.3). Table 1.2 also shows a
statistically significant (p=0.000) decrease in the mean height-for-age Z–scores across all
survey years except between the first two survey periods (p=0.03, 2000 compared to
2004). The most significant decrease in the mean height-for-age Z–scores of 52.894
occurred from 2000 to 2016 (t=12.36, p=0.000).
Height-for-age in Malawian children age 0-59 months
0.0
01.0
02.0
03D
ensi
ty
-500 -400 -300 -200 -100 0 100 200 300 400 500HAZ
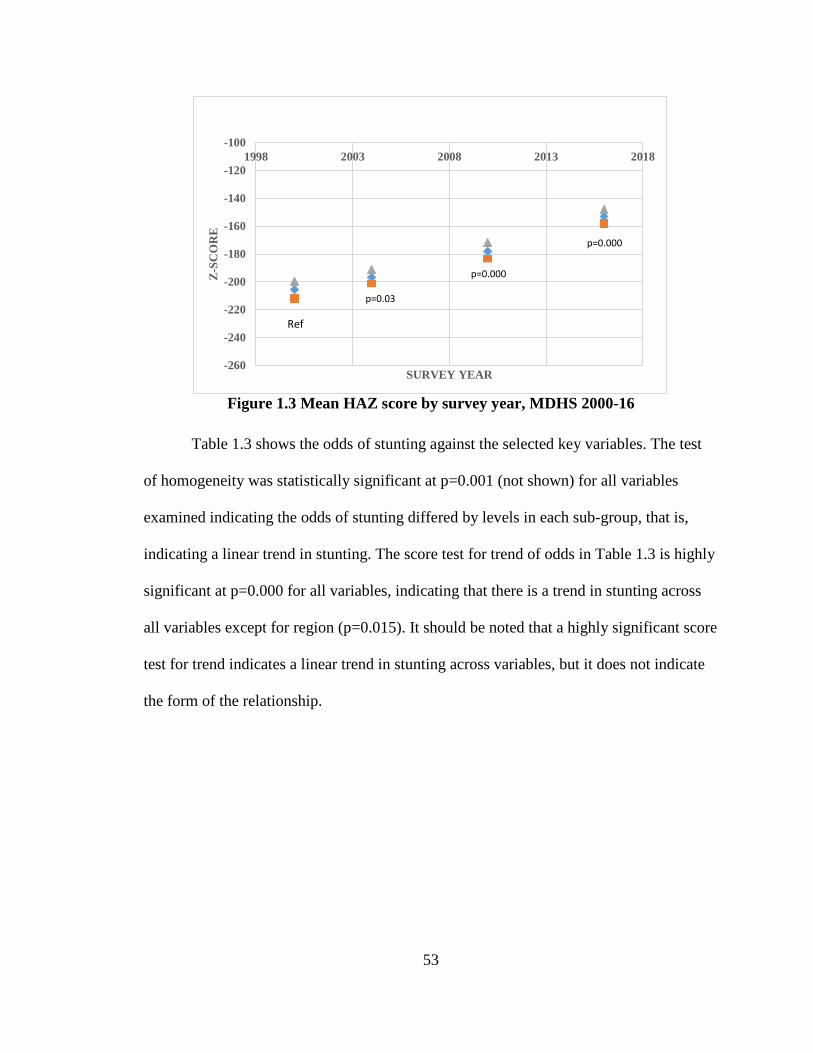
53
Figure 1.3 Mean HAZ score by survey year, MDHS 2000-16
Table 1.3 shows the odds of stunting against the selected key variables. The test
of homogeneity was statistically significant at p=0.001 (not shown) for all variables
examined indicating the odds of stunting differed by levels in each sub-group, that is,
indicating a linear trend in stunting. The score test for trend of odds in Table 1.3 is highly
significant at p=0.000 for all variables, indicating that there is a trend in stunting across
all variables except for region (p=0.015). It should be noted that a highly significant score
test for trend indicates a linear trend in stunting across variables, but it does not indicate
the form of the relationship.
-260
-240
-220
-200
-180
-160
-140
-120
-1001998 2003 2008 2013 2018
Z-SC
OR
E
SURVEY YEAR
Ref
p=0.000
p=0.000
p=0.03
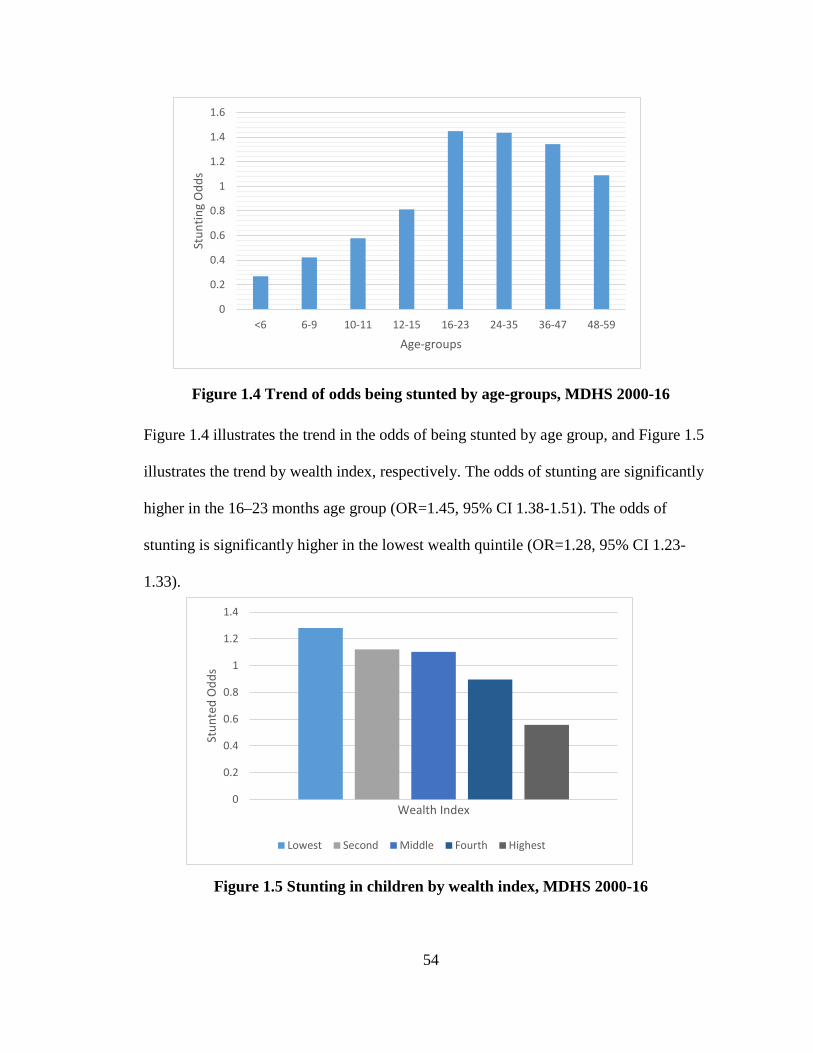
54
Figure 1.4 Trend of odds being stunted by age-groups, MDHS 2000-16
Figure 1.4 illustrates the trend in the odds of being stunted by age group, and Figure 1.5
illustrates the trend by wealth index, respectively. The odds of stunting are significantly
higher in the 16–23 months age group (OR=1.45, 95% CI 1.38-1.51). The odds of
stunting is significantly higher in the lowest wealth quintile (OR=1.28, 95% CI 1.23-
1.33).
Figure 1.5 Stunting in children by wealth index, MDHS 2000-16
0
0.2
0.4
0.6
0.8
1
1.2
1.4
1.6
<6 6-9 10-11 12-15 16-23 24-35 36-47 48-59
Stun
ting
Odd
s
Age-groups
0
0.2
0.4
0.6
0.8
1
1.2
1.4
Stun
ted
Odd
s
Wealth Index
Lowest Second Middle Fourth Highest
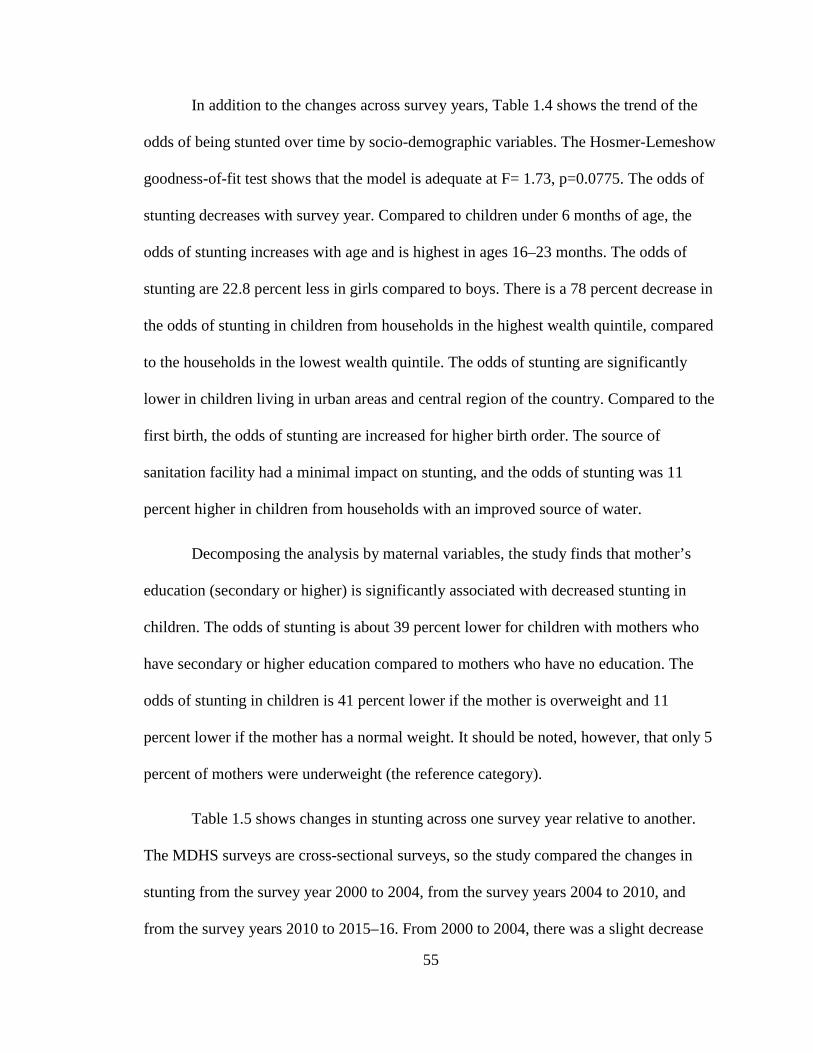
55
In addition to the changes across survey years, Table 1.4 shows the trend of the
odds of being stunted over time by socio-demographic variables. The Hosmer-Lemeshow
goodness-of-fit test shows that the model is adequate at F= 1.73, p=0.0775. The odds of
stunting decreases with survey year. Compared to children under 6 months of age, the
odds of stunting increases with age and is highest in ages 16–23 months. The odds of
stunting are 22.8 percent less in girls compared to boys. There is a 78 percent decrease in
the odds of stunting in children from households in the highest wealth quintile, compared
to the households in the lowest wealth quintile. The odds of stunting are significantly
lower in children living in urban areas and central region of the country. Compared to the
first birth, the odds of stunting are increased for higher birth order. The source of
sanitation facility had a minimal impact on stunting, and the odds of stunting was 11
percent higher in children from households with an improved source of water.
Decomposing the analysis by maternal variables, the study finds that mother’s
education (secondary or higher) is significantly associated with decreased stunting in
children. The odds of stunting is about 39 percent lower for children with mothers who
have secondary or higher education compared to mothers who have no education. The
odds of stunting in children is 41 percent lower if the mother is overweight and 11
percent lower if the mother has a normal weight. It should be noted, however, that only 5
percent of mothers were underweight (the reference category).
Table 1.5 shows changes in stunting across one survey year relative to another.
The MDHS surveys are cross-sectional surveys, so the study compared the changes in
stunting from the survey year 2000 to 2004, from the survey years 2004 to 2010, and
from the survey years 2010 to 2015–16. From 2000 to 2004, there was a slight decrease
56
in stunting from 54.3 percent to 52.2 percent. Similar decreases were also observed for
girls, children living in rural areas, and specific age categories (10–11, 24–35, and 36–47
months). These were significant at P<0.05. No significant changes were observed for
other selected variables or sub-groups. Although stunting remained high at 47.1 percent
in 2004, it was significantly (P<0.000) reduced for a number of variables and sub-groups
from 2004 to 2010. These include girls, children living in rural areas, children living in
the central region, children with a birth interval of +48, and children with households that
had an improved water source and children from households that fell in the middle wealth
quintile, and children with mother’s who had a primary education. A slightly significant
(P<0.05) decrease in stunting was also observed for a majority of variables and subgroups
(see Table 1.5). The most significant (P≤0.000) decrease for most all variables and sub-
groups occurred from 2010 to 2016. Except for the age groups less than 6, 6–9 months,
10–11 months, birth interval of +48 months, and children with mothers who were
underweight all other variables and sub-groups showed a significant (P<0.05) decrease in
stunting from 2010 to 2016.
Discussion
Results of the study show that there is a linear trend in the reduction of stunting
across survey years, and this trend exists for all variables and sub-groups within each
variable. Stunting in children decreased from 54.3 percent in 2000 to 36.6 percent in
2015-16. An impressive 10.5 percentage points decrease in stunting occurred between
2010 and 2016. This aligns with the United States Agency for International
Development/Malawi’s goals for 2017 to reduce the prevalence of stunting in children
under age 5 [98]. This also follows the period when Malawi experienced a food surplus
57
during the 2008–2009 growing season due to favorable weather and the Farm Input
Subsidy Programme initiated by Government of Malawi [124].
Compared to children under 6 months of age, the odds of stunting increase by
more than 50 percent in children ages 6–9 months. This coincides with the period when
protection from mothers antibodies have started to wane, and children become more
mobile and hence exposed to infections [125, 126]. The odds of stunting are highest in
the children ages 16–23 months (Figure 1.4), which is consistent in the literature from
Malawi [126].
The current study shows an interesting finding that although the rates of stunting
decrease significantly in 2016 compared to the preceding survey years, stunting in
children under 6 months of age was higher in 2016 compared to the previous years. This
is contrary to the literature that suggests that growth faltering starts at six months of age.
However, a cohort study in rural Malawi found that stunting incidence was highest during
the first six months of age [127], and recent research shows that malnutrition in children
under 6 months of age is on the rise, and they are vulnerable to malnutrition irrespective
of their breastfeeding status [128]. Some research also indicates that in some settings,
prevalence of stunting start to rise at about 3 months of age [129]. This is an important
and concerning departure from age-specific trends in stunting nationally and globally.
Although most infant and young child feeding indicators are collected for children ages
6–24 months, future studies should also focus on children under 6 months, because
stunting is a long-term process that results from multiple insults that often starts as early
as in utero and continues through the first three years of child’s life [88, 130]. Newborns
in Lungwena, Malawi are on average 2.5 cm shorter at birth compared to the 2000

58
Centers for Disease Control and Prevention reference population [127]. In fact, it has
been estimated that compared to the reference population, in Malawi, approximately 20
percent of 10-cm deficit in height at three years of age is already present at birth [127,
131], and the intra-uterine growth retardation-low birth weight is estimated to be around
15 percent [126].
Stunting is negatively correlated with household wealth in all four surveys. From
2000 to 2015–16, the prevalence of stunting has decreased in each wealth quintile. This
could be because income poverty appears to have decreased between 2004–2005 and
2010–2011. Although stunting is higher among the poorest households, like many other
sub-Saharan countries, rates of stunting also remain relatively high among the non-poor
households [119]. In addition, the reason stunting is high in all wealth quintiles could be
because more than half of the population (50.7 percent) lives below the poverty line
[132]. These observations are similar to other studies in the literature [126, 133, 134].
In the first two surveys, between 2000 and 2004, there is virtually no difference in
stunting with respect to the source of drinking water. The trends, however, changes in
2010 and 2016 with reduced stunting among children with households that reported an
improved source of drinking water. For all four surveys reduced stunting is observed
among children from households that had improved source of toilet/sanitation facilities.
Various studies have found a negative correlation between the source of toilet/sanitation
facilities and stunting among children [133]. These findings align with other studies that
suggest that improving water, sanitation, and hygiene improves linear growth in children
[58].
59
With respect to the region, the central region of Malawi has the highest stunting
rate, followed by the southern region. This has been documented in previous studies
[126]. Children from the rural areas have higher stunting than children from the urban
areas. Other studies suggest the trend has not changed since the 1990s [126, 134].
Preceding birth interval is also a predictor of stunting in children. The study found
that stunting is lower when the birth interval is more than 48 months. In general, except
for the first birth, there is an inverse relationship between the length of the preceding
birth interval and the proportion of children who are stunted. Likewise, for all four
surveys, stunting was highest when the birth interval was less than 24 months.
Similar to other studies, sex inequalities in this study are substantially smaller
than economic inequalities [135]. Our study also observed slightly higher rates of
stunting in boys compared to girls for all survey years. Although stunting decreased in
both girls and boys by 17.6 percentage points from 2000 to 2016, boys had higher rates of
stunting for all survey periods. A number of studies have found that in sub-Saharan
countries, among children under 5, boys have slightly higher rates of stunting compared
to girls [119, 136].
This study demonstrates the importance of maternal factors. Mother’s education
was consistently and significantly associated with stunting in all four surveys. Study
findings show that attainment of higher education (i.e., secondary or higher education)
was associated with lower the odds of childhood stunting. This is consistent with other
studies that have shown that mother’s education is a major determinant of whether a child
becomes malnourished [126, 133]. Maternal undernutrition is also a determinant of child
undernutrition. Children whose mothers were underweight (BMI <18.5) were more likely
60
to be stunted, compared to children whose mothers were a normal weight or overweight.
This is an expected finding as mothers who have higher education are more empowered
to be able to take decisions regarding nutrition and care of their children.
Comparison of stunting between survey periods and trends in stunting for each of
the covariates shows a significant reduction in stunting from 2010 to 2015-16. This
reduction can be attributed to several programs and Government of Malawi initiatives
that aim to reduce stunting and poverty in Malawi. These include Feed the Future, Food
for Peace, Counting to 2015, Scaling Up Nutrition which all started around 2010-2011
[19].
The levels of stunting are on the decline in Malawi, however, more than one in
three children remain stunted and stunting remains high across all sub-groups, which
indicates the need fortargeted interventions in accelerating reductions in stunting among
children in Malawi. Despite a strong government commitment, strong agricultural
productivity, and economic growth in recent years, the severity of malnutrition in Malawi
remains persistent, even in the upper wealth quintile [137]. This accentuates the
importance of factors not related to income but associated with knowledge, attitudes and
practices with regard to food production, preparation, and consumption; breastfeeding
and other young child feeding practices; and disease prevention. Future studies need to
explore the relationship between these factors and stunting in children in Malawi.
61
Conclusion
At the national level, stunting among children in Malawi decreased, from 54.3
percent to 36.6 percent between 2000 and 2016. Despite the remarkable decrease in
stunting, it remains of high public health significance in Malawi. According to the Global
Nutrition Report, Malawi has made some progress in reducing stunting among children,
but the progress remains off course [138]. Findings from our study indicate that child’s
age is an important factor in the prevalence of stunting. Higher stunting in children under
6 months of age in 2016 compared to previous years, in general, does not align with the
existing research; however, studies in rural Malawi have found highest incidence of
stunting in children under 6 months. Our findings suggest that stunting during
intrauterine period and first 6 months needs to be examined in future studies.
There is evidence that proximate and distal determinants such as child feeding
practices, inadequate care and complementary feeding, water sanitation and hygiene
practices, infections, and environmental enteropathy play an important role in stunting
[130]. Future studies should explore the proximate and distal determinants of stunting in
Malawi, which may better inform effective policies and programmatic interventions.
62
Paper II: Determinants of Childhood Stunting in Malawi – an analysis of the data from the Malawi Demographic and Health Survey, 2015-16 Abstract
Background: Despite recent reductions, stunting in Malawi is among the highest in the
world. The complex determinants of stunting include poverty, gender, low rates of
exclusive breastfeeding, inadequate care and complementary feeding, limited access to
sanitation facilities, environmental enteropathy and recurrent infections. How these
factors impact stunting and their relative contribution remains to be investigated. The aim
of this study is to explore key determinants of stunting in Malawi.
Methods: The study uses the data from Malawi Demographic and Health Surveys, 2015-
16 to explore the proximate and distal determinants of childhood stunting in 2,018
children 0–23 months with anthropometric measurements. The association between
stunting and socio-demographic, maternal and child factors was assessed using step-wise
logistic regression.
Results: In separate models, prevalence of stunting is significantly higher in boys than
girls, in children living in rural areas than urban, and in children that have experienced
diarrhea in the past 2 weeks. Stunting is also higher among children from poorest or
poorer households. Paradoxically, stunting is higher in children from households that
own land and have higher land area. Mother’s BMI and children’s dietary diversity was
negatively associated with stunting. In the final model, gender, age, birth interval, and
ownership of land remains the strongest determinants of childhood stunting.
63
Conclusion: Childhood stunting is widespread in Malawi. The study identifies factors that
are associated with stunting in children, including socio-economic disparities that may be
critical in designing policies and interventions to reduce stunting Malawian children.
Introduction
Prevalence of stunting in Malawi is one of the highest in Sub-Saharan Africa.
Data from the Demographic and Health Surveys and recent research show that Malawi
has made impressive gains in reduction of stunting from 54.3 percent in 2000 36.6 in
2016 (Kaur et al, transcript in preparation). The prevalence of childhood stunting
remains high.
Prendergast and Humphrey[120] in their seminal paper, “ Stunting syndrome in
developing countries” and de Onis and Branca [115] on “Childhood stunting: A global
perspective,” emphasize the importance of pathological changes that are due to linear
growth faltering, which includes increased morbidity, mortality, reduced physical,
neurodevelopmental, and economic capacity, and elevated risk of metabolic disease in
adulthood and not just short stature.
Children who are malnourished during the first 1,000 days of life have weaker
immune system predisposing them at risk for severe infectious diseases, including
diarrhea and pneumonia. The interaction between infections and malnutrition have been
recognized as early as 1960s showing that repeated diarrhea and other childhood illness’s
results in altered growth trajectories in children [45]. It has been shown that impoverished
children start off on a fairly good growth trajectory which is comparable to healthy
children. It is only after repeated diarrheal diseases and other infections that the growth
64
faltering starts to happen in children less than 2 years of age [46]. The prevalence of
stunting increases very rapidly between 12 to 24 months, and continues to increase until
36 months, and remains fairly stable until five years [139]. Therefore, the first two years
of the child’s life is extremely important for optimal growth.
Since stunting is result of a complex interaction of household, environmental, and
socio-economic influences, a multi-sector approach consisting of improving food
security, dietary diversity, childcare, and disease-control interventions have the potential
to reduce childhood stunting [1, 115]. Multi-sectoral approaches to nutrition have shown
to accelerate progress in reducing childhood stunting – these include both nutrition-
specific and nutrition-sensitive interventions. The nutrition-specific factors examine the
immediate causes of inadequate dietary intake and underlying causes inadequate feeding
and care practices, household food insecurity, access to food, and inadequate financial
and human resources[78]. On the other hand, the nutrition-sensitive factors explore the
underlying and basic causes of malnutrition by including nutrition goals and actions from
a wide range of sectors, including environment, WASH, agriculture, health services,
girl’s and women’s education, socio-cultural interventions, including focus on women’s
nutrition and empowerment [78].
Studies have examined the complex determinants of stunting–these include
poverty, gender, low rates of exclusive breastfeeding, inadequate care and
complementary feeding, limited access to sanitation facilities, environmental enteropathy
and recurrent infections [3, 23, 115, 120, 122, 135, 140]. The recent development
initiatives in Malawi have promoted smallholder diversification through introducing
additional crop and livestock species with the intention to improve household nutrition.
65
However, the link between ownership of land and land area and stunting has not been
explored. Therefore, this paper contributes to the literature in exploring the proximate and
distal determinants of childhood stunting in children 0-23 months that may be critical in
designing policies and interventions to reduce stunting in children in Malawi. The study
selects children age 0–23 months because most of the intervention programs are focused
towards the crucial period of pregnancy and the first two years of life – the 1000 days
from conception to the child’s second birthday, and the infant and child feeding
guidelines are designed for children 0–23 months.
Research in context
Evidence before the study: Programmatically, there is evidence that a multi-sector
approach consisting of improving food security, dietary diversity, childcare, and disease-
control interventions have the potential to reduce childhood stunting.
Added value of this study: The study contributes to the exploration of the various
household-level pathways leading to stunting in children.
Implications of all the available evidence: The findings from the study are expected to
be relevant for informing food security policy and program implementation. Findings of
the study may have a significant potential programmatic benefit in terms of providing
empirical support for re-orientating nutrition programs to include other proximate
determinants of food security, more specifically nutrition-specific and nutrition-sensitive
factors as contributors to child growth.
Methods
Data source and design
The study analysed data from the 2015-16 Malawi DHS survey to determine the
proximate and distal determinants of childhood stunting in Malawi. The survey was
66
conducted by the National Statistical Office (NSO) with technical assistance from ICF
International and funded by the United States Agency for International Development. The
surveys utilized a two-stage cluster sampling design with EAs as primary sampling units
and households as secondary sampling units. The weighted sample sizes of children age
0–23 months was 6,225, but the height and weight information were collected only in
one-third of the households, and therefore, the study sample consisted of 2,018 children
with valid height and weight measurements. For MDHS 2015-16, anthropometry data
was collected from all children who slept in the household a night before the interview
regardless of the mother’s eligibility or interview status.
The effects of various socio-demographic and health factors on stunting will be
estimated using bivariate and multivariate logistic regression procedures in Stata 15.0
(Stata Corp., College Station, TX). A number of logistic regression models were
estimated to assess the relative significance of confounding factors included in the
analysis.
Outcome Variable
Height-for-age or length-for-age is defined as height or length of a child relative
to the height or length of a child of the same age in a reference population, expressed
either as a Z-score or as a percentage relative to the median of the reference population.
A child who has low height-for-age is described as being “stunted.” Standing height
measurements in all four surveys were carried out in children ages 0–59 months using a
measuring board developed by Shorr productions. Recumbent length was measured for
children less than 24 months of age. The MDHS survey 2000 and 2004 datasets for
height-for-age with previously used NCHS/WHO reference population were made
67
comparable to the WHO Child Growth Standards, released in 2006. Subsequently, the
height-for-age Z-scores were calculated based on WHO growth standards for all four
surveys [123]. The datasets were cleaned and extreme values (<-6SD or >+6SD) that are
likely to represent measurement or data-entry errors, and biologically implausible were
eliminated. Stunting was defined as height-for-age Z–score <-2SD from the WHO Child
Growth Standards.
Explanatory Variables
Socio-demographic variables: Common household, child, and maternal variables
were included in the trend analysis. Some of the variables were recoded into categories
for a meaningful comparison. The household variables included residence (urban, rural),
region (northern, central, and southern), wealth index (asset-based index grouped into
five categories - poorest, poorer, middle, richer, and richest), and source of drinking
water (improved and unimproved sources of drinking water) and sanitation facility
(availability of improved and unimproved toilet facility). Child characteristics included in
the study were age in months (<6, 6–9, 10–11, 12–15, 16–23, 24–35, 36–47, and 48–59
months), sex (male, female), and birth interval (first birth, <24 months, 24–35, 36–47,
and 48+ months).
Household wealth and land ownership: The DHS Wealth Index serves as a proxy
for household economic status. It is a composite measure of household’s cumulative
living standard. The wealth index quintiles include: lowest, second, middle, fourth and
highest [106]. The index is based on whether the household owns common items such as
radio, television, bicycle, motorcycle, car, refrigerator, toilet, and has access to piped
water, etc., and measures household wealth using an index derived from asset variables
68
using principal components analysis (PCA) by placing individual households on a
continuous scale of relative wealth. In addition, ownership of animals was used as a
proxy for environmental enteropathy since in the rural landscape of Malawi, households
with livestock share close proximity of animals and children. Animals often share the
area where children play or where food is being cooked and eaten. Ownership of
agricultural land was used as a proxy for access to food. The reported agricultural land
area in hectares by the farming households was further categorized as small-scale farm
(<5 hectares); medium-scale farm (≥5 and <50 hectares); and large-scale farm (≥50
hectares).
WASH practices and ownership of livestock: Whether the household uses an
improved drinking water source: improved drinking water sources are piped water into
dwelling, plot, or yard; public tap/standpipe, tube well/borehole, protected dug well,
protected spring and rainwater collection. Whether the household has access to an
improved sanitation facility: improved sanitation is defined as having flush or pour/flush,
facilities connected to a piped sewer system, septic system, or a pit latrine; pit latrines
with a slab, composting toilets or ventilated improved pit latrines. Households with
livestock share close proximity of animals and children. Hence, ownership of livestock
was used as a proxy for environmental enteropathy. The dummy variables were created
for each livestock and assigned a value of 1 for presence of livestock. Similarly, a
composite indicator of the above variables was computed and assigned a value of 1 the
household has goats, pigs, chicken, poultry, cows and cattle.
IYCF variables: IYCF practices during the first two years of life are important in
growth and development of child. Poor infant and young child feeding practices are also
69
known contributors to child undernutrition. Exclusive breastfeeding includes children
aged 0–5 months who have received breast milk including expressed breast milk or breast
milk from a wet nurse. Early initiation of breastfeeding includes proportion of children
born in the past 24 hours preceding the survey that were put to breast within one hour of
birth, and continued breastfeeding of children age 12–15 months. The study explored
age-appropriate breastfeeding, i.e., whether infants age 0-5 months received only breast
milk during the previous day and whether children 6–23 months of age received
breastmilk, as well as solid, semi-solid or soft foods during the previous day. In addition
to computing the dietary diversity from seven food groups, the study also examined the
consumption of animal source foods that are considered good sources of iron, zinc,
vitamin A, and vitamin B12. Consumption of animal source foods provides highly
bioavailable micronutrients, protein and improves bioavailability of other micronutrients
[42].
Maternal factors: The maternal variables included in the analysis were mother’s
education (no education, primary, secondary or higher), and BMI (weight in kilograms
divided by square of height in meters). Based on the BMI cut-off, women were defined as
underweight (BMI <18.5 kg/m2), normal weight (BMI =18.5 – 24.9 kg/m2), and
overweight/obese (BMI ≥25 kg/m2). Mother’s anemia status was defined as mild anemia
(<11.0 g/dl), moderate anemia (7.0-9.9 g/dl), and severe anemia (<7.0 g/dl). Stunting in
mothers was defined as HAZ score<-2SD, and mother’s education as having no
education, primary, and secondary or higher education.
The study computed the women’s participation in household decision-making
either alone or jointly with husband or partner. The index is constructed based on
70
woman’s response to her say in large household purchases, her own healthcare, the
spending of money she earned, and visits to relatives. The index ranges from 0 to 3.
Women’s attitudes towards wife beating are the number of reasons for which a woman
thinks it is justified to beat wife. The index ranges from 0 to 5; a lower score reflects a
higher status of women. The MDHS survey 2015-16 also included the domestic violence
module in one-third of the sampled households. Physical, sexual, and emotional violence
was measured by asking a series of questions to all ever-married women.
Statistical analysis
To examine the independent and the combined effects of each of the predictors on
stunting, models were run separately and in the step-wise manner. Separate models were
created for socio-demographic and background predictors, household wealth and
ownership of land, child’s environment, and WASH practices, IYCF practices, and
maternal factors. Each of the models constructed were full models. The predictors that
did not fit reasonably well were dropped out of the model. Collinearity and goodness of
fit tests were also used to remove predictors that were not helping the model. After
individual models were created, predictors from each model were added to the original
model in a stepwise manner. Afterwards, a post-estimation method was used to store
results of the estimation commands to generate the final model.
Results
The MDHS survey 2015-16 consisted of 6,225 children age 0-23 months with
almost equal proportion of male (50.3 percent) and female (49.7 percent) children, with
anthropometry measurements collected in one-third of the households. After taking into
71
account the missing and flagged cases, and observations with height out of plausible
limits, the measurements were available for 2,018 children. Hence, the study sample
comprised of 2,018 children ages 0–23 months. The prevalence of stunting in children
age 0–23 months is 29.7 percent (Table 2.1) which is lower than the prevalence of 36.6
percent found in the previous study.
Bivariate results
This paper reports the study findings by socio-demographic variables, children’s
household environment and WASH, wealth and ownership of land, infant and young
child feeding practices, and maternal factors, including decision-making and
empowerment.
Socio-demographic factors: Table 2.2 shows prevalence of stunting in children 0–
23 months by socio-demographic characteristics. Prevalence of stunting is approximately
20 percent in children less than eight months, thereafter, more than one in four children
9–12 months are stunted. One year after birth, the prevalence of stunting continues to
increase steadily to reach 40 percent in children 18–23 months. The linear increase in
stunting is positively and statistically significant with an increase in age (p=0.0000).
Similar significant differences are observed for differences in stunting between males
(34.5 percent) and females (24.8 percent). Children in rural households have significantly
(p=0.0297) higher prevalence of stunting compared to children residing in the urban areas
(30.9 percent and 21.9 percent, respectively). Other background variables such as region
and birth interval, and stunting are not statistically significant at p<0.05.
72
Household environment and WASH: The prevalence of stunting in children varies
by the type of floor, wall, and roof of the dwelling. Children residing in households with
finished floors and roof have significantly (p=0.002) lower prevalence of stunting
compared to children from households that have natural or rudimentary floor and roof.
(Table 2.3). The bivariate analyses show no significant differences in stunting among
children with respect to the WASH variables, but the prevalence of stunting was higher
(32.9 percent) in children who were reported to have diarrhea compared to children who
did not have diarrhea (28.2 percent) in the preceding two weeks before the survey. The
association between stunting and diarrhea in children was statistically significant at
p=0.05. The relationship between stunting in children and household ownership of
livestock (cows, cattle, goats, pigs, chicken, and poultry) was not statistically significant
at p<0.05.
Household wealth and ownership of land: Table 2.3 shows a dramatic and linear
decrease in the prevalence of stunting by household wealth. The difference in prevalence
of stunting by wealth quintiles is statistically significant at p=0.003. Three quarters of the
households own some form of agricultural land, but children from these households have
higher prevalence of stunting compared to households that do not have own any land.
The size of the land is not associated with stunting.
Infant and young child feeding practices: The proportion of women who continue
to breastfeed is high (86.6 percent), but exclusive breastfeeding is relatively low (15.4
percent). Infants that are exclusively breastfed have lower prevalence of stunting (24.3
percent) compared to infants who are not being fed breastmilk (30 percent), receiving
breastmilk and solids (31.5 percent), or being fed other milk or liquids in addition to
73
breastmilk (36.6 and 38 percent, respectively). These differences are statistically
significant at p=0.05. About 77 percent of women initiated breastfeeding within one hour
of birth and less than 5 percent of women continued breastfeeding for at least one year,
its impact on stunting, however, is marginal and not statistically significant (Table 2.4).
About 13 percent of infants are introduced complementary feeding at ages 6–8
months. These infants have significantly lower prevalence of stunting at (20.9 percent;
p=0.01) compared to stunting in infants who did not consume solid or semi-solid foods at
age 6–8 months (31 percent).
Prevalence of stunting varies by dietary diversity score and is statistically
significant at p=0.03. Less than 2 percent of infants received diverse diets with 6+ food
groups. The recoded dietary diversity index did not show an impact of diverse diets in
reducing stunting among children in this study. Similarly, consumption of flesh foods
such as meat, flesh and poultry were not associated with reducing stunting.
Maternal factors, empowerment and decisionmaking: Mother’s BMI, short
height, and education have a strong association with stunting in children. Children with
stunted mothers have significantly higher prevalence of stunting (44.8 percent) compared
to children with mothers who are not stunted (25.7 percent) at p=0.0000. Similarly,
children with underweight mothers have higher prevalence of stunting (44.5 percent)
compared to children with mothers who are either normal weight (30.5 percent) or even
overweight (21.3 percent). Mother’s BMI and stunting in children were statistically
significant at p=0.001.
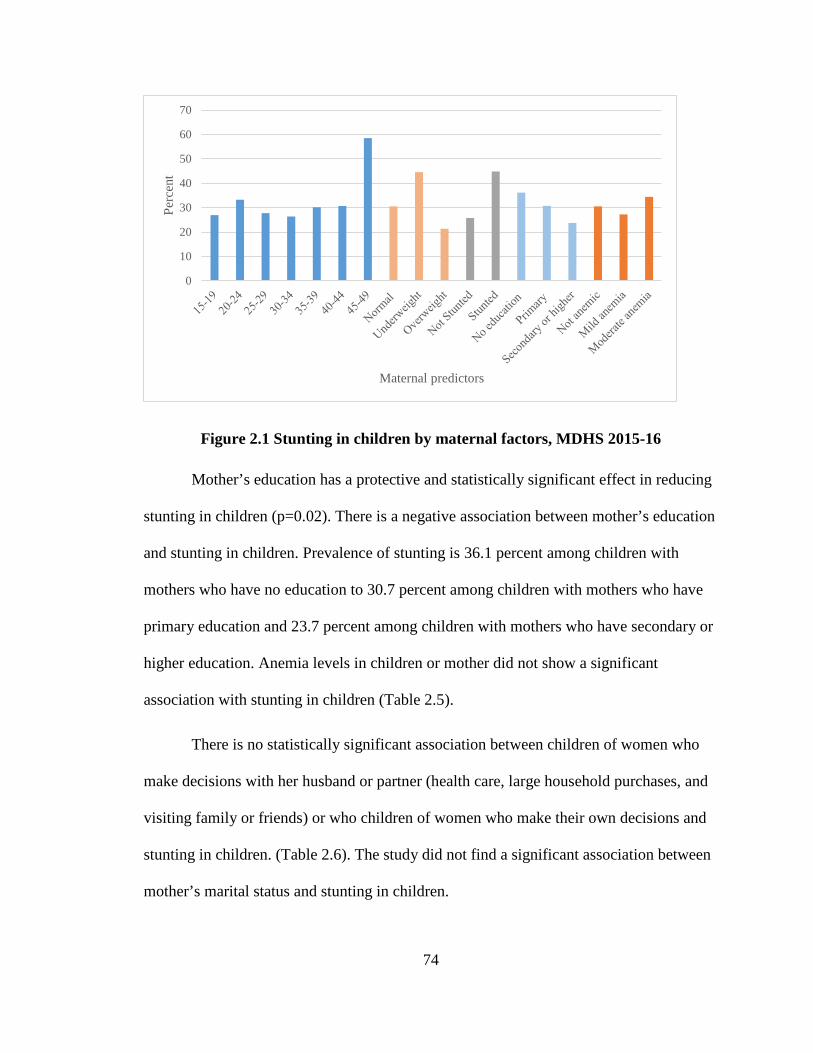
74
Figure 2.1 Stunting in children by maternal factors, MDHS 2015-16
Mother’s education has a protective and statistically significant effect in reducing
stunting in children (p=0.02). There is a negative association between mother’s education
and stunting in children. Prevalence of stunting is 36.1 percent among children with
mothers who have no education to 30.7 percent among children with mothers who have
primary education and 23.7 percent among children with mothers who have secondary or
higher education. Anemia levels in children or mother did not show a significant
association with stunting in children (Table 2.5).
There is no statistically significant association between children of women who
make decisions with her husband or partner (health care, large household purchases, and
visiting family or friends) or who children of women who make their own decisions and
stunting in children. (Table 2.6). The study did not find a significant association between
mother’s marital status and stunting in children.
0
10
20
30
40
50
60
70
Perc
ent
Maternal predictors
75
Women’s attitude towards wife beating has a significant association with stunting
among children especially when she feels it is not justified to beat wife if she goes out
(p=0.007).
The results failed to find an association between stunting among children and
mother’s experience of physical or sexual violence. However, women’s experience of
emotional violence is marginally associated with stunting in children (p=0.05). Children
of mothers who experience emotional violence have higher prevalence of stunting (34.9
percent) compared to children of mothers who do not experience emotional violence
(29.3 percent).
Multivariate results
To examine the independent and the combined effects of each of the predictors on
stunting, models were run separately (Tables 2.7, 2.8a, 2.9a, 2.10a, and 2.11a) for
association of stunting and socio-demographic variables (model I), children’s household
environment and WASH (model II), wealth and ownership of land (model III), infant and
young child feeding practices (model IV), and maternal factors, including
decisionmaking and empowerment (model V). Afterwards, stepwise models (Tables 2.7,
2.8b, 2.9b, 2.10b, and 2.11b) were run to create the final model (Table 2.12).
Model I: The first model examined the relationship between stunting and socio-
demographic variables (Table 27). Compared to children 0–5 months, the odds of being
stunted in children 13–17 months and 18–23 months increases by a factor of 1.76 and
2.39, respectively. The odds of females being stunted is 40 percent lower than males and
is statistically significant at p=0.000. Similarly, the odds of stunting is lower with
76
increase in the birth interval. The risk of stunting increases by a factor of 1.5 for children
living in rural areas compared with urban areas (p=0.04).
Model II: Table 2.8a presents the odds of stunting by wealth and ownership of
land. The odds of stunting in children from wealthier households were lower compared to
poorest households, the odds of stunting in children is statistically lower at p<0.05 and
p<0.001 for richer and richest households, respectively. Paradoxically, ownership of land
including ownership of a large-scale farm (≥ 50 hectares) was associated with higher risk
of stunting in children at p<0.05.
Model III: The model examines the relationship between stunting in children and
their environment and WASH practices (Table 2.9a). The study did not find a statistically
significant association between stunting in children and households that have safe
drinking water and improved sanitation. Similarly, household’s ownership of livestock or
prevalence of diarrhea in children in the past two weeks was not significantly associated
with stunting in children.
Model IV: Stunting was not associated with exclusive breastfeeding in children.
The odds of stunting were approximately 40 percent lower for children who received
complimentary food at age 6–8 months (p=0.005). Dietary diversity, i.e., consumption of
four or more foods groups did not have an association with stunting (Table 2.10a).
Model V: Table 2.11a presents the likelihood of stunting in children by maternal
factors. Having a stunted mother and an underweight mother significantly doubles the
odds of stunting in children (p=0.000 and p<0.05). There is 40 percent decrease in the
odds of stunting among children born to overweight mothers compared to children born
77
to normal weight women. violence against women did not result in statistically
significant association with stunting in children.
Final Model
Results of the stepwise regression models are reported in Tables 2.7, 2.8b, 2.9b,
2.10b 2.11b). In order to perform cross-model comparison of the stepwise regression
analysis, the final model was created that contained estimates for the five models (Table
2.12). The results of the multiple regression analyses confirm that the odds of stunting are
highly statistically significant (p<0.001) and lower among female children (p<0.001) and
children with adequate birth intervals.
The odds of stunting are significantly higher at p<0.001 among children age 18–
23 months, Higher birth interval, 36–47 months, reduces the risk of stunting significantly
(p<0.05).
In the stepwise regression analysis, wealth based on household asset failed to
show a significant association with stunting. The study did not find an association with
WASH, ownership of livestock, exclusive breastfeeding, and dietary diversity. Due to
multicollinearity, complimentary feeding was omitted from the final model The
ownership of land and households that have larger-scale farms have higher prevalence of
stunted children compared to households that does not own land and have small- or
medium-scale farms (p<0.05).
Among the maternal factors, mother’s stature and BMI very significantly
associated with stunting at p<0.001 and p<0.01, respectively. The odds of stunting are
significantly higher among children with a stunted mother (p<0.001). Having an
78
underweight mother also puts a child at a higher risk for stunting (p<0.01). Mother’s
education and stunting in children did not show a significant association.
Discussion
Socio-demographic factors: The prevalence of stunting in children age 0–23 months is
29.7 percent, which is lower than the prevalence of 36.6 percent in children ages 0––59
months found in the previous study. The difference in the prevalence of stunting is due to
the age of the sample children. Stunting in children two years and older increases rapidly
and continues to rise until 3-4 years. Our findings indicated that the risk of stunting
increases with age, consistent across several studies that have well documented an
increase in prevalence of stunting with age [120, 135, 141, 142]. Gender and urban/rural
differences with respect to stunting have been observed in Africa and in Malawi. The
results of this study are supportive of the wider literature that posits boys are more
stunted than girls, Many studies in sub-Saharan Africa have reported higher prevalence of
stunting in boys compared to girls [136]. In an assessment of stunting rates for children
age 6–36 months in 28 African countries during the period 1987 to 2002, the average
difference in stunting rate between boys and girls was 2.6 percentage points, with
stunting rates being higher among boys in all but four of these countries. [119, 136, 141,
143]. In the multivariate analysis, the findings confirm that gender, age, birth control, and
birth intervals are strong predictors of stunting in children.
Household environment and WASH: In the bivariate analysis, although the
stunting was lower in children with improved and safe access to water, but the study did
not find a statistical association between safe drinking water and stunting. The type of
sanitation facility did not have an impact on stunting. Despite mounting evidence of
79
importance of safe drinking water, sanitation and hygiene some studies have shown that
WASH interventions do not independently affect stunting in children. A recent cluster
randomized controlled trial in Bangladesh found that children by two years were taller
only in the combined group with WASH and nutrition, and the WASH group without
combination with nutrition or counseling did not affect the linear growth of
children[144]. Although the findings were not significant and WASH may not have a
direct impact on stunting, but the broad-range of health and non-health benefits from safe
drinking water, sanitation and hygiene cannot be undermined [145].
Household wealth and ownership of land: The prevalence of stunting decreases
linearly with an increase in household wealth. Findings imply that increase is wealth is
may increase the purchasing power of the household, including access to food. In
Malawi, poverty is very prevalent in rural communities where more than 90 percent of
the population subsists on farming, much of which consist of growing maize. With per
capita land holding ranging from 0.18 to 0.26 hectares per household. Recent
development initiatives in Malawi have promoted smallholder diversification through
introducing additional crop and livestock species with the intention to improve household
nutrition. However, the link between ownership of land/land area and stunting has not
been explored. This study finds that three quarters of the households own some form of
agricultural land, and children from these households have higher prevalence of stunting
compared to households that do not have any agricultural land. Similarly, households that
have large-farms have higher prevalence of stunted children compared to households
with small or medium scale farms.
80
There are several explanations for the observed differences in the prevalence of
stunting by ownership of land. First, ownership of land does not mean food crops are
being cultivated which is especially true for large-scale farmers; second, even though
food is being grown it may not be for household consumption. A higher farm production
is not most beneficial to household nutrition needs [44]. In addition, in Malawi, exports
heavily rely on key cash crops such as tobacco, tea, sugar and cotton, which provide more
than 80 percent of export earnings with 50 percent stemming from tobacco alone. A study
on tobacco producers found income source had no effect on stunting in children [146],
further, when faced with an income shock, children in tobacco-producing families fared
worse in terms of stunting[147].
Infant and young child feeding practices: Breastfeeding has been shown to reduce
the risk of morbidity, especially the diarrheal disease. Stunting typically increases in
children when complementary food is introduced. The current study shows that stunting
is high (22.4 percent) in children as young as 0–5 months and this could be because
exclusive breastfeeding in the first six months is not common as only 15.4 percent of
children are exclusively breastfed. These findings are similar to other studies in Malawi
that show that in addition to lower exclusive breastfeeding, complementary feeding is
generally introduced early on which can possibly lead to high infection burden and
stunting among children [95]. In Malawi, complementary feeding starts too early with
poor quality complementary feeds. In the multivariate analysis, none of the child feeding
factors remained significant.
Maternal factors: This study finds that short stature of the mother and BMI are
highly significant in determining stunting in children at p<0.001 and p<0..05,
81
respectively. Several studies have found a strong association between mother’s
nutritional status and stunting in children [115, 118, 120, 131, 135, 140, 148].
In this study, women’s experience of emotional, physical or sexual violence is not
statistically significantly associated with stunting in children Research is inconclusive
regarding women’s exposure of violence and stunting in children. A meta-analysis
showed that children whose mothers had depression were 1.4 times more likely to be
stunted than the children of non-depressed mothers [149]. The study did not show an
association between woman’s experience of physical/sexual violence and stunting in
children. Studies have found that the odds of stunting increases with maternal exposure to
emotional violence[150]. Other studies have found an association between intimate
partner violence (any form) and poor child growth, specifically stunting and severe
stunting has been reported in the literature [79, 80, 151]. The research shows that in
poorer households, the effects of mother’s experience of violence on stunting may be
masked by larger impacts of food insecurity, micronutrient deficiencies, etc. [80].
Conclusion
The approach of USAID’s flagship nutrition and food security initiatives such as
Scaling up Nutrition (SUN), Food for Peace (FFP), and Feed the Future in Malawi is to
integrate nutrition into a value chain through nutrition-sensitive agricultural productivity,
finance and local capacity development. Programs are targeted at the local level, focusing
on behavior change, dietary diversification, and improved feeding for pregnant women,
young children, and infants [98]. In 2011, Malawi was the first country to join the SUN
initiative and the 1,000 Days partnership which aimed to reduce undernutrition in
children during the critical period of pregnancy through a child’s second birthday [14].
82
Despite a strong government commitment, strong agricultural productivity, and
economic growth in recent years, there is persistent severity of malnutrition in Malawi
even in the upper wealth quintile [137]. This accentuates the importance of factors not
related to income but associated with knowledge, attitudes and practices with regard to
food production, preparation, and consumption; breastfeeding and other young child
feeding practices; and disease prevention.
This study reveals that socio-demographic factors and maternal factors show a
strong and significant association with stunting in children. Specifically, in this study,
child’s age, gender, birth interval, and mother’s stature and BMI, appear to be the
strongest determinants of childhood stunting. The study found that ownership of land was
negatively associated with stunting, especially if the land area is more than 50 hectares.
This is perplexing finding, but several reasons emerge for this finding. By 1990s more
than a quarter of the Malawi’s smallholder farmers adopted a hybrid breeding program
[152] and several donors work with the Government of Malawi to support and improve
the effectiveness of the input subsidy program for smallholders [152]. It is plausible that
programs offer counseling on nutrition and diversification of crops, hence in addition to
improving productivity and diversity of crops, it directly or indirectly improves nutrition
knowledge and dietary intake among the small-holder farmers. The large farm holders
may grow cash crops such as tobacco and even if the food crops are grown it may lack
diverse cropping such as only cropping maize, and it may not be for household
consumption. It has been studied that many medium-scale farmers are urban-based
professionals/civil servants who initially had small-scale holdings but acquired lands that
resulted in medium-scale holdings [153]. The findings from this study support biological

83
influences and illustrate intergenerational cycle related to stunting. Further research is
needed to understand the plausible biological pathways that result in stunting.
84
Paper III: Biomarkers of Nutrition, Infection, Inflammation and Childhood Stunting in Malawi Abstract
Background. Micronutrient deficiencies, often termed as the ‘hidden hunger’ can occur
even when diets are adequate with respect to total calories. Micronutrients such as iron,
vitamin A, zinc, selenium are deficient in diets around the world, including Malawi.
Stunting is typically caused by chronic inadequate diet and illness. There is a plethora of
research on underlying and immediate factors that are associated with stunting, whereas
information on biochemical data and how it relates to stunting, infection, and
inflammation at the population level are lacking.
Objective. The study aims to examine the micronutrient status, infection, inflammation in
children ages 0–5 years.
Methods. The study conducts analysis of the nutrition data collected in the Malawi
Micronutrient Survey, 2015-16.
Results. Markers of inflammation, both AGP, CRP and any inflammation are slightly
elevated for the non-stunted children (1.27 g/l and 5 mg/dl) and much higher for stunted
children (1.56 g/l and 9.1 mg/dl). There was a significant association between stunting
and iron deficiency anemia, serum ferritin, and selenium deficiency. Children with
inherited blood disorder (alpha-thalassemia, and sickle cell disease) have higher
prevalence of stunting.
Conclusions. The results from the study confirm that age of the child, birth order, and
mother’s report of child’s size at birth, and household hunger are major determinants of
85
childhood stunting. At the cellular level, iron deficiency anemia, vitamin A deficiency
(low levels of RBP), markers of inflammation including CRP, and inherited blood
disorders (sickle cell and alpha-thalassemia) are strongly associated with stunting in
children.
Introduction
Micronutrient malnutrition is a health problem in Malawi, a small-land locked
sub-Saharan country[154]. WHO estimates for Malawi suggest that malnutrition accounts
for 16.5 percent of all deaths; unsafe water, sanitation, and hygiene (WASH) 6.7 percent;
zinc efficiency, 4.9 percent; and vitamin A deficiency accounts for 4.9 percent of all
deaths [126]. Although the complex determinants of child undernutrition have been
suggested for decades the optimal mix of interventions to reduce stunting is much less
clear, particularly in regions such as sub-Saharan Africa.
Evaluating the quality of child feeding practices and behavior’s, specifically
exclusive breastfeeding, and the timing of introduction of complementing foods does
provide insights of these individual practices, but it does not allow an examination of the
effect of the feeding practices on children’s health and nutrition outcome [12]. In
addition, stunting is typically caused by chronic inadequate diet and illness. Older age
children living in a rural area and living in the southern region of Malawi are
significantly more likely to have urinary schistosomiasis compared with younger children
and those from the other regions[140]. Malaria also plays a role as an immune suppressor
thereby leading to increased prevalence and severity of infections such as diarrhea and
respiratory disease, which also cause malnutrition. Micronutrient deficiencies, often
termed as the ‘hidden hunger’ can occur even when diets are adequate with respect to
86
total calories. Micronutrients such iron, vitamin A, zinc, selenium are deficient in diets
around the world, including Malawi [42]. Hence, there is a complex interplay between
undernutrition and infectious disease that results in stunting [54].
The Government of Malawi and partners have implemented a range of
interventions to combat micronutrient malnutrition. These interventions include targeted
micronutrient supplementation, nutrition education, and food fortification of staple foods,
namely sugar and oil with vitamin A. The data on recent trends in micronutrient
deficiencies among vulnerable populations in Malawi is lacking. The subjective nature of
self-reports on dietary intake measures are forth with challenges to accurately obtain the
information. The validity of nutritional status assessment is greatly improved by
biomarker testing of nutritional markers. Measuring micronutrient indicators and markers
of inflammation in vivo provides a quantifiable measure of importance of child nutrition
in reducing infections and stunting.
Therefore, the study examines the determinants of stunting and examine the
association between markers of nutrition and stunting. The study conducts a secondary
analysis the 2015-16 Malawi Demographic and Health Survey (MDHS) and the jointly
conducted Malawi Micronutrient Survey (MNS). The main purpose of the MNS survey
was to provide program managers and policy makers with the data needed to plan,
implement, and monitor and evaluate nutrition interventions for Malawi. The MNS
survey collected data on micronutrient deficiencies, specifically for vitamin A, iron, and
zinc among a nationally and regionally-representative sample of children age 0–5 years.
The survey also collected information on coverage of nutrition and nutrition-related
87
interventions, including micronutrient supplementation, anemia, malaria, inflammation
and inherited blood disorders.
The study findings will assess determinants of stunting including nutrition
markers to provide a basis for policy direction and planning to accelerate the reduction of
stunting in Malawi.
Methods
Data source and design
The number of households selected for MDHS survey 2015-16 were 27,516. In a
random sub-sample of one-third of these households per cluster, all men age 15–54 were
eligible for individual interviews and HIV testing. In the same sub-sample, all eligible
women and children were eligible for anthropometry measurements and anemia testing.
The MNS survey was a stratified sub-sample of the MDHS survey to produce estimates
of key indicators for the country as a whole, as well as results stratified by region and
residence. A subsample of 105 clusters was randomly selected from the 850 MDHS
survey clusters. Among the selected clusters, the one-third of households selected for the
MDHS HIV subsample were excluded, and the remaining households (20 per urban
cluster, and 22 per rural cluster) were included in the MNS survey.
The National Statistical Office, the Community Health Services Unit of the
Ministry of Health, and the Department of Nutrition, HIV and AIDS (funding from Irish
Aid), World Bank, and the Emory Global Health Institute, and UNICEF implemented the
MNS survey. The technical assistance for the survey was provided by the Centers for
Disease Control and Prevention (CDC), and Emory University.
88
This study is based on secondary analysis of the MNS survey that targeted 1,279
children age 0–59 months in the eligible households. The sample size estimated were
based on predicted change in the prevalence of vitamin A deficiency in children age 0–5
years from 22 percent in 2009 to 15 percent in 2015. The overall response rate was 96
percent. Data on anthropometry was collected from 1,230 children, and venous blood was
collected from 1,102 children. Informed consent for urine collection, blood draw and
measurements were asked from parents or guardians of the children. Referral was
provided to a local hospital if the child was found to have severe anemia (Hb <7g/dL),
malaria, moderate to severe acute malnutrition based on MUAC assessment, and
hematuria as a proxy diagnosis for urinary schistosomiasis.
Outcome Variable
Height-for-age/length-for-age is defined as height or length of a child relative to the
height or length of a child of the same age in a reference population, expressed either as a
Z–score or as a percentage relative to the median of the reference population. A child
who has low height-for-age is described as being “stunted.” Standing height
measurements in all four surveys were carried out in children ages 0–59 months using a
measuring board developed by Shorr productions. Recumbent length was measured for
children less than 24 months of age. Anthropometric indices for height for age Z score
and its cut-off were calculated by using WHO Child Growth Standards (2010 STATA
igrowup package). Stunting is defined as height-for-age Z–score <-2SD from the WHO
Child Growth Standards.
Explanatory Variables
89
Socio-demographic variables: Common household and child variables were
included in the analysis. Some of the variables were recoded into categories for a
meaningful comparison. The household variables included residence (urban, rural),
region (northern, central, and southern), wealth index (asset-based index grouped into
five categories – poorest, poorer, middle, richer, and richest), and source of drinking
water (improved and unimproved sources of drinking water) and sanitation facility
(availability of improved and unimproved toilet facility). Child characteristics included in
the study were age in months (<6, 6–9, 10–11, 12–15, 16–23, 24–35, 36–47, and 48–59
months), sex (male, female), and birth order (1, 2–3, 4–5, 6+).
Household wealth and land ownership: The DHS Wealth Index serves as a proxy
for household economic status. It is a composite measure of household’s cumulative
living standard. The wealth index quintiles include: lowest, second, middle, fourth and
highest [106]. The index is based on whether the household owns common items such as
radio, television, bicycle, motorcycle, car, refrigerator, toilet, and has access to piped
water, etc., and measures household wealth using an index derived from asset variables
using principal components analysis (PCA) by placing individual households on a
continuous scale of relative wealth. In addition, ownership of animals will be used as a
proxy for environmental enteropathy since in the rural landscape of Malawi, households
with livestock share close proximity of animals and children. Animals often share the
area where children play or where food is being cooked and eaten. Ownership of
agricultural land is used as a proxy for access to food. The reported agricultural land area
in hectares by the farming household was further categorized as small-scale farm (<5
hectares); medium-scale farm (≥5 and <50 hectares); and large-scale farm (≥50 hectares).
90
WASH practices and ownership of livestock: Whether the household uses an
improved drinking water source: improved drinking water sources are piped water into
dwelling, plot, or yard; public tap/standpipe, tube well/borehole, protected dug well,
protected spring and rainwater collection. Whether the household has access to an
improved sanitation facility: improved sanitation is defined as having flush or pour/flush,
facilities connected to a piped sewer system, septic system, or a pit latrine; pit latrines
with a slab, composting toilets or ventilated improved pit latrines. Households with
livestock share close proximity of animals and children, hence, ownership of livestock is
used as proxy for environmental enteropathy. The dummy variables were created for each
livestock and assigned a value of 1 for presence of livestock. Similarly, a composite
indicator of the above variables was computed and assigned a value of 1 the household
has goats, pigs, chicken, poultry, cows and cattle.
IYCF variables: IYCF practices during the first two years of life are important in
growth and development of child. Poor infant and young child feeding practices are also
known contributors to child undernutrition. Exclusive breastfeeding includes children
aged 0–5 months who have received breast milk including expressed breast milk or breast
milk from a wet nurse. Early initiation of breastfeeding includes a proportion of children
born in the past 24 hours preceding the survey that were put to breast within one hour of
birth, and continued breastfeeding of children age 12–15 months. The study explored
age-appropriate breastfeeding, i.e., whether infants age 0–5 months received only breast
milk during the previous day and whether children 6–23 months of age received
breastmilk, as well as solid, semi-solid or soft foods during the previous day. In addition
to computing the dietary diversity from seven food groups, the study also examined the

91
consumption of animal source foods that are considered good sources of iron, zinc,
vitamin A, and vitamin B12. The consumption of animal source foods provides highly
bioavailable micronutrients, protein and improves bioavailability of other micronutrients
[42]. The minimum dietary diversity is defined as the proportion of children aged 6–23
months that received foods from at least four out of seven food groups. The 7 foods
groups used for calculation of WHO minimum dietary diversity indicator are: (i) grains,
roots and tubers; (ii) legumes and nuts; (iii) dairy products; (iv) flesh foods; (v) eggs; (vi)
vitamin A rich fruits and vegetables; and (vii) other fruits and vegetables. The dietary
diversity score, therefore, ranged from 0–7 with a minimum of 0 if none of the food
groups are consumed to 7 if all the food groups are consumed.
Maternal factors: The maternal variables included in the analysis were mother’s
education (no education, primary, secondary or higher). Mother’s education is defined as
mother having no education, primary, and secondary or higher education. The study
computed the women’s participation in household decisionmaking either alone or jointly
with husband/partner. The index is constructed based on woman’s response to her say in
large household purchases, her own healthcare, the spending of money she earned, and
visits to relatives. The index ranges from 0 to 3. Women’s attitudes towards wife beating
are the number of reasons for which a woman thinks it is justified to beat wife. The index
ranges from 0 to 5; a lower score reflects a higher status of women. The MNS survey did
not include the domestic violence module as it was implemented only in one-third of the
sampled MDHS survey households.
Social protection and use of supplements: Malawi has implemented social
protection programs to support household food security. This includes cash transfer
92
program, food or cash support during droughts and floods, and coupons from the farm
input ssubsidy program (FISP). Data was analyzed to determine the stunting level’s
children from households that received the social protection programs or not. Data was
also analyzed to determine children who took iron-containing supplements, therapeutic
foods, received a vitamin A capsule in the past six months, and received deworming
treatment in the past six months.
Biomarkers of nutrition, infection and inflammation: The MNS Survey 2015-16
was designed to determine the prevalence of micronutrient deficiencies, specifically,
vitamin A, iron, iodine, and zinc. Other biomarkers tested included markers of
inflammation, infection, and inherited blood disorders. Whole blood collected in the
EDTA vacutainer tube was used for hemoglobin and malaria testing. Dried blood spots
were made from 100 µl of whole blood. The DBS cards were dried, stored, and
transferred to the central laboratory for inherited blood disorder testing. The remaining
blood from the vacutainer tube was centrifuged, and plasma was aliquoted and stored at
Community Health Services Unit (CHSU) of the Ministry of Health and serum was
harvested from the blue top vacutainer tube and was used for various micronutrient
biochemical analysis.
In a subset, eligible children participated in the MRDR sub-sample. Venous blood
sample was collected 4 to 6 hours after a small challenge dose of retinol analog along
with a fatty snack was given to the children.
Measurement and testing: Anthropometry measurements, including mid-upper
arm circumference (MUAC) were performed at the mobile laboratory. Hemoglobin
concentration was measured from a peripheral blood using HemoCue 201+, malaria
93
diagnosis was conducted using a rapid test, and hematuria were assessed in the mobile
laboratory, and the results were provided to the respondents. The MRDR and retinol
laboratory testing was conducted using HPLC. In addition, zinc, selenium, c-reactive
protein, alpha-1-acid glycoprotein concentrations were measured.
Statistical methods
Statistical analysis was performed by using Stata 15.0 (StataCorp, College
Station, TX). Data on demographic, social, and economic characteristics, nutrition status
and nutrition risk factors of the respondents were analyzed. Both bivariate and
multivariate analyses were performed to identify the determinants of stunting. Firstly,
bivariate analyses for all the various risk factors were performed using Chi-square (χ2)
tests and Pearson. The association between dependent variable (stunting) and
independent variables, including biological markers was determined using multiple
logistic regression modeling which included all potential socioeconomic, and
demographic confounders.
A number of alternative logistic regression models were estimated to assess the
relative significance of different confounding factors included in the analysis. The study
also carried out the analysis using a continuous response variable of height-for-age Z–
scores and using a linear regression model, but the results from this analysis (not shown)
were similar to those from the logistic regression models presented. In the analysis,
weights were used to restore the representativeness of the sample. Results of bivariate
analysis are presented with standards errors and 95% confidence intervals (CIs), and the
logistic regression outputs are presented as the odds ratios (ORs) with linearized standard
errors and 95% CIs.
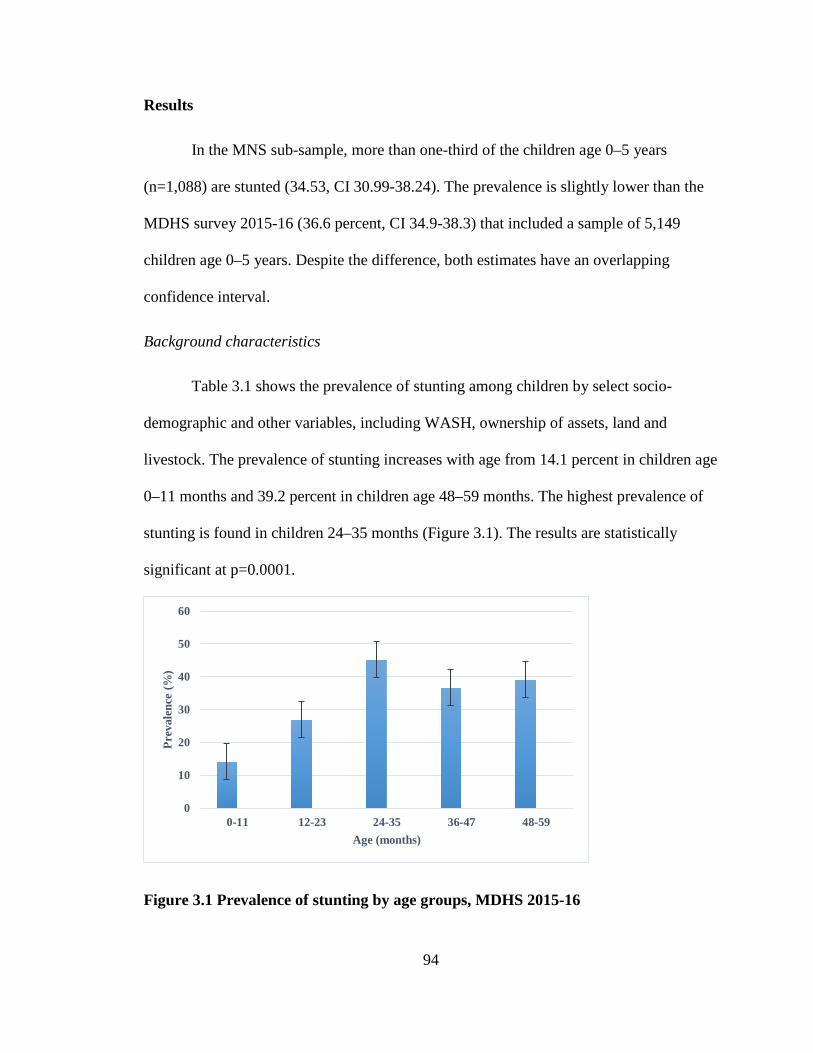
94
Results
In the MNS sub-sample, more than one-third of the children age 0–5 years
(n=1,088) are stunted (34.53, CI 30.99-38.24). The prevalence is slightly lower than the
MDHS survey 2015-16 (36.6 percent, CI 34.9-38.3) that included a sample of 5,149
children age 0–5 years. Despite the difference, both estimates have an overlapping
confidence interval.
Background characteristics
Table 3.1 shows the prevalence of stunting among children by select socio-
demographic and other variables, including WASH, ownership of assets, land and
livestock. The prevalence of stunting increases with age from 14.1 percent in children age
0–11 months and 39.2 percent in children age 48–59 months. The highest prevalence of
stunting is found in children 24–35 months (Figure 3.1). The results are statistically
significant at p=0.0001.
Figure 3.1 Prevalence of stunting by age groups, MDHS 2015-16
0
10
20
30
40
50
60
0-11 12-23 24-35 36-47 48-59
Prev
alen
ce (%
)
Age (months)
95
In the bivariate analysis, the study did not find statistically significant association
between stunting and region, residence, birth interval and sex of the child. There is a
linear relationship, however, between birth order and stunting. The prevalence of stunting
in children increases as the birth order of the child increases (p=0.001).
There exists significant difference at p<0.05 with respect to use of cooking fuel,
but less than 1 percent of children are from households that use electricity, liquefied
petroleum gas (LPG), or natural gas for cooking. The prevalence of stunting in children
is not significantly associated with access to safe and improved water for drinking
Similarly, the sanitation facility of the household, diarrhea in children in the preceding
two weeks before the survey, and ownership of livestock by the household and household
wealth did not have an impact on stunting prevalence in children.
Infant and young child feeding practices
Tables 3.2a and 3.2b show prevalence of stunting among children 0–5 years and
0–23 months, respectively by variables associated with IYCF practices. Estimating the
prevalence of stunting for the two age groups did not change the statistical relationship
between stunting and IYCF practices except for bottle feeding. The bivariate results show
that duration of breastfeeding, complementary feeding, and continued breastfeeding at 1
year has a statistically significant relationship with childhood stunting at p<0.05. There is
approximately 50 percent reduction in the prevalence of stunting if the child continued to
be breastfed by one year and complementary foods are introduced by 6–8 months. No
statistical significant association was observed for dietary diversity, consumption of
animal source food, and exclusive breastfeeding It should be noted that less than 0.1
percent of infant are exclusively breastfed in the MNS sample. Similarly, initiation of
96
breastmilk within an hour of birth or bottle feeding is not significantly associated stunting
in children.
Maternal factors
There is no significant association between stunting in children and mother’s age,
and marital statusSimilarly, this study did not find a significant association between
stunting and women’s decisionmaking/empowerment, and women’s attitude on wife
beating.
Table 3.3 shows that there is somewhat a linear relationship between prevalence
of stunting among children and women’s participation in decisiomaking. When the
mother makes the health care decisions by herself, the prevalence of child’s stunting is
lower (30.4 percent) compared to when the healthcare decisions are made with
husband/partner (34.8 percent), or husband/partner alone (39.3 percent). Similarly,
prevalence of stunting is lower children if mother alone decides on purchase of large
items (26.8 percent) compared to decisionmaking with her husband/partner (31.8 percent)
or by husband/partner alone (39.4 percent). Prevalence of stunting was also lower in
children when mother decides on her own to visit family or friends (32.0 percent)
compared to when she decides with her husband/partner or by husband/partner alone
(36.0 percent and 94.8 percent). The study, however, did not find an association between
empowerment in women and stunting in children. These results failed to reach the
statistically significance at p<0.05.
Most all women (98.2 percent) do not believe it is justified for husband or partner
to beat the wife if she goes out without asking the husband, neglects children, argues with
97
husband, refuses sex, or burns food. Women’s attitude does not have an impact in
reducing stunting among children.
Biomarker of nutrition, inflammation and inherited disorders
The mean of different nutrition, inflammation and select inherited disorder among
stunted and non-stunted children are presented in Table 3.4. Hemoglobin levels are
similar in stunted and non-stunted children. Overall levels of serum ferritin, an acute
phase protein, and soluble transferrin receptor (sTfr) are higher in all children, and much
higher in stunted children. The level of serum ferritin and sTfr in stunted children is 56.2
µg/dl and 10.9 mg/l compared to non-stunted children (48.5 µg/dl and 11.42 mg/l).
Overall, retinol binding protein (RBP) levels are high (0.89 µmol/l) against the cutoff of
<0.46 µmol/l, selenium levels are low (61.18ng/ml) compared to the normal range of 70-
150 ng/ml, and serum zinc is 60 µg/dl. The normal level of serum zinc is in the range of
<57-65 µg/dl.
Markers of inflammation, both AGP, CRP and any inflammation are slightly
elevated for the non-stunted children (1.27 g/l and 5 mg/dl) and much higher for stunted
children (1.56 g/l and 9.1 mg/dl). Any form of inflammation is also higher for stunted
children compared to the non-stunted children. Overall, the levels of hemolytic disorders,
G6PD and alpha-thalassemia are lower than the recommended range of 5-5-20.5 units/g
and >9.5 g/dl Hb, respectively.
The bivariate analysis shows that anemia and serum ferritin levels (unadjusted or
adjusted for inflammation) was not statistically significantly different among stunted and
non-stunted children at p<0.05. The study failed to show an association between stunting
98
and iron deficiency anemia (IDA). The higher prevalence of stunting exists among
children with RBP levels of >0.46 µmol/l. Although the results are highly significant at p
<0.0001, but the high levels of RBP exist in less than 4 percent of the children. Serum
zinc levels did not show an association with stunting in children. The prevalence of
stunting is higher in children with deficient levels of selenium (p=0.08), butnly 27
children were found to have selenium deficiency.
The mean concentrations of the micronutrients, markers of inflammation, and
inherited hemolytic disorders are presented is Table 3.5. The prevalence of stunting is
significantly higher for children with abnormal levels of AGP and CRP. Prevalence of
stunting is 42.5 percent with abnormal AGP compared to 26.3 percent for normal AGP,
and stunting was 51.8 percent with abnormal CRP compared to 30.1 percent for normal
CRP levels. Similarly, any form of inflammation is highly associated with stunting in
children (p=0.0003). Children who are carrier of inherited disorders such alpha-
thalassemia, G6PD, and sickle cell have a much higher prevalence of stunting, and is
statistically significant for G6PD and sickle-cell anemia.
Household hunger
Table 3.6 shows prevalence of stunting by household hunger. The proportion of
households that experienced moderate to severe hunger in the past 4 weeks was 58.9
percent. Household hunger is associated with higher stunting among children in the study
sample. Due to the small sample of children in the tail end of the HHS, the scale was
recoded as households with little to no huger, moderate hunger, and severe hunger. The
prevalence of stunting was 29.5 percent, 37.7 percent, and 36.5 percent, respectively and
statistically significant at p=0.03. The scale was recoded as a binary variable (little to no
99
hunger and moderate to severe household huger) shows that prevalence of stunting is
higher among households that experience moderate to severe hunger (37.7 percent)
compared to households that experience little to no hunger (29.5 percent).
Birthweight, size at birth and MUAC
Reported perception of child’s size at birth and birth weight has an association
with stunting in children at p ≤0.05. Mothers who reported that infants were born large or
larger than average has lower prevalence of stunting than other children who were
reported as average, smaller than average or very small. Similarly, the prevalence of
stunting is higher among children with recorded birthweight as low or very low (39.6
percent) compared to stunting in children who had birthweight recorded as normal (32.1
percent).
Fever and infections
The prevalence of stunting is higher among children who had (38.3 percent)
compared to stunting in children who did not have a bout of fever in the past two weeks
(31.8 percent).. Similar differences were observed for children who experienced fever in
the past 24 hours, however, the results are not statistically significant (Table 3.8). The
prevalence of malaria was 27 percent and children with malaria has higher prevalence of
stunting (37 percent) compared to 34 percent stunting in children with no episode of
malaria in the past two weeks. Cough in the past two weeks did not have an association
with stunting in children. The prevalence of hematuria in children was four percent, but
only 11 children were found to be both stunted and positive for hematuria.
Therapeutic supplements
100
The use of iron containing supplements was 2.7 percent, therapeutic foods 1.3 percent.
The prevalence of children receiving a vitamin A capsule in the previous six months was
14.8 percent and 18.3 percent of children received deworming treatment in the past six
months (Table 3.9). No statistical significant relationship was observed between stunting
in children and iron/vitamin A supplementation or interventions such as therapeutic foods
like plumy nut or deworming. Sleeping under a mosquito net did not have an impact on
stunting in children. However, a recent record of receiving a vitamin A on the vaccination
card shows a significant association with reduced stunting in children compared to the
mother’s report or having no card (p=0.02).
Safety net and interventions
Just over a third of households in Malawi received coupons from FISP program
and approximately seven percent of households participated in the social cash transfer
program. Approximately six percent of households reported being on the Malawian
vulnerability assessment committee (MVAC) list for 2015-16 and percent households
reported receiving food or cash support during last 2014’s drought and flood response
from the MVAC committee. Table 3.10 illustrates the coverage of social protection
programs in Malawi and prevalence of stunting. None of the safety nets or government
programs were significantly associated with reduced prevalence of stunting. In fact, as
with supplements, deworming and therapeutic interventions, the recipients of the social
programs have higher prevalence of stunting.
Multivariate analysis
The multivariate analysis includes two models –
101
Model I: Logistic regression model for all variables that were statistically significant in
the bivariate analysis (p<0.05) for children age 0–24 months.
The multivariate logistic regression confirms most of the bivariate results. After
adjusting for a range of variables, Table 3.11 shows that age of the child, birth order
mother’s report of child’s size at birth, iron deficiency anemia, serum ferritin, and having
vitamin A vaccination are major determinants of childhood stunting.
Older children (24–35 months) have higher prevalence of stunting compared to
the younger children (p<0.001). The odds of stunting are significantly higher by a factor
of 3 with higher birth order of children (birth order 4–5). Mother’s report of a smaller
than average size of child at birth is associated with stunting in children (p<0.001).
The odds of stunting is higher by a factor of 3.0 with higher serum ferritin
concentrations Stunting is associated with iron deficiency anemia, and has a negative
relationship with selenium deficiency (p=0.05). Normal levels of selenium reduce the odd
of stunting by approximately 70percent.
. Children from the households that received vitamin A vaccination have 80
percent reduced the odds of stunting (P<0.005).
Model II: Logistic regression analysis that includes the biomarkers of nutrition,
infection, and inherited blood disorders and household hunger for children under 5 years.
Table 3.12 shows that children with low serum ferritin concentrations (marker of
iron deficiency) and low retinol binding protein (maker of vitamin A deficiency) have
higher prevalence of stunting (p<0.05). In addition, children who carrier of or are affected
by inherited blood disorders, specifically sickle cell disease and alpha-thalassemia are
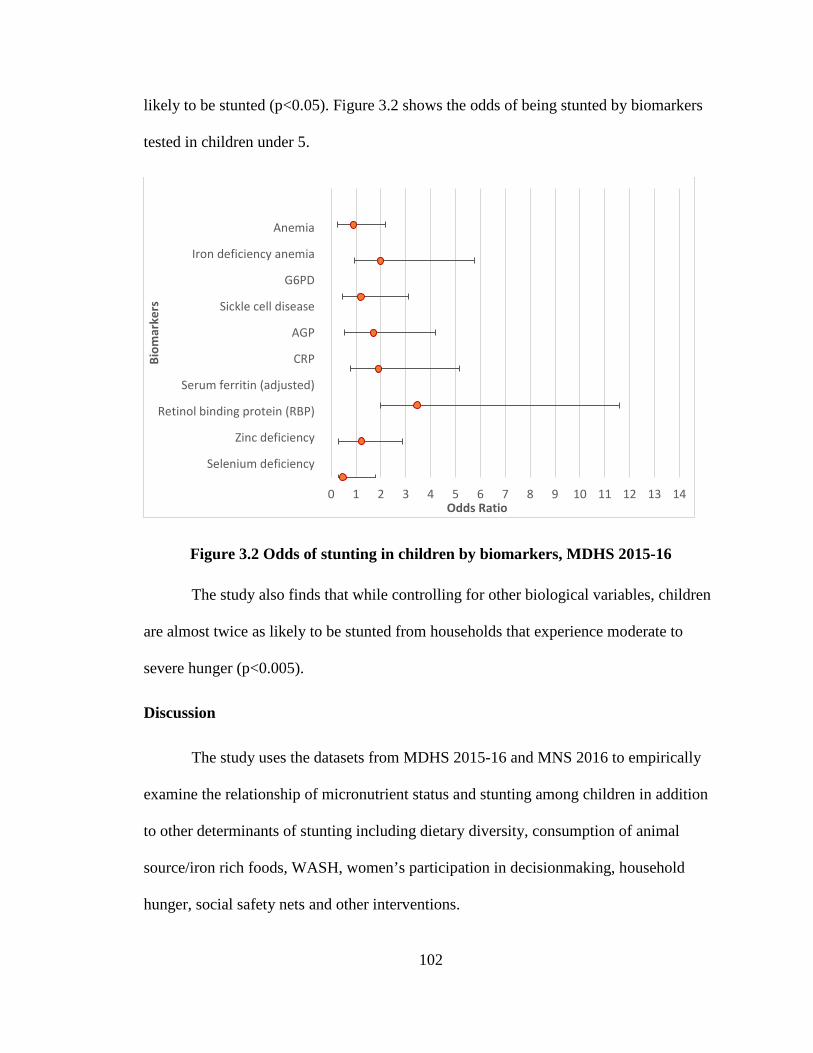
102
likely to be stunted (p<0.05). Figure 3.2 shows the odds of being stunted by biomarkers
tested in children under 5.
Figure 3.2 Odds of stunting in children by biomarkers, MDHS 2015-16
The study also finds that while controlling for other biological variables, children
are almost twice as likely to be stunted from households that experience moderate to
severe hunger (p<0.005).
Discussion
The study uses the datasets from MDHS 2015-16 and MNS 2016 to empirically
examine the relationship of micronutrient status and stunting among children in addition
to other determinants of stunting including dietary diversity, consumption of animal
source/iron rich foods, WASH, women’s participation in decisionmaking, household
hunger, social safety nets and other interventions.
0 1 2 3 4 5 6 7 8 9 10 11 12 13 14
Anemia
Iron deficiency anemia
G6PD
Sickle cell disease
AGP
CRP
Serum ferritin (adjusted)
Retinol binding protein (RBP)
Zinc deficiency
Selenium deficiency
Odds Ratio
Biom
arke
rs
103
Background characteristics: In the MNS sub-sample, more than one-third of the
children age 0–5 years (n=1,088) is stunted (34.53, CI 30.99-38.24). The prevalence is
slightly lower than the MDHS survey 2015-16 (36.6 percent, CI 34.9-38.3) that included
a sample of 5,149 children age 0–5 years. Since stunting increases by age [115, 135], it is
conceivable that a sample of higher age group children will have slightly higher
prevalence of stunting. Despite the difference, both estimates have an overlapping
confidence interval. Although it is well documented [155] and the other two papers (I &
II) have found that boys have higher prevalence of stunting compared to girls, the gender
differences were not strongly associated with stunting in this study.
Infant and young child feeding practices: It has been demonstrated that reduced
dietary diversity was a strong predictor of stunting among children < 60 months of
age[156]. In the multivariate analysis, the study did not find an association between
stunting and dietary diversity and other IYCF indicators. The bivariate analysis found
approximately 50 percent reduction in the prevalence of stunting if the child continued to
be breastfed by one-year and received complementary foods by 6–8 months. The timely
introduction of first complementary food has been significantly found to reduce the
incidence of stunting [141] [135]. Although the multivariate analysis did not show a
correlation between stunting and dietary diversity, but The study did not find an
association between stunting and consumption of animal source foods such as meat and
organ meat. This could be because in rural Malawi, foods from animal sources are rarely
eaten [20]. Since interventions include other components that may contribute to the
effects observed during a study, it is difficult to tease apart the efficacy of supplementary
animal source foods on prevention of growth faltering[90].
104
The risk of increased mortality and morbidity due to deviation from breastfeeding
guidelines is well documented – exclusive bottle feeding in developing countries
increases the risk in infants to 2 to 50 fold compared to exclusively breastfed
infants[126]. And although there is strong evidence that breastfeeding is associated with
an increase in the IQ and protection against non-communicable diseases, the data is
inconclusive of its direct effect in reducing stunting [135]. The research also suggests that
IYCF indicators may better explain weight-for-length Z–-scores than length-for-age Z–
scores [141]. Poor complementary feeding practices are associated with stunting and
growth faltering [40]. In the study, we observed the relationship in the bivariate analysis
but not in the final model for children age 0–24 months (not shown), one reason for this
observation could be that the most common complementary food is a think maize
porridge which is not nutrient dense to impact stunting in children [126]. Furthermore,
this is the period when infections increase in children [37, 115, 126].
Household hunger: The bivariate and the multivariate results show that household
hunger is strongly associated with stunting in children (p<0.05). As the household
hunger increases the odds of stunting increases by a factor of 1.74. This could be because
dependence on rain fed agriculture interrupts food availability across seasons – these
variations result in abundance of food during harvest and less food during the cropping
season. The 2004 Malawi Integrated Household Survey found that children were less
likely to be stunted during the lean cropping season compared to the post-harvest season
[155].
Maternal factors: Although mother’s education is a strong predictor of children’s
health and nutrition [9] and there exists an inverse relationship between stunting and
105
mother’s participation in decision-making and attitude towards violence[73], but the
present study did not find an association between stunting and women’s decision-making
and empowerment or any other maternal factors examined including age, education,
marital status, and attitudes towards wife beating.
Biomarker of nutrition, inflammation and inherited disorders: Biomarkers of
nutrition are able to objectively assess dietary intake or status without bias of self-
reported dietary intake data. The study examined the biomarkers of nutrition,
inflammation, and infections.
Iron deficiency in preschool children is 58 percent in Malawi [126]. As per
WHO’S classification (>40 percent prevalence of anemia), anemia is a public health
problem in Malawi. The study found that hemoglobin levels are similar in stunted and
non-stunted children and the mean hemoglobin is 11.4 g/dl, however, the serum
transferrin receptor (sTfR) in high, and specifically higher among stunted children.
Higher levels of serum transferring suggest a high prevalence of iron deficiency anemia.
Table 3.5 shows that children have very high levels of serum ferritin (48.5 µg/l among
non-stunted children vs. 56.2 µg/l in stunted children). The normal cutoff for serum
ferritin is <12 µg/l and abnormal high ferritin levels observed in the study indicate
imbalances in iron metabolism. In the bivariate and the multivariate analysis, abnormal
levels of RBP, i.e., >0.46 µmol/l are highly associated with stunting (p=0.005)
Although not significant, the study shows that low zinc concentrations are
associated with stunting in children. Zinc deficiency is now recognized by the UNICEF
as a public health problem in many countries, especially developing countries, including
Malawi. It is estimated that 34 percent of the Malawian population is at risk for
106
insufficient zinc intake [157]. Dietary studies in Malawian children have documented that
a high phytate content of maize diets is one of the leading causes of zinc deficiency. It is
well documented that intestinal permeability is increased with zinc deficiency. Zinc
deficiency also has a negative effect on growth – a meta-analysis of randomized
controlled trials of zinc supplementation showed a significant benefit for linear growth in
children aged 0–5 years. The effect was a gain of 0.37 cm in zinc-supplemented children.
In fact, trials that used a dose of zinc of 10 mg per day for 24 weeks, rather than lower
doses, showed a larger benefit of 0.46 cm [135]. The study did not find a significant
association between selenium deficiency and risk of stunting.
Inflammation, fever and infection: Inflammation defined as either elevated CRP
or AGP is common and found more than 50 percent of children. The prevalence of
elevated AGP is 57 percent, and the prevalence of elevated CRP is 26 percent. The
prevalence of elevated AGP is more than double the prevalence of CRP. Markers of
inflammation, both AGP, CRP and any inflammation are slightly elevated for the non-
stunted children (1.27 g/l and 5 mg/dl) and much higher for stunted children (1.56 g/l and
9.1 mg/dl). The multivariate analysis confirm that high levels of CRP is strongly
associated with the risk of stunting in children (p=0.005). Other studies have also found
that markers of inflammation are higher in stunted children than non-stunted children
from as early as 6 weeks after birth [88]. Findings by the researchers suggest that an
extensive enteropathy during infancy and that low-grade chronic inflammation may
impair infant growth.
The prevalence of malaria is 20 percent. It is well documented that diarrheal
disease is inversely associated with changes in HAZ [49], and increases in prevalence of

107
diarrhea and malaria are associated with growth faltering [158]. iIn an analysis of data
from nine community-based studies with daily diarrhea data and longitudinal
anthropometric measurements, the odds of stunting by 24 months increased
multiplicatively with each episode of diarrhea. Overall, 25 percent of stunting was
attributed to five or more episodes of diarrhea [120]. Malaria is not only exacerbated by
malnutrition, it also results in growth failure [126]. The study did not find an association
between stunting and diarrhea malaria.
Schistosomiasis is also important risk factors for development of undernutrition
especially micronutrient deficiencies [126]. The prevalence of urinary schistosomiases is
one percent in children.
Malaria is not only exacerbated by malnutrition, but it also results in growth
failure. In stunted children, malaria is associated with lower hemoglobin concentrations
and higher serum concentrations of sTfR and C-reactive protein than in their non-stunted
counterparts. There is no clear evidence that stunting is associated with an increased
prevalence of malarial infection, but malaria-associated anemia, iron demand, and
inflammation are greater in stunted than in non-stunted children [159]. Another important
role of malaria in undernutrition is through its effects in pregnancy which leads to low
birth weight.
Birthweight, size at birth and MUAC: Prolonged infections in endemic areas
affect placental function and may depress birthweight [126]. Stunted infants are growth
restricted at birth [88], hence, birthweight can be considered as the proxy indicator of
stunting[160]. This paper shows that low birth and very low birth children are at a higher
risk of stunting, prevalence of stunting is higher if the mother is stunted too. Studies in
108
the literature support that women’s nutritional status before and during pregnancy may
contribute to intra-uterine growth retardation thereby increasing the odds of having a
LBW infant which in turn is a risk factor for stunting in childhood [78]. Black et al
explains that maternal stunting (height<145 cm) increases the risk of both term and
preterm small for gestational age (SGA) babies [70]. Other studies have shown that LBW
is associated with 2.5 to 3.5-fold higher the odds of stunting in children[93, 161]. Given
that birthweight is associated with postnatal infant growth, micronutrients given during
the antenatal period can help reduce infant malnutrition at least during the first few
months [125].
Therapeutic supplements: The use of iron containing supplements was 2.7
percent, therapeutic foods 1.3 percent. The prevalence of children receiving a vitamin A
capsule in the previous 6 months was 14.8 percent and 18.3 percent of children received
deworming treatment in the past 6 months (Table 3.9). Although micronutrient powders
presented in small single- use sachets to add to a serving of complementary food have
proven successful in preventing and treating anemia. Adding other micronutrients such as
zinc has been explored, but as yet no formula has been shown to prevent stunting or
promotes linear growth [120, 125, 127]. Similarly, this study did not find a statistical
significant relationship between stunting in children and iron/vitamin A supplementation
or interventions such as therapeutic foods like plumy nut or deworming. In fact, the
relationship is negative, i.e., children receiving the supplements or interventions have
higher prevalence of stunting compared to children who are not receiving supplements or
interventions. It is possible that only the very malnourished children are, in fact, eligible
109
to receive the supplements/interventions, and hence the stunting levels are higher in these
children.
Other studies have shown beneficial effects of lipid based nutrient (LNS)
supplements [162]. A study in Malawi confirmed better weight gain in moderately
malnourished children with (LNS) compared to a cereal product [38], but there was no
difference in linear growth.[125]. Similarly, a randomized controlled trial in Malawi
found that LNS supplements during infancy, and childhood did not reduce stunting
among Malawian children 6–18 months [13, 95, 96, 127]. This lack of effect of
nutritional supplementation also supports the observation that causes and consequences
of stunting are multifactorial and not responsive to a simply supplementation. A large-
scale feeding programs have been problems in targeting the right groups, ensuring intake
of the supplement by intended beneficiaries, spillover to other than intended beneficiaries
and replacement of the habitual dietary intakes of the beneficiaries.
Lastly, sleeping under a mosquito net did not have an impact on stunting in
children, whereas, a recent record of receiving a vitamin A on the vaccination card shows
a significant association with reduced stunting in children compared to the mother’s
report or having no card (p<0.05).
Safety net and interventions: The study finds that households that receive coupons
from Farm Input Subsidy Program (FISP) have more than 60 percent reduced the odds of
having children who are stunted. It has been shown that social protection and provision of
services, such as food or cash transfers, food vouchers, and support for inputs to highly
vulnerable groups can increase their nutritional status, income and resilience specially in
times of humanitarian disaster [9].
110
Conclusion
This study builds on our previous study to examine the micronutrient
concentrations and its relationship with childhood stunting in Malawi. The implications
of the study findings for policy are clear – single targeted short-term interventions are
unlikely to succeed in an environment where the causes of malnutrition are not only
multiple but also interrelated in a complex way integrated approaches combining several
strategies. There is a strong evidence that promotion of appropriate complementary
feeding practices and to promote early initiation of breastfeeding and exclusively doing
so for six months. Ruel and Menon [12] explain clustering of positive practices in
relation to feeding practices, i.e., there is evidence that hygiene and child feeding
practices and behaviors (positive or negative) tend to cluster at any given time and over
time. For example, mothers who engage in positive practices in early-on tend to continue
over time and hence the cumulative effect of the improved practices is only evident after
a certain age.
The key determinants of child undernutrition are food insecurity, poverty and high
rates of illiteracy, especially among women. Children who were ill two weeks prior to the
survey were more likely to be underweight [155]. Since stunting is a long-term process
that results from a series of insults that start as early as in utero and continues until three
years postnatally, we may not see an association between stunting and variables that are
looking at exposure in the last 7 days or last 4 weeks even though exposures in the short
term are generally considered proxy for practices and exposures over longer periods of
time. These may include variables such as malaria, fever, etc. for which the study fails to
see an association with stunting.
111
The study shows that having a quantifiable measure such as biomarkers of
nutrition are able to objectively assess micronutrient status without bias of self-reported
dietary intake data. Children who are malnourished during the first 1,000 days of life
have weaker immune system predisposing them at risk for severe infectious diseases,
including diarrhea and pneumonia. Therefore, measurement before clinical signs of
disease occurs is crucial in reduction of stunting and its detrimental consequences.
Subjective measures such as the dietary diversity score give each food group equal
weight, but all food groups are not equally important for nutrition, especially for intake of
micronutrients, which are most commonly deficient in African diets [42]. In addition, the
effects of diet on body functions are subtle and less clear. Marginal deficiencies of
nutrients are not associated with clinical symptoms, which makes their detection much
more challenging. The absence of severe deficiency signs does not exclude detrimental
effects on the body, underscoring the importance of early diagnosis [163].
Lastly, although biomarkers testing are objective assessments, at the population
level, its use has potential limitations, including invasiveness of measurements and
procedures, and cost.
112
Chapter 5: Discussion
Stunting – a health priority
Malawi is a small land-locked Sub-Saharan African country that is located south
of the equator. It borders Tanzania, Mozambique and Zambia. Malawi’s economy is
primarily agriculture based providing 85 percent of Malawi’s domestic exports (57).
Agriculture in Malawi is mainly rain-fed and hence makes it vulnerable to climatic
shocks.
The severe irreversible consequences of stunting in childhood, including physical
and neurocognitive damage and an elevated risk of chronic disease later in life has now
identified it as a major public health priority and focus of important initiatives like the
Scaling Up Nutrition, Food for Peace, Zero Hunger Challenge, Feed the Future, and
Nutrition for Growth Summit [115]. Stunting is a cross-cutting problem that requires a
multi-sectoral response, including improvements in foods and nutrition security,
education, WASH, health, poverty reduction, and improved status of women.
Identification of these variables and the fact that nutrition interventions in past 3 decades
have had marginal impact have prompted researchers to investigate other pathways that
could lead to child undernutrition, specifically stunting [16, 17].
Evidence suggests that nutrition sensitive programs can improve access to diverse
diets, foster women’s empowerment, and support livelihoods. Similarly, through
education, girls can be better informed and become empowered mothers. Other programs
include deworming, micronutrient and iron supplementation, food fortification, and early
childhood development programs. Some examples of nutrition-specific programs include
113
using conditions to stimulate demand for program services, including cash transfer
programs, routine immunization, antenatal services, and delivery of nutrition-specific
interventions like counseling on infant and young child feeding, care, and hygiene.
Hence, the study examined the relationship between stunting and determinants of stunting
including markers of nutrition and inflammation.
Stunting trends
There is a linear trend in reduction of stunting across survey years, and this trend
exists for all variables and sub-groups within each variable. Stunting in children
decreased from 54.3 percent in 2000 to 36.6 percent in 2015-16 – an impressive 10.5
percentage points decrease in stunting occurred from 2010 to 2016.
Socio-demographic factors
Compared to children under6 months of age, the odds of stunting increases by
more than 50 percent in children 6–9 months. This coincides with the period when
protection from mothers antibodies have started to wane, and children become more
mobile and hence exposed to infections [125, 126]. The odds of stunting is highest in the
age group 16–23 months (Figures 1.1 and 1.4), which is consistent in the literature from
Malawi [126]. Gender and urban-rural differences with respect to stunting have been
observed in Africa and in Malawi. Findings from the multivariate analysis confirm that
gender, age, and birth intervals are strong predictors of stunting in children. As observed
in other studies [9], lack of safe drinking water and sanitation is correlated with stunting,
but it did not reach statistical significance at p<0.05.
114
The study found that ownership of land was negatively associated with stunting,
especially if the land area was more than 50 hectares. This is perplexing finding, but
several reasons emerge for this finding. By 1990s more than a quarter of the Malawi’s
smallholder farmers adopted a hybrid breeding program [152] and several donors work
with the Government of Malawi to support and improve the effectiveness of the input
subsidy program for smallholders [152]. It is plausible that programs offered counseling
on nutrition and diversification of crops, hence in addition to improving productivity and
diversity of crops, it directly or indirectly improved nutrition knowledge and dietary
intake among the small-holder farmers. Whereas the large farm holders may have grown
cash crops such as tobacco. Even if the food crops are grown it may lack diverse
cropping such as large-scale farming of only maize that is not for household
consumption. In Malawi many medium-scale farmers are urban-based professionals and
civil servants who initially had small-scale holdings but acquired lands that resulted in
medium-scale holdings [153]. Ownership of livestock is not associated with stunting in
the multivariate analysis.
Stunting is negatively correlated with household wealth in all four surveys. In
fact, the prevalence of stunting decreases linearly with an increase in household wealth.
Findings imply that increase is wealth is may increase the purchasing power of the
household, including access to food.
Preceding birth interval is a predictor of stunting in children. Stunting was lower
in children with improved and safe access to water. This study demonstrates the
importance of maternal factors. Mother’s education was consistently and significantly
associated with stunting in all four surveys. Findings of the study show that attainment of
115
higher education, i.e., secondary or higher was associated with lower odds of childhood
stunting. This is consistent with other studies that have shown that mother’s education is
a major determinant of whether a child becomes malnourished or not [126, 133].
Similarly, maternal undernutrition is a determinant of child undernutrition. Children
whose mothers were underweight (BMI <18.5) or had short stature were more likely to
be stunted compared to mothers who had normal weight or overweight. This is an
expected finding as mothers who have higher education are more empowered to be able
to take decisions with regard to nutrition and care of their children.
Infant and young child feeding practices
The findings show that in addition to lower exclusive breastfeeding,
complementary feeding is generally introduced early on which can possibly lead to high
infection burden and stunting among children. In Malawi, complementary feeding starts
too early with poor quality complementary feeds.
High incidence of stunting from 6–18 months, coincides with introduction of
complementary feeding. Complementary feeds in most developing countries, including
Malawi are not energy dense or hygienic resulting in reduced energy intake and increased
morbidity, especially diarrhea, which in turn leads to undernutrition including stunting.
Children are mobile and more exposed to infections and at the same time the protection
from maternal antibodies starts of wane and further increases the infections and
undernutrition in children. Further, undernutrition may begin in utero to mothers who are
themselves undernourished.
116
A review of five efficacy trials and 16 programs in 14 countries from 1970-1997
showed improved growth rates by 0.10 – 0.50 SD in weight-for-age z scores (WAZ) and
height-for-age Z– scores (HAZ). The programmatic interventions on a small sample (n=
112 to 200) led to higher changes WAZ than HAZ [17]. A systematic review of 42 papers
from 29 efficacy trials and 13 effectiveness studies from 25 developing countries from
1996 to 2000 has found that impact of the nutrition interventions (complementary
feeding, fortification, and energy density of foods) on child growth was mixed. Impact on
growth appeared to be greater with interventions using key educational messages,
provision of complementary food with or without fortification, or increased energy
density of the complementary foods than interventions based on fortification alone. The
effect sizes for growth were modest (0.1 – 0.5)[8].
Results from the meta-analysis by Fall et al (2009), and Ramakrishnan et al
(2012), of the multiple micronutrient supplementation trials, and meta-analysis by
Kramer and Kakuma (2003), Imdad & Bhutta (2012) on balanced protein-energy
supplementation showed a significant increase in birth weight (+22 g to +78 g) but not
birth length. On the other hand, prenatal and postnatal nutrition, combination of macro-
and micro- nutrients, along with infection control and care for mother and child may
have an impact on the linear growth as shown by Luntamo et al (2013)[164].
Bhutta et al (2008), reviewed nutrition-related interventions in 36 countries and
demonstrated that food utilization outcomes are shaped not only by nutritional inputs, by
other factors including disease burden, women’s empowerment, and water, sanitation,
and hygiene factors[165].
117
Previous research has demonstrated positive, statistically significant associations
between dietary diversity and household per capita consumption (food access), per capita
daily caloric availability from staples and non-staples, and total per capita daily caloric
availability [43, 166]. Though earlier studies have shown that dietary diversity is
positively correlated with adequate micronutrient density of complementary foods for
infants and young children and macronutrient and micronutrient adequacy for non-
breastfed children [167]. Moursi et al. [168] found that for breastfed children, dietary
diversity score predicts a low micronutrient adequacy ( less than50 percent). Food variety
and dietary diversity scores in children ages 1-8 years were found to have a high
correlation with the mean adequacy ratio (MAR), a composite index of nutrient adequacy
[169] calculated for 11 micronutrients, energy and protein. Furthermore, MAR and
dietary diversity found to have a significant correlation with HAZ and WAZ.
Apart from timely initiation of breastfeeding, none of the WHO recommended
IYCF indicators, including dietary diversity are significantly associated with stunting in
the multivariate analysis. The bivariate analysis found approximately 50 percent
reduction in the prevalence of stunting if the child continued to be breastfed by one-year
and received complementary foods by 6–8 months. The timely introduction of first
complementary food has been significantly found to reduce the incidence of stunting
[141] [135]. The reduced dietary diversity is a strong predictor of stunting among
children less than 60 months of age [156]. but this study did not show a correlation
between stunting and dietary diversity.
The study did not find an association between stunting and consumption of animal
source foods such as meat and organ meat. This could be because in rural Malawi, foods
118
from animal sources are rarely eaten [20]. Since interventions include other components
that may contribute to the effects observed during a study, it is difficult to tease apart the
efficacy of supplementary animal source foods on prevention of growth faltering[90].
The findings from this study do not show a strong association of IYCF practices
with stunting as more variables were examined in the multivariate analysis. The risk of
increased mortality and morbidity due to deviation from breastfeeding guidelines is well
documented – exclusive bottle feeding in developing countries increases the risk in
infants to 2 to 50 fold compared to exclusively breastfed infants[126]. There is strong
evidence that breastfeeding is associated with an increase in the IQ and protection against
non-communicable diseases, the data is inconclusive of its direct effect in reducing
stunting [135]. The research also suggests that IYCF indicators may better explain
weight-for-length Z–-scores than length-for-age Z– scores [141]. Poor complementary
feeding practices are associated with stunting and growth faltering [40]. In the bivariate
analysis, we observed the relationship between complementary feeding and stunting but it
failed to reach significance in the final model. One reason for this observation could be
that the most common complementary food in Malawi is a thin maize porridge which is
not nutrient dense to impact stunting in children [126]. Further, it is during this period
when infections increase in children [37, 115, 126].
Maternal factors, empowerment and decisiomaking
The study finds that mother’s education is a significant predictor of child’s
nutritional status (p=0.02). Other studies have also found that female or mothers’
education is a major determinant of whether a child becomes malnourished or not [77,
139, 162, 170]. Mother’s age and anemia levels were not significantly associated with
119
stunting in children. The short stature of the mother and BMI are highly significantly in
determining stunting in children at p=0.000 and p=0.0016, respectively. Several studies
have found a strong association between mother’s nutritional status and stunting in
children [115, 118, 120, 131, 135, 140, 148].
Although mother’s education is a strong predictor of children’s health and
nutrition [9] and there exists an inverse relationship between stunting and mother’s
participation in decision-making and attitude towards violence[73], but the present study
did not find an association between stunting and women’s decision-making and
empowerment or any other maternal factors examined including age, education, marital
status, and attitudes towards wife beating.
Although not statistically significant but children of women who make decisions
with her husband or partner have lower prevalence of stunting compared to when
decisions were made by women alone. This finding, however, does not reflect lower
decisionmaking by women alone, it implies that most women are married and make a
decision with their husbands or partners or husband alone and the single women, whether
never married, divorced, widowed or separated may have more struggles in raising the
children, including providing adequate nutrition or other resources. Similarly, the
composite index of women’s participation in decisionmaking is not significantly
associated with stunting in children, however, lower score (higher decisionmaking) was
associated with lower prevalence of stunting, and a higher score (lower decisiomaking)
was associated with higher prevalence of stunting among children 6–23 months. A study
from Nepal reports that women’s autonomy in production and women’s work in
120
agriculture influence is associated with dietary diversity and reduction in stunting in
children [171].
Women’s experience of emotional violence is statistically significantly associated
with stunting in children (p=0.05). Children of mothers who experience emotional
violence have higher prevalence of stunting (34.9 percent) compared to children of
mothers who do not experience emotional violence (29.3 percent). A meta-analysis
showed that children whose mothers had depression were 1.4 times more likely to be
stunted than the children of non-depressed mothers [149]. The study did not show an
association between woman’s experience of physical or sexual violence and stunting in
children. Studies have found that the odds of stunting increases with maternal exposure to
emotional violence[150]. Other studies have found an association between intimate
partner violence (any form) and poor child growth, specifically stunting and severe
stunting has been reported in the literature [79, 80, 151]. The research shows that in
poorer households, the effects of mother’s experience of violence on stunting may be
masked by larger impacts of food insecurity, micronutrient deficiencies, etc. [80].
Household hunger
Both the bivariate and the multivariate results show that household hunger is
strongly associated with stunting in children (p<0.05). As the household hunger
increases the odds of stunting increases by a factor of 2.46. This could be because
dependence on rain fed agriculture interrupts food availability across seasons – these
variations result in abundance of food during harvest and less food during the cropping
season. The 2004 Malawi Integrated Household Survey found that children were less
121
likely to be stunted during the lean cropping season compared to the post-harvest season
[155].
Biomarker of nutrition, inflammation, and inherited disorders
Biomarkers of nutrition are able to objectively assess dietary intake or status
without bias of self-reported dietary intake data. The study examined the biomarkers of
nutrition, inflammation, and infections.
Iron deficiency in preschool children is 58 percent in Malawi [126]. As per
WHO’S classification (>40 percent prevalence of anemia), anemia is a public health
problem in Malawi. The study found that hemoglobin levels are similar in stunted and
non-stunted children and the mean hemoglobin is 11.4 g/dl. the sTfR is high, and
specifically higher among stunted children. Higher levels of serum transferring suggest a
high prevalence of iron deficiency anemia. Table 3.4 shows that children have very high
levels of serum ferritin (48.5 µg/l among non-stunted children vs. 56.2 µg/l in stunted
children). The normal cutoff for serum ferritin is <12 µg/l and abnormal high ferritin
levels observed in the study indicate imbalances in iron metabolism. In the bivariate
analysis, abnormal levels of RBP, i.e., >0.46 µmol/l are highly associated with stunting,
the association is weaker but remains in the multivariate analysis.
Zinc deficiency is now recognized by the United Nations Children’s Fund
(UNICEF) as a public health problem in many countries, especially developing countries,
including Malawi. It is estimated that 34 percent of the Malawian population is at risk for
insufficient zinc intake [157]. Dietary studies in Malawian children have documented that
a high phytate content of maize diets is one of the leading causes of zinc deficiency. It is
122
well documented that intestinal permeability is increased with zinc deficiency. Zinc
deficiency also has a negative effect on growth – a meta-analysis of randomized
controlled trials of zinc supplementation showed a significant benefit for linear growth in
children aged 0–5 years. The effect was a gain of 0.37 cm in zinc-supplemented children.
In fact, trials that used a dose of zinc of 10 mg per day for 24 weeks, rather than lower
doses, showed a larger benefit of 0.46 cm [135]. The study did not find an association
between low zinc concentrations and stunting in children. The study also did not find a
strong association between selenium deficiency and risk of stunting.
Infection and fever
Inflammation defined as either elevated CRP or AGP is common and found more
than 50 percent of children. The prevalence of elevated AGP is 57 percent, and the
prevalence of elevated CRP is 26 percent. The prevalence of elevated AGP is more than
double the prevalence of CRP. Markers of inflammation, both AGP, CRP and any
inflammation are slightly elevated for the non-stunted children (1.27 g/l and 5 mg/dl) and
much higher for stunted children (1.56 g/l and 9.1 mg/dl). Other studies have found that
markers of inflammation are higher in stunted children than non-stunted children from as
early as 6 weeks after birth [88]. These studies suggest that an extensive enteropathy
during infancy and that low-grade chronic inflammation may impair infant growth.
Birthweight, size at birth and MUAC
Prolonged infections in endemic areas affect placental function and may depress
birthweight [126]. Stunted infants are growth restricted at birth [88], hence, birthweight
can be considered as the proxy indicator of stunting[160]. This paper shows that low birth
123
and very low birth children are not a higher risk of stunting, however, mother’s
perception of child’s size (small) at birth was strongly associated with risk of stunting.
Studies in the literature support that women’s nutritional status before and during
pregnancy may contribute to intra-uterine growth retardation thereby increasing the odds
of having a LBW infant which in turn is a risk factor for stunting in childhood [78]. Black
et al explains that maternal stunting (height<145 cm) increases the risk of both term and
preterm small for gestational age (SGA) babies [70]. Other studies have shown that LBW
is associated with 2.5 to 3.5-fold higher the odds of stunting in children[93, 161]. Given
that birthweight or size at birth is associated with postnatal infant growth, micronutrients
given during the antenatal period can help reduce infant malnutrition at least during the
first few months [125].
Therapeutic supplements
The use of iron containing supplements was 2.7 percent, therapeutic foods 1.3
percent. The prevalence of children who received a vitamin A capsule in the previous 6
months was 14.8 percent, and 18.3 percent of children received deworming treatment in
the past 6 months (Table 3.8).The micronutrient powders presented in small single-use
sachets to add to a serving of complementary food have proven successful in preventing
and treating anemia. Adding other micronutrients such as zinc has been explored, but as
yet no formula has been shown to prevent stunting or promotes linear growth [120, 125,
127]. This study did not find a statistical significant relationship between stunting in
children and iron or vitamin A supplementation or interventions such as therapeutic foods
like plumy nut or deworming. In fact, the relationship is negative, i.e., children receiving
the supplements or interventions have higher prevalence of stunting compared to children
124
who are not receiving supplements or interventions. It is possible that only the very
malnourished children are, in fact, eligible to receive the supplements/interventions, and
hence the stunting levels are higher in these children.
Studies have shown beneficial effects of lipid based nutrient (LNS) supplements
[162]. A study in Malawi confirmed better weight gain in moderately malnourished
children with (LNS) compared to a cereal product [38], but there was no difference in
linear growth.[125]. Similarly, a randomized controlled trial in Malawi found that LNS
supplements during infancy, and childhood did not reduce stunting among Malawian
children 6–18 months [13, 95, 96, 127]. This lack of effect of nutritional supplementation
also supports the observation that causes and consequences of stunting are multifactorial
and not responsive to a simply supplementation. A large-scale feeding programs have
been problems in targeting the right groups, ensuring intake of the supplement by
intended beneficiaries, spillover to other than intended beneficiaries and replacement of
the habitual dietary intakes of the beneficiaries.
A recent record of receiving a vitamin A on the vaccination card shows a
significant association with reduced stunting in children compared to the mother’s report
or having no card (p=0.02).
Safety net and interventions: The study finds that households that receive coupons
from FISP have more than 60 percent reduced odds of having children who are stunted. It
has been shown that social protection and provision of services, such as food or cash
transfers, food vouchers, and support for inputs to highly vulnerable groups can increase
their nutritional status, income and resilience specially in times of humanitarian disaster
[9].
125
Limitations
The proposed study aims to explore the effect of proximate determinants of food
security, as proxied by stunting, in children age 0–59 months. Since the DHS surveys are
population based cross-sectional household surveys, a causal relationship between
proximate determinants of food security and nutritional outcomes cannot be established.
As a result, findings should be interpreted purely as indications of association between
proximate determinants and stunting. The DHS questionnaire does not collect
information on frequency and quantity of consumption of foods. Therefore, the child’s
dietary diversity score was analyzed based on whether a food group was consumed or not
consumed in the day before the survey.
As a proxy of environmental enteropathy, the study explored the association
between ownership of livestock and stunting in children. The use of secondary data from
a cross-sectional survey precludes more specific analysis of the animal excreta for E.coli
or examination of the subclinical infections and biomarkers for mucosal damage and
immune stimulation in children.
The controls for confounding factors are limited by the data available in the
dataset; and hence there may be unobserved influences and/or confounders that may not
be accounted for in the models. Lastly, findings from this study may not apply to other
countries. Although there was a significant overlap between MDHS 2015-16 and the
MNS survey 2016, but no effort was made to mitigate the seasonal influences which can
have adverse effect on consumption of certain foods and infections such as malaria, etc.
126
Chapter 5: Conclusion
Stunting is said to be a self-perpetuating intergenerational cycle of poverty and
impaired human capital [115, 120]. There is evidence that proximate and distal
determinants such as child feeding practices, inadequate care and complementary
feeding, WASH practices, infections, and environmental enteropathy play an important
role in stunting [130]. The determinants of malnutrition are multifaceted, ranging from an
individual’s health status, access to safe, nutritious diverse foods, water, sanitation, and
hygiene, feeding and caring practices, etc., and therefore, it requires a multi-sectoral
approach that includes agriculture, health, economic growth and livelihoods, education
and humanitarian assistance.
The approach of USAID’s flagship nutrition and food security initiatives such as
Scaling up Nutrition, Food for Peace, and Feed the Future in Malawi is to integrate
nutrition into a value chain through nutrition-sensitive agricultural productivity, finance
and local capacity development. Programs are targeted at the local level, focusing on
behavior change, dietary diversification, and improved feeding for pregnant women,
young children, and infants [98]. In 2011, Malawi was the first country to join the SUN
initiative and the 1,000 Days partnership which aimed to reduce undernutrition in
children during the critical period of pregnancy through a child’s second birthday [14].
Despite a strong government commitment, strong agricultural productivity, and
economic growth in recent years, there is persistent severity of malnutrition in Malawi
even in the upper wealth quintile [137]. This accentuates the importance of factors not
related to income but associated with knowledge, attitudes and practices with regard to

127
food production, preparation, and consumption, breastfeeding and other young child
feeding practices, and disease prevention.
This study builds on our previous studies to examine the micronutrient
concentrations and its relationship with childhood stunting in Malawi. The implications
of the study findings for policy are clear – single targeted short-term interventions are
unlikely to succeed in an environment where the causes of malnutrition are not only
multiple but also interrelated in a complex way integrated approaches combining several
strategies.
At the national level, stunting decreased from 54.3 percent to 36.6 percent from
2000 to 2016. Despite the remarkable decrease in stunting, it remains of high public
health significance in Malawi. According to the Global Nutrition Report, Malawi has
made some progress in reducing stunting among children, but the progress remains off-
course [138]. Findings from our study indicate that child’s age is an important factor in
the prevalence of stunting. Higher stunting in children under 6 months of age in 2016
compared to previous years, in general, does not align with the existing research,
however, studies in rural Malawi have found highest incidence of stunting in children
under 6 months of age. Stunting during intrauterine period and first six months needs to
be examined in future studies.
The key determinants of child undernutrition are food insecurity, poverty and high
rates of illiteracy, especially among women. Children who were ill two weeks prior to the
survey were more likely to be underweight [155]. Since stunting is a long-term process
that results from a series of insults that start as early as in utero and continues until three
years postnatally, we may not see an association between stunting and variables that are
128
looking at exposure in the last 7 days or last 4 weeks even though exposures in the short
term are generally considered proxy for practices and exposures over longer periods of
time. These may include variables such as malaria, fever, etc. for which the study fails to
see an association with stunting.
The study shows that having a quantifiable measure such as biomarkers of
nutrition are able to objectively assess micronutrient status without bias of self-reported
dietary intake data. Children who are malnourished during the first 1,000 days of life
have weaker immune system predisposing them at risk for severe infectious diseases,
including diarrhea and pneumonia. Therefore, measurement before clinical signs of
disease occurs is crucial in reduction of stunting and its detrimental consequences.
Subjective measures such as the dietary diversity score give each food group equal
weight, but all food groups are not equally important for nutrition, especially for intake of
micronutrients, which are most commonly deficient in African diets [42]. In addition, the
effects of diet on body functions are subtle and less clear. Marginal deficiencies of
nutrients are not associated with clinical symptoms, which makes their detection much
more challenging. The absence of severe deficiency signs does not exclude detrimental
effects on the body, underscoring the importance of early diagnosis [163].
Results of the micronutrient levels in stunted children show evidence for change
in the rhetoric and policy to focus attention not only on the quantity, but quality of foods
consumed by children. In conclusion, findings from the study suggest that biomarkers
offer clues to tackling stunting in children. The information contained in the DHS data
sets should be complemented by nutritional biomarkers to help understand the effects of
stunting at the cellular level. Lastly, although biomarkers testing are objective
129
assessments, at the population level, its use has potential limitations, including
invasiveness of measurements and procedures, and cost.
130
Table 1.1 Stunting (HAZ <2 SD) in children age 0-59 months by background characteristics, Malawi Demographic and Health Survey (MDHS), 2000-2016 Table 1.2 Coefficient of change in HAZ for children 0-59 months for comparison years, MDHS 2000-2016 Table 1.3 Trend of odds of being stunted by survey year and other background characteristics in children 0-59 months, MDHS 2000-2016 Table 1.4 Change in stunting by background characteristics, MDHS 2000 - 2016 Table 1.5 Change in stunting (<2 SD) in children age 0-59 between survey years, MDHS 2000-2016 Table 2.1 Number of children by anthropometric measurements, Malawi 2015-16 Table 2.2 Stunting in children 0-23 months by socio-demographic variables, Malawi 2015-16 Table 2.3 Stunting in children 0-23 months by household environment and WASH practices, Malawi 2015-16 Table 2.4 Stunting in children 0-23 months by infant and young child feeding practices, Malawi 2015-16 Table 2.5 Stunting in children 0-23 months by maternal factors, Malawi 2015-16 Table 2.6 Stunting in children age 0-23 months by maternal decisionmaking and empowerment, Malawi 2015-16 Table 2.7 Model I: Logistic regression model for association of socio-demographic factors and stunting in children 0-23 months, Malawi 2015-16 Table 2.8a Model II: Logistic regression model for association of access to food and stunting in children 0-23 months, Malawi 2015-16 Table 2.9a Model III: Logistic regression model for association of children's environment/WASH and stunting in children 0-23 months, Malawi 2015-16 Table 2.10a Model IV: Logistic regression model for association of IYCF practices and stunting in children 0-23 months, Malawi 2015-16 Table 2.11a Model V: Logistic regression model for association of maternal factors including empowerment and stunting in children in children 0-23 months, Malawi 2015-16
131
Table 2.8b Stepwise Model II: Logistic regression model for association of socio-demographic and access to food variables and stunting in children 0-23 months, Malawi 2015-16 Table 2.9b Stepwise Model II: Logistic regression model for association of socio-demographic, access to food, household environment, sanitation and stunting in children 0-23 months, Malawi 2015-16 Table 2.10b Stepwise Model II: Logistic regression model for association of socio-demographic, access to food, household environment, sanitation, child feeding practices and stunting in children 0-23 months, Malawi 2015-16 Table 2.11b Stepwise Model II: Logistic regression model for association of socio-demographic, access to food, household environment, sanitation, maternal factors, empowerment, child feeding practices and stunting in children 0-23 months, Malawi 2015-16 Table 2.12 Model V: Logistic regression model for association of maternal factors including empowerment and stunting in children in children 0-23 months, Malawi 2015-16 Table 3.0 Prevalence of stunting, wasting and underweight, MNS Survey 2015-16 Table 3.1 Prevalence of stunting by socio-demographic variables, MNS Survey 2015-16 Table 3.2a Prevalence of stunting among children age 0-5 years by infant and young child feeding practices, MNS Survey 2015-16 Table 3.2b Prevalence of stunting among children age 0-2 years by infant and young child feeding practices, MNS Survey 2015-16 Table 3.3 Prevalence of stunting in children by maternal factors, MNS Survey 2015-16 Table 3.4 Estimated mean and linearized standard errors of biomarkers of nutrition, MNS Survey 2015-16 Table 3.5 Prevalence of stunting in children by micronutrient status, MNS Survey, 2015-16 Table 3.6 Prevalence of stunting in children by household hunger, MNS Survey 2015-16 Table 3.7 Prevalence of stunting in children age 0-5 years by mother's perception of child size at birth, birthweight, and MUAC, MNS Survey 2015-16
132
Table 3.8 Prevalence of stunting by common infections and fever in children age 0-5 years, MNS Survey, 2015-16 Table 3.9 Prevalence of stunting in children by therapeutic supplements and prevention to infection, MNS Survey, 2015-16 Table 3.10 Prevalence of stunting among children age 0-5 years by social intervention programs, MNS Survey 2015-16 Table 3.11 Multivariate analysis of determinates of childhood stunting, MNS Survey 2015-16 Table 3.12 Multivariate analysis of biomarkers on childhood stunting, MNS Survey 2015-16
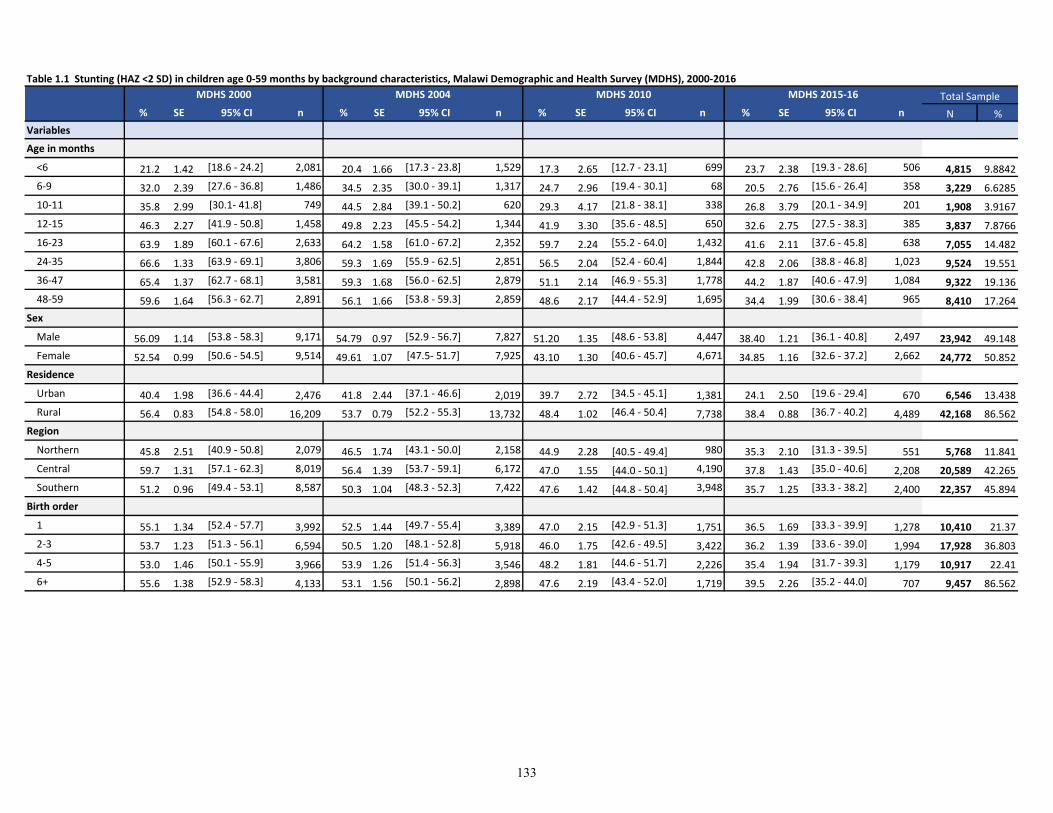
Table 1.1 Stunting (HAZ <2 SD) in children age 0-59 months by background characteristics, Malawi Demographic and Health Survey (MDHS), 2000-2016
% SE 95% CI n % SE 95% CI n % SE 95% CI n % SE 95% CI n N %
Variables
Age in months
<6 21.2 1.42 [18.6 - 24.2] 2,081 20.4 1.66 [17.3 - 23.8] 1,529 17.3 2.65 [12.7 - 23.1] 699 23.7 2.38 [19.3 - 28.6] 506 4,815 9.8842
6-9 32.0 2.39 [27.6 - 36.8] 1,486 34.5 2.35 [30.0 - 39.1] 1,317 24.7 2.96 [19.4 - 30.1] 68 20.5 2.76 [15.6 - 26.4] 358 3,229 6.6285
10-11 35.8 2.99 [30.1- 41.8] 749 44.5 2.84 [39.1 - 50.2] 620 29.3 4.17 [21.8 - 38.1] 338 26.8 3.79 [20.1 - 34.9] 201 1,908 3.9167
12-15 46.3 2.27 [41.9 - 50.8] 1,458 49.8 2.23 [45.5 - 54.2] 1,344 41.9 3.30 [35.6 - 48.5] 650 32.6 2.75 [27.5 - 38.3] 385 3,837 7.8766
16-23 63.9 1.89 [60.1 - 67.6] 2,633 64.2 1.58 [61.0 - 67.2] 2,352 59.7 2.24 [55.2 - 64.0] 1,432 41.6 2.11 [37.6 - 45.8] 638 7,055 14.482
24-35 66.6 1.33 [63.9 - 69.1] 3,806 59.3 1.69 [55.9 - 62.5] 2,851 56.5 2.04 [52.4 - 60.4] 1,844 42.8 2.06 [38.8 - 46.8] 1,023 9,524 19.551
36-47 65.4 1.37 [62.7 - 68.1] 3,581 59.3 1.68 [56.0 - 62.5] 2,879 51.1 2.14 [46.9 - 55.3] 1,778 44.2 1.87 [40.6 - 47.9] 1,084 9,322 19.136
48-59 59.6 1.64 [56.3 - 62.7] 2,891 56.1 1.66 [53.8 - 59.3] 2,859 48.6 2.17 [44.4 - 52.9] 1,695 34.4 1.99 [30.6 - 38.4] 965 8,410 17.264
Sex
Male 56.09 1.14 [53.8 - 58.3] 9,171 54.79 0.97 [52.9 - 56.7] 7,827 51.20 1.35 [48.6 - 53.8] 4,447 38.40 1.21 [36.1 - 40.8] 2,497 23,942 49.148
Female 52.54 0.99 [50.6 - 54.5] 9,514 49.61 1.07 [47.5- 51.7] 7,925 43.10 1.30 [40.6 - 45.7] 4,671 34.85 1.16 [32.6 - 37.2] 2,662 24,772 50.852
Residence
Urban 40.4 1.98 [36.6 - 44.4] 2,476 41.8 2.44 [37.1 - 46.6] 2,019 39.7 2.72 [34.5 - 45.1] 1,381 24.1 2.50 [19.6 - 29.4] 670 6,546 13.438
Rural 56.4 0.83 [54.8 - 58.0] 16,209 53.7 0.79 [52.2 - 55.3] 13,732 48.4 1.02 [46.4 - 50.4] 7,738 38.4 0.88 [36.7 - 40.2] 4,489 42,168 86.562
Region
Northern 45.8 2.51 [40.9 - 50.8] 2,079 46.5 1.74 [43.1 - 50.0] 2,158 44.9 2.28 [40.5 - 49.4] 980 35.3 2.10 [31.3 - 39.5] 551 5,768 11.841
Central 59.7 1.31 [57.1 - 62.3] 8,019 56.4 1.39 [53.7 - 59.1] 6,172 47.0 1.55 [44.0 - 50.1] 4,190 37.8 1.43 [35.0 - 40.6] 2,208 20,589 42.265
Southern 51.2 0.96 [49.4 - 53.1] 8,587 50.3 1.04 [48.3 - 52.3] 7,422 47.6 1.42 [44.8 - 50.4] 3,948 35.7 1.25 [33.3 - 38.2] 2,400 22,357 45.894
Birth order
1 55.1 1.34 [52.4 - 57.7] 3,992 52.5 1.44 [49.7 - 55.4] 3,389 47.0 2.15 [42.9 - 51.3] 1,751 36.5 1.69 [33.3 - 39.9] 1,278 10,410 21.37
2-3 53.7 1.23 [51.3 - 56.1] 6,594 50.5 1.20 [48.1 - 52.8] 5,918 46.0 1.75 [42.6 - 49.5] 3,422 36.2 1.39 [33.6 - 39.0] 1,994 17,928 36.803
4-5 53.0 1.46 [50.1 - 55.9] 3,966 53.9 1.26 [51.4 - 56.3] 3,546 48.2 1.81 [44.6 - 51.7] 2,226 35.4 1.94 [31.7 - 39.3] 1,179 10,917 22.41
6+ 55.6 1.38 [52.9 - 58.3] 4,133 53.1 1.56 [50.1 - 56.2] 2,898 47.6 2.19 [43.4 - 52.0] 1,719 39.5 2.26 [35.2 - 44.0] 707 9,457 86.562
Total SampleMDHS 2015-16MDHS 2000 MDHS 2004 MDHS 2010
133
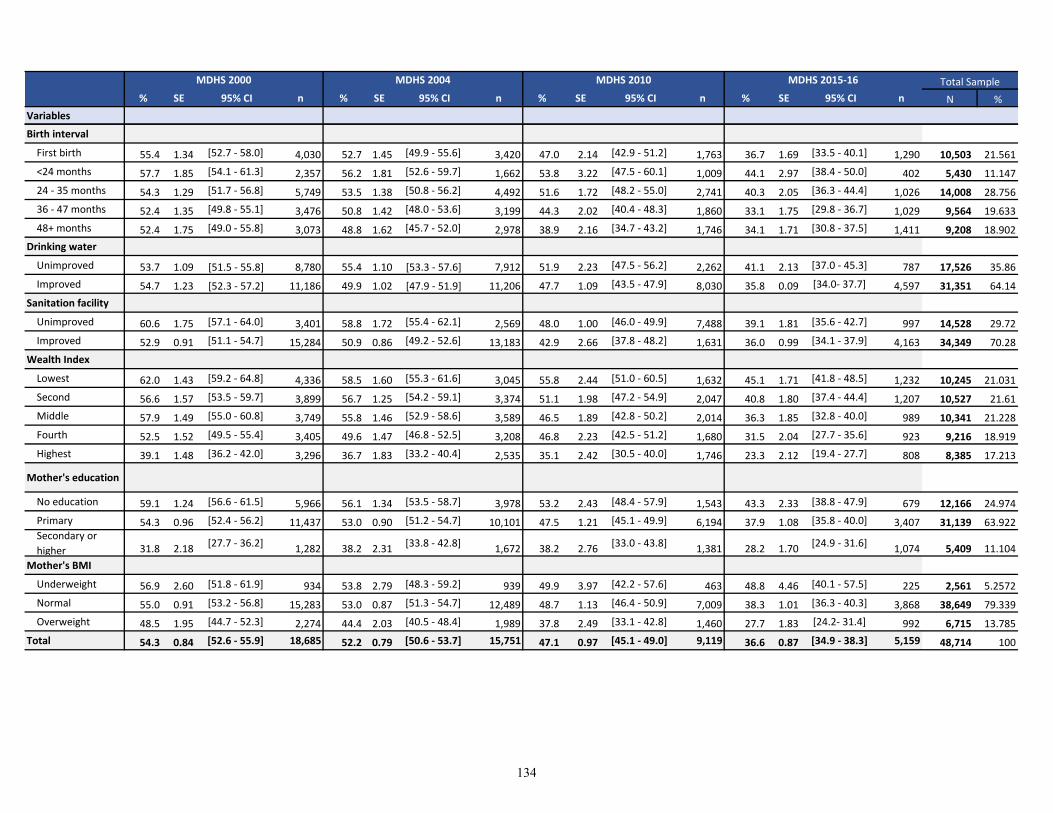
% SE 95% CI n % SE 95% CI n % SE 95% CI n % SE 95% CI n N %
Variables
Total SampleMDHS 2015-16MDHS 2000 MDHS 2004 MDHS 2010
Birth interval
First birth 55.4 1.34 [52.7 - 58.0] 4,030 52.7 1.45 [49.9 - 55.6] 3,420 47.0 2.14 [42.9 - 51.2] 1,763 36.7 1.69 [33.5 - 40.1] 1,290 10,503 21.561
<24 months 57.7 1.85 [54.1 - 61.3] 2,357 56.2 1.81 [52.6 - 59.7] 1,662 53.8 3.22 [47.5 - 60.1] 1,009 44.1 2.97 [38.4 - 50.0] 402 5,430 11.147
24 - 35 months 54.3 1.29 [51.7 - 56.8] 5,749 53.5 1.38 [50.8 - 56.2] 4,492 51.6 1.72 [48.2 - 55.0] 2,741 40.3 2.05 [36.3 - 44.4] 1,026 14,008 28.756
36 - 47 months 52.4 1.35 [49.8 - 55.1] 3,476 50.8 1.42 [48.0 - 53.6] 3,199 44.3 2.02 [40.4 - 48.3] 1,860 33.1 1.75 [29.8 - 36.7] 1,029 9,564 19.633
48+ months 52.4 1.75 [49.0 - 55.8] 3,073 48.8 1.62 [45.7 - 52.0] 2,978 38.9 2.16 [34.7 - 43.2] 1,746 34.1 1.71 [30.8 - 37.5] 1,411 9,208 18.902
Drinking water
Unimproved 53.7 1.09 [51.5 - 55.8] 8,780 55.4 1.10 [53.3 - 57.6] 7,912 51.9 2.23 [47.5 - 56.2] 2,262 41.1 2.13 [37.0 - 45.3] 787 17,526 35.86
Improved 54.7 1.23 [52.3 - 57.2] 11,186 49.9 1.02 [47.9 - 51.9] 11,206 47.7 1.09 [43.5 - 47.9] 8,030 35.8 0.09 [34.0- 37.7] 4,597 31,351 64.14
Sanitation facility
Unimproved 60.6 1.75 [57.1 - 64.0] 3,401 58.8 1.72 [55.4 - 62.1] 2,569 48.0 1.00 [46.0 - 49.9] 7,488 39.1 1.81 [35.6 - 42.7] 997 14,528 29.72
Improved 52.9 0.91 [51.1 - 54.7] 15,284 50.9 0.86 [49.2 - 52.6] 13,183 42.9 2.66 [37.8 - 48.2] 1,631 36.0 0.99 [34.1 - 37.9] 4,163 34,349 70.28
Wealth Index
Lowest 62.0 1.43 [59.2 - 64.8] 4,336 58.5 1.60 [55.3 - 61.6] 3,045 55.8 2.44 [51.0 - 60.5] 1,632 45.1 1.71 [41.8 - 48.5] 1,232 10,245 21.031
Second 56.6 1.57 [53.5 - 59.7] 3,899 56.7 1.25 [54.2 - 59.1] 3,374 51.1 1.98 [47.2 - 54.9] 2,047 40.8 1.80 [37.4 - 44.4] 1,207 10,527 21.61
Middle 57.9 1.49 [55.0 - 60.8] 3,749 55.8 1.46 [52.9 - 58.6] 3,589 46.5 1.89 [42.8 - 50.2] 2,014 36.3 1.85 [32.8 - 40.0] 989 10,341 21.228
Fourth 52.5 1.52 [49.5 - 55.4] 3,405 49.6 1.47 [46.8 - 52.5] 3,208 46.8 2.23 [42.5 - 51.2] 1,680 31.5 2.04 [27.7 - 35.6] 923 9,216 18.919
Highest 39.1 1.48 [36.2 - 42.0] 3,296 36.7 1.83 [33.2 - 40.4] 2,535 35.1 2.42 [30.5 - 40.0] 1,746 23.3 2.12 [19.4 - 27.7] 808 8,385 17.213
Mother's education
No education 59.1 1.24 [56.6 - 61.5] 5,966 56.1 1.34 [53.5 - 58.7] 3,978 53.2 2.43 [48.4 - 57.9] 1,543 43.3 2.33 [38.8 - 47.9] 679 12,166 24.974
Primary 54.3 0.96 [52.4 - 56.2] 11,437 53.0 0.90 [51.2 - 54.7] 10,101 47.5 1.21 [45.1 - 49.9] 6,194 37.9 1.08 [35.8 - 40.0] 3,407 31,139 63.922Secondary or
higher 31.8 2.18[27.7 - 36.2]
1,282 38.2 2.31[33.8 - 42.8]
1,672 38.2 2.76[33.0 - 43.8]
1,381 28.2 1.70[24.9 - 31.6]
1,074 5,409 11.104
Mother's BMI
Underweight 56.9 2.60 [51.8 - 61.9] 934 53.8 2.79 [48.3 - 59.2] 939 49.9 3.97 [42.2 - 57.6] 463 48.8 4.46 [40.1 - 57.5] 225 2,561 5.2572
Normal 55.0 0.91 [53.2 - 56.8] 15,283 53.0 0.87 [51.3 - 54.7] 12,489 48.7 1.13 [46.4 - 50.9] 7,009 38.3 1.01 [36.3 - 40.3] 3,868 38,649 79.339
Overweight 48.5 1.95 [44.7 - 52.3] 2,274 44.4 2.03 [40.5 - 48.4] 1,989 37.8 2.49 [33.1 - 42.8] 1,460 27.7 1.83 [24.2- 31.4] 992 6,715 13.785
Total 54.3 0.84 [52.6 - 55.9] 18,685 52.2 0.79 [50.6 - 53.7] 15,751 47.1 0.97 [45.1 - 49.0] 9,119 36.6 0.87 [34.9 - 38.3] 5,159 48,714 100
134
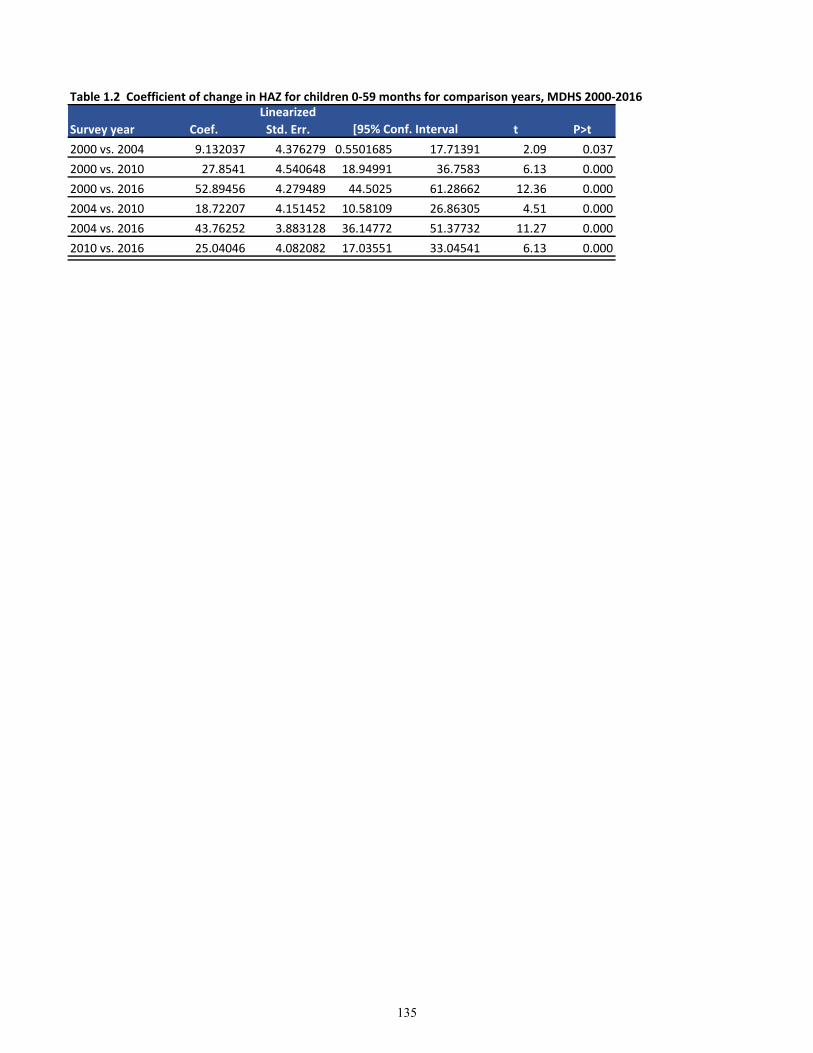
Table 1.2 Coefficient of change in HAZ for children 0-59 months for comparison years, MDHS 2000-2016
Survey year Coef.
Linearized
Std. Err. t P>t
2000 vs. 2004 9.132037 4.376279 0.5501685 17.71391 2.09 0.037
2000 vs. 2010 27.8541 4.540648 18.94991 36.7583 6.13 0.000
2000 vs. 2016 52.89456 4.279489 44.5025 61.28662 12.36 0.000
2004 vs. 2010 18.72207 4.151452 10.58109 26.86305 4.51 0.000
2004 vs. 2016 43.76252 3.883128 36.14772 51.37732 11.27 0.000
2010 vs. 2016 25.04046 4.082082 17.03551 33.04541 6.13 0.000
[95% Conf. Interval
135
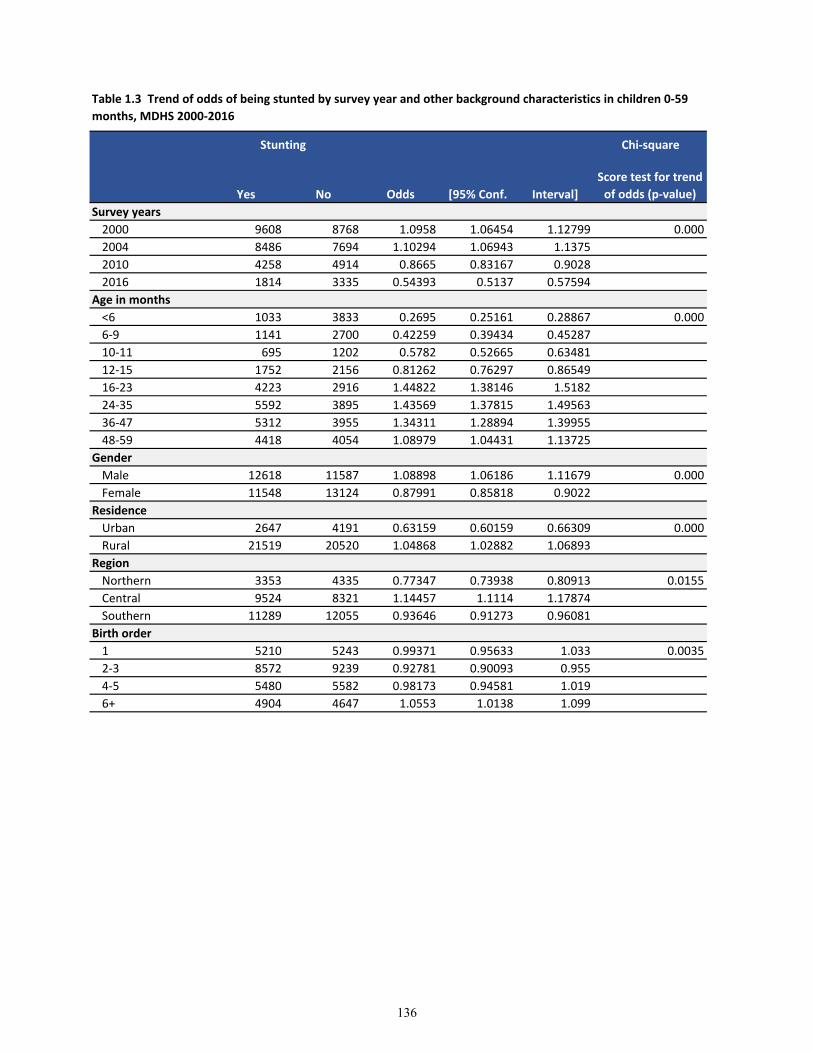
Chi-square
Yes No Odds [95% Conf. Interval]
Score test for trend
of odds (p-value)
Survey years
2000 9608 8768 1.0958 1.06454 1.12799 0.000
2004 8486 7694 1.10294 1.06943 1.1375
2010 4258 4914 0.8665 0.83167 0.9028
2016 1814 3335 0.54393 0.5137 0.57594
Age in months
<6 1033 3833 0.2695 0.25161 0.28867 0.000
6-9 1141 2700 0.42259 0.39434 0.45287
10-11 695 1202 0.5782 0.52665 0.63481
12-15 1752 2156 0.81262 0.76297 0.86549
16-23 4223 2916 1.44822 1.38146 1.5182
24-35 5592 3895 1.43569 1.37815 1.49563
36-47 5312 3955 1.34311 1.28894 1.39955
48-59 4418 4054 1.08979 1.04431 1.13725
Gender
Male 12618 11587 1.08898 1.06186 1.11679 0.000
Female 11548 13124 0.87991 0.85818 0.9022
Residence
Urban 2647 4191 0.63159 0.60159 0.66309 0.000
Rural 21519 20520 1.04868 1.02882 1.06893
Region
Northern 3353 4335 0.77347 0.73938 0.80913 0.0155
Central 9524 8321 1.14457 1.1114 1.17874
Southern 11289 12055 0.93646 0.91273 0.96081
Birth order
1 5210 5243 0.99371 0.95633 1.033 0.0035
2-3 8572 9239 0.92781 0.90093 0.955
4-5 5480 5582 0.98173 0.94581 1.019
6+ 4904 4647 1.0553 1.0138 1.099
Stunting
Table 1.3 Trend of odds of being stunted by survey year and other background characteristics in children 0-59
months, MDHS 2000-2016
136

Chi-square
Yes No Odds [95% Conf. Interval]
Score test for trend
of odds (p-value)
Stunting
Birth interval
First birth 5275 5269 1.00114 0.96364 1.0401 0.000
<24 months 2893 2497 1.15859 1.09819 1.22231
24 - 35 months 7221 6855 1.05339 1.01915 1.08879
36 - 47 months 4620 5087 0.9082 0.87273 0.9451
48+ months 4157 5003 0.8309 0.79742 0.86579
Mother's education
No education 6577 5199 1.26505 1.21986 1.31191 0.000
Primary 15712 15974 0.9836 0.96217 1.0055
Secondary or
higher 1877 3538 0.53053 0.50165 0.56106
Drinking water
Unimproved 9274 8252 1.12385 1.091 1.15768 0.000
Improved 14892 16459 0.90479 0.88496 0.92507
Unimproved 7370 7158 1.02962 0.99667 1.06366 0.0002
Improved 16796 17553 0.95687 0.93684 0.97733
Wealth Index
Lowest 5559 4340 1.28088 1.23102 1.33275 0.000
Second 5501 4908 1.12082 1.07851 1.1648
Middle 5541 5026 1.10247 1.06117 1.14537
Fourth 4631 5168 0.89609 0.86125 0.93234
Highest 2934 5269 0.55684 0.53226 0.58256
Mother's BMI
Underweight 1443 1206 1.19652 1.10843 1.2916 0.000
Normal 19527 19229 1.0155 0.99548 1.03592
Overweight 2774 3890 0.71311 0.67921 0.7487
Sanitation facility
137
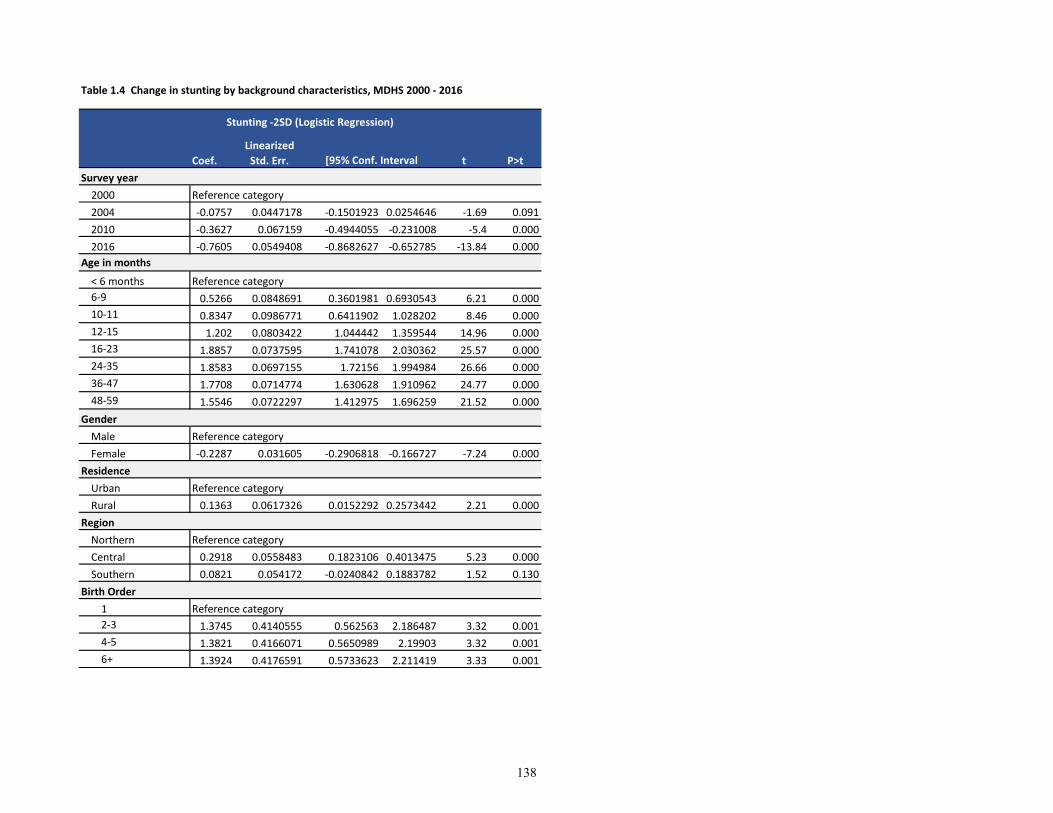
Table 1.4 Change in stunting by background characteristics, MDHS 2000 - 2016
Coef.
Linearized
Std. Err. t P>t
Survey year
2000 Reference category
2004 -0.0757 0.0447178 -0.1501923 0.0254646 -1.69 0.091
2010 -0.3627 0.067159 -0.4944055 -0.231008 -5.4 0.000
2016 -0.7605 0.0549408 -0.8682627 -0.652785 -13.84 0.000
Age in months
< 6 months Reference category
6-9 0.5266 0.0848691 0.3601981 0.6930543 6.21 0.000
10-11 0.8347 0.0986771 0.6411902 1.028202 8.46 0.000
12-15 1.202 0.0803422 1.044442 1.359544 14.96 0.000
16-23 1.8857 0.0737595 1.741078 2.030362 25.57 0.000
24-35 1.8583 0.0697155 1.72156 1.994984 26.66 0.000
36-47 1.7708 0.0714774 1.630628 1.910962 24.77 0.000
48-59 1.5546 0.0722297 1.412975 1.696259 21.52 0.000
Gender
Male Reference category
Female -0.2287 0.031605 -0.2906818 -0.166727 -7.24 0.000
Residence
Urban Reference category
Rural 0.1363 0.0617326 0.0152292 0.2573442 2.21 0.000
Region
Northern Reference category
Central 0.2918 0.0558483 0.1823106 0.4013475 5.23 0.000
Southern 0.0821 0.054172 -0.0240842 0.1883782 1.52 0.130
Birth Order
1 Reference category
2-3 1.3745 0.4140555 0.562563 2.186487 3.32 0.001
4-5 1.3821 0.4166071 0.5650989 2.19903 3.32 0.001
6+ 1.3924 0.4176591 0.5733623 2.211419 3.33 0.001
Stunting -2SD (Logistic Regression)
[95% Conf. Interval
138
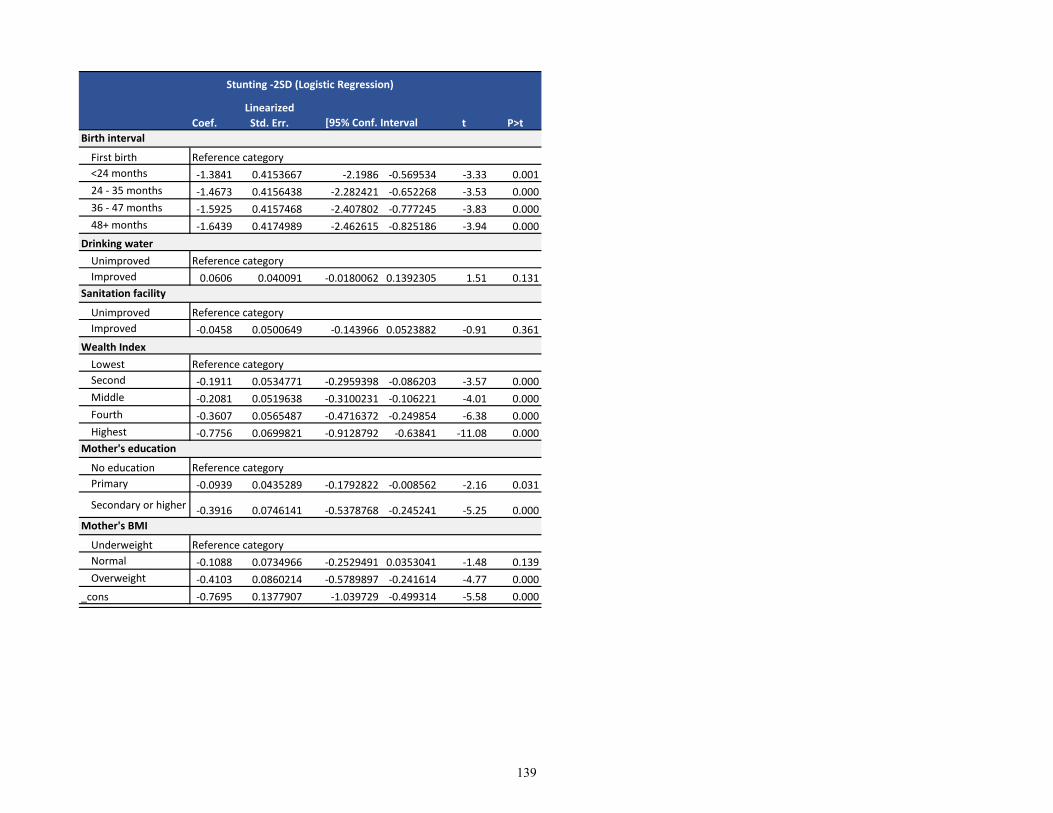
Coef.
Linearized
Std. Err. t P>t
Stunting -2SD (Logistic Regression)
[95% Conf. Interval
First birth Reference category
<24 months -1.3841 0.4153667 -2.1986 -0.569534 -3.33 0.001
24 - 35 months -1.4673 0.4156438 -2.282421 -0.652268 -3.53 0.000
36 - 47 months -1.5925 0.4157468 -2.407802 -0.777245 -3.83 0.000
48+ months -1.6439 0.4174989 -2.462615 -0.825186 -3.94 0.000
Drinking water
Unimproved Reference category
Improved 0.0606 0.040091 -0.0180062 0.1392305 1.51 0.131
Unimproved Reference category
Improved -0.0458 0.0500649 -0.143966 0.0523882 -0.91 0.361
Wealth Index
Lowest Reference category
Second -0.1911 0.0534771 -0.2959398 -0.086203 -3.57 0.000
Middle -0.2081 0.0519638 -0.3100231 -0.106221 -4.01 0.000
Fourth -0.3607 0.0565487 -0.4716372 -0.249854 -6.38 0.000
Highest -0.7756 0.0699821 -0.9128792 -0.63841 -11.08 0.000
No education Reference category
Primary -0.0939 0.0435289 -0.1792822 -0.008562 -2.16 0.031
Secondary or higher -0.3916 0.0746141 -0.5378768 -0.245241 -5.25 0.000
Underweight Reference category
Normal -0.1088 0.0734966 -0.2529491 0.0353041 -1.48 0.139
Overweight -0.4103 0.0860214 -0.5789897 -0.241614 -4.77 0.000
_cons -0.7695 0.1377907 -1.039729 -0.499314 -5.58 0.000
Mother's education
Mother's BMI
Sanitation facility
Birth interval
139
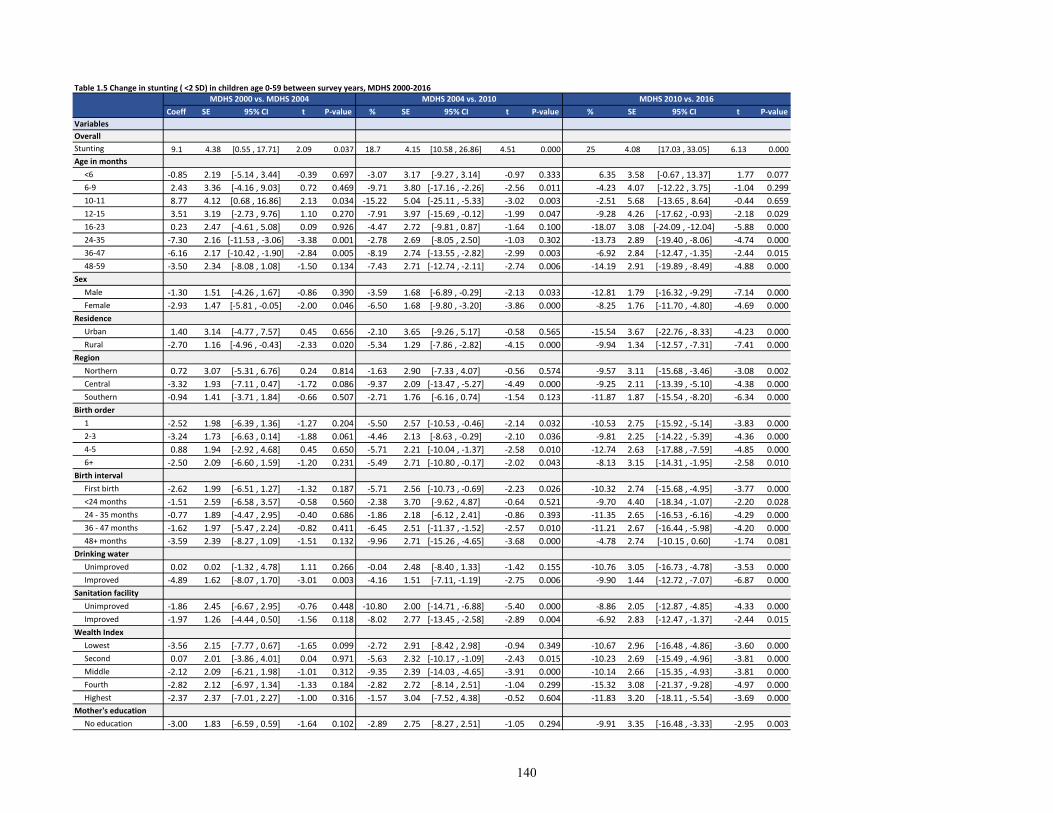
Table 1.5 Change in stunting ( <2 SD) in children age 0-59 between survey years, MDHS 2000-2016
Coeff SE 95% CI t P-value % SE 95% CI t P-value % SE 95% CI t P-value
Variables
Overall
Stunting 9.1 4.38 [0.55 , 17.71] 2.09 0.037 18.7 4.15 [10.58 , 26.86] 4.51 0.000 25 4.08 [17.03 , 33.05] 6.13 0.000
Age in months
<6 -0.85 2.19 [-5.14 , 3.44] -0.39 0.697 -3.07 3.17 [-9.27 , 3.14] -0.97 0.333 6.35 3.58 [-0.67 , 13.37] 1.77 0.077
6-9 2.43 3.36 [-4.16 , 9.03] 0.72 0.469 -9.71 3.80 [-17.16 , -2.26] -2.56 0.011 -4.23 4.07 [-12.22 , 3.75] -1.04 0.299
10-11 8.77 4.12 [0.68 , 16.86] 2.13 0.034 -15.22 5.04 [-25.11 , -5.33] -3.02 0.003 -2.51 5.68 [-13.65 , 8.64] -0.44 0.659
12-15 3.51 3.19 [-2.73 , 9.76] 1.10 0.270 -7.91 3.97 [-15.69 , -0.12] -1.99 0.047 -9.28 4.26 [-17.62 , -0.93] -2.18 0.029
16-23 0.23 2.47 [-4.61 , 5.08] 0.09 0.926 -4.47 2.72 [-9.81 , 0.87] -1.64 0.100 -18.07 3.08 [-24.09 , -12.04] -5.88 0.000
24-35 -7.30 2.16 [-11.53 , -3.06] -3.38 0.001 -2.78 2.69 [-8.05 , 2.50] -1.03 0.302 -13.73 2.89 [-19.40 , -8.06] -4.74 0.000
36-47 -6.16 2.17 [-10.42 , -1.90] -2.84 0.005 -8.19 2.74 [-13.55 , -2.82] -2.99 0.003 -6.92 2.84 [-12.47 , -1.35] -2.44 0.015
48-59 -3.50 2.34 [-8.08 , 1.08] -1.50 0.134 -7.43 2.71 [-12.74 , -2.11] -2.74 0.006 -14.19 2.91 [-19.89 , -8.49] -4.88 0.000
Sex
Male -1.30 1.51 [-4.26 , 1.67] -0.86 0.390 -3.59 1.68 [-6.89 , -0.29] -2.13 0.033 -12.81 1.79 [-16.32 , -9.29] -7.14 0.000
Female -2.93 1.47 [-5.81 , -0.05] -2.00 0.046 -6.50 1.68 [-9.80 , -3.20] -3.86 0.000 -8.25 1.76 [-11.70 , -4.80] -4.69 0.000
Residence
Urban 1.40 3.14 [-4.77 , 7.57] 0.45 0.656 -2.10 3.65 [-9.26 , 5.17] -0.58 0.565 -15.54 3.67 [-22.76 , -8.33] -4.23 0.000
Rural -2.70 1.16 [-4.96 , -0.43] -2.33 0.020 -5.34 1.29 [-7.86 , -2.82] -4.15 0.000 -9.94 1.34 [-12.57 , -7.31] -7.41 0.000
Region
Northern 0.72 3.07 [-5.31 , 6.76] 0.24 0.814 -1.63 2.90 [-7.33 , 4.07] -0.56 0.574 -9.57 3.11 [-15.68 , -3.46] -3.08 0.002
Central -3.32 1.93 [-7.11 , 0.47] -1.72 0.086 -9.37 2.09 [-13.47 , -5.27] -4.49 0.000 -9.25 2.11 [-13.39 , -5.10] -4.38 0.000
Southern -0.94 1.41 [-3.71 , 1.84] -0.66 0.507 -2.71 1.76 [-6.16 , 0.74] -1.54 0.123 -11.87 1.87 [-15.54 , -8.20] -6.34 0.000
Birth order
1 -2.52 1.98 [-6.39 , 1.36] -1.27 0.204 -5.50 2.57 [-10.53 , -0.46] -2.14 0.032 -10.53 2.75 [-15.92 , -5.14] -3.83 0.000
2-3 -3.24 1.73 [-6.63 , 0.14] -1.88 0.061 -4.46 2.13 [-8.63 , -0.29] -2.10 0.036 -9.81 2.25 [-14.22 , -5.39] -4.36 0.000
4-5 0.88 1.94 [-2.92 , 4.68] 0.45 0.650 -5.71 2.21 [-10.04 , -1.37] -2.58 0.010 -12.74 2.63 [-17.88 , -7.59] -4.85 0.000
6+ -2.50 2.09 [-6.60 , 1.59] -1.20 0.231 -5.49 2.71 [-10.80 , -0.17] -2.02 0.043 -8.13 3.15 [-14.31 , -1.95] -2.58 0.010
Birth interval
First birth -2.62 1.99 [-6.51 , 1.27] -1.32 0.187 -5.71 2.56 [-10.73 , -0.69] -2.23 0.026 -10.32 2.74 [-15.68 , -4.95] -3.77 0.000
<24 months -1.51 2.59 [-6.58 , 3.57] -0.58 0.560 -2.38 3.70 [-9.62 , 4.87] -0.64 0.521 -9.70 4.40 [-18.34 , -1.07] -2.20 0.028
24 - 35 months -0.77 1.89 [-4.47 , 2.95] -0.40 0.686 -1.86 2.18 [-6.12 , 2.41] -0.86 0.393 -11.35 2.65 [-16.53 , -6.16] -4.29 0.000
36 - 47 months -1.62 1.97 [-5.47 , 2.24] -0.82 0.411 -6.45 2.51 [-11.37 , -1.52] -2.57 0.010 -11.21 2.67 [-16.44 , -5.98] -4.20 0.000
48+ months -3.59 2.39 [-8.27 , 1.09] -1.51 0.132 -9.96 2.71 [-15.26 , -4.65] -3.68 0.000 -4.78 2.74 [-10.15 , 0.60] -1.74 0.081
Drinking water
Unimproved 0.02 0.02 [-1.32 , 4.78] 1.11 0.266 -0.04 2.48 [-8.40 , 1.33] -1.42 0.155 -10.76 3.05 [-16.73 , -4.78] -3.53 0.000
Improved -4.89 1.62 [-8.07 , 1.70] -3.01 0.003 -4.16 1.51 [-7.11, -1.19] -2.75 0.006 -9.90 1.44 [-12.72 , -7.07] -6.87 0.000
Sanitation facility
Unimproved -1.86 2.45 [-6.67 , 2.95] -0.76 0.448 -10.80 2.00 [-14.71 , -6.88] -5.40 0.000 -8.86 2.05 [-12.87 , -4.85] -4.33 0.000
Improved -1.97 1.26 [-4.44 , 0.50] -1.56 0.118 -8.02 2.77 [-13.45 , -2.58] -2.89 0.004 -6.92 2.83 [-12.47 , -1.37] -2.44 0.015
Wealth Index
Lowest -3.56 2.15 [-7.77 , 0.67] -1.65 0.099 -2.72 2.91 [-8.42 , 2.98] -0.94 0.349 -10.67 2.96 [-16.48 , -4.86] -3.60 0.000
Second 0.07 2.01 [-3.86 , 4.01] 0.04 0.971 -5.63 2.32 [-10.17 , -1.09] -2.43 0.015 -10.23 2.69 [-15.49 , -4.96] -3.81 0.000
Middle -2.12 2.09 [-6.21 , 1.98] -1.01 0.312 -9.35 2.39 [-14.03 , -4.65] -3.91 0.000 -10.14 2.66 [-15.35 , -4.93] -3.81 0.000
Fourth -2.82 2.12 [-6.97 , 1.34] -1.33 0.184 -2.82 2.72 [-8.14 , 2.51] -1.04 0.299 -15.32 3.08 [-21.37 , -9.28] -4.97 0.000
Highest -2.37 2.37 [-7.01 , 2.27] -1.00 0.316 -1.57 3.04 [-7.52 , 4.38] -0.52 0.604 -11.83 3.20 [-18.11 , -5.54] -3.69 0.000
Mother's education
No education -3.00 1.83 [-6.59 , 0.59] -1.64 0.102 -2.89 2.75 [-8.27 , 2.51] -1.05 0.294 -9.91 3.35 [-16.48 , -3.33] -2.95 0.003
MDHS 2000 vs. MDHS 2004 MDHS 2004 vs. 2010 MDHS 2010 vs. 2016
140
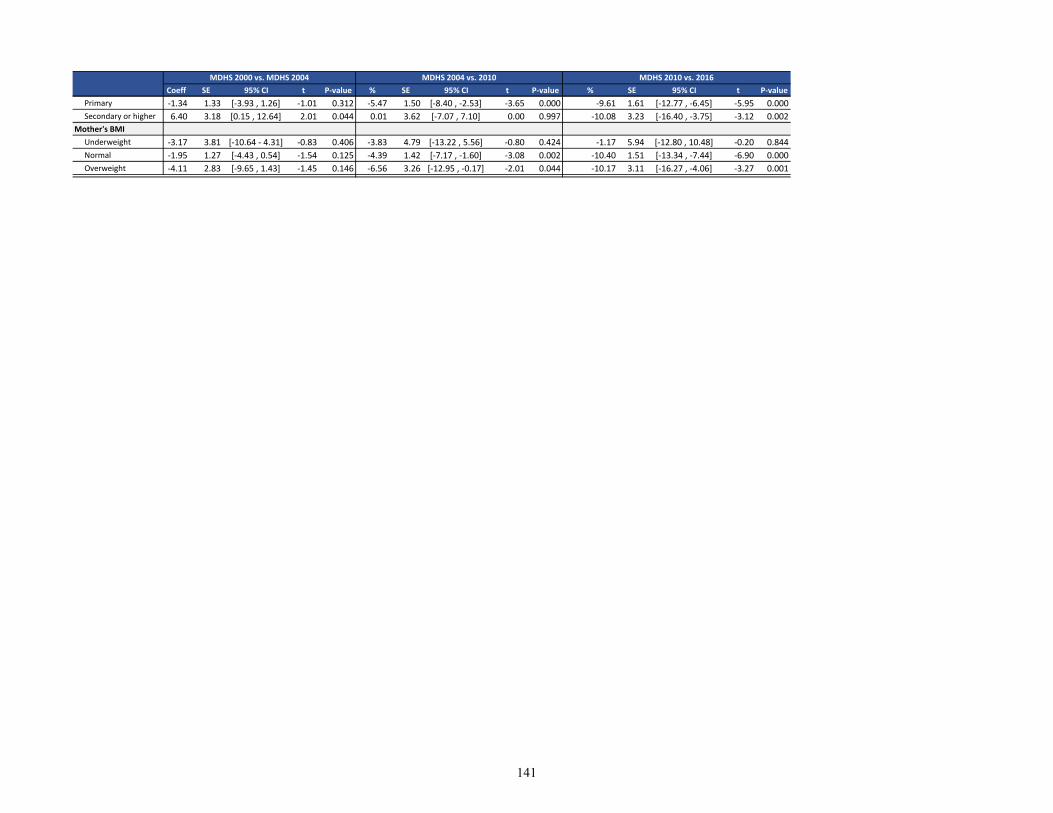
Coeff SE 95% CI t P-value % SE 95% CI t P-value % SE 95% CI t P-value
MDHS 2000 vs. MDHS 2004 MDHS 2004 vs. 2010 MDHS 2010 vs. 2016
Primary -1.34 1.33 [-3.93 , 1.26] -1.01 0.312 -5.47 1.50 [-8.40 , -2.53] -3.65 0.000 -9.61 1.61 [-12.77 , -6.45] -5.95 0.000
Secondary or higher 6.40 3.18 [0.15 , 12.64] 2.01 0.044 0.01 3.62 [-7.07 , 7.10] 0.00 0.997 -10.08 3.23 [-16.40 , -3.75] -3.12 0.002
Mother's BMI
Underweight -3.17 3.81 [-10.64 - 4.31] -0.83 0.406 -3.83 4.79 [-13.22 , 5.56] -0.80 0.424 -1.17 5.94 [-12.80 , 10.48] -0.20 0.844
Normal -1.95 1.27 [-4.43 , 0.54] -1.54 0.125 -4.39 1.42 [-7.17 , -1.60] -3.08 0.002 -10.40 1.51 [-13.34 , -7.44] -6.90 0.000
Overweight -4.11 2.83 [-9.65 , 1.43] -1.45 0.146 -6.56 3.26 [-12.95 , -0.17] -2.01 0.044 -10.17 3.11 [-16.27 , -4.06] -3.27 0.001
141
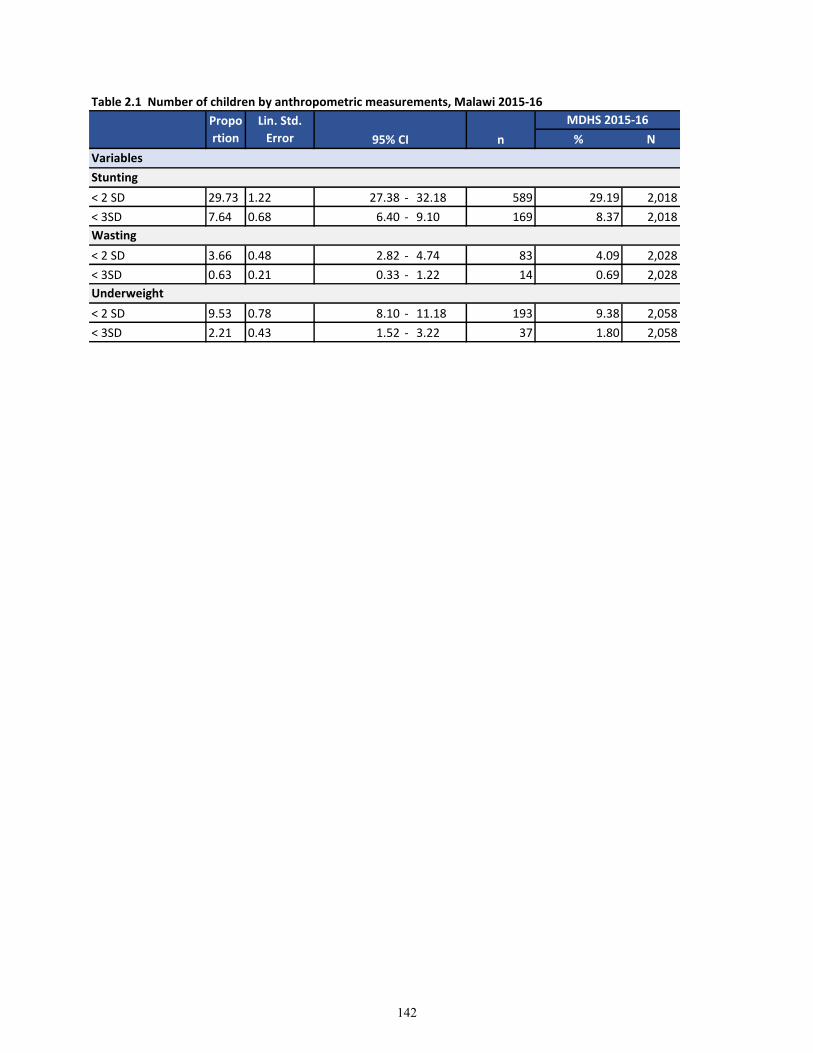
Table 2.1 Number of children by anthropometric measurements, Malawi 2015-16
% N
< 2 SD 29.73 1.22 27.38 - 32.18 589 29.19 2,018
< 3SD 7.64 0.68 6.40 - 9.10 169 8.37 2,018
< 2 SD 3.66 0.48 2.82 - 4.74 83 4.09 2,028
< 3SD 0.63 0.21 0.33 - 1.22 14 0.69 2,028
< 2 SD 9.53 0.78 8.10 - 11.18 193 9.38 2,058
< 3SD 2.21 0.43 1.52 - 3.22 37 1.80 2,058
Variables
Stunting
Wasting
Underweight
Propo
rtion
Lin. Std.
Error 95% CI n
MDHS 2015-16
142
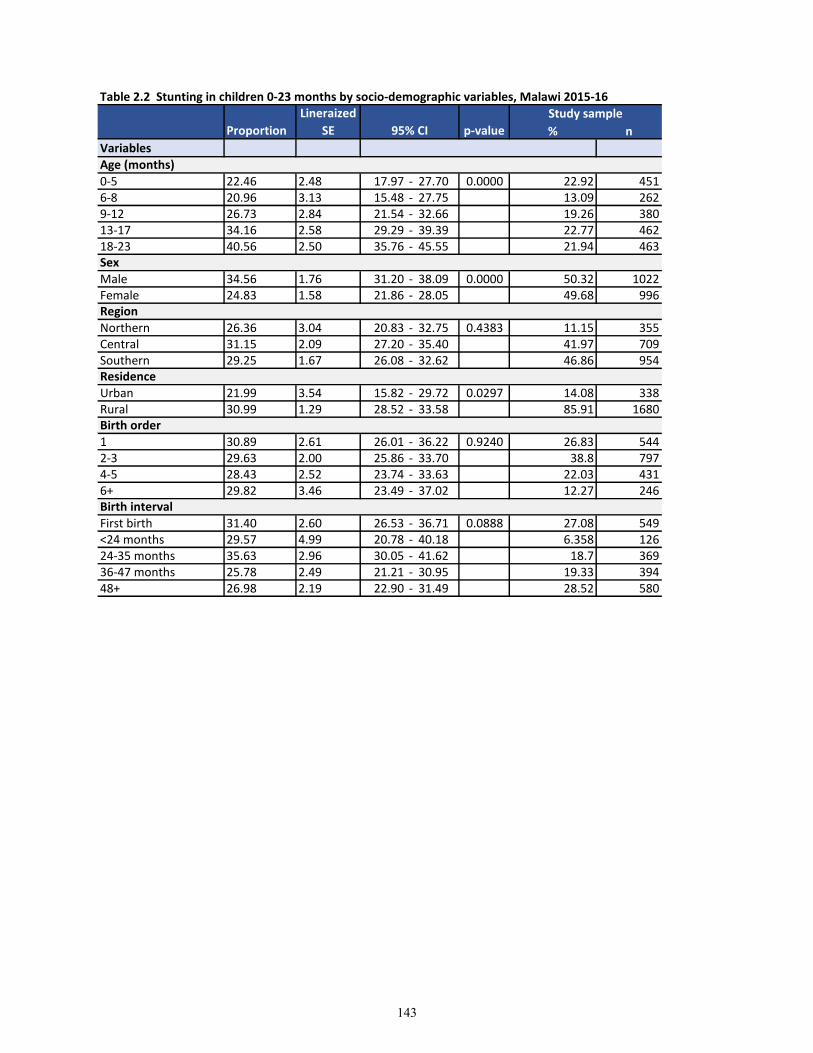
Table 2.2 Stunting in children 0-23 months by socio-demographic variables, Malawi 2015-16
% n
Variables
0-5 22.46 2.48 17.97 - 27.70 0.0000 22.92 4516-8 20.96 3.13 15.48 - 27.75 13.09 2629-12 26.73 2.84 21.54 - 32.66 19.26 38013-17 34.16 2.58 29.29 - 39.39 22.77 46218-23 40.56 2.50 35.76 - 45.55 21.94 463
Male 34.56 1.76 31.20 - 38.09 0.0000 50.32 1022Female 24.83 1.58 21.86 - 28.05 49.68 996
Northern 26.36 3.04 20.83 - 32.75 0.4383 11.15 355Central 31.15 2.09 27.20 - 35.40 41.97 709Southern 29.25 1.67 26.08 - 32.62 46.86 954
Urban 21.99 3.54 15.82 - 29.72 0.0297 14.08 338Rural 30.99 1.29 28.52 - 33.58 85.91 1680
1 30.89 2.61 26.01 - 36.22 0.9240 26.83 5442-3 29.63 2.00 25.86 - 33.70 38.8 7974-5 28.43 2.52 23.74 - 33.63 22.03 4316+ 29.82 3.46 23.49 - 37.02 12.27 246
First birth 31.40 2.60 26.53 - 36.71 0.0888 27.08 549<24 months 29.57 4.99 20.78 - 40.18 6.358 12624-35 months 35.63 2.96 30.05 - 41.62 18.7 36936-47 months 25.78 2.49 21.21 - 30.95 19.33 39448+ 26.98 2.19 22.90 - 31.49 28.52 580
Birth interval
Age (months)
Sex
Region
Residence
Birth order
Study sample
Proportion
Lineraized
SE 95% CI p-value
143
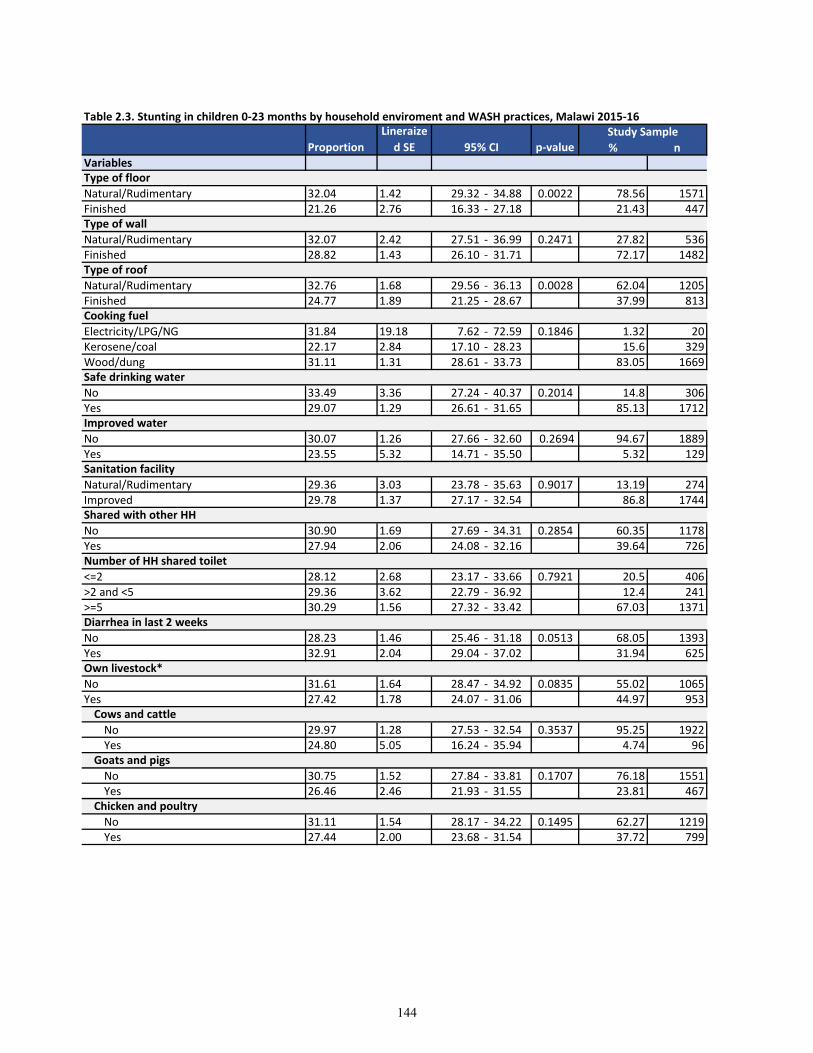
% nVariables
Natural/Rudimentary 32.04 1.42 29.32 - 34.88 0.0022 78.56 1571Finished 21.26 2.76 16.33 - 27.18 21.43 447
Natural/Rudimentary 32.07 2.42 27.51 - 36.99 0.2471 27.82 536Finished 28.82 1.43 26.10 - 31.71 72.17 1482
Natural/Rudimentary 32.76 1.68 29.56 - 36.13 0.0028 62.04 1205Finished 24.77 1.89 21.25 - 28.67 37.99 813
Electricity/LPG/NG 31.84 19.18 7.62 - 72.59 0.1846 1.32 20Kerosene/coal 22.17 2.84 17.10 - 28.23 15.6 329Wood/dung 31.11 1.31 28.61 - 33.73 83.05 1669
No 33.49 3.36 27.24 - 40.37 0.2014 14.8 306Yes 29.07 1.29 26.61 - 31.65 85.13 1712
No 30.07 1.26 27.66 - 32.60 0.2694 94.67 1889Yes 23.55 5.32 14.71 - 35.50 5.32 129
Natural/Rudimentary 29.36 3.03 23.78 - 35.63 0.9017 13.19 274Improved 29.78 1.37 27.17 - 32.54 86.8 1744
No 30.90 1.69 27.69 - 34.31 0.2854 60.35 1178Yes 27.94 2.06 24.08 - 32.16 39.64 726
<=2 28.12 2.68 23.17 - 33.66 0.7921 20.5 406>2 and <5 29.36 3.62 22.79 - 36.92 12.4 241>=5 30.29 1.56 27.32 - 33.42 67.03 1371
No 28.23 1.46 25.46 - 31.18 0.0513 68.05 1393Yes 32.91 2.04 29.04 - 37.02 31.94 625
No 31.61 1.64 28.47 - 34.92 0.0835 55.02 1065Yes 27.42 1.78 24.07 - 31.06 44.97 953
No 29.97 1.28 27.53 - 32.54 0.3537 95.25 1922Yes 24.80 5.05 16.24 - 35.94 4.74 96
No 30.75 1.52 27.84 - 33.81 0.1707 76.18 1551Yes 26.46 2.46 21.93 - 31.55 23.81 467
No 31.11 1.54 28.17 - 34.22 0.1495 62.27 1219Yes 27.44 2.00 23.68 - 31.54 37.72 799
Improved water
Sanitation facility
Shared with other HH
Safe drinking water
Proportion
Lineraize
d SE 95% CI p-valueStudy Sample
Table 2.3. Stunting in children 0-23 months by household enviroment and WASH practices, Malawi 2015-16
Number of HH shared toilet
Diarrhea in last 2 weeks
Cows and cattle
Goats and pigs
Chicken and poultry
Own livestock*
Type of floor
Type of wall
Type of roof
Cooking fuel
144
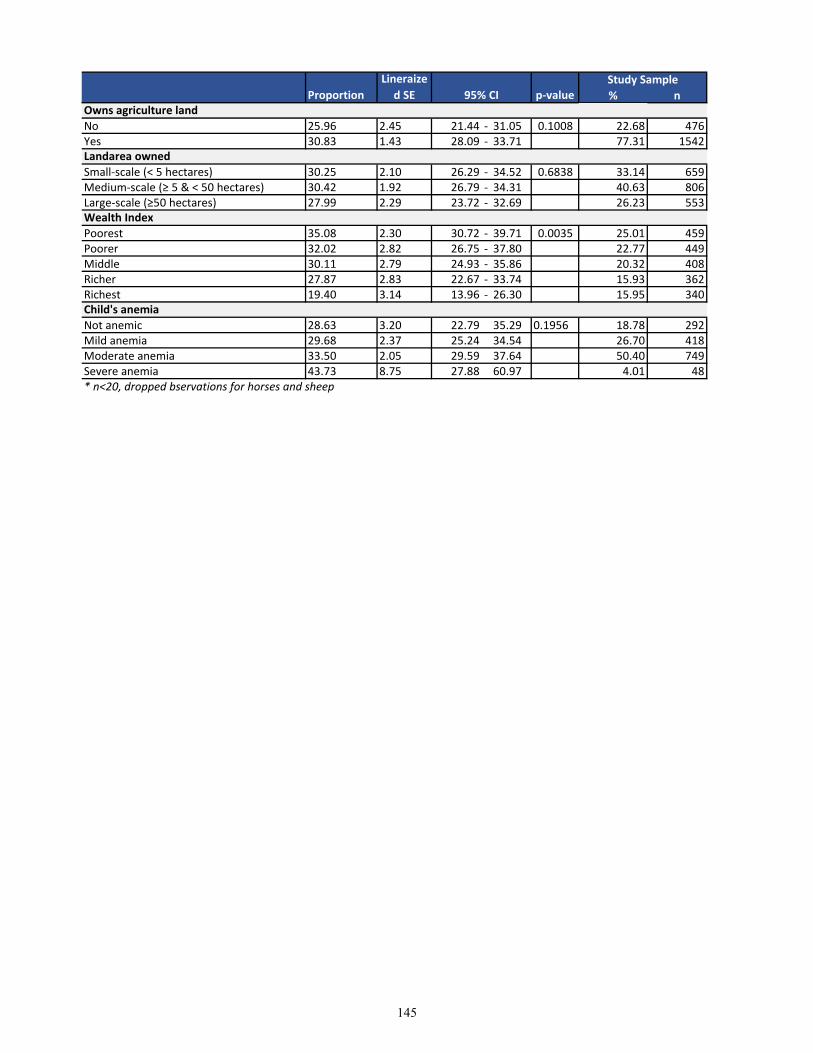
% nProportion
Lineraize
d SE 95% CI p-valueStudy Sample
No 25.96 2.45 21.44 - 31.05 0.1008 22.68 476Yes 30.83 1.43 28.09 - 33.71 77.31 1542
Small-scale (< 5 hectares) 30.25 2.10 26.29 - 34.52 0.6838 33.14 659Medium-scale (≥ 5 & < 50 hectares) 30.42 1.92 26.79 - 34.31 40.63 806Large-scale (≥50 hectares) 27.99 2.29 23.72 - 32.69 26.23 553
Poorest 35.08 2.30 30.72 - 39.71 0.0035 25.01 459Poorer 32.02 2.82 26.75 - 37.80 22.77 449Middle 30.11 2.79 24.93 - 35.86 20.32 408Richer 27.87 2.83 22.67 - 33.74 15.93 362Richest 19.40 3.14 13.96 - 26.30 15.95 340
Not anemic 28.63 3.20 22.79 35.29 0.1956 18.78 292Mild anemia 29.68 2.37 25.24 34.54 26.70 418Moderate anemia 33.50 2.05 29.59 37.64 50.40 749Severe anemia 43.73 8.75 27.88 60.97 4.01 48* n<20, dropped bservations for horses and sheep
Child's anemia
Owns agriculture land
Landarea owned
Wealth Index
145
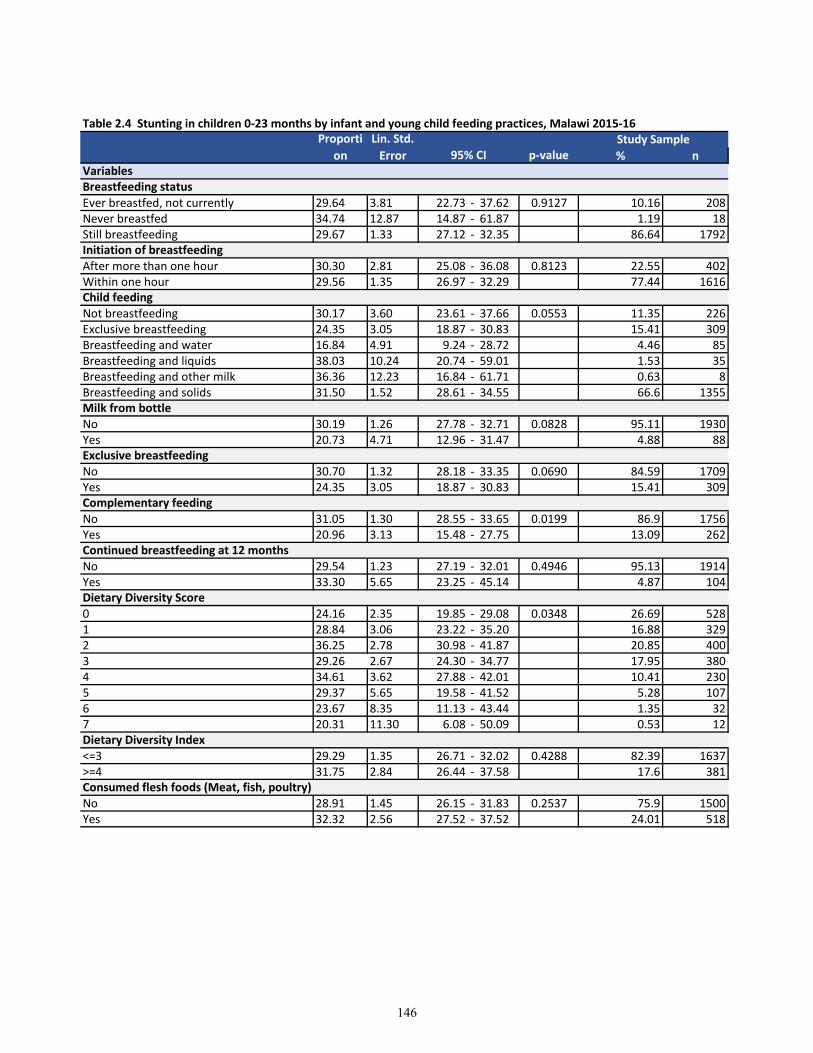
% n
Ever breastfed, not currently 29.64 3.81 22.73 - 37.62 0.9127 10.16 208Never breastfed 34.74 12.87 14.87 - 61.87 1.19 18Still breastfeeding 29.67 1.33 27.12 - 32.35 86.64 1792
After more than one hour 30.30 2.81 25.08 - 36.08 0.8123 22.55 402Within one hour 29.56 1.35 26.97 - 32.29 77.44 1616
Not breastfeeding 30.17 3.60 23.61 - 37.66 0.0553 11.35 226Exclusive breastfeeding 24.35 3.05 18.87 - 30.83 15.41 309Breastfeeding and water 16.84 4.91 9.24 - 28.72 4.46 85Breastfeeding and liquids 38.03 10.24 20.74 - 59.01 1.53 35Breastfeeding and other milk 36.36 12.23 16.84 - 61.71 0.63 8Breastfeeding and solids 31.50 1.52 28.61 - 34.55 66.6 1355
No 30.19 1.26 27.78 - 32.71 0.0828 95.11 1930Yes 20.73 4.71 12.96 - 31.47 4.88 88
No 30.70 1.32 28.18 - 33.35 0.0690 84.59 1709Yes 24.35 3.05 18.87 - 30.83 15.41 309
No 31.05 1.30 28.55 - 33.65 0.0199 86.9 1756Yes 20.96 3.13 15.48 - 27.75 13.09 262
No 29.54 1.23 27.19 - 32.01 0.4946 95.13 1914Yes 33.30 5.65 23.25 - 45.14 4.87 104
0 24.16 2.35 19.85 - 29.08 0.0348 26.69 5281 28.84 3.06 23.22 - 35.20 16.88 3292 36.25 2.78 30.98 - 41.87 20.85 4003 29.26 2.67 24.30 - 34.77 17.95 3804 34.61 3.62 27.88 - 42.01 10.41 2305 29.37 5.65 19.58 - 41.52 5.28 1076 23.67 8.35 11.13 - 43.44 1.35 327 20.31 11.30 6.08 - 50.09 0.53 12
<=3 29.29 1.35 26.71 - 32.02 0.4288 82.39 1637>=4 31.75 2.84 26.44 - 37.58 17.6 381
No 28.91 1.45 26.15 - 31.83 0.2537 75.9 1500Yes 32.32 2.56 27.52 - 37.52 24.01 518
Dietary Diversity Index
Table 2.4 Stunting in children 0-23 months by infant and young child feeding practices, Malawi 2015-16
Consumed flesh foods (Meat, fish, poultry)
VariablesBreastfeeding status
Initiation of breastfeeding
Child feeding
Milk from bottle
Proporti
on
Lin. Std.
Error 95% CI p-valueStudy Sample
Exclusive breastfeeding
Complementary feeding
Continued breastfeeding at 12 months
Dietary Diversity Score
146
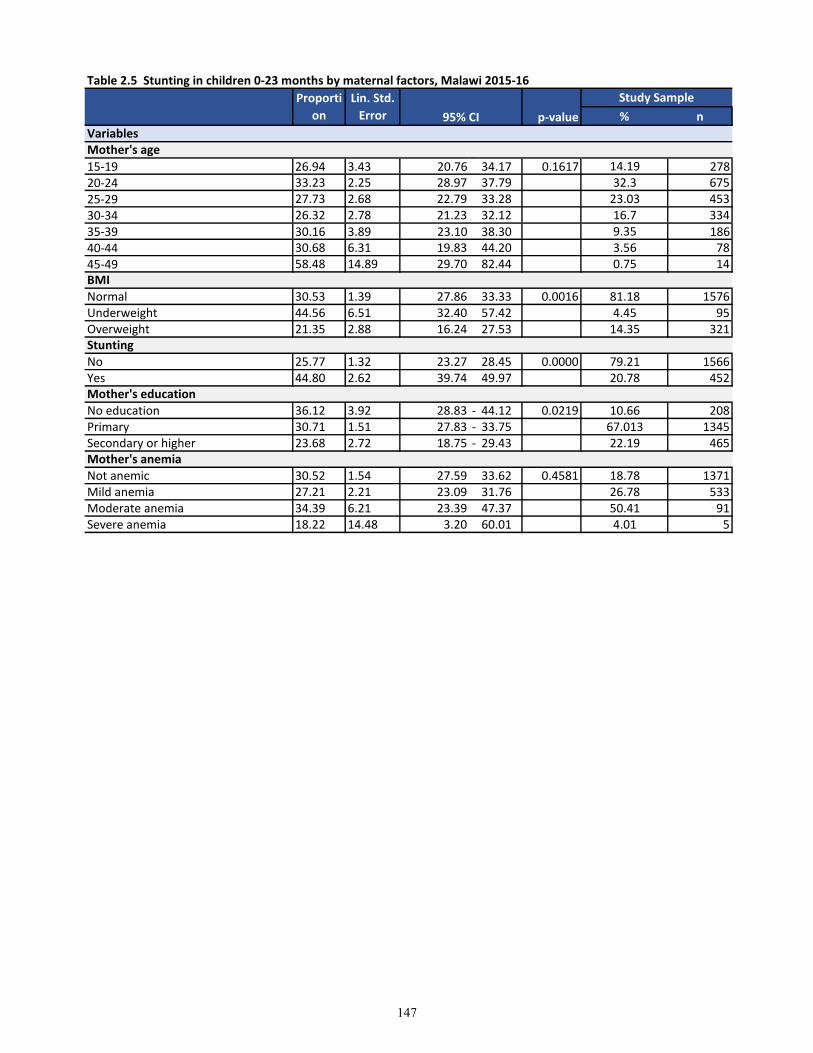
Table 2.5 Stunting in children 0-23 months by maternal factors, Malawi 2015-16
% n
15-19 26.94 3.43 20.76 34.17 0.1617 14.19 27820-24 33.23 2.25 28.97 37.79 32.3 675
25-29 27.73 2.68 22.79 33.28 23.03 453
30-34 26.32 2.78 21.23 32.12 16.7 334
35-39 30.16 3.89 23.10 38.30 9.35 18640-44 30.68 6.31 19.83 44.20 3.56 78
45-49 58.48 14.89 29.70 82.44 0.75 14
Normal 30.53 1.39 27.86 33.33 0.0016 81.18 1576Underweight 44.56 6.51 32.40 57.42 4.45 95Overweight 21.35 2.88 16.24 27.53 14.35 321
No 25.77 1.32 23.27 28.45 0.0000 79.21 1566Yes 44.80 2.62 39.74 49.97 20.78 452
No education 36.12 3.92 28.83 - 44.12 0.0219 10.66 208Primary 30.71 1.51 27.83 - 33.75 67.013 1345Secondary or higher 23.68 2.72 18.75 - 29.43 22.19 465
Not anemic 30.52 1.54 27.59 33.62 0.4581 18.78 1371Mild anemia 27.21 2.21 23.09 31.76 26.78 533Moderate anemia 34.39 6.21 23.39 47.37 50.41 91Severe anemia 18.22 14.48 3.20 60.01 4.01 5
BMI
Stunting
Mother's education
Mother's anemia
VariablesMother's age
Proporti
on
Lin. Std.
Error 95% CI p-value
Study Sample
147
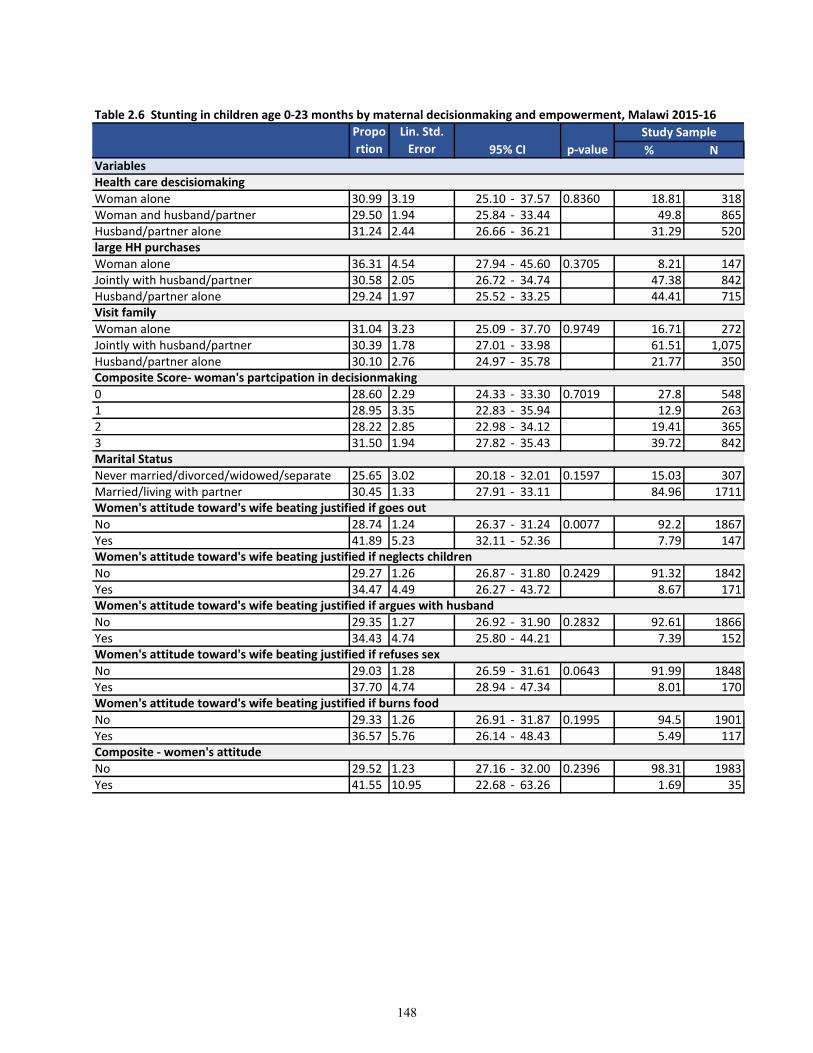
% N
Woman alone 30.99 3.19 25.10 - 37.57 0.8360 18.81 318Woman and husband/partner 29.50 1.94 25.84 - 33.44 49.8 865Husband/partner alone 31.24 2.44 26.66 - 36.21 31.29 520
Woman alone 36.31 4.54 27.94 - 45.60 0.3705 8.21 147Jointly with husband/partner 30.58 2.05 26.72 - 34.74 47.38 842Husband/partner alone 29.24 1.97 25.52 - 33.25 44.41 715
Woman alone 31.04 3.23 25.09 - 37.70 0.9749 16.71 272Jointly with husband/partner 30.39 1.78 27.01 - 33.98 61.51 1,075Husband/partner alone 30.10 2.76 24.97 - 35.78 21.77 350
0 28.60 2.29 24.33 - 33.30 0.7019 27.8 5481 28.95 3.35 22.83 - 35.94 12.9 2632 28.22 2.85 22.98 - 34.12 19.41 3653 31.50 1.94 27.82 - 35.43 39.72 842
Never married/divorced/widowed/separate 25.65 3.02 20.18 - 32.01 0.1597 15.03 307Married/living with partner 30.45 1.33 27.91 - 33.11 84.96 1711
No 28.74 1.24 26.37 - 31.24 0.0077 92.2 1867Yes 41.89 5.23 32.11 - 52.36 7.79 147
No 29.27 1.26 26.87 - 31.80 0.2429 91.32 1842Yes 34.47 4.49 26.27 - 43.72 8.67 171
No 29.35 1.27 26.92 - 31.90 0.2832 92.61 1866Yes 34.43 4.74 25.80 - 44.21 7.39 152
No 29.03 1.28 26.59 - 31.61 0.0643 91.99 1848Yes 37.70 4.74 28.94 - 47.34 8.01 170
No 29.33 1.26 26.91 - 31.87 0.1995 94.5 1901Yes 36.57 5.76 26.14 - 48.43 5.49 117
No 29.52 1.23 27.16 - 32.00 0.2396 98.31 1983Yes 41.55 10.95 22.68 - 63.26 1.69 35
Marital Status
Women's attitude toward's wife beating justified if goes out
Women's attitude toward's wife beating justified if neglects children
Propo
rtion
Lin. Std.
Error 95% CI p-value
Study Sample
Table 2.6 Stunting in children age 0-23 months by maternal decisionmaking and empowerment, Malawi 2015-16
Women's attitude toward's wife beating justified if argues with husband
Women's attitude toward's wife beating justified if refuses sex
Composite - women's attitude
Women's attitude toward's wife beating justified if burns food
VariablesHealth care descisiomaking
large HH purchases
Visit family
Composite Score- woman's partcipation in decisionmaking
148
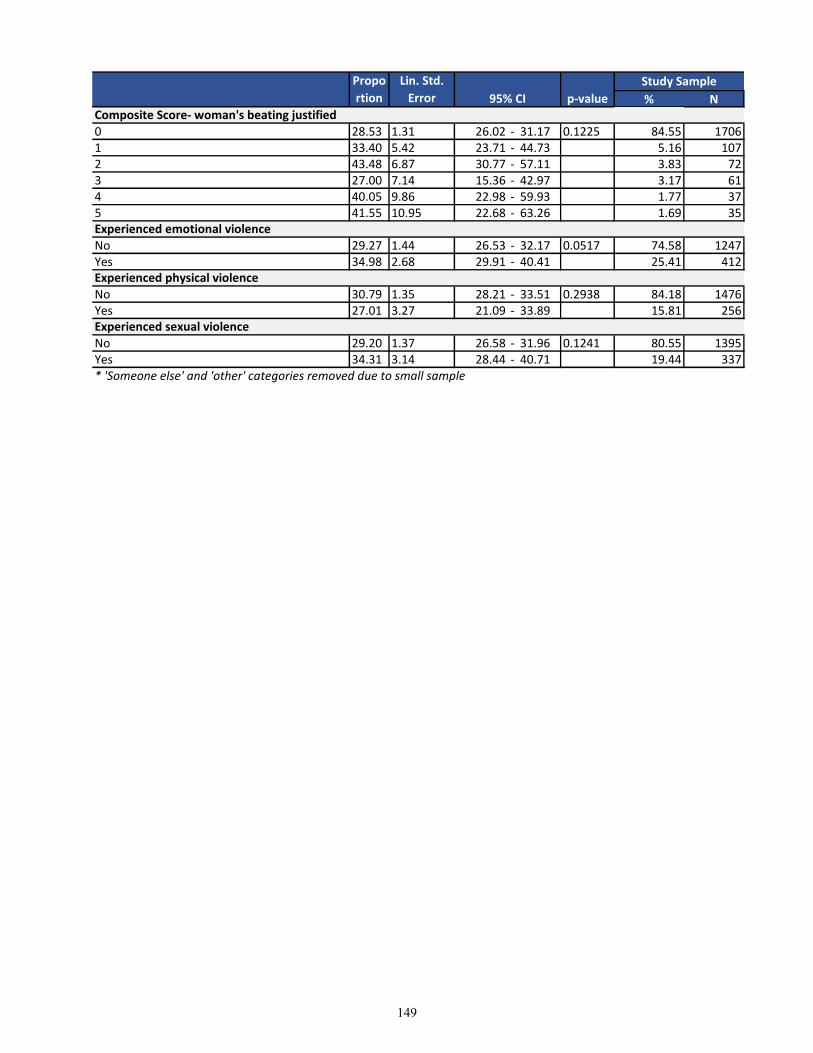
% N
Propo
rtion
Lin. Std.
Error 95% CI p-value
Study Sample
0 28.53 1.31 26.02 - 31.17 0.1225 84.55 17061 33.40 5.42 23.71 - 44.73 5.16 1072 43.48 6.87 30.77 - 57.11 3.83 723 27.00 7.14 15.36 - 42.97 3.17 614 40.05 9.86 22.98 - 59.93 1.77 375 41.55 10.95 22.68 - 63.26 1.69 35
No 29.27 1.44 26.53 - 32.17 0.0517 74.58 1247Yes 34.98 2.68 29.91 - 40.41 25.41 412
No 30.79 1.35 28.21 - 33.51 0.2938 84.18 1476Yes 27.01 3.27 21.09 - 33.89 15.81 256
No 29.20 1.37 26.58 - 31.96 0.1241 80.55 1395Yes 34.31 3.14 28.44 - 40.71 19.44 337* 'Someone else' and 'other' categories removed due to small sample
Experienced physical violence
Experienced sexual violence
Composite Score- woman's beating justified
Experienced emotional violence
149
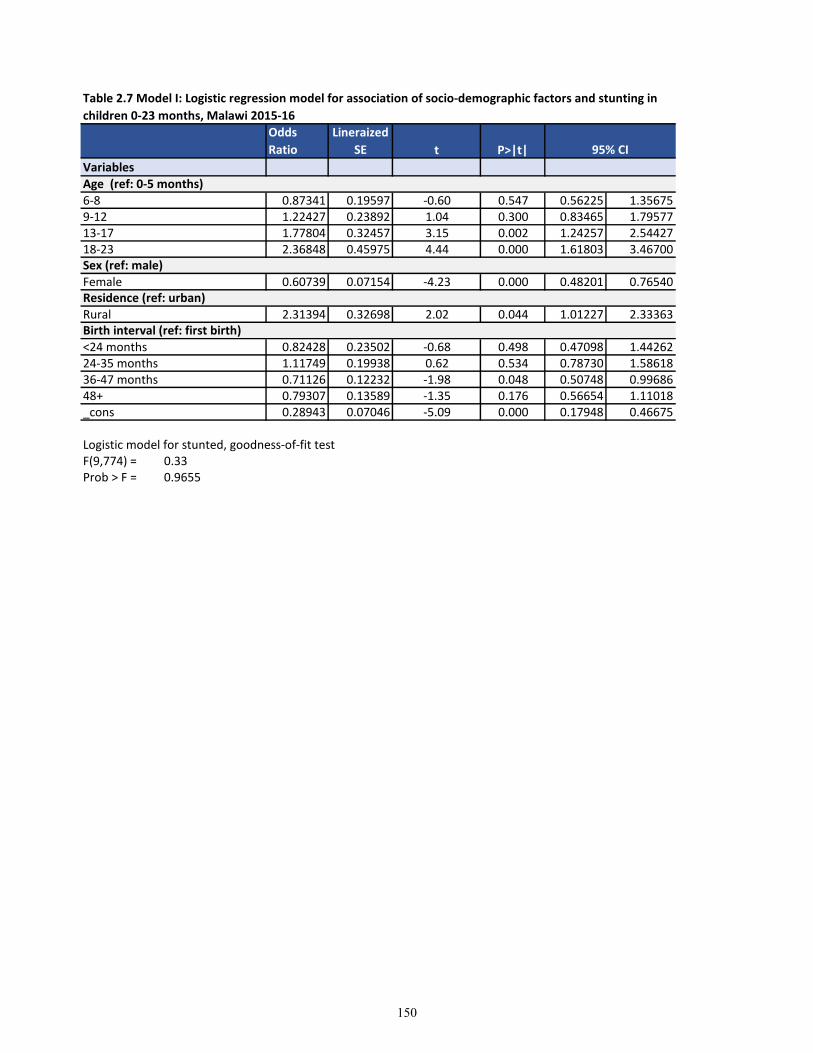
t P>|t|
Variables
6-8 0.87341 0.19597 -0.60 0.547 0.56225 1.356759-12 1.22427 0.23892 1.04 0.300 0.83465 1.7957713-17 1.77804 0.32457 3.15 0.002 1.24257 2.5442718-23 2.36848 0.45975 4.44 0.000 1.61803 3.46700
Female 0.60739 0.07154 -4.23 0.000 0.48201 0.76540
Rural 2.31394 0.32698 2.02 0.044 1.01227 2.33363
<24 months 0.82428 0.23502 -0.68 0.498 0.47098 1.4426224-35 months 1.11749 0.19938 0.62 0.534 0.78730 1.5861836-47 months 0.71126 0.12232 -1.98 0.048 0.50748 0.9968648+ 0.79307 0.13589 -1.35 0.176 0.56654 1.11018_cons 0.28943 0.07046 -5.09 0.000 0.17948 0.46675
Logistic model for stunted, goodness-of-fit testF(9,774) = 0.33Prob > F = 0.9655
Sex (ref: male)
Residence (ref: urban)
Birth interval (ref: first birth)
Age (ref: 0-5 months)
Table 2.7 Model I: Logistic regression model for association of socio-demographic factors and stunting in
children 0-23 months, Malawi 2015-16
Odds
Ratio
Lineraized
SE 95% CI
150
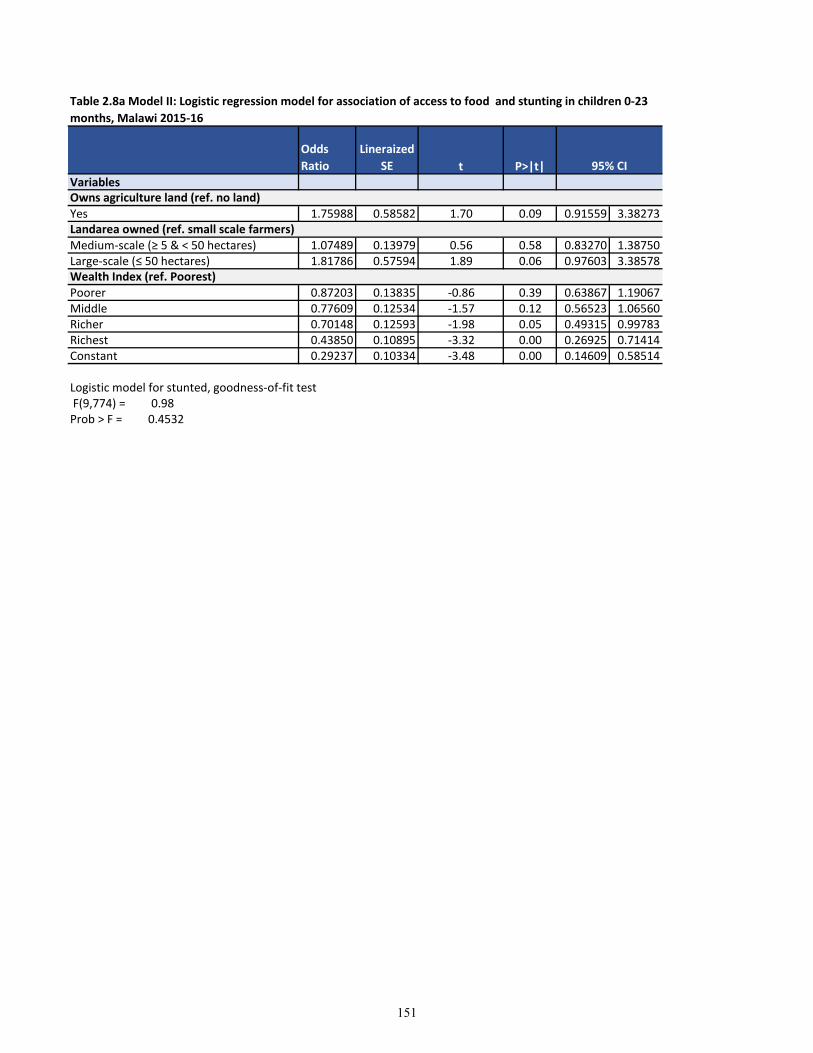
t P>|t|Variables
Yes 1.75988 0.58582 1.70 0.09 0.91559 3.38273
Medium-scale (≥ 5 & < 50 hectares) 1.07489 0.13979 0.56 0.58 0.83270 1.38750Large-scale (≤ 50 hectares) 1.81786 0.57594 1.89 0.06 0.97603 3.38578
Poorer 0.87203 0.13835 -0.86 0.39 0.63867 1.19067Middle 0.77609 0.12534 -1.57 0.12 0.56523 1.06560Richer 0.70148 0.12593 -1.98 0.05 0.49315 0.99783Richest 0.43850 0.10895 -3.32 0.00 0.26925 0.71414Constant 0.29237 0.10334 -3.48 0.00 0.14609 0.58514
Logistic model for stunted, goodness-of-fit test F(9,774) = 0.98Prob > F = 0.4532
Landarea owned (ref. small scale farmers)
Wealth Index (ref. Poorest)
Owns agriculture land (ref. no land)
Table 2.8a Model II: Logistic regression model for association of access to food and stunting in children 0-23
months, Malawi 2015-16
Odds
Ratio
Lineraized
SE 95% CI
151
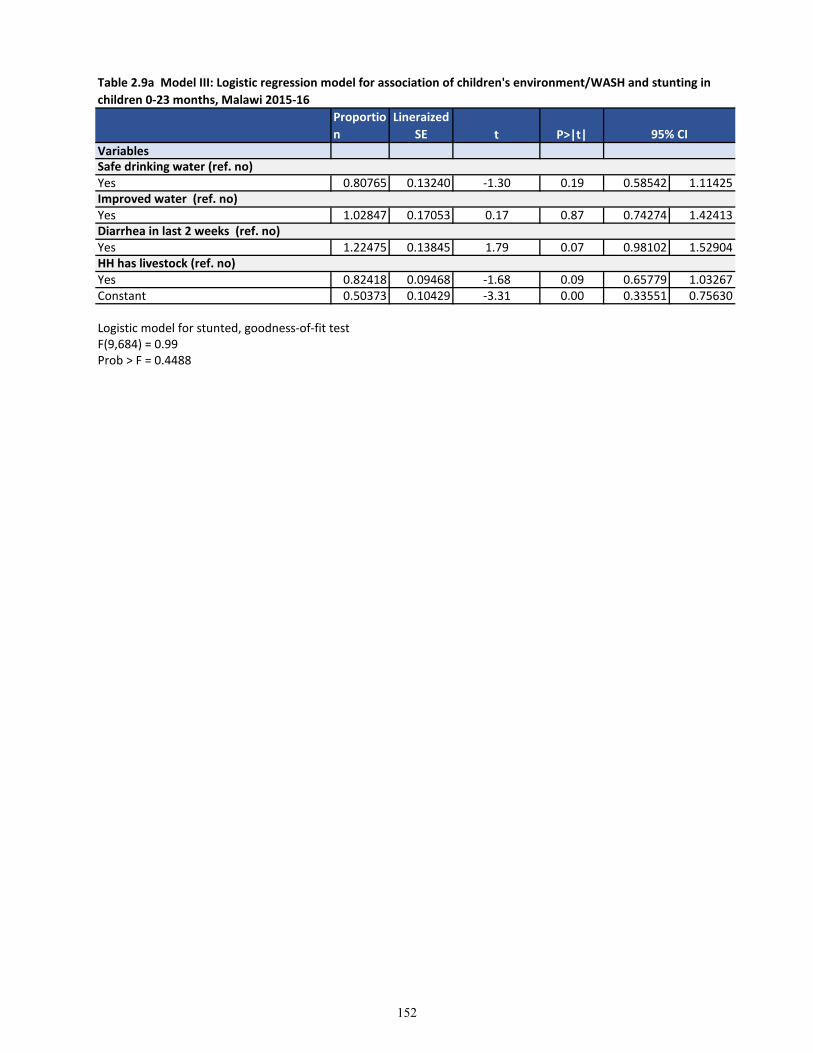
t P>|t|Variables
Yes 0.80765 0.13240 -1.30 0.19 0.58542 1.11425
Yes 1.02847 0.17053 0.17 0.87 0.74274 1.42413
Yes 1.22475 0.13845 1.79 0.07 0.98102 1.52904
Yes 0.82418 0.09468 -1.68 0.09 0.65779 1.03267Constant 0.50373 0.10429 -3.31 0.00 0.33551 0.75630
Logistic model for stunted, goodness-of-fit testF(9,684) = 0.99Prob > F = 0.4488
Improved water (ref. no)
Diarrhea in last 2 weeks (ref. no)
HH has livestock (ref. no)
Safe drinking water (ref. no)
Table 2.9a Model III: Logistic regression model for association of children's environment/WASH and stunting in
children 0-23 months, Malawi 2015-16
Proportio
n
Lineraized
SE 95% CI
152
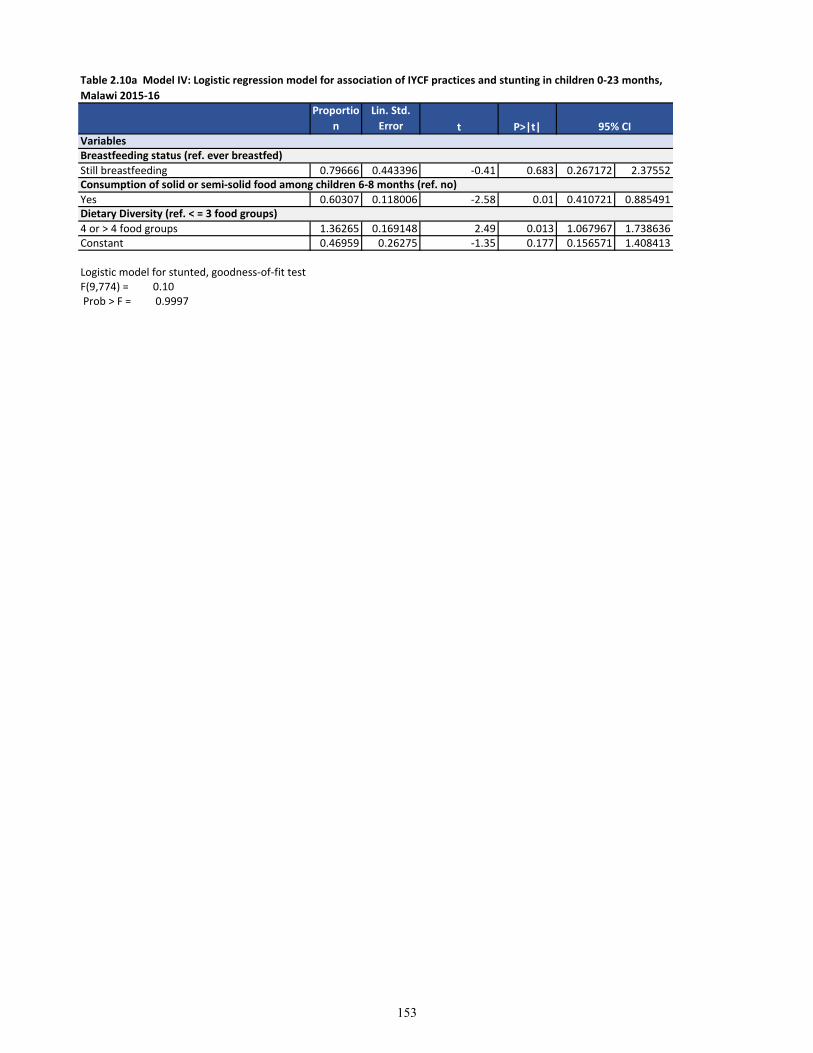
t P>|t|
Still breastfeeding 0.79666 0.443396 -0.41 0.683 0.267172 2.37552
Yes 0.60307 0.118006 -2.58 0.01 0.410721 0.885491
4 or > 4 food groups 1.36265 0.169148 2.49 0.013 1.067967 1.738636Constant 0.46959 0.26275 -1.35 0.177 0.156571 1.408413
Logistic model for stunted, goodness-of-fit testF(9,774) = 0.10 Prob > F = 0.9997
VariablesBreastfeeding status (ref. ever breastfed)
Consumption of solid or semi-solid food among children 6-8 months (ref. no)
Dietary Diversity (ref. < = 3 food groups)
Table 2.10a Model IV: Logistic regression model for association of IYCF practices and stunting in children 0-23 months,
Malawi 2015-16
Proportio
n
Lin. Std.
Error 95% CI
153
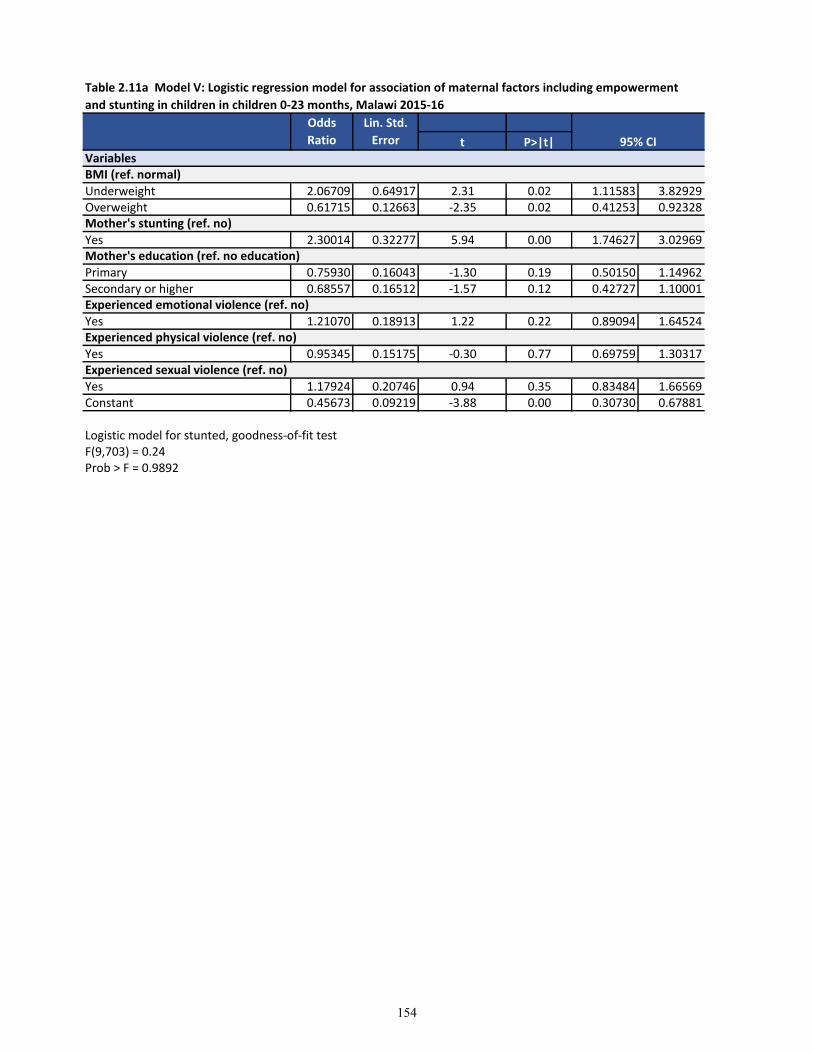
t P>|t|
Underweight 2.06709 0.64917 2.31 0.02 1.11583 3.82929Overweight 0.61715 0.12663 -2.35 0.02 0.41253 0.92328
Yes 2.30014 0.32277 5.94 0.00 1.74627 3.02969
Primary 0.75930 0.16043 -1.30 0.19 0.50150 1.14962Secondary or higher 0.68557 0.16512 -1.57 0.12 0.42727 1.10001
Yes 1.21070 0.18913 1.22 0.22 0.89094 1.64524
Yes 0.95345 0.15175 -0.30 0.77 0.69759 1.30317
Yes 1.17924 0.20746 0.94 0.35 0.83484 1.66569Constant 0.45673 0.09219 -3.88 0.00 0.30730 0.67881
Logistic model for stunted, goodness-of-fit testF(9,703) = 0.24Prob > F = 0.9892
Table 2.11a Model V: Logistic regression model for association of maternal factors including empowerment
and stunting in children in children 0-23 months, Malawi 2015-16
Odds
Ratio
Lin. Std.
Error 95% CI
Experienced sexual violence (ref. no)
VariablesBMI (ref. normal)
Mother's stunting (ref. no)
Mother's education (ref. no education)
Experienced physical violence (ref. no)
Experienced emotional violence (ref. no)
154
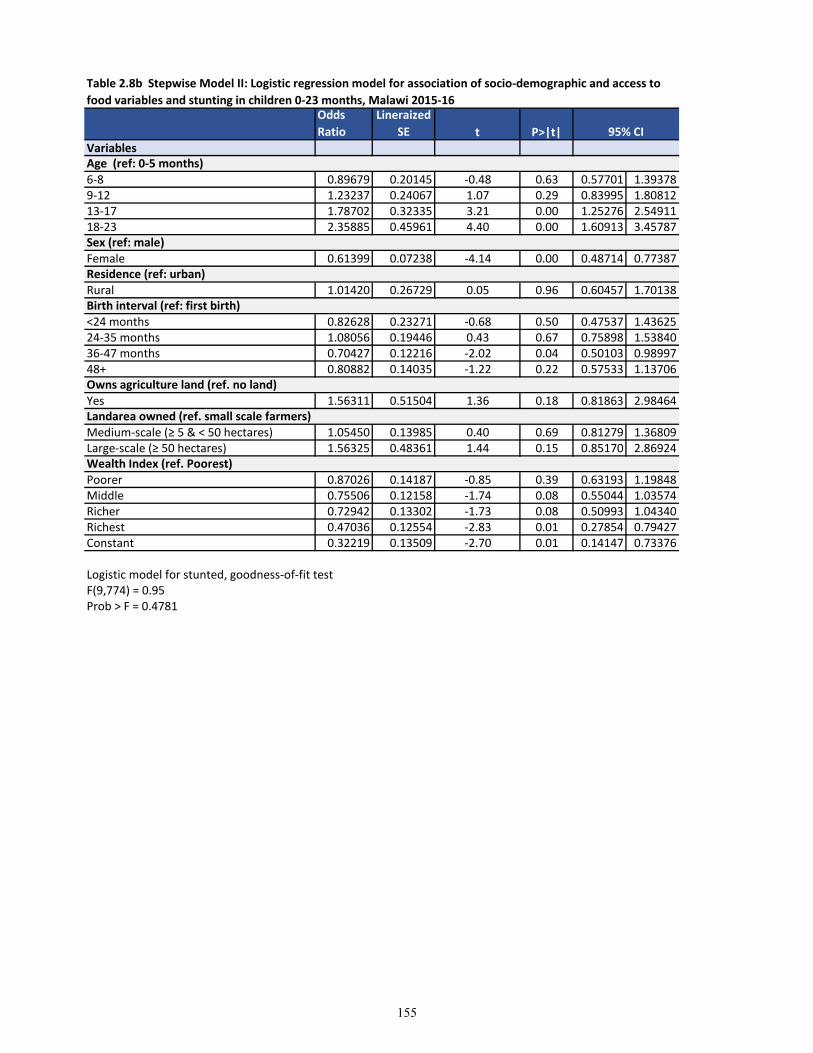
t P>|t|Variables
6-8 0.89679 0.20145 -0.48 0.63 0.57701 1.393789-12 1.23237 0.24067 1.07 0.29 0.83995 1.8081213-17 1.78702 0.32335 3.21 0.00 1.25276 2.5491118-23 2.35885 0.45961 4.40 0.00 1.60913 3.45787
Female 0.61399 0.07238 -4.14 0.00 0.48714 0.77387
Rural 1.01420 0.26729 0.05 0.96 0.60457 1.70138
<24 months 0.82628 0.23271 -0.68 0.50 0.47537 1.4362524-35 months 1.08056 0.19446 0.43 0.67 0.75898 1.5384036-47 months 0.70427 0.12216 -2.02 0.04 0.50103 0.9899748+ 0.80882 0.14035 -1.22 0.22 0.57533 1.13706
Yes 1.56311 0.51504 1.36 0.18 0.81863 2.98464
Medium-scale (≥ 5 & < 50 hectares) 1.05450 0.13985 0.40 0.69 0.81279 1.36809Large-scale (≥ 50 hectares) 1.56325 0.48361 1.44 0.15 0.85170 2.86924
Poorer 0.87026 0.14187 -0.85 0.39 0.63193 1.19848Middle 0.75506 0.12158 -1.74 0.08 0.55044 1.03574Richer 0.72942 0.13302 -1.73 0.08 0.50993 1.04340Richest 0.47036 0.12554 -2.83 0.01 0.27854 0.79427Constant 0.32219 0.13509 -2.70 0.01 0.14147 0.73376
Logistic model for stunted, goodness-of-fit testF(9,774) = 0.95Prob > F = 0.4781
Owns agriculture land (ref. no land)
Landarea owned (ref. small scale farmers)
Wealth Index (ref. Poorest)
Age (ref: 0-5 months)
Sex (ref: male)
Residence (ref: urban)
Birth interval (ref: first birth)
Table 2.8b Stepwise Model II: Logistic regression model for association of socio-demographic and access to
food variables and stunting in children 0-23 months, Malawi 2015-16Odds
Ratio
Lineraized
SE 95% CI
155
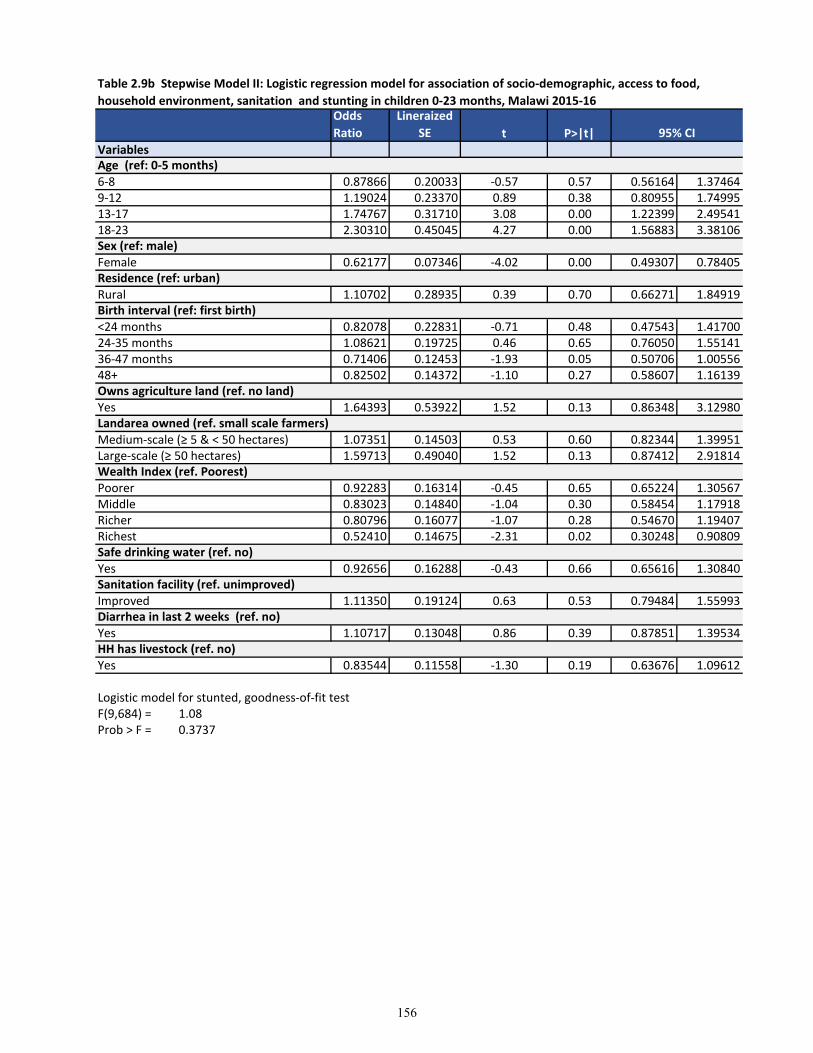
t P>|t|Variables
6-8 0.87866 0.20033 -0.57 0.57 0.56164 1.374649-12 1.19024 0.23370 0.89 0.38 0.80955 1.7499513-17 1.74767 0.31710 3.08 0.00 1.22399 2.4954118-23 2.30310 0.45045 4.27 0.00 1.56883 3.38106
Female 0.62177 0.07346 -4.02 0.00 0.49307 0.78405
Rural 1.10702 0.28935 0.39 0.70 0.66271 1.84919
<24 months 0.82078 0.22831 -0.71 0.48 0.47543 1.4170024-35 months 1.08621 0.19725 0.46 0.65 0.76050 1.5514136-47 months 0.71406 0.12453 -1.93 0.05 0.50706 1.0055648+ 0.82502 0.14372 -1.10 0.27 0.58607 1.16139
Yes 1.64393 0.53922 1.52 0.13 0.86348 3.12980
Medium-scale (≥ 5 & < 50 hectares) 1.07351 0.14503 0.53 0.60 0.82344 1.39951Large-scale (≥ 50 hectares) 1.59713 0.49040 1.52 0.13 0.87412 2.91814
Poorer 0.92283 0.16314 -0.45 0.65 0.65224 1.30567Middle 0.83023 0.14840 -1.04 0.30 0.58454 1.17918Richer 0.80796 0.16077 -1.07 0.28 0.54670 1.19407Richest 0.52410 0.14675 -2.31 0.02 0.30248 0.90809
Yes 0.92656 0.16288 -0.43 0.66 0.65616 1.30840
Improved 1.11350 0.19124 0.63 0.53 0.79484 1.55993
Yes 1.10717 0.13048 0.86 0.39 0.87851 1.39534
Yes 0.83544 0.11558 -1.30 0.19 0.63676 1.09612
Logistic model for stunted, goodness-of-fit testF(9,684) = 1.08Prob > F = 0.3737
Sanitation facility (ref. unimproved)
Diarrhea in last 2 weeks (ref. no)
HH has livestock (ref. no)
Safe drinking water (ref. no)
Owns agriculture land (ref. no land)
Landarea owned (ref. small scale farmers)
Wealth Index (ref. Poorest)
Age (ref: 0-5 months)
Sex (ref: male)
Residence (ref: urban)
Birth interval (ref: first birth)
Table 2.9b Stepwise Model II: Logistic regression model for association of socio-demographic, access to food,
household environment, sanitation and stunting in children 0-23 months, Malawi 2015-16Odds
Ratio
Lineraized
SE 95% CI
156
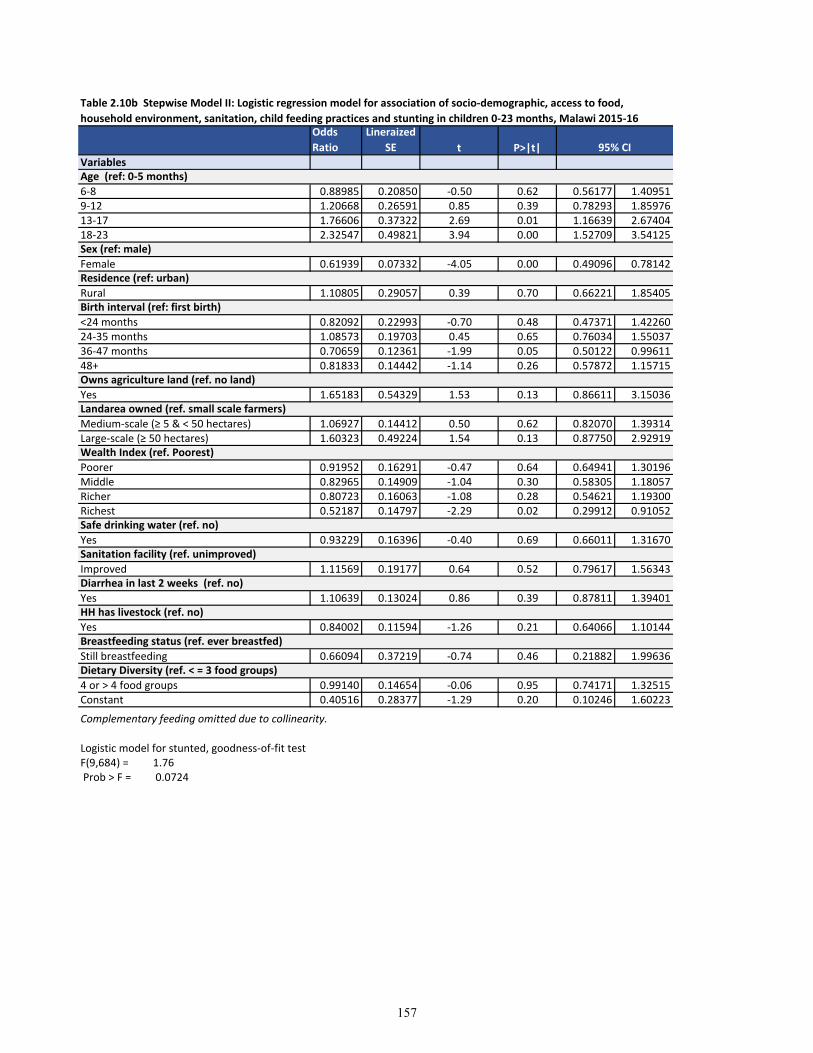
t P>|t|Variables
6-8 0.88985 0.20850 -0.50 0.62 0.56177 1.409519-12 1.20668 0.26591 0.85 0.39 0.78293 1.8597613-17 1.76606 0.37322 2.69 0.01 1.16639 2.6740418-23 2.32547 0.49821 3.94 0.00 1.52709 3.54125
Female 0.61939 0.07332 -4.05 0.00 0.49096 0.78142
Rural 1.10805 0.29057 0.39 0.70 0.66221 1.85405
<24 months 0.82092 0.22993 -0.70 0.48 0.47371 1.4226024-35 months 1.08573 0.19703 0.45 0.65 0.76034 1.5503736-47 months 0.70659 0.12361 -1.99 0.05 0.50122 0.9961148+ 0.81833 0.14442 -1.14 0.26 0.57872 1.15715
Yes 1.65183 0.54329 1.53 0.13 0.86611 3.15036
Medium-scale (≥ 5 & < 50 hectares) 1.06927 0.14412 0.50 0.62 0.82070 1.39314Large-scale (≥ 50 hectares) 1.60323 0.49224 1.54 0.13 0.87750 2.92919
Poorer 0.91952 0.16291 -0.47 0.64 0.64941 1.30196Middle 0.82965 0.14909 -1.04 0.30 0.58305 1.18057Richer 0.80723 0.16063 -1.08 0.28 0.54621 1.19300Richest 0.52187 0.14797 -2.29 0.02 0.29912 0.91052
Yes 0.93229 0.16396 -0.40 0.69 0.66011 1.31670
Improved 1.11569 0.19177 0.64 0.52 0.79617 1.56343
Yes 1.10639 0.13024 0.86 0.39 0.87811 1.39401
Yes 0.84002 0.11594 -1.26 0.21 0.64066 1.10144
Still breastfeeding 0.66094 0.37219 -0.74 0.46 0.21882 1.99636
4 or > 4 food groups 0.99140 0.14654 -0.06 0.95 0.74171 1.32515Constant 0.40516 0.28377 -1.29 0.20 0.10246 1.60223
Logistic model for stunted, goodness-of-fit testF(9,684) = 1.76 Prob > F = 0.0724
Dietary Diversity (ref. < = 3 food groups)
Complementary feeding omitted due to collinearity.
Breastfeeding status (ref. ever breastfed)
Sanitation facility (ref. unimproved)
Diarrhea in last 2 weeks (ref. no)
HH has livestock (ref. no)
Safe drinking water (ref. no)
Owns agriculture land (ref. no land)
Landarea owned (ref. small scale farmers)
Wealth Index (ref. Poorest)
Age (ref: 0-5 months)
Sex (ref: male)
Residence (ref: urban)
Birth interval (ref: first birth)
Table 2.10b Stepwise Model II: Logistic regression model for association of socio-demographic, access to food,
household environment, sanitation, child feeding practices and stunting in children 0-23 months, Malawi 2015-16Odds
Ratio
Lineraized
SE 95% CI
157
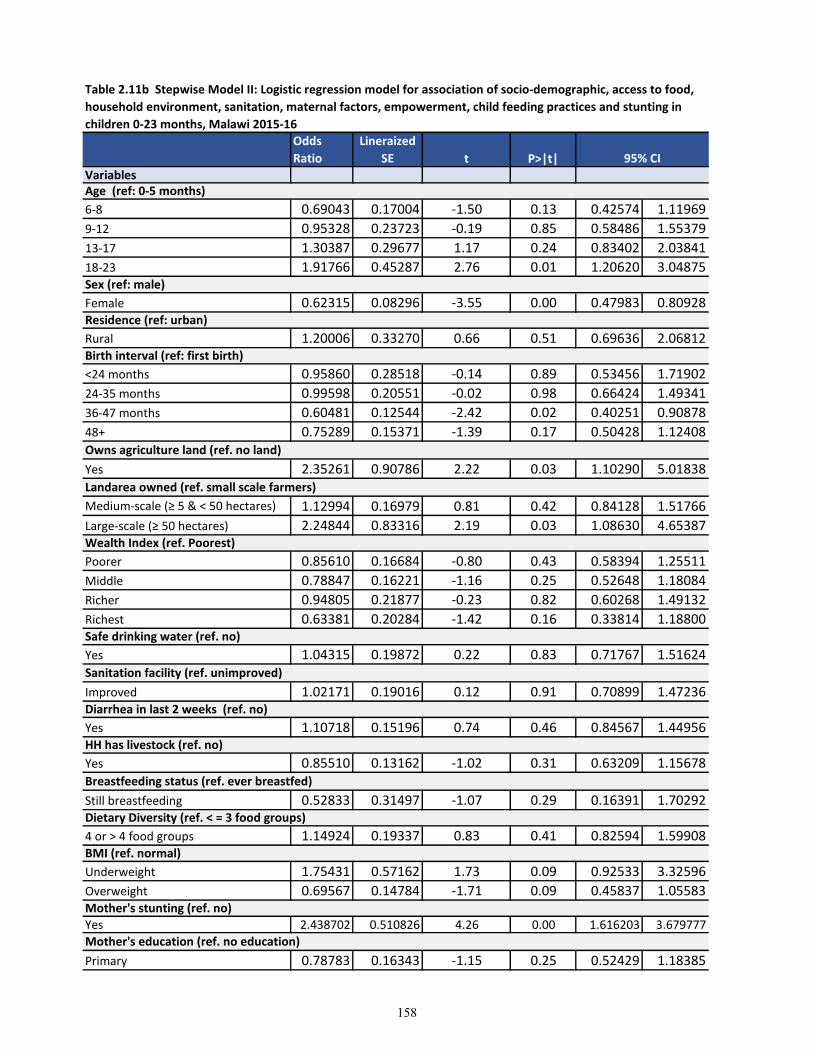
t P>|t|Variables
6-8 0.69043 0.17004 -1.50 0.13 0.42574 1.11969
9-12 0.95328 0.23723 -0.19 0.85 0.58486 1.55379
13-17 1.30387 0.29677 1.17 0.24 0.83402 2.03841
18-23 1.91766 0.45287 2.76 0.01 1.20620 3.04875
Female 0.62315 0.08296 -3.55 0.00 0.47983 0.80928
Rural 1.20006 0.33270 0.66 0.51 0.69636 2.06812
<24 months 0.95860 0.28518 -0.14 0.89 0.53456 1.71902
24-35 months 0.99598 0.20551 -0.02 0.98 0.66424 1.49341
36-47 months 0.60481 0.12544 -2.42 0.02 0.40251 0.90878
48+ 0.75289 0.15371 -1.39 0.17 0.50428 1.12408
Yes 2.35261 0.90786 2.22 0.03 1.10290 5.01838
Medium-scale (≥ 5 & < 50 hectares) 1.12994 0.16979 0.81 0.42 0.84128 1.51766
Large-scale (≥ 50 hectares) 2.24844 0.83316 2.19 0.03 1.08630 4.65387
Poorer 0.85610 0.16684 -0.80 0.43 0.58394 1.25511
Middle 0.78847 0.16221 -1.16 0.25 0.52648 1.18084
Richer 0.94805 0.21877 -0.23 0.82 0.60268 1.49132
Richest 0.63381 0.20284 -1.42 0.16 0.33814 1.18800
Yes 1.04315 0.19872 0.22 0.83 0.71767 1.51624
Improved 1.02171 0.19016 0.12 0.91 0.70899 1.47236
Yes 1.10718 0.15196 0.74 0.46 0.84567 1.44956
Yes 0.85510 0.13162 -1.02 0.31 0.63209 1.15678
Still breastfeeding 0.52833 0.31497 -1.07 0.29 0.16391 1.70292
4 or > 4 food groups 1.14924 0.19337 0.83 0.41 0.82594 1.59908
Underweight 1.75431 0.57162 1.73 0.09 0.92533 3.32596
Overweight 0.69567 0.14784 -1.71 0.09 0.45837 1.05583
Yes 2.438702 0.510826 4.26 0.00 1.616203 3.679777
Primary 0.78783 0.16343 -1.15 0.25 0.52429 1.18385
BMI (ref. normal)
Mother's stunting (ref. no)
Mother's education (ref. no education)
Dietary Diversity (ref. < = 3 food groups)
HH has livestock (ref. no)
Breastfeeding status (ref. ever breastfed)
Safe drinking water (ref. no)
Sanitation facility (ref. unimproved)
Diarrhea in last 2 weeks (ref. no)
Landarea owned (ref. small scale farmers)
Wealth Index (ref. Poorest)
Sex (ref: male)
Residence (ref: urban)
Birth interval (ref: first birth)
Owns agriculture land (ref. no land)
Age (ref: 0-5 months)
Table 2.11b Stepwise Model II: Logistic regression model for association of socio-demographic, access to food,
household environment, sanitation, maternal factors, empowerment, child feeding practices and stunting in
children 0-23 months, Malawi 2015-16
Odds
Ratio
Lineraized
SE 95% CI
158
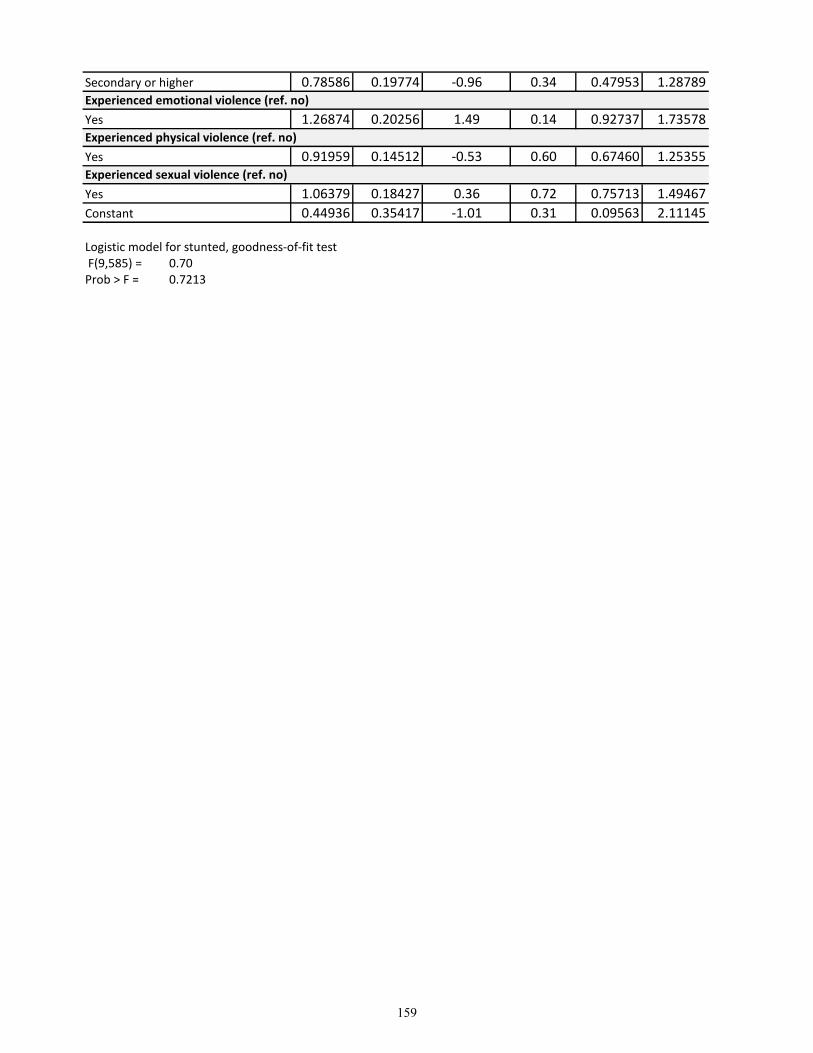
Secondary or higher 0.78586 0.19774 -0.96 0.34 0.47953 1.28789
Yes 1.26874 0.20256 1.49 0.14 0.92737 1.73578
Yes 0.91959 0.14512 -0.53 0.60 0.67460 1.25355
Yes 1.06379 0.18427 0.36 0.72 0.75713 1.49467
Constant 0.44936 0.35417 -1.01 0.31 0.09563 2.11145
Logistic model for stunted, goodness-of-fit test F(9,585) = 0.70Prob > F = 0.7213
Experienced sexual violence (ref. no)
Experienced emotional violence (ref. no)
Experienced physical violence (ref. no)
159
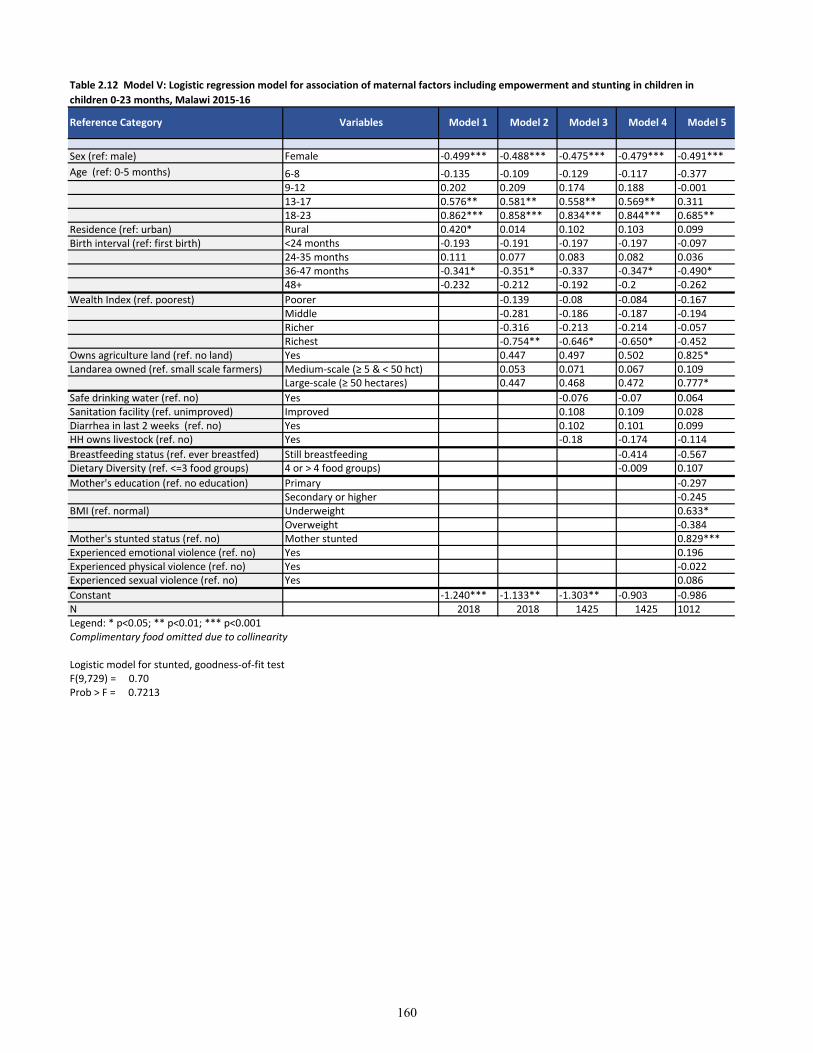
Sex (ref: male) Female -0.499*** -0.488*** -0.475*** -0.479*** -0.491***
Age (ref: 0-5 months) 6-8 -0.135 -0.109 -0.129 -0.117 -0.3779-12 0.202 0.209 0.174 0.188 -0.00113-17 0.576** 0.581** 0.558** 0.569** 0.31118-23 0.862*** 0.858*** 0.834*** 0.844*** 0.685**
Residence (ref: urban) Rural 0.420* 0.014 0.102 0.103 0.099Birth interval (ref: first birth) <24 months -0.193 -0.191 -0.197 -0.197 -0.097
24-35 months 0.111 0.077 0.083 0.082 0.03636-47 months -0.341* -0.351* -0.337 -0.347* -0.490*48+ -0.232 -0.212 -0.192 -0.2 -0.262
Wealth Index (ref. poorest) Poorer -0.139 -0.08 -0.084 -0.167Middle -0.281 -0.186 -0.187 -0.194Richer -0.316 -0.213 -0.214 -0.057Richest -0.754** -0.646* -0.650* -0.452
Owns agriculture land (ref. no land) Yes 0.447 0.497 0.502 0.825*Landarea owned (ref. small scale farmers) Medium-scale (≥ 5 & < 50 hct) 0.053 0.071 0.067 0.109
Large-scale (≥ 50 hectares) 0.447 0.468 0.472 0.777*
Safe drinking water (ref. no) Yes -0.076 -0.07 0.064Sanitation facility (ref. unimproved) Improved 0.108 0.109 0.028Diarrhea in last 2 weeks (ref. no) Yes 0.102 0.101 0.099HH owns livestock (ref. no) Yes -0.18 -0.174 -0.114
Breastfeeding status (ref. ever breastfed) Still breastfeeding -0.414 -0.567Dietary Diversity (ref. <=3 food groups) 4 or > 4 food groups) -0.009 0.107
Mother's education (ref. no education) Primary -0.297Secondary or higher -0.245
BMI (ref. normal) Underweight 0.633*Overweight -0.384
Mother's stunted status (ref. no) Mother stunted 0.829***Experienced emotional violence (ref. no) Yes 0.196Experienced physical violence (ref. no) Yes -0.022Experienced sexual violence (ref. no) Yes 0.086
Constant -1.240*** -1.133** -1.303** -0.903 -0.986N 2018 2018 1425 1425 1012Legend: * p<0.05; ** p<0.01; *** p<0.001Complimentary food omitted due to collinearity
Logistic model for stunted, goodness-of-fit testF(9,729) = 0.70Prob > F = 0.7213
Table 2.12 Model V: Logistic regression model for association of maternal factors including empowerment and stunting in children in
children 0-23 months, Malawi 2015-16
Reference Category Variables Model 1 Model 2 Model 3 Model 4 Model 5
160
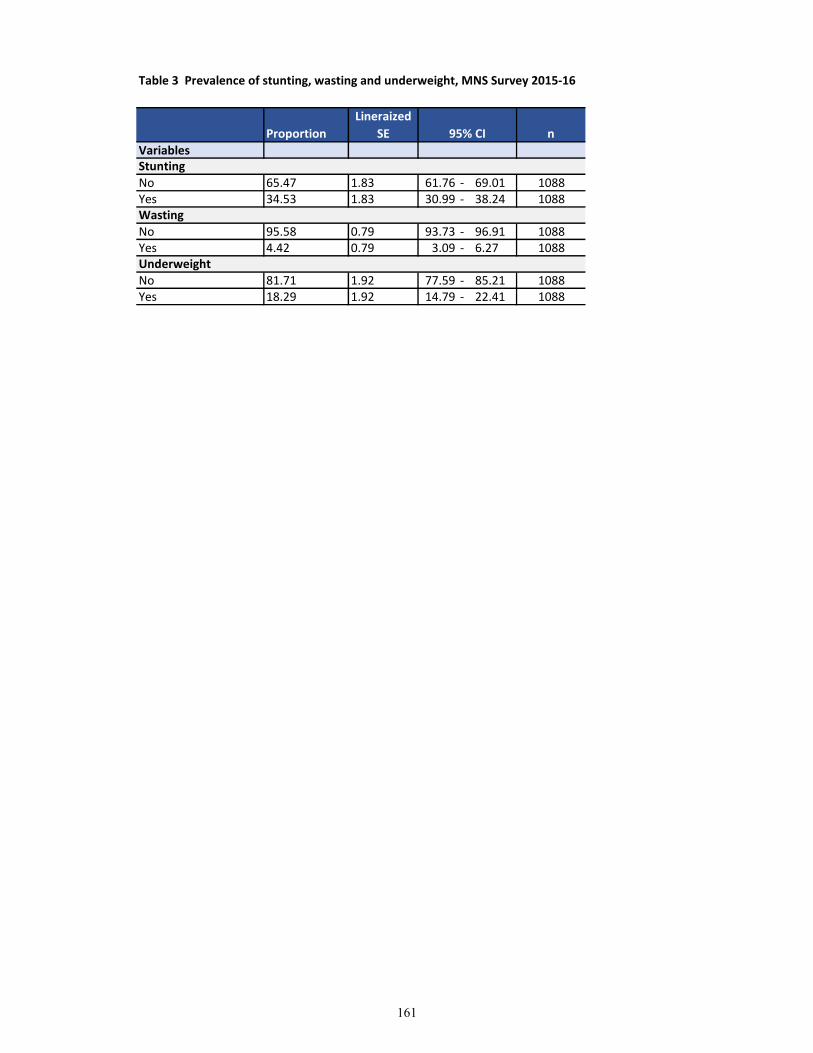
Table 3 Prevalence of stunting, wasting and underweight, MNS Survey 2015-16
Variables
No 65.47 1.83 61.76 - 69.01 1088Yes 34.53 1.83 30.99 - 38.24 1088
No 95.58 0.79 93.73 - 96.91 1088Yes 4.42 0.79 3.09 - 6.27 1088
No 81.71 1.92 77.59 - 85.21 1088Yes 18.29 1.92 14.79 - 22.41 1088
n
Stunting
Wasting
Underweight
Proportion
Lineraized
SE 95% CI
161
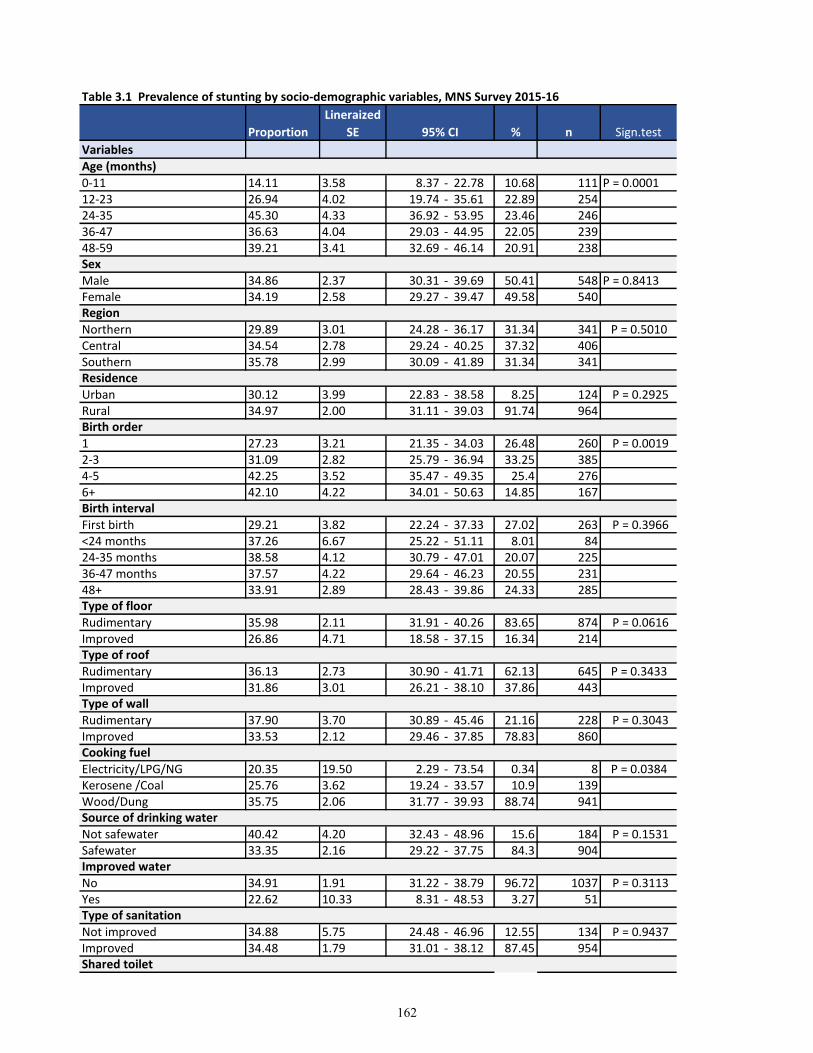
Table 3.1 Prevalence of stunting by socio-demographic variables, MNS Survey 2015-16
Variables
0-11 14.11 3.58 8.37 - 22.78 10.68 111 P = 0.000112-23 26.94 4.02 19.74 - 35.61 22.89 25424-35 45.30 4.33 36.92 - 53.95 23.46 24636-47 36.63 4.04 29.03 - 44.95 22.05 23948-59 39.21 3.41 32.69 - 46.14 20.91 238
Male 34.86 2.37 30.31 - 39.69 50.41 548 P = 0.8413Female 34.19 2.58 29.27 - 39.47 49.58 540
Northern 29.89 3.01 24.28 - 36.17 31.34 341 P = 0.5010Central 34.54 2.78 29.24 - 40.25 37.32 406Southern 35.78 2.99 30.09 - 41.89 31.34 341
Urban 30.12 3.99 22.83 - 38.58 8.25 124 P = 0.2925Rural 34.97 2.00 31.11 - 39.03 91.74 964
1 27.23 3.21 21.35 - 34.03 26.48 260 P = 0.00192-3 31.09 2.82 25.79 - 36.94 33.25 3854-5 42.25 3.52 35.47 - 49.35 25.4 2766+ 42.10 4.22 34.01 - 50.63 14.85 167
First birth 29.21 3.82 22.24 - 37.33 27.02 263 P = 0.3966<24 months 37.26 6.67 25.22 - 51.11 8.01 8424-35 months 38.58 4.12 30.79 - 47.01 20.07 22536-47 months 37.57 4.22 29.64 - 46.23 20.55 23148+ 33.91 2.89 28.43 - 39.86 24.33 285
Rudimentary 35.98 2.11 31.91 - 40.26 83.65 874 P = 0.0616Improved 26.86 4.71 18.58 - 37.15 16.34 214
Rudimentary 36.13 2.73 30.90 - 41.71 62.13 645 P = 0.3433Improved 31.86 3.01 26.21 - 38.10 37.86 443
Rudimentary 37.90 3.70 30.89 - 45.46 21.16 228 P = 0.3043Improved 33.53 2.12 29.46 - 37.85 78.83 860
Electricity/LPG/NG 20.35 19.50 2.29 - 73.54 0.34 8 P = 0.0384Kerosene /Coal 25.76 3.62 19.24 - 33.57 10.9 139Wood/Dung 35.75 2.06 31.77 - 39.93 88.74 941
Not safewater 40.42 4.20 32.43 - 48.96 15.6 184 P = 0.1531Safewater 33.35 2.16 29.22 - 37.75 84.3 904
No 34.91 1.91 31.22 - 38.79 96.72 1037 P = 0.3113Yes 22.62 10.33 8.31 - 48.53 3.27 51
Not improved 34.88 5.75 24.48 - 46.96 12.55 134 P = 0.9437Improved 34.48 1.79 31.01 - 38.12 87.45 954
Birth interval
Type of floor
Type of roof
Birth order
Proportion
Lineraized
SE 95% CI % n Sign.test
Age (months)
Sex
Region
Residence
Type of wall
Cooking fuel
Improved water
Type of sanitation
Shared toilet
Source of drinking water
162
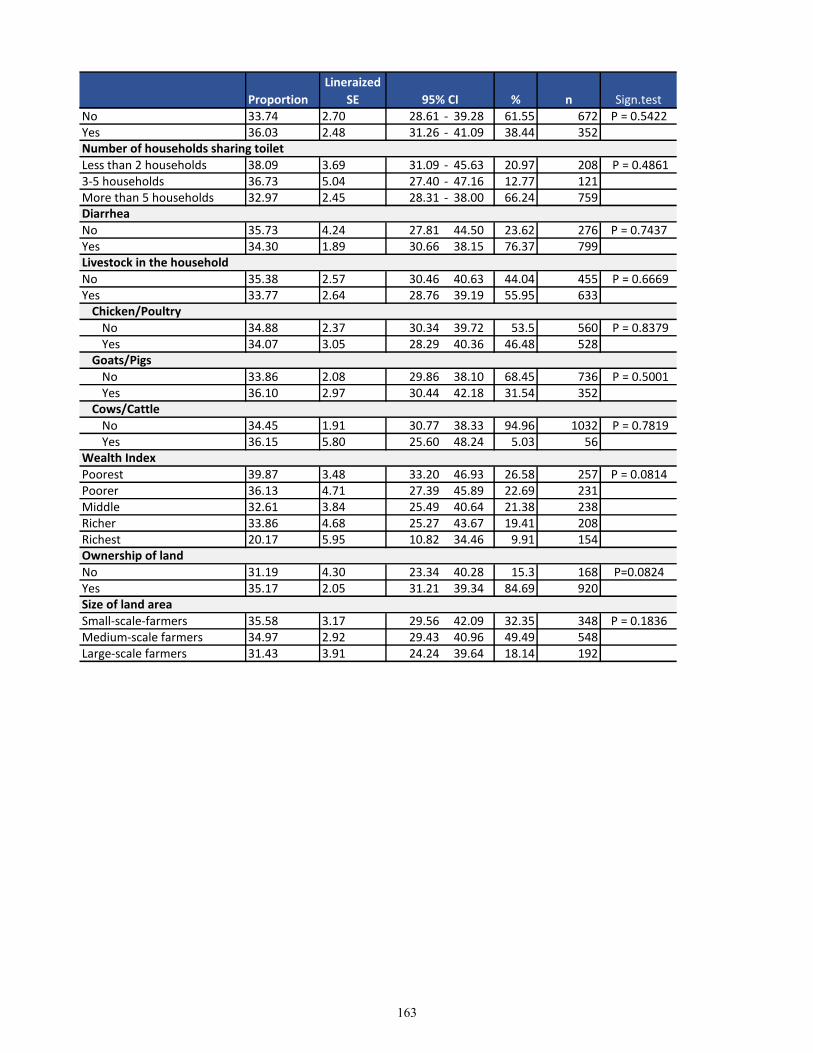
Proportion
Lineraized
SE 95% CI % n Sign.test
No 33.74 2.70 28.61 - 39.28 61.55 672 P = 0.5422Yes 36.03 2.48 31.26 - 41.09 38.44 352
Less than 2 households 38.09 3.69 31.09 - 45.63 20.97 208 P = 0.48613-5 households 36.73 5.04 27.40 - 47.16 12.77 121More than 5 households 32.97 2.45 28.31 - 38.00 66.24 759
No 35.73 4.24 27.81 44.50 23.62 276 P = 0.7437Yes 34.30 1.89 30.66 38.15 76.37 799
No 35.38 2.57 30.46 40.63 44.04 455 P = 0.6669Yes 33.77 2.64 28.76 39.19 55.95 633
No 34.88 2.37 30.34 39.72 53.5 560 P = 0.8379Yes 34.07 3.05 28.29 40.36 46.48 528
No 33.86 2.08 29.86 38.10 68.45 736 P = 0.5001Yes 36.10 2.97 30.44 42.18 31.54 352
No 34.45 1.91 30.77 38.33 94.96 1032 P = 0.7819Yes 36.15 5.80 25.60 48.24 5.03 56
Poorest 39.87 3.48 33.20 46.93 26.58 257 P = 0.0814Poorer 36.13 4.71 27.39 45.89 22.69 231Middle 32.61 3.84 25.49 40.64 21.38 238Richer 33.86 4.68 25.27 43.67 19.41 208Richest 20.17 5.95 10.82 34.46 9.91 154
No 31.19 4.30 23.34 40.28 15.3 168 P=0.0824Yes 35.17 2.05 31.21 39.34 84.69 920
Small-scale-farmers 35.58 3.17 29.56 42.09 32.35 348 P = 0.1836Medium-scale farmers 34.97 2.92 29.43 40.96 49.49 548Large-scale farmers 31.43 3.91 24.24 39.64 18.14 192
Size of land area
Number of households sharing toilet
Diarrhea
Livestock in the household
Chicken/Poultry
Goats/Pigs
Cows/Cattle
Wealth Index
Ownership of land
163
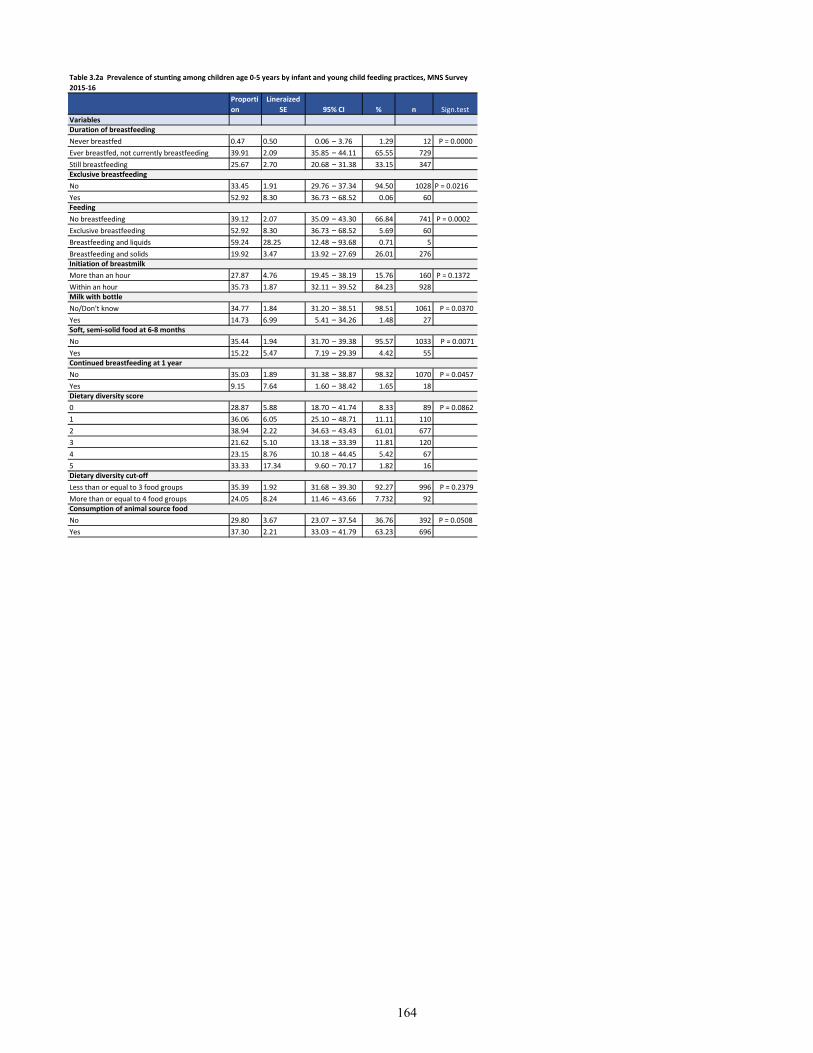
Variables
Never breastfed 0.47 0.50 0.06 – 3.76 1.29 12 P = 0.0000
Ever breastfed, not currently breastfeeding 39.91 2.09 35.85 – 44.11 65.55 729
Still breastfeeding 25.67 2.70 20.68 – 31.38 33.15 347
No 33.45 1.91 29.76 – 37.34 94.50 1028 P = 0.0216
Yes 52.92 8.30 36.73 – 68.52 0.06 60
No breastfeeding 39.12 2.07 35.09 – 43.30 66.84 741 P = 0.0002
Exclusive breastfeeding 52.92 8.30 36.73 – 68.52 5.69 60
Breastfeeding and liquids 59.24 28.25 12.48 – 93.68 0.71 5
Breastfeeding and solids 19.92 3.47 13.92 – 27.69 26.01 276
More than an hour 27.87 4.76 19.45 – 38.19 15.76 160 P = 0.1372
Within an hour 35.73 1.87 32.11 – 39.52 84.23 928
No/Don't know 34.77 1.84 31.20 – 38.51 98.51 1061 P = 0.0370
Yes 14.73 6.99 5.41 – 34.26 1.48 27
No 35.44 1.94 31.70 – 39.38 95.57 1033 P = 0.0071
Yes 15.22 5.47 7.19 – 29.39 4.42 55
No 35.03 1.89 31.38 – 38.87 98.32 1070 P = 0.0457
Yes 9.15 7.64 1.60 – 38.42 1.65 18
0 28.87 5.88 18.70 – 41.74 8.33 89 P = 0.0862
1 36.06 6.05 25.10 – 48.71 11.11 110
2 38.94 2.22 34.63 – 43.43 61.01 677
3 21.62 5.10 13.18 – 33.39 11.81 120
4 23.15 8.76 10.18 – 44.45 5.42 67
5 33.33 17.34 9.60 – 70.17 1.82 16
Less than or equal to 3 food groups 35.39 1.92 31.68 – 39.30 92.27 996 P = 0.2379
More than or equal to 4 food groups 24.05 8.24 11.46 – 43.66 7.732 92
No 29.80 3.67 23.07 – 37.54 36.76 392 P = 0.0508
Yes 37.30 2.21 33.03 – 41.79 63.23 696
Table 3.2a Prevalence of stunting among children age 0-5 years by infant and young child feeding practices, MNS Survey
2015-16
Proporti
on
Lineraized
SE 95% CI % n Sign.test
Duration of breastfeeding
Exclusive breastfeeding
Feeding
Initiation of breastmilk
Milk with bottle
Soft, semi-solid food at 6-8 months
Consumption of animal source food
Continued breastfeeding at 1 year
Dietary diversity score
Dietary diversity cut-off
164
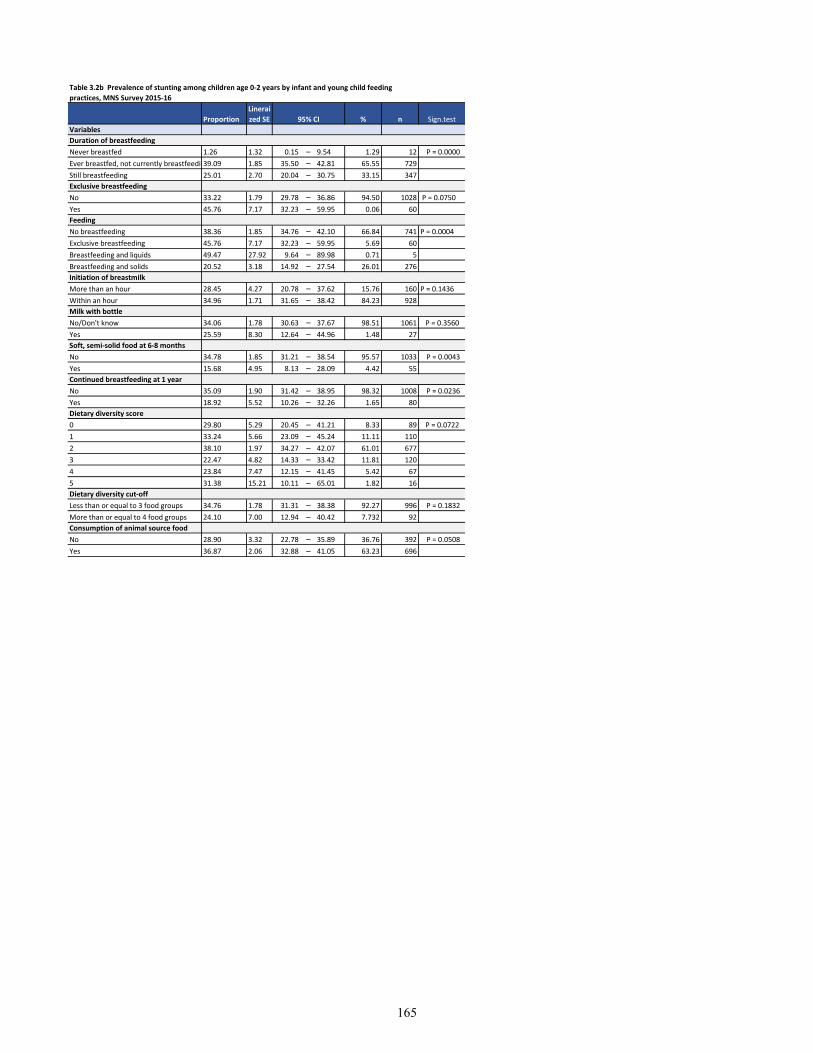
Variables
Duration of breastfeeding
Never breastfed 1.26 1.32 0.15 – 9.54 1.29 12 P = 0.0000
Ever breastfed, not currently breastfeeding39.09 1.85 35.50 – 42.81 65.55 729
Still breastfeeding 25.01 2.70 20.04 – 30.75 33.15 347
Exclusive breastfeeding
No 33.22 1.79 29.78 – 36.86 94.50 1028 P = 0.0750
Yes 45.76 7.17 32.23 – 59.95 0.06 60
Feeding
No breastfeeding 38.36 1.85 34.76 – 42.10 66.84 741 P = 0.0004
Exclusive breastfeeding 45.76 7.17 32.23 – 59.95 5.69 60
Breastfeeding and liquids 49.47 27.92 9.64 – 89.98 0.71 5
Breastfeeding and solids 20.52 3.18 14.92 – 27.54 26.01 276
Initiation of breastmilk
More than an hour 28.45 4.27 20.78 – 37.62 15.76 160 P = 0.1436
Within an hour 34.96 1.71 31.65 – 38.42 84.23 928
Milk with bottle
No/Don't know 34.06 1.78 30.63 – 37.67 98.51 1061 P = 0.3560
Yes 25.59 8.30 12.64 – 44.96 1.48 27
Soft, semi-solid food at 6-8 months
No 34.78 1.85 31.21 – 38.54 95.57 1033 P = 0.0043
Yes 15.68 4.95 8.13 – 28.09 4.42 55
Continued breastfeeding at 1 year
No 35.09 1.90 31.42 – 38.95 98.32 1008 P = 0.0236
Yes 18.92 5.52 10.26 – 32.26 1.65 80
Dietary diversity score
0 29.80 5.29 20.45 – 41.21 8.33 89 P = 0.0722
1 33.24 5.66 23.09 – 45.24 11.11 110
2 38.10 1.97 34.27 – 42.07 61.01 677
3 22.47 4.82 14.33 – 33.42 11.81 120
4 23.84 7.47 12.15 – 41.45 5.42 67
5 31.38 15.21 10.11 – 65.01 1.82 16
Dietary diversity cut-off
Less than or equal to 3 food groups 34.76 1.78 31.31 – 38.38 92.27 996 P = 0.1832
More than or equal to 4 food groups 24.10 7.00 12.94 – 40.42 7.732 92
Consumption of animal source food
No 28.90 3.32 22.78 – 35.89 36.76 392 P = 0.0508
Yes 36.87 2.06 32.88 – 41.05 63.23 696
Table 3.2b Prevalence of stunting among children age 0-2 years by infant and young child feeding
practices, MNS Survey 2015-16
Proportion
Linerai
zed SE 95% CI % n Sign.test
165
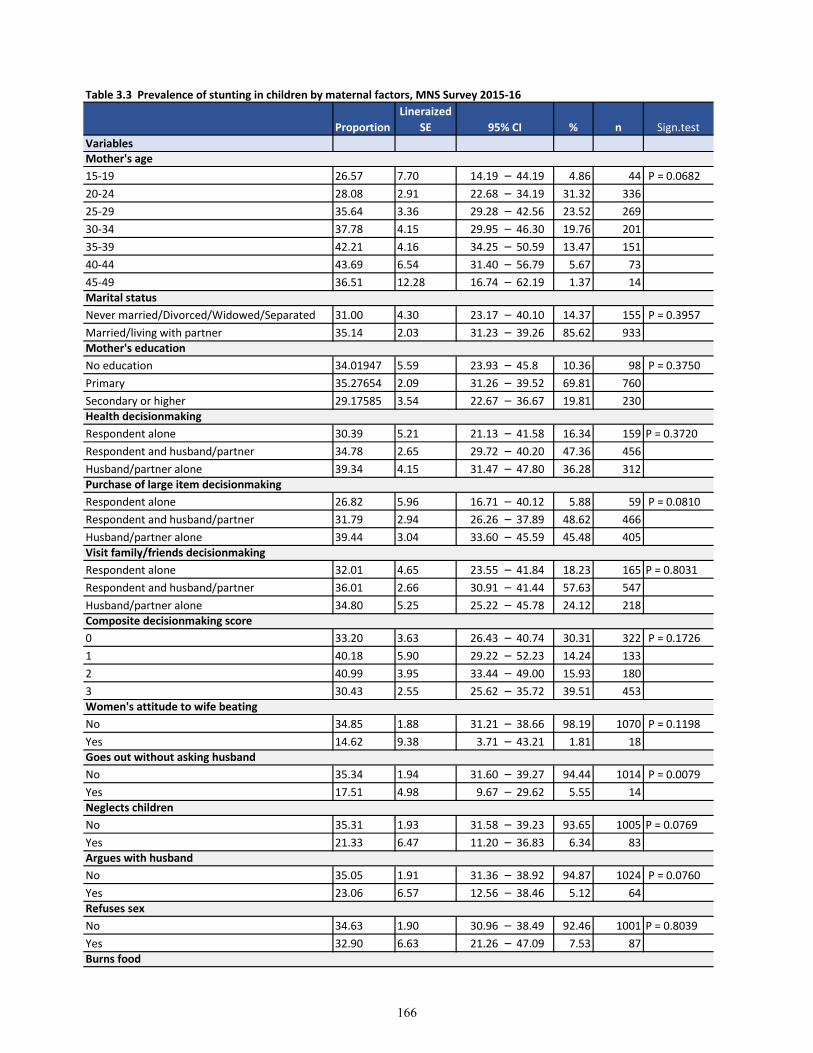
Table 3.3 Prevalence of stunting in children by maternal factors, MNS Survey 2015-16
Variables
15-19 26.57 7.70 14.19 – 44.19 4.86 44 P = 0.0682
20-24 28.08 2.91 22.68 – 34.19 31.32 336
25-29 35.64 3.36 29.28 – 42.56 23.52 269
30-34 37.78 4.15 29.95 – 46.30 19.76 201
35-39 42.21 4.16 34.25 – 50.59 13.47 151
40-44 43.69 6.54 31.40 – 56.79 5.67 73
45-49 36.51 12.28 16.74 – 62.19 1.37 14
Never married/Divorced/Widowed/Separated 31.00 4.30 23.17 – 40.10 14.37 155 P = 0.3957
Married/living with partner 35.14 2.03 31.23 – 39.26 85.62 933
No education 34.01947 5.59 23.93 – 45.8 10.36 98 P = 0.3750
Primary 35.27654 2.09 31.26 – 39.52 69.81 760
Secondary or higher 29.17585 3.54 22.67 – 36.67 19.81 230
Respondent alone 30.39 5.21 21.13 – 41.58 16.34 159 P = 0.3720
Respondent and husband/partner 34.78 2.65 29.72 – 40.20 47.36 456
Husband/partner alone 39.34 4.15 31.47 – 47.80 36.28 312
Respondent alone 26.82 5.96 16.71 – 40.12 5.88 59 P = 0.0810
Respondent and husband/partner 31.79 2.94 26.26 – 37.89 48.62 466
Husband/partner alone 39.44 3.04 33.60 – 45.59 45.48 405
Respondent alone 32.01 4.65 23.55 – 41.84 18.23 165 P = 0.8031
Respondent and husband/partner 36.01 2.66 30.91 – 41.44 57.63 547
Husband/partner alone 34.80 5.25 25.22 – 45.78 24.12 218
0 33.20 3.63 26.43 – 40.74 30.31 322 P = 0.1726
1 40.18 5.90 29.22 – 52.23 14.24 133
2 40.99 3.95 33.44 – 49.00 15.93 180
3 30.43 2.55 25.62 – 35.72 39.51 453
No 34.85 1.88 31.21 – 38.66 98.19 1070 P = 0.1198
Yes 14.62 9.38 3.71 – 43.21 1.81 18
No 35.34 1.94 31.60 – 39.27 94.44 1014 P = 0.0079
Yes 17.51 4.98 9.67 – 29.62 5.55 14
No 35.31 1.93 31.58 – 39.23 93.65 1005 P = 0.0769
Yes 21.33 6.47 11.20 – 36.83 6.34 83
No 35.05 1.91 31.36 – 38.92 94.87 1024 P = 0.0760
Yes 23.06 6.57 12.56 – 38.46 5.12 64
No 34.63 1.90 30.96 – 38.49 92.46 1001 P = 0.8039
Yes 32.90 6.63 21.26 – 47.09 7.53 87
Purchase of large item decisionmaking
Proportion
Lineraized
SE 95% CI % n Sign.test
Mother's age
Marital status
Mother's education
Health decisionmaking
Refuses sex
Burns food
Visit family/friends decisionmaking
Composite decisionmaking score
Women's attitude to wife beating
Goes out without asking husband
Neglects children
Argues with husband
166
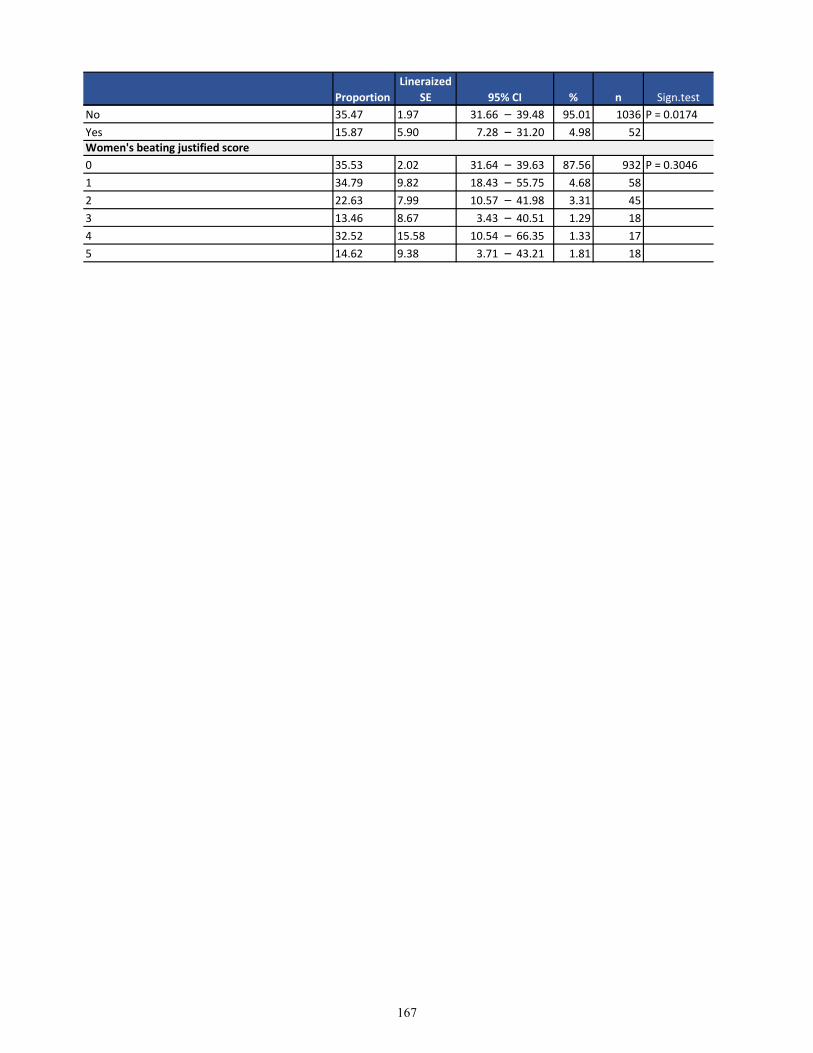
Proportion
Lineraized
SE 95% CI % n Sign.test
No 35.47 1.97 31.66 – 39.48 95.01 1036 P = 0.0174
Yes 15.87 5.90 7.28 – 31.20 4.98 52
0 35.53 2.02 31.64 – 39.63 87.56 932 P = 0.3046
1 34.79 9.82 18.43 – 55.75 4.68 58
2 22.63 7.99 10.57 – 41.98 3.31 45
3 13.46 8.67 3.43 – 40.51 1.29 18
4 32.52 15.58 10.54 – 66.35 1.33 17
5 14.62 9.38 3.71 – 43.21 1.81 18
Women's beating justified score
167
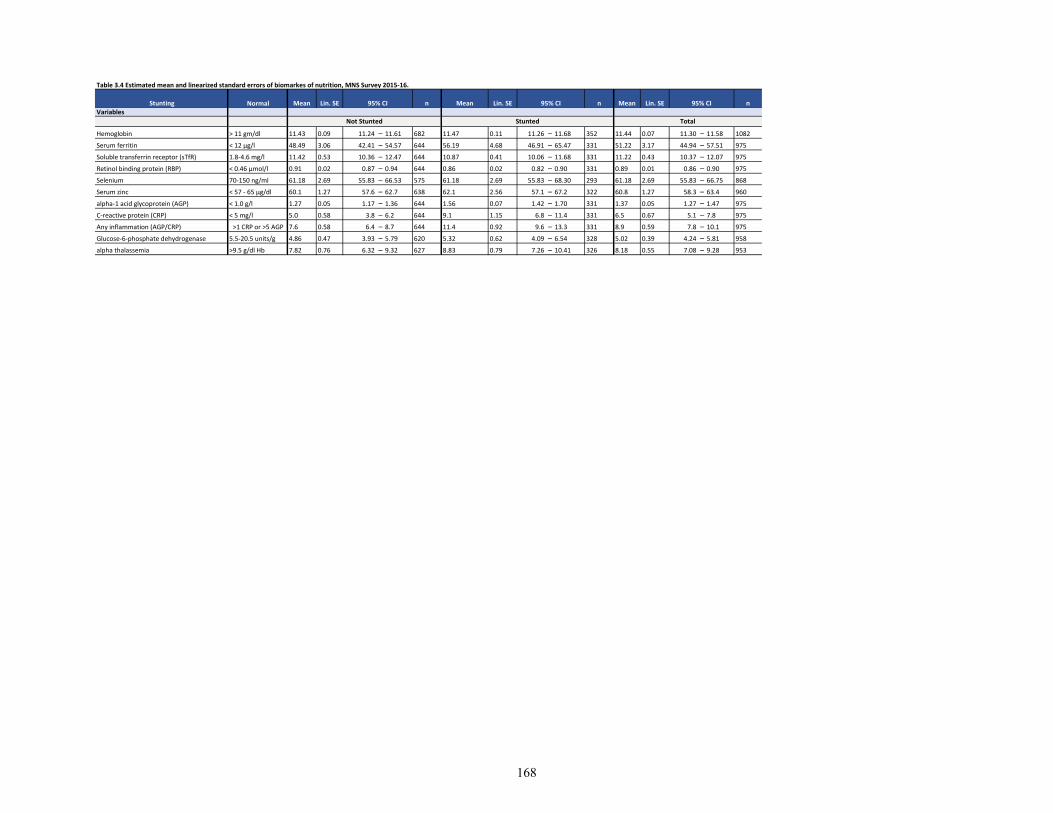
Table 3.4 Estimated mean and linearized standard errors of biomarkes of nutrition, MNS Survey 2015-16.
NormalVariables
Hemoglobin > 11 gm/dl 11.43 0.09 11.24 – 11.61 682 11.47 0.11 11.26 – 11.68 352 11.44 0.07 11.30 – 11.58 1082
Serum ferritin < 12 µg/l 48.49 3.06 42.41 – 54.57 644 56.19 4.68 46.91 – 65.47 331 51.22 3.17 44.94 – 57.51 975
Soluble transferrin receptor (sTfR) 1.8-4.6 mg/l 11.42 0.53 10.36 – 12.47 644 10.87 0.41 10.06 – 11.68 331 11.22 0.43 10.37 – 12.07 975
Retinol binding protein (RBP) < 0.46 µmol/l 0.91 0.02 0.87 – 0.94 644 0.86 0.02 0.82 – 0.90 331 0.89 0.01 0.86 – 0.90 975
Selenium 70-150 ng/ml 61.18 2.69 55.83 – 66.53 575 61.18 2.69 55.83 – 68.30 293 61.18 2.69 55.83 – 66.75 868
Serum zinc < 57 - 65 µg/dl 60.1 1.27 57.6 – 62.7 638 62.1 2.56 57.1 – 67.2 322 60.8 1.27 58.3 – 63.4 960
alpha-1 acid glycoprotein (AGP) < 1.0 g/l 1.27 0.05 1.17 – 1.36 644 1.56 0.07 1.42 – 1.70 331 1.37 0.05 1.27 – 1.47 975
C-reactive protein (CRP) < 5 mg/l 5.0 0.58 3.8 – 6.2 644 9.1 1.15 6.8 – 11.4 331 6.5 0.67 5.1 – 7.8 975
Any inflammation (AGP/CRP) >1 CRP or >5 AGP 7.6 0.58 6.4 – 8.7 644 11.4 0.92 9.6 – 13.3 331 8.9 0.59 7.8 – 10.1 975
Glucose-6-phosphate dehydrogenase 5.5-20.5 units/g 4.86 0.47 3.93 – 5.79 620 5.32 0.62 4.09 – 6.54 328 5.02 0.39 4.24 – 5.81 958
alpha thalassemia >9.5 g/dl Hb 7.82 0.76 6.32 – 9.32 627 8.83 0.79 7.26 – 10.41 326 8.18 0.55 7.08 – 9.28 953
Stunting Mean Lin. SE 95% CI n n
Not Stunted Stunted Total
Lin. SE 95% CI n Mean Lin. SE 95% CIMean
168
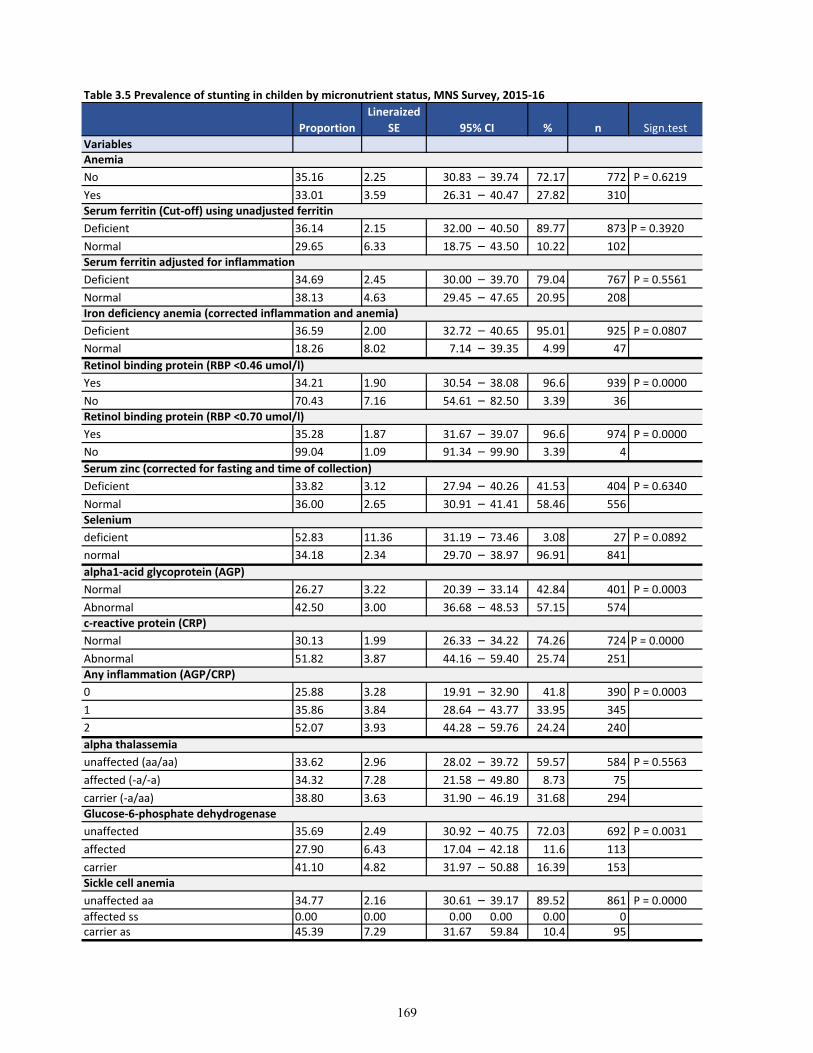
Table 3.5 Prevalence of stunting in childen by micronutrient status, MNS Survey, 2015-16
Variables
No 35.16 2.25 30.83 – 39.74 72.17 772 P = 0.6219
Yes 33.01 3.59 26.31 – 40.47 27.82 310
Deficient 36.14 2.15 32.00 – 40.50 89.77 873 P = 0.3920
Normal 29.65 6.33 18.75 – 43.50 10.22 102
Deficient 34.69 2.45 30.00 – 39.70 79.04 767 P = 0.5561
Normal 38.13 4.63 29.45 – 47.65 20.95 208
Deficient 36.59 2.00 32.72 – 40.65 95.01 925 P = 0.0807
Normal 18.26 8.02 7.14 – 39.35 4.99 47
Yes 34.21 1.90 30.54 – 38.08 96.6 939 P = 0.0000
No 70.43 7.16 54.61 – 82.50 3.39 36
Yes 35.28 1.87 31.67 – 39.07 96.6 974 P = 0.0000
No 99.04 1.09 91.34 – 99.90 3.39 4
Deficient 33.82 3.12 27.94 – 40.26 41.53 404 P = 0.6340
Normal 36.00 2.65 30.91 – 41.41 58.46 556
deficient 52.83 11.36 31.19 – 73.46 3.08 27 P = 0.0892
normal 34.18 2.34 29.70 – 38.97 96.91 841
Normal 26.27 3.22 20.39 – 33.14 42.84 401 P = 0.0003
Abnormal 42.50 3.00 36.68 – 48.53 57.15 574
Normal 30.13 1.99 26.33 – 34.22 74.26 724 P = 0.0000
Abnormal 51.82 3.87 44.16 – 59.40 25.74 251
0 25.88 3.28 19.91 – 32.90 41.8 390 P = 0.0003
1 35.86 3.84 28.64 – 43.77 33.95 345
2 52.07 3.93 44.28 – 59.76 24.24 240
unaffected (aa/aa) 33.62 2.96 28.02 – 39.72 59.57 584 P = 0.5563
affected (-a/-a) 34.32 7.28 21.58 – 49.80 8.73 75
carrier (-a/aa) 38.80 3.63 31.90 – 46.19 31.68 294
unaffected 35.69 2.49 30.92 – 40.75 72.03 692 P = 0.0031
affected 27.90 6.43 17.04 – 42.18 11.6 113
carrier 41.10 4.82 31.97 – 50.88 16.39 153
unaffected aa 34.77 2.16 30.61 – 39.17 89.52 861 P = 0.0000
affected ss 0.00 0.00 0.00 0.00 0.00 0carrier as 45.39 7.29 31.67 59.84 10.4 95
Retinol binding protein (RBP <0.46 umol/l)
Proportion
Lineraized
SE 95% CI % n Sign.test
Anemia
Serum ferritin (Cut-off) using unadjusted ferritin
Serum ferritin adjusted for inflammation
Iron deficiency anemia (corrected inflammation and anemia)
alpha thalassemia
Glucose-6-phosphate dehydrogenase
Sickle cell anemia
Retinol binding protein (RBP <0.70 umol/l)
Serum zinc (corrected for fasting and time of collection)
Selenium
alpha1-acid glycoprotein (AGP)
c-reactive protein (CRP)
Any inflammation (AGP/CRP)
169
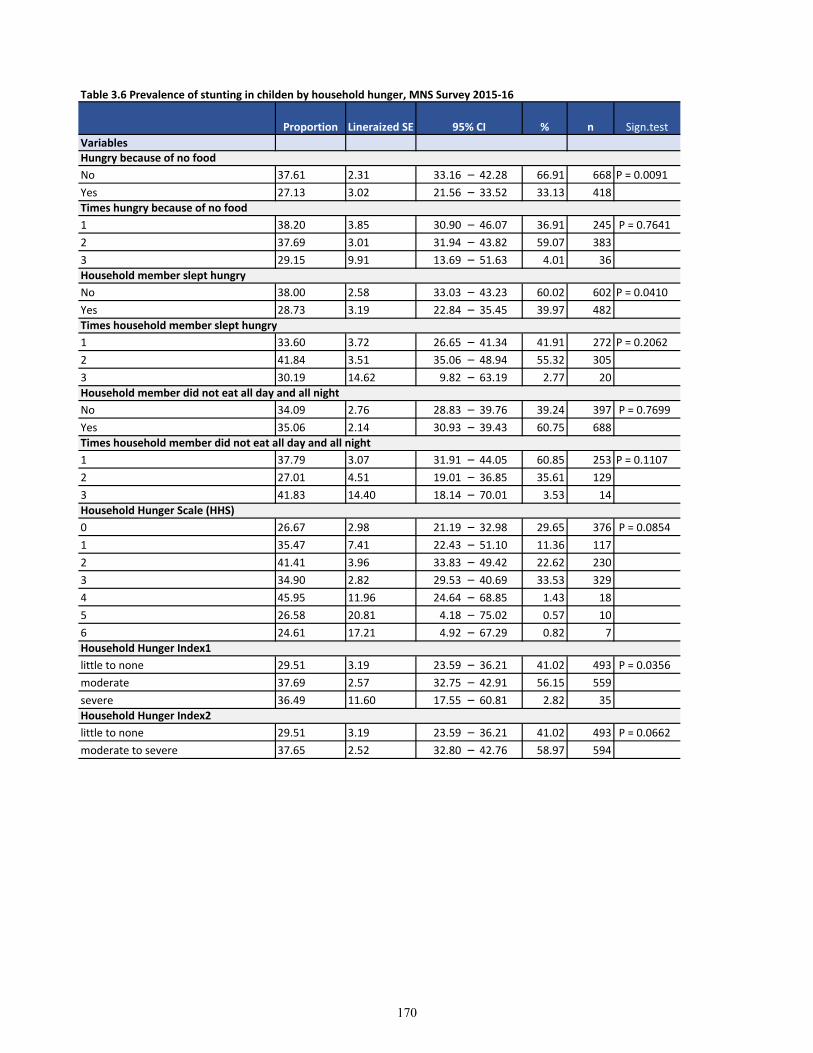
Table 3.6 Prevalence of stunting in childen by household hunger, MNS Survey 2015-16
Variables
No 37.61 2.31 33.16 – 42.28 66.91 668 P = 0.0091
Yes 27.13 3.02 21.56 – 33.52 33.13 418
1 38.20 3.85 30.90 – 46.07 36.91 245 P = 0.7641
2 37.69 3.01 31.94 – 43.82 59.07 383
3 29.15 9.91 13.69 – 51.63 4.01 36
No 38.00 2.58 33.03 – 43.23 60.02 602 P = 0.0410
Yes 28.73 3.19 22.84 – 35.45 39.97 482
1 33.60 3.72 26.65 – 41.34 41.91 272 P = 0.2062
2 41.84 3.51 35.06 – 48.94 55.32 305
3 30.19 14.62 9.82 – 63.19 2.77 20
No 34.09 2.76 28.83 – 39.76 39.24 397 P = 0.7699
Yes 35.06 2.14 30.93 – 39.43 60.75 688
1 37.79 3.07 31.91 – 44.05 60.85 253 P = 0.1107
2 27.01 4.51 19.01 – 36.85 35.61 129
3 41.83 14.40 18.14 – 70.01 3.53 14
0 26.67 2.98 21.19 – 32.98 29.65 376 P = 0.0854
1 35.47 7.41 22.43 – 51.10 11.36 117
2 41.41 3.96 33.83 – 49.42 22.62 230
3 34.90 2.82 29.53 – 40.69 33.53 329
4 45.95 11.96 24.64 – 68.85 1.43 18
5 26.58 20.81 4.18 – 75.02 0.57 10
6 24.61 17.21 4.92 – 67.29 0.82 7
little to none 29.51 3.19 23.59 – 36.21 41.02 493 P = 0.0356
moderate 37.69 2.57 32.75 – 42.91 56.15 559
severe 36.49 11.60 17.55 – 60.81 2.82 35
little to none 29.51 3.19 23.59 – 36.21 41.02 493 P = 0.0662
moderate to severe 37.65 2.52 32.80 – 42.76 58.97 594
Times household member did not eat all day and all night
Household Hunger Scale (HHS)
Household Hunger Index1
Household Hunger Index2
Sign.test
Hungry because of no food
Times hungry because of no food
Household member slept hungry
Times household member slept hungry
Household member did not eat all day and all night
Proportion Lineraized SE 95% CI % n
170
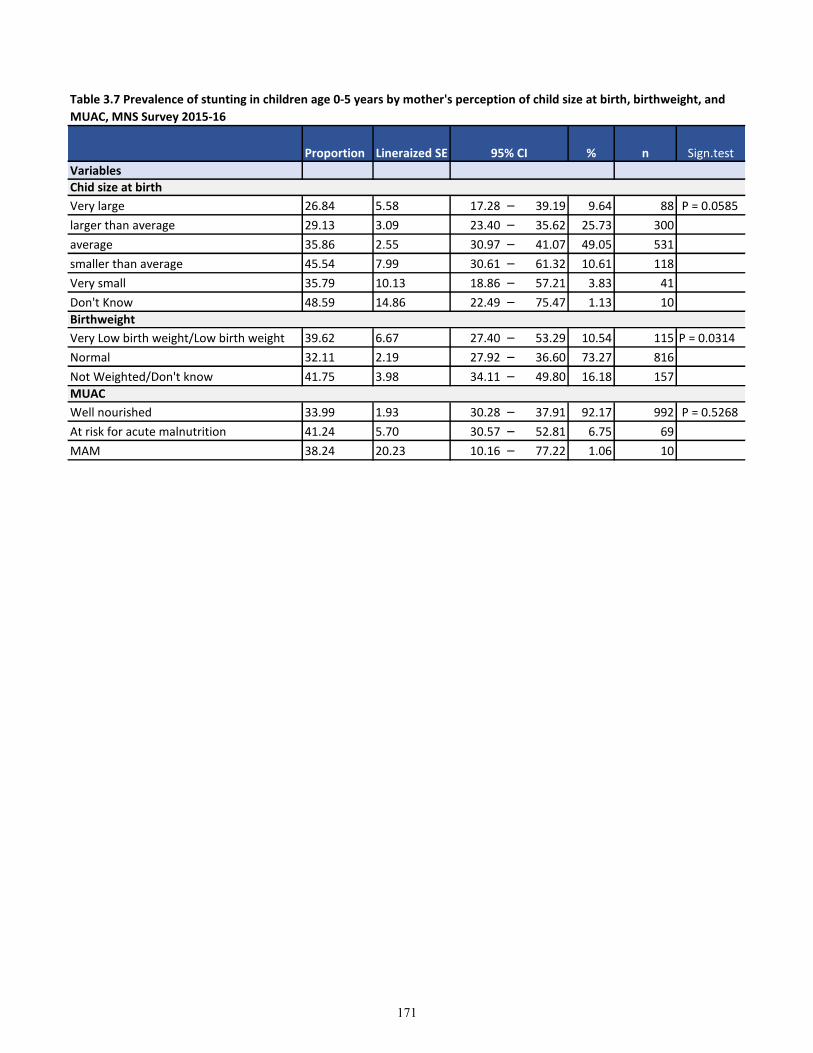
Variables
Very large 26.84 5.58 17.28 – 39.19 9.64 88 P = 0.0585
larger than average 29.13 3.09 23.40 – 35.62 25.73 300
average 35.86 2.55 30.97 – 41.07 49.05 531
smaller than average 45.54 7.99 30.61 – 61.32 10.61 118
Very small 35.79 10.13 18.86 – 57.21 3.83 41
Don't Know 48.59 14.86 22.49 – 75.47 1.13 10
Very Low birth weight/Low birth weight 39.62 6.67 27.40 – 53.29 10.54 115 P = 0.0314
Normal 32.11 2.19 27.92 – 36.60 73.27 816
Not Weighted/Don't know 41.75 3.98 34.11 – 49.80 16.18 157
Well nourished 33.99 1.93 30.28 – 37.91 92.17 992 P = 0.5268
At risk for acute malnutrition 41.24 5.70 30.57 – 52.81 6.75 69
MAM 38.24 20.23 10.16 – 77.22 1.06 10
Chid size at birth
Birthweight
MUAC
Table 3.7 Prevalence of stunting in children age 0-5 years by mother's perception of child size at birth, birthweight, and
MUAC, MNS Survey 2015-16
Proportion Lineraized SE 95% CI % n Sign.test
171
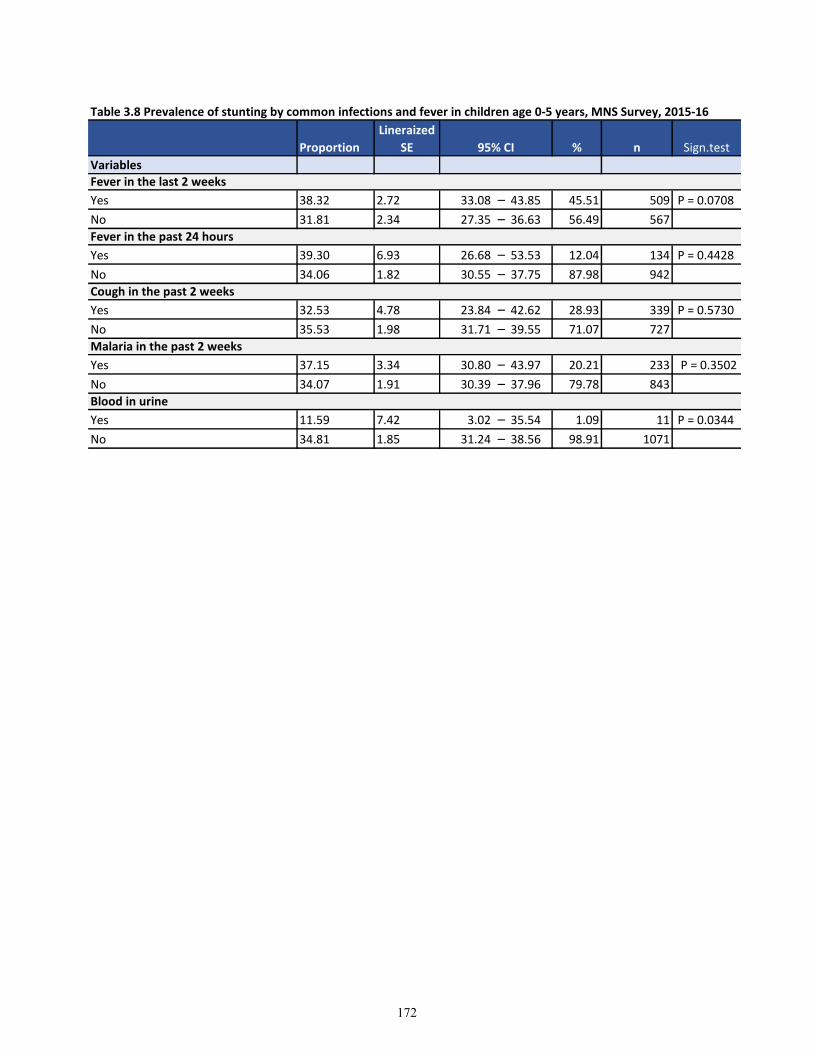
Variables
Yes 38.32 2.72 33.08 – 43.85 45.51 509 P = 0.0708
No 31.81 2.34 27.35 – 36.63 56.49 567
Yes 39.30 6.93 26.68 – 53.53 12.04 134 P = 0.4428
No 34.06 1.82 30.55 – 37.75 87.98 942
Yes 32.53 4.78 23.84 – 42.62 28.93 339 P = 0.5730
No 35.53 1.98 31.71 – 39.55 71.07 727
Yes 37.15 3.34 30.80 – 43.97 20.21 233 P = 0.3502
No 34.07 1.91 30.39 – 37.96 79.78 843
Yes 11.59 7.42 3.02 – 35.54 1.09 11 P = 0.0344
No 34.81 1.85 31.24 – 38.56 98.91 1071
Table 3.8 Prevalence of stunting by common infections and fever in children age 0-5 years, MNS Survey, 2015-16
Blood in urine
Proportion
Lineraized
SE 95% CI % n Sign.test
Fever in the last 2 weeks
Fever in the past 24 hours
Cough in the past 2 weeks
Malaria in the past 2 weeks
172
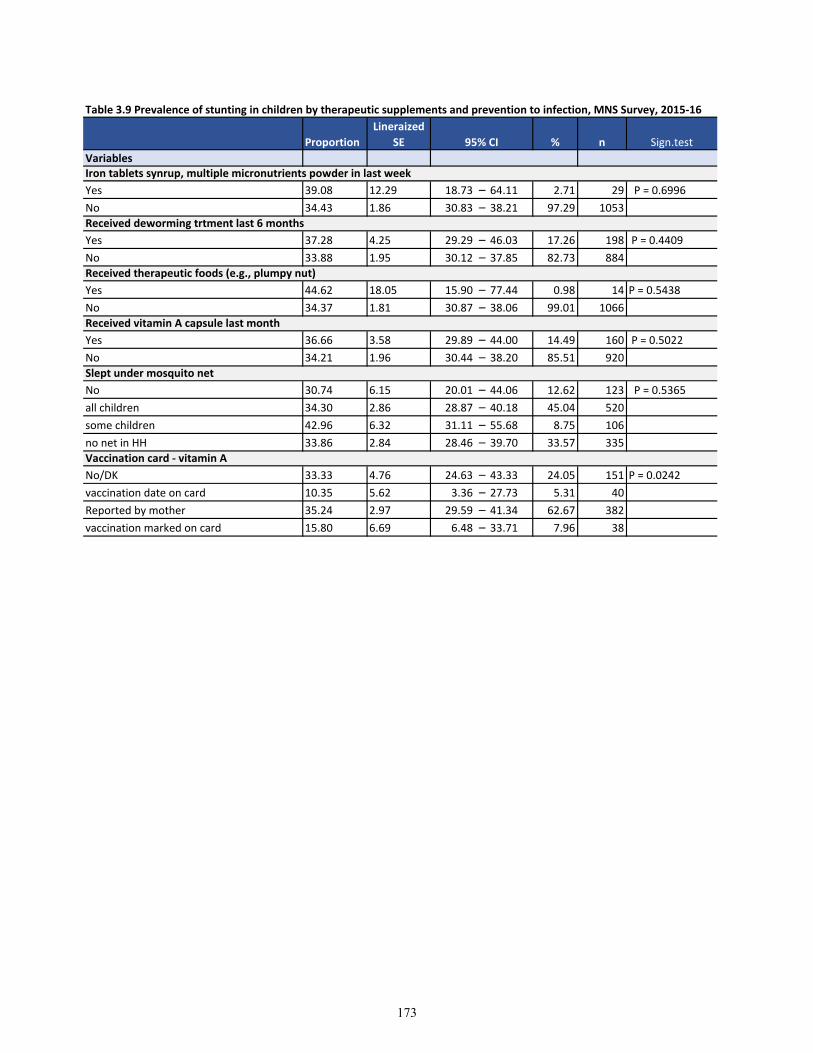
Variables
Yes 39.08 12.29 18.73 – 64.11 2.71 29 P = 0.6996
No 34.43 1.86 30.83 – 38.21 97.29 1053
Yes 37.28 4.25 29.29 – 46.03 17.26 198 P = 0.4409
No 33.88 1.95 30.12 – 37.85 82.73 884
Yes 44.62 18.05 15.90 – 77.44 0.98 14 P = 0.5438
No 34.37 1.81 30.87 – 38.06 99.01 1066
Yes 36.66 3.58 29.89 – 44.00 14.49 160 P = 0.5022
No 34.21 1.96 30.44 – 38.20 85.51 920
No 30.74 6.15 20.01 – 44.06 12.62 123 P = 0.5365
all children 34.30 2.86 28.87 – 40.18 45.04 520
some children 42.96 6.32 31.11 – 55.68 8.75 106
no net in HH 33.86 2.84 28.46 – 39.70 33.57 335
No/DK 33.33 4.76 24.63 – 43.33 24.05 151 P = 0.0242
vaccination date on card 10.35 5.62 3.36 – 27.73 5.31 40
Reported by mother 35.24 2.97 29.59 – 41.34 62.67 382
vaccination marked on card 15.80 6.69 6.48 – 33.71 7.96 38
Table 3.9 Prevalence of stunting in children by therapeutic supplements and prevention to infection, MNS Survey, 2015-16
Vaccination card - vitamin A
Sign.test
Iron tablets synrup, multiple micronutrients powder in last week
Received deworming trtment last 6 months
Received therapeutic foods (e.g., plumpy nut)
Received vitamin A capsule last month
Slept under mosquito net
Proportion
Lineraized
SE 95% CI % n
173
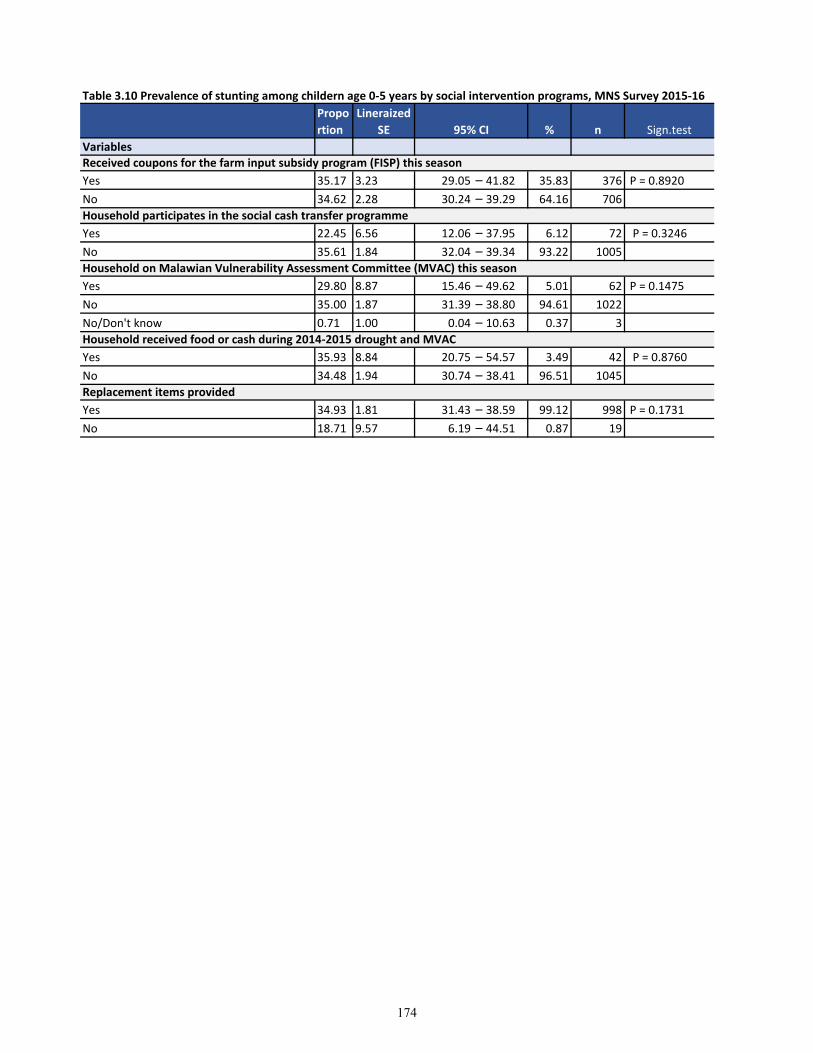
Table 3.10 Prevalence of stunting among childern age 0-5 years by social intervention programs, MNS Survey 2015-16
Variables
Yes 35.17 3.23 29.05 – 41.82 35.83 376 P = 0.8920
No 34.62 2.28 30.24 – 39.29 64.16 706
Yes 22.45 6.56 12.06 – 37.95 6.12 72 P = 0.3246
No 35.61 1.84 32.04 – 39.34 93.22 1005
Yes 29.80 8.87 15.46 – 49.62 5.01 62 P = 0.1475
No 35.00 1.87 31.39 – 38.80 94.61 1022
No/Don't know 0.71 1.00 0.04 – 10.63 0.37 3
Yes 35.93 8.84 20.75 – 54.57 3.49 42 P = 0.8760
No 34.48 1.94 30.74 – 38.41 96.51 1045
Yes 34.93 1.81 31.43 – 38.59 99.12 998 P = 0.1731
No 18.71 9.57 6.19 – 44.51 0.87 19
Replacement items provided
Propo
rtion
Lineraized
SE 95% CI % n Sign.test
Received coupons for the farm input subsidy program (FISP) this season
Household participates in the social cash transfer programme
Household on Malawian Vulnerability Assessment Committee (MVAC) this season
Household received food or cash during 2014-2015 drought and MVAC
174
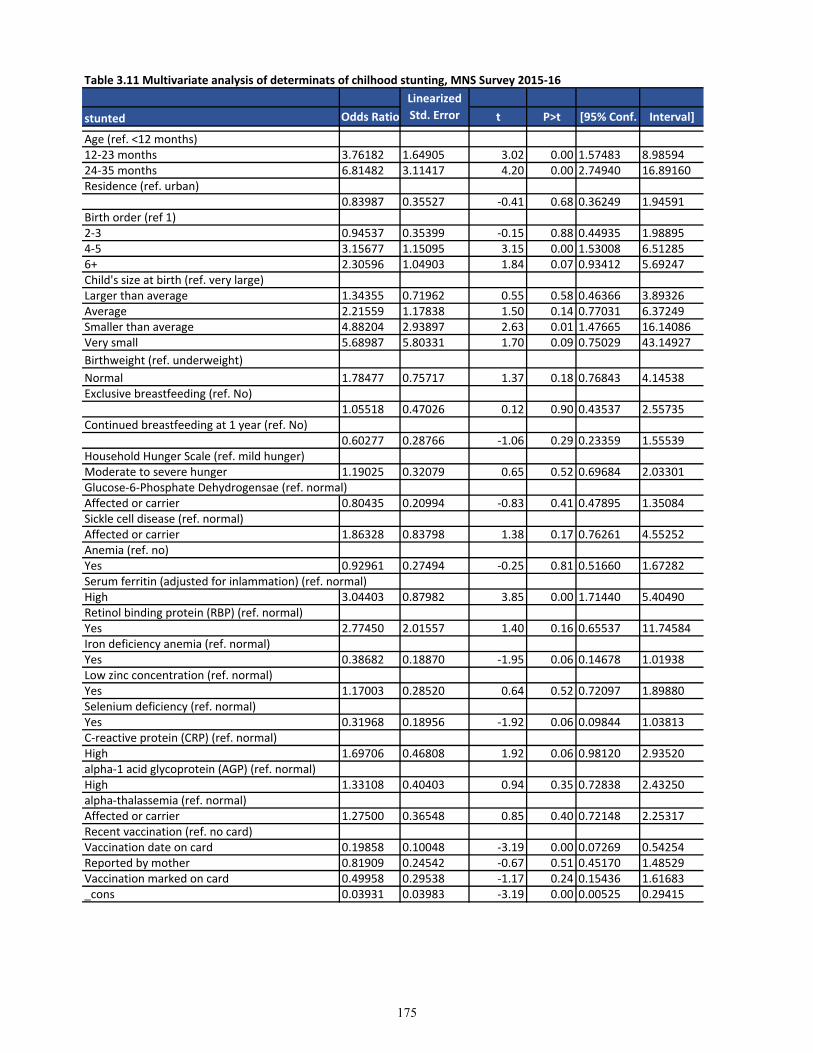
Table 3.11 Multivariate analysis of determinats of chilhood stunting, MNS Survey 2015-16
stunted Odds Ratio t P>t [95% Conf. Interval]
Age (ref. <12 months)12-23 months 3.76182 1.64905 3.02 0.00 1.57483 8.9859424-35 months 6.81482 3.11417 4.20 0.00 2.74940 16.89160Residence (ref. urban)
0.83987 0.35527 -0.41 0.68 0.36249 1.94591Birth order (ref 1)2-3 0.94537 0.35399 -0.15 0.88 0.44935 1.988954-5 3.15677 1.15095 3.15 0.00 1.53008 6.512856+ 2.30596 1.04903 1.84 0.07 0.93412 5.69247Child's size at birth (ref. very large)Larger than average 1.34355 0.71962 0.55 0.58 0.46366 3.89326Average 2.21559 1.17838 1.50 0.14 0.77031 6.37249Smaller than average 4.88204 2.93897 2.63 0.01 1.47665 16.14086Very small 5.68987 5.80331 1.70 0.09 0.75029 43.14927
Birthweight (ref. underweight)
Normal 1.78477 0.75717 1.37 0.18 0.76843 4.14538Exclusive breastfeeding (ref. No)
1.05518 0.47026 0.12 0.90 0.43537 2.55735Continued breastfeeding at 1 year (ref. No)
0.60277 0.28766 -1.06 0.29 0.23359 1.55539Household Hunger Scale (ref. mild hunger)Moderate to severe hunger 1.19025 0.32079 0.65 0.52 0.69684 2.03301Glucose-6-Phosphate Dehydrogensae (ref. normal)Affected or carrier 0.80435 0.20994 -0.83 0.41 0.47895 1.35084Sickle cell disease (ref. normal)Affected or carrier 1.86328 0.83798 1.38 0.17 0.76261 4.55252Anemia (ref. no)Yes 0.92961 0.27494 -0.25 0.81 0.51660 1.67282Serum ferritin (adjusted for inlammation) (ref. normal)High 3.04403 0.87982 3.85 0.00 1.71440 5.40490Retinol binding protein (RBP) (ref. normal)Yes 2.77450 2.01557 1.40 0.16 0.65537 11.74584Iron deficiency anemia (ref. normal)Yes 0.38682 0.18870 -1.95 0.06 0.14678 1.01938Low zinc concentration (ref. normal)Yes 1.17003 0.28520 0.64 0.52 0.72097 1.89880Selenium deficiency (ref. normal)Yes 0.31968 0.18956 -1.92 0.06 0.09844 1.03813C-reactive protein (CRP) (ref. normal)High 1.69706 0.46808 1.92 0.06 0.98120 2.93520alpha-1 acid glycoprotein (AGP) (ref. normal)High 1.33108 0.40403 0.94 0.35 0.72838 2.43250alpha-thalassemia (ref. normal)Affected or carrier 1.27500 0.36548 0.85 0.40 0.72148 2.25317Recent vaccination (ref. no card)Vaccination date on card 0.19858 0.10048 -3.19 0.00 0.07269 0.54254Reported by mother 0.81909 0.24542 -0.67 0.51 0.45170 1.48529Vaccination marked on card 0.49958 0.29538 -1.17 0.24 0.15436 1.61683_cons 0.03931 0.03983 -3.19 0.00 0.00525 0.29415
Linearized
Std. Error
175
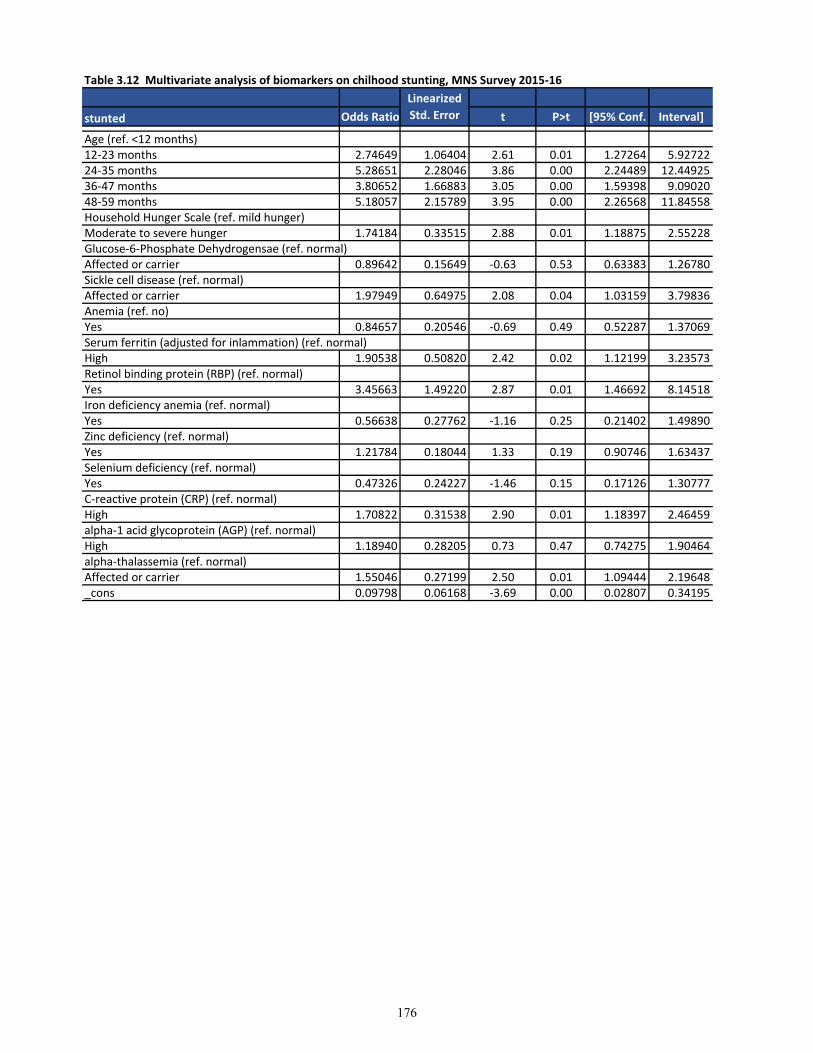
Table 3.12 Multivariate analysis of biomarkers on chilhood stunting, MNS Survey 2015-16
stunted Odds Ratio t P>t [95% Conf. Interval]
Age (ref. <12 months)12-23 months 2.74649 1.06404 2.61 0.01 1.27264 5.9272224-35 months 5.28651 2.28046 3.86 0.00 2.24489 12.4492536-47 months 3.80652 1.66883 3.05 0.00 1.59398 9.0902048-59 months 5.18057 2.15789 3.95 0.00 2.26568 11.84558Household Hunger Scale (ref. mild hunger)Moderate to severe hunger 1.74184 0.33515 2.88 0.01 1.18875 2.55228Glucose-6-Phosphate Dehydrogensae (ref. normal)Affected or carrier 0.89642 0.15649 -0.63 0.53 0.63383 1.26780Sickle cell disease (ref. normal)Affected or carrier 1.97949 0.64975 2.08 0.04 1.03159 3.79836Anemia (ref. no)Yes 0.84657 0.20546 -0.69 0.49 0.52287 1.37069Serum ferritin (adjusted for inlammation) (ref. normal)High 1.90538 0.50820 2.42 0.02 1.12199 3.23573Retinol binding protein (RBP) (ref. normal)Yes 3.45663 1.49220 2.87 0.01 1.46692 8.14518Iron deficiency anemia (ref. normal)Yes 0.56638 0.27762 -1.16 0.25 0.21402 1.49890Zinc deficiency (ref. normal)Yes 1.21784 0.18044 1.33 0.19 0.90746 1.63437Selenium deficiency (ref. normal)Yes 0.47326 0.24227 -1.46 0.15 0.17126 1.30777C-reactive protein (CRP) (ref. normal)High 1.70822 0.31538 2.90 0.01 1.18397 2.46459alpha-1 acid glycoprotein (AGP) (ref. normal)High 1.18940 0.28205 0.73 0.47 0.74275 1.90464alpha-thalassemia (ref. normal)Affected or carrier 1.55046 0.27199 2.50 0.01 1.09444 2.19648_cons 0.09798 0.06168 -3.69 0.00 0.02807 0.34195
Linearized
Std. Error
176
Bibliography
1. Remans, R., et al., Multisector intervention to accelerate reductions in child stunting: an
observational study from 9 sub-Saharan African countries. Am J Clin Nutr, 2011. 94(6):
p. 1632-42.
2. Dewey, K.G. and K. Begum, Long-term consequences of stunting in early life. Matern
Child Nutr, 2011. 7 Suppl 3: p. 5-18.
3. Branca, F. and M. Ferrari, Impact of micronutrient deficiencies on growth: the stunting
syndrome. Ann Nutr Metab, 2002. 46 Suppl 1: p. 8-17.
4. Walker, S.P., et al., Early childhood stunting is associated with poor psychological
functioning in late adolescence and effects are reduced by psychosocial stimulation. J
Nutr, 2007. 137(11): p. 2464-9.
5. Hoffman, D.J., et al., Why are nutritionally stunted children at increased risk of obesity?
Studies of metabolic rate and fat oxidation in shantytown children from Sao Paulo,
Brazil. Am J Clin Nutr, 2000. 72(3): p. 702-7.
6. Gaskin, P.S., et al., Early linear growth retardation and later blood pressure. Eur J Clin
Nutr, 2000. 54(7): p. 563-7.
7. Kennedy, E. and L. Haddad, Food Security and Nutrition, 1971-91. Food Policy, 1992.
Feb (17)(1): p. 2-6.
8. Dewey, K.G. and S. Adu-Afarwuah, Systematic review of the efficacy and effectiveness of
complementary feeding interventions in developing countries. Matern Child Nutr, 2008. 4
Suppl 1: p. 24-85.
9. UNICEF, Multi-sectoral Approaches to Nutrition: Nutrition-specific and nutrition-
sensitive interventions to accelerate progress. Available at:
https://www.unicef.org/eapro/Brief_Nutrition_Overview.pdf, 2017.
10. USAID, Multi-Sectoral Nutrition Strategy 2014-2025. USAID Report, 2014. Available
at: https://www.usaid.gov/nutrition-strategy.
11. Harris, J., J. Meerman, and N. Aberman, Introduction to conceptual issues related to
agriculture, food security, and nutrition. In Mapping the linkages between agriculture,
food security and nutrition in Malawi. International Food Policy Research Institute
(IFPRI). , 2015. Chapter 1: p. 1-7.
12. Ruel, M.T. and M. P., Child Feeding Practices Are Associated with Child Nutritional
Status in Latin America: Innovative Uses of the Demographic and Health Surveys. J
Nutr, 2002. 132: p. 1180-1187.
13. Trehan, I., Banerjee, S., Murray, E., Ryan, KN., Thakwalakwa, C., Maleta, KM,.,
Manary, MJ., Extending supplementary feeding for children under five with moderate
acute malnutrition leads to lower relapse rates. J Pediatr Gastroenterol Nutr, 2015. 60(4):
p. 544-549.
14. Office., N.S. and M. ICF, Malawi Demographic and Health Survey 2010. 2011: Zomba,
Malawi, and Calverton, USA: NSO and ICF Macro.
15. Quisumbing, A.R., Brown, L.R., Feldstein, H.S., Haddad, L., Pena, C. , Women: The key
to food security. Food Policy Report, IFPRI. Washington, D.C., 1995.
16. Prendergast, A. and P. Kelly, Enteropathies in the developing world: neglected effects on
global health. Am J Trop Med Hyg, 2012. 86(5): p. 756-63.
17. Caulfield, L., S. Huffman, and E. Piwoz, Interventions to improve intake of
complementary foods by infants 6 to 12 months of age in developing countries: Impact on
growth and on the prevalence of malnutrition and potential contribution to child survival.
Food and Nutrition Bulletin, 1999. 20(2): p. 183-200.
177

18. Feed the Future, U. Implementation Plan - Malawi. 2013 08/08/2013]; Available from:
http://www.feedthefuture.gov/sites/default/files/country/strategies/files/MalawiFTFStrate
gicReview.pdf.
19. Nations, U., Malawi: coordination team of the UN sustem high-level task force for the
global food security crisis. 2010.
20. Nyambose, J., Koski, KG., and Tucker, KL., High intra/interindividual variance ratios
for energy and nutrient intakes of pregnant women in rural Malawi show that many days
are required ti estimate usual intake. J Nutr, 2002. 132: p. 1313-1318.
21. Mlotha, V., et al., Glycemic responses to maize flour stiff porridges prepared using local
receipes in Malawi. Food Sci Nutr., 2016. 4(2): p. 322-328.
22. Feed the Future, U. Countries/Malawi. 08/08/2013]; Available from:
http://www.feedthefuture.gov/.
23. Arimond, M. and M.T. Ruel, Dietary diversity is associated with child nutritional status:
evidence from 11 demographic and health surveys. J Nutr, 2004. 134(10): p. 2579-85.
24. Kikafunda, J.K., et al., Risk factors for early childhood malnutrition in Uganda.
Pediatrics, 1998. 102(4).
25. Knueppel, D., M. Demment, and L. Kaiser, Validation of the Household Food Insecurity
Access Scale in rural Tanzania. Public Health Nutr, 2010. 13(3): p. 360-7.
26. Torheim, L.E., et al., Nutrient adequacy and dietary diversity in rural Mali: association
and determinants. Eur J Clin Nutr, 2004. 58(4): p. 594-604.
27. Savy, M., et al., Use of variety/diversity scores for diet quality measurement: relation
with nutritional status of women in a rural area in Burkina Faso. Eur J Clin Nutr, 2005.
59(5): p. 703-16.
28. Headey D., E.O., Improving the measurement of food security. Poverty, Health and
Nutrition Division. . Development Strategy and Government Division 2012. IFPRI
discussion paper 01225.
29. Onyango, A., K.G. Koski, and K.L. Tucker, Food diversity versus breastfeeding choice
in determining anthropometric status in rural Kenyan toddlers. International Journal of
Epidemiology, 1998. 27(3): p. 484-489.
30. Rah, J.H., et al., Low dietary diversity is a predictor of child stunting in rural
Bangladesh. Eur J Clin Nutr, 2010. 64(12): p. 1393-8.
31. WHO. Indicators for assessing infant and young child feeding practices: conclusions of a
consensus meeting held 6-8 November 2007 in Washington D.C., USA. 2008.
32. WHO, Indicators for assessing infant and young child feeding practices. Part 2:
Measurement. 2010, WHO: Geneva.
33. WHO, Indicators for assessing infant and young child feeding practices. Part 3: Country
profiles. 2010, WHO: Geneva.
34. Saha, K.K., et al., Household food security is associated with infant feeding practices in
rural Bangladesh. J Nutr, 2008. 138(7): p. 1383-90.
35. Marriott, B.P., et al., World Health Organization (WHO) infant and young child feeding
indicators: associations with growth measures in 14 low-income countries. Matern Child
Nutr, 2012. 8(3): p. 354-70.
36. Menon, P., et al., Age-appropriate infant and young child feeding practices are
associated with child nutrition in India: insights from nationally representative data.
Matern Child Nutr, 2013.
37. Disha, A.D., Rawat, R., Subandoro, A., Menon, P., Infant and young child feeding
(IYCF) practices in Ethiopia and Zambia and their association with child nutrition:
analysis of demographic and health survey data. . African Journal of Food, Africulture,
Nutrition and Development, 2012. 12(2).
38. Marquis, G.S., et al., Association of breastfeeding and stunting in Peruvian toddlers: an
example of reverse causality. Int J Epidemiol, 1997. 26(2): p. 349-56.
178
39. Gibson, R., Yeudall, F., Drost, N., Mtitimuni, BM., and Cullinan, TR., Experiences of a
Community-Based Dietary Intervention to Enhance Micronutrient Adequacy of Diets
Low in Animal Source Foods and High in Phytate: A Case Study in Rural Malawian
Children. J Nutr, 2003. 133: p. 3992S-3999S.
40. Lin, C., Manary, MJ., Maleta, K., Briend, A., Ashorn, P., An energy -dense
complementary food is associated with a modest incresae in weight gain when compared
with a fortified porridge in Malawian children aged 6-18 months. J Nutr, 2008. 138: p.
593-598.
41. UNICEF, IYCF Programming Status - results of 2010-2011 assessment of key actions for
comprehensive IYCF feeding programmes in 65 countries. 2013.
42. Ickowitz, A., Powell, B., Salim, MA., Sunderland, TCH., Dietary quality and tree cover
in Africa. Global Environmental Change, 2013. 24: p. 287-294.
43. Wiesmann, D., et al., Validation of the world food programme's food consumption score
and alternative indicators of household food security. 2009, IFRPI.
44. Sibhatu, K., V. Krishna, and M. Qaim, Production diversity and dietary diversity in
smallholder farm households. PNAS, 2015. 112(34): p. 10657-10662.
45. Lunn, P.G., C.A. Northrop-Clewes, and R.M. Downes, Intestinal permeability, mucosal
injury, and growth faltering in Gambian infants. Lancet, 1991. 338(8772): p. 907-10.
46. Guerrant, R.L., et al., The impoverished gut--a triple burden of diarrhoea, stunting and
chronic disease. Nat Rev Gastroenterol Hepatol, 2013. 10(4): p. 220-9.
47. Langford, R., P. Lunn, and C. Panter-Brick, Hand-washing, subclinical infections, and
growth: a longitudinal evaluation of an intervention in Nepali slums. Am J Hum Biol,
2011. 23(5): p. 621-9.
48. Gross, R., et al., The four dimensions of food and nutrition security: definitions and
concepts. 2000.
49. Weisz, A., Meuli, G., Thakwalakwa, C., Trehan, I., Maleta, K., Manary, M., The duration
of diarrhea and fever is associated with growth fatering in rural Malawian children aged
6-18 months. Nutrition Journal, 2011. 10(25): p. 1-4.
50. Korpe, P.S. and W.A. Petri, Jr., Environmental enteropathy: critical implications of a
poorly understood condition. Trends Mol Med, 2012. 18(6): p. 328-36.
51. Smith, L.E., R.J. Stoltzfus, and A. Prendergast, Food chain mycotoxin exposure, gut
health, and impaired growth: a conceptual framework. Adv Nutr, 2012. 3(4): p. 526-31.
52. Smith, H., Ryan, KN., Stepenson, KB., Westcott, C., Thakwalakwa, C., Maleta, K.,
Cheng, JY., Brenna, JT., Shulman, RJ., Trehan, I., and Manary, MJ., Multiple
micronutrients supplementation transiently ameliorates environmental enteropathy in
Malawian children aged 12-35 months in a randomized controlled clinical trial. J Nutr,
2014. 144: p. 2059-65.
53. Blanton, L., Charbonneau, MR., Salih, T., Barratt, MJ., Venkatesh, S., Ilkaveya, O.,
Subramanian, S., Manary, MJ., Trehan, I., Jorgensen, JM., Fan, YM., Henrissat, B.,
Leyn, SA., Rodionov, DA., Osterman, AL., Maleta, KM., Newgard, CB., Ashorn, P.,
Dewey, KG., and Gordan, J. , Gut bacteria that rescue growth impairments transmitted
by immature microbiota from undernourished children. Science, 2016. 351(6275).
54. Salam, R., Das, JK., and Bhutta, ZA., Current issues and priorities in childhood
nutrition, growth, and infections. J Nutr, 2015(Nutrition, growth and infections): p. 1S-
7S.
55. Smith, M., Yatsunenko, T., Manary, MJ., Trehan, I., Mkakosya, R., Cheng, J., Kau, AL.,
Rich, SS., Concannon, P., Mychaleckyj, JC., Liu, J., Houpt, E., Li, JV., Holmes, E.,
Nicholson, J., Knights, D., Ursell, LK., Knight, R., and Gordon, JI., Gut microbiomes of
Malawian twin pairs discordant for kwashiorkar. Science, 2013. 339(6119): p. 548-554.
56. Brewster, D., Manary, MJ., Menzies, IS., O'Loughlin, EV., Henry, RL., Intestinal
permeability in kwashiorkar. Achives of Disease in childhood, 1997. 76: p. 236-241.
179
57. Kau, A., Planer, JD., Liu, J., Rao, S., Yatsunenko, T., Trehan, I., Manary, MJ., Liu, TC.,
Stappenbeck, TS., Malenta, KM., Ashorn, P., Dewey, KG., Houpt, ER., Hsieh, CS.,
Gordon, JI. , Functional characterization of Ig-A targeted bacterial taxa from
malnourished Malawian children that produce diet-dependent enteropathy. Sci Transl
Med, 2015. 7(276): p. 1-31.
58. Humphrey, J.H., Child undernutrition, tropical enteropathy, toilets, and handwashing.
Lancet, 2009. 374(9694): p. 1032-5.
59. Checkley, W., et al., Multi-country analysis of the effects of diarrhoea on childhood
stunting. Int J Epidemiol, 2008. 37(4): p. 816-30.
60. Kvissberg, M., et al., Carbohydrate malabsorption in acutely malnourished children and
infants: a systematic review. Nutrition Reviews, 2015. 74(1): p. 48-58.
61. Ordiz, I., May, TD., Mihindukulasuriya, K., Martin, J., Crowley, J., Tarr, PI., Ryan, K.,
Mortimer, E., Gopalsamy, G., Malenta, K., Mitreva, M., Young, G., and Manary, MJ.,
The effect of dietary resistant starch type 2 on the microbiota and markers of gut
inflammation in rural Malawi children. Microbiome, 2015. 3(37): p. 1-9.
62. Manary, M., et al., Zinc homeostasis in Malawian children consuming a high-phytate
maize-based diet. Am J Clin Nutr., 2002. 75: p. 1057-61.
63. Trehan, I., Benzoni, NS., Wang, AZ., Bollinger, LB., Ngoma, TN., Chimimba, UK.,
Stephenson, KB., Agapova, SE., Maleta, KM., and Manary, MJ., Common beans and
cowpeas as complementary foods to reduce environmental enteric dysfunction and
stunting in Malawian children: study protocol for two randomized controlled trials.
Trials, 2015. 16(520): p. 1-12.
64. Chu, D., and Aagaard, KM., Eating for triliions. Nature, 2016. 532(7599): p. 316-317.
65. McKay, S., et al., Environmental enteropathy: new targets for nutritional interventions.
International Health, 2010. 2(3): p. 172-180.
66. Campbell, D.I., et al., Chronic T cell-mediated enteropathy in rural west African
children: Relationship with nutritional status and small bowel function. Pediatric
Research, 2003. 54(3): p. 306-311.
67. Lin, A., et al., Household Environmental Conditions Are Associated with Enteropathy
and Impaired Growth in Rural Bangladesh. Am J Trop Med Hyg, 2013. 89(1): p. 130-
137.
68. Webb, P., J. Shively, and M. Prajula, Sanitation in Nepal: Links to Nutrition and
Reasearch Priorities, in Nutrition CRSP Research Briefing Paper No. 8. 2012, Tufts/The
Global Nutrition CRSP/USAID.
69. Spears, D., How much international variation in child height can sanitation explain?
Policy Research Working Paper 2013. WPS6351(Feb 2013).
70. Black, R., Victoria, CG., Walker, SP., Bhutta, ZA., Christian, P., de Onis, M., Ezzati, M.,
McGregor, SG., Katz, J., Martorell, R., Uauy, R., and the maternal and child nutrition
study group, Maternal and child nutrition and overweight in low-income and middle-
income countries. Lancet, 2013.
71. Dangour, A., Watson, L., Cumming, O., Boisson, S., Che, Y., Velleman, Y., Cavill, S.,
Allen, E., and Uauy, R., Interventions to improve water quality and supply, sanitation
and hygiene practices, and their effects on the nutritional status of children. Cochrane
Database of Systematic Reviews, 2013(8).
72. UNICEF/MICS. 2006; Available from: http://www.unicef.org/malawi/wes_3975.html.
73. Shroff, M., et al., Maternal autonomy is inversely related to child stunting in Andhra
Pradesh, India. Maternal Child Nutrition 2009. 5(1): p. Author manuscript.
74. Kishor, S.E., A Focus on Gender: Collected Papers on Gender Using DHS Data. 2005,
ORC Macro.: Calverton, Maryland, USA.
75. Bardin, L., et al., Women’s empowerment and nutritional outcomes of children under five
in low, lower-middle, and upper-middle income countries: A systematic review. 2015.
180
76. Rahman, M., U. Saima, and M. Goni, Impact of Maternal Household Decision-Making
Autonomy on Child Nutritional Status in Bangladesh. Asia Pacific Journal of Public
Health, 2015. 27(5): p. 509-20.
77. Cunningham, K., et al., Women's empowerment in agriculture and child nutritional status
in rural Nepal. Public Health Nutrition, 2015. 18(17): p. 3134-45.
78. Vir, S., Improving women’s nutrition imperative for rapid reduction of childhood
stunting in South Asia: coupling of nutrition specific interventions with nutrition sensitive
measures essential. Maternal and Child Nutrition 2016. 12(Suppl.1): p. 72-90.
79. Yount, K., DiGirolamo AM, and U. Ramakrishnan, Impacts of domestic violence on child
growth and nutrition: A conceptual review of the pathways of influence. Social Science
and Medicine, 2011. 72: p. 1534-1554.
80. Chai, J., et al., Association between intimate partner violence and poor child growth:
results from 42 demographic and health surveys. Bulletin of the World Health
Organization, 2016. 94: p. 331-339.
81. Garrett, D., et al., Field-friendly techniques for assessment of biomarkers of nutrition for
development. Am J Clin Nutr, 2011. 94(2): p. 685S-690S.
82. Prendergast, A. and J. Humphrey, The stunting syndrome in developing countries. Pediatr
Int Child Health, 2014. 34(4): p. 250-65.
83. De Bernoist, B., et al., Worldwide Prevalence of Anaemia 1993-2005: WHO Global
Database on Anaemia. . 2008: World Health Organization, Geneva,. p. 40.
84. Verhoef, H., et al., Stunting May Determine the Severity of Malaria-Associated Anemia
in African Children. Pediatrics, 2002. 110(4): p. 1-5.
85. Pirkle, C., et al., Food insecurity and nutritional biomarkers in relation to stature in Inuit
children from Nunavik. Candian Journal of Public Health, 2014. 105(4): p. e233-e238.
86. Abizari, A.-R., F. Azupogo, and I. Brouwer, Subclinical inflammation influences the
association between vitamin A- and iron status among schoolchildren in Ghana. PLoS
ONE, 2017. 12(2): p. e0170747.
87. Flores-Ayala, R., et al., Associations between acute phase proteins and stunting in
children under 5 years: a multi-country analysis, in Micronutrient Forum Global
Conference M. Forum, Editor. 2016: Cancun, Mexico.
88. Prendergast, A., et al., Stunting is characterized by chronic inflammation in Zimbabwean
infants. PLOS ONE, 2014. 9(2): p. e86928.
89. Gibson, R., et al., Does zinc deficiency play a role in stunting among primary school
children in NE Thailand? British Journal of Nutrition, 2006. 97: p. 167-175.
90. Rivera, J., et al., The Effect of Micronutrient Deficiencies on Child Growth: A Review of
Results from Community-Based Supplementation Trials. Journal of Nutrition, 2003. 133:
p. 4010S-4020S.
91. Siyame, E., Hurst, E., Wawer, AA., Young, SD., Broadley, MR., Chilimba, ADC.,
Ander, LE., Watts, MJ., Chilima, B., Gondwe, J., Kang'ombe, D., Kalimbira, A.,
Fairweather-Tait, SJ., Bailey, KB., Gibson, RS., A high prevalence of zinc- but not iron-
deficiency among women in rural Malawai: a cross-sectional study. Int J Vitam Nutr
Res, 2013. 83(3): p. 176-187.
92. Fahmida, U., et al., Zinc-iron, but not zinc-alone aupplementation, increased linear
growth of stunted infants with low haemoglobin. Asia Pac J Clin Nutr, 2007. 16(2): p.
301-9.
93. Christian, P., et al., Effects of prenatal multiple micronutrient supplementation on growth
and cognition through 2 y of age in rural Bangladesh: the JiVitA-3 Trial. Am J Clin
Nutr., 2016. 104(4): p. 1175-1182.
94. Shariff, Z., et al., Higher dietary energy density is associated with stunting but not
overweight and obesity in a sample of urban Malaysian children. Ecol Food Nutr, 2016.
55(4): p. 379-89.
181
95. Maleta, K., Phuka, J., Alho, L., Cheung, YB., Dewey, KG., Ashorn, U., Phiri, N., Phiri,
TE., Vosti, SA., Zeilani, M., Kumwenda, C., Bendabenda, J., Pulakka, A., and Ashorn, P.
, Provision of 10-40 g/d lipid-based nutrient supplements from 6 to 10 months of age dies
not prevent linear growth faltering in Malawi. J Nutr, 2014. 145: p. 1909-15.
96. Ashorn, P., Alho, L., Ashorn, U., Cheung, YB., Dewey, KG., Gondwe, A., Harjunmaa,
U., lartey, A., Phiri, TE., Vosti, SA., Zeilani, M., Maleta, KM., , Supplementation of
maternal diets during pregnancy and for 6 monhts postpartum and infant diets thereafter
with small-quantity lipid-based nutrient supplements does not promote child growth by
18 months of age in rural Malawi: a randomized controlled trial. J Nutr, 2014. 145: p.
1345-53.
97. Phuka, J., et al., Postintervention growth of Malawian children who received 12-mo
dietary complementation with a lipid-based nutrient supplement or maize-soy flour. Am J
Clin Nutr., 2009. 89: p. 382-90.
98. USAID. Feed the Future, Malawi. 2013 [cited 2013 08/10/2013]; Available from:
http://www.feedthefuture.gov/country/malawi.
99. DHS, Sampling and Household Listing Manual. 2012, ICF International. Calverton, MD
USA.
100. Vaessen, M., Thiam, M., Le, T., The Demographic and Health Surveys, in Household
Sample Surveys in Developing and Transition Countries. 2005. p. 495-522.
101. Aliaga, A.R.R., Optimal sample sizes for two-stage cluster sampling in Demographic and
Health Surveys. DHS working papers, 2006. No. 30.
102. WHO, Nutrition Landsccape Information System (NLIS) country profile indicators:
interpretation guide. 2010, World Health Organization: Geneva.
103. Kothari, M.T., S.O. Rutsetin, and J.K. Sangha, Where the standard makes the difference
in the real world of malnutrition: analysis of 10 countries with DHS data. 2009.
104. Wang, R.J., et al., Large-scale survey of Cryptosporidium spp. in chickens and Pekin
ducks (Anas platyrhynchos) in Henan, China: prevalence and molecular
characterization. Avian Pathology, 2010. 39(6): p. 447-451.
105. Black, R.E., et al., Incidence and etiology of infantile diarrhea and major routes of
transmission in Huascar, Peru. Am J Epidemiol, 1989. 129(4): p. 785-99.
106. Rutstein, S.O. and K.B. Johnson, The DHS Wealth Index. 2004, DHS Comparative
Reports, ORC Macro: Calverton, Maryland.
107. Ballard, T., et al., Household Hunger Scale: Indicator Definition and Measurement
Guide. . Food and Nutrition Technical Assistance II Project, FHI 360: Washington, DC,
2011.
108. III., F., FFP Indicators Handbook Part I: Indicators for Baseline and Final Evaluation
Surveys. Food and Nutrition Technical Assistance III Project (FANTA III), 2015., 2015.
109. Ikeda, N., Y. Irie, and K. Shibuya, Determinants of reduced child stunting in Cambodia:
analysis of pooled data from three demographic and health surveys. Bull World Health
Organ, 2013. 91(5): p. 341-9.
110. Subramanian, S.V., et al., Association of maternal height with child mortality,
anthropometric failure, and anemia in India. JAMA, 2009. 301(16): p. 1691-701.
111. Ozaltin, E., K. Hill, and S.V. Subramanian, Association of maternal stature with offspring
mortality, underweight, and stunting in low- to middle-income countries. JAMA, 2010.
303(15): p. 1507-16.
112. McDonald, C.M., et al., Predictors of stunting, wasting and underweight among
Tanzanian children born to HIV-infected women. Eur J Clin Nutr, 2012. 66(11): p. 1265-
76.
113. Willey, B.A., et al., Socio-economic predictors of stunting in preschool children--a
population-based study from Johannesburg and Soweto. S Afr Med J, 2009. 99(6): p.
450-6.
182
114. Arimond, M. and M.T. Ruel, Dietary diversity is associated with child nutritional status:
Evidence from 11 Demographic and Health Surveys. Journal of Nutrition, 2004. 134(10):
p. 2579-2585.
115. de Onis M, B.F., Childhood stunting: a global perspective. Maternal and Child Nutrition,
2016. 12(Suppl. 1): p. 12-26.
116. de Onis M, B.M., Borghi E., Prevalence and trends of stunting among pre-school
children, 1990–2020. Public Health Nutrition, 2011: p. 1-7.
117. Akombi BJ, A.K., Merom D, Renzaho AM, and Hall JJ., Child malnutrition in sub-
Saharan Africa: A meta-analysis of demographic and health surveys (2006-2016). PLoS
ONE, 2017. 11(12(5)): p. e0177338.
118. Remans R, P.P., Fanzo JC, Chen, J, Palm CA, and the Millennium Villages Study Group,
Multisector intervention to accelerate reductions in child stunting: an observational
study from 9 sub-Saharan African countries. Am J Clin Nutr, 2011. 94(6): p. 1632-42.
119. Jamison, D., et al., Disease and mortality in sub-Saharan Africa. 2006, The World Bank:
Washington, DC.
120. Prendergast, A. and J. Humphrey, The stunting syndrome in developing countries.
Paediatrics and International Child Health, 2014. 34(4): p. 250-65.
121. Hong, R., Effect of economic inequality on chronic childhood undernutrition in Ghana.
Public Health Nutrition, 2007. 10(4): p. 371-378.
122. Rabbani A, K.A., Yusuf S, and Adams A., Trends and determinants of inequities in
childhood stunting in Bangladesh from 1996/7 to 2014. International Journal for Equity
in Health, 2016. 15(186).
123. WHO., World Health Organization (WHO) Child Growth Standards. 2006.
124. Macro, N.S.O.N.a.I., Malawi Demographic and Health Survey 2010, 2011.
125. Penny, M., Micronutrients in the treatment of stunting and moderate malnutrition, in
Nestlé Nutr Inst Workshop Series. 2012: Basel, Switzerland. p. 11-21.
126. K, M., Undernutrition Malawi Medical Journal 2006. 18(4): p. 189-205.
127. Thakwalakwa C, P.J., Flax V, Maleta K, and Ashorn P., Prevention and treatment of
childhood malnutrition in rural Malawi: Lungwena nutrition studies. Malawi Medical
Journal, 2009. 21(3): p. 116-119.
128. Patwari, A., S. Kumar, and J. Beard, Undernutrition among infants less than 6 months
ofage: an underestimated public health problem in India. Maternal and Child Nutrition,
2013. 11: p. 119-126.
129. Baker, S., R. Baker, and A. Davis, Pediatric nutrition support. 2007: Jones and Bartlett
Publishers, Inc.
130. Ruel, M. and P. Menon, Child Feeding Practices Are Associated with Child Nutritional
Status in Latin America: Innovative Uses of the Demographic and Health Surveys. J
Nutr, 2002. 132: p. 1180-1187.
131. Dewey KG, a.H.S., Maternal, infant, and young child nutrition: combining efforts to
maximize impacts on child growth and micronutrient status. Food and Nutrition Bulletin,
2009. 30: p. S187-189.
132. Mussa, R., Poverty in Malawi: Policy Analysis with Distributional Changes, in Munich
Personal RePEc Archive. 2017.
133. Masibo PK, a.M.D., Trends and determinants of undernutrition among young Kenyan
children: Kenya Demographic and Health Survey; 1993, 1998, 2003 and 2008–2009.
Public Health Nutrition, 2012. 15(9): p. 1715-1727.
134. Kumchulesi, G., Persistence of Child Malnutrition in Malawi: Explanations from
Demographic and Health Surveys. Journal of African Development, 2017. 16: p. 69-75.
135. Black RE, V.C., Walker SP, Bhutta ZA, Christian P, de Onis M, et al., Maternal and
child undernutrition and overweight in low-income and middle-income countries. Lancet,
2013. 382: p. 427-451.
183
136. Wamani H, A.A., Peterson S, Tumwine JK, and Tylleskar, T. , Boys are more stunted
than girls in Sub-Saharan Africa: a meta-analysis of 16 demographic and health surveys.
BMC Pediatrics, 2007. 7(17): p. 1-10.
137. Feed the Future, U. Multi-year Strategy - Malawi. 2013 08/08/2013]; Available from:
http://www.feedthefuture.gov/sites/default/files/country/strategies/files/MalawiFTFMulti-
YearStrategy.pdf.
138. IFPRI. Global Nutrition Report 2016: From Promise to Impact: Ending Malnutrition by
2030. 2016.
139. Goudet, S., Griffiths, PL., Bogin, BA., and Madise, NJ., Nutritional interventions for
preventing stunting in children (0 to 5 years) living in urban slums The Cochrane
Collaboration, 2015.
140. K., M., Undernutrition Malawi Medical Journal 2006. 18(4): p. 189-205.
141. Saaka, M., et al., How well do WHO complementary feeding indicators relate to
nutritional status of children aged 6–23 months in rural Northern Ghana? MBMC Public
Health, 2015. 15(1157).
142. Maleta, K., et al., Childhood malnutrition and its predictors in rural Malawi. Pediatric
and Perinatal Epidemiology 2003. 17(4): p. 384-390.
143. Felisbino-Mendes, M., E. Villamor, and G. Velasquez-Melendez, Association of
Maternal and Child Nutritional Status in Brazil: A Population Based Cross-Sectional
Study. Maternal and Child Nutrition, 2014. 9(1): p. e87486.
144. Luby, S., et al., Effects of water quality, sanitation, handwashing, and nutritional
interventions on diarrhoea and child growth in rural Bangladesh: a cluster randomised
controlled trial. The Lancet Global Health, 2018. 6(3): p. e302-e315.
145. Cumming, O. and S. Cairncross, Can water, sanitation and hygiene help eliminate
stunting? Current evidence and policy implications. Matern Child Nutr, 2016. 12((Suppl
1)): p. 91-105.
146. Peters, P. and M. and Herrera, Tobacco Cultivation, Food Production, and Nutrition
among Smallholders in Malawi." In Agricultural Commercialization, Economic
Development, and Nutrition. Washington DC: International Food Policy Research
Institute. , 1994: p. 309–327.
147. Wood, B. and C. and Nelson, Up in Smoke? Agricultural Commercialization, Rising
Food Prices and Stunting in Malawi. . World Bank Policy Research Working Paper
2013. 6650: p. Washington DC: World Bank.
148. Felisbino-Mendes, M., Vilamor, E., Velasquez-Melendez, G., Association of maternal
and child nutritional status in Brazil: A population based cross-sectional study. PLoS
ONE, 2014. 9(1: e87486).
149. Surkan, P., et al., Maternal depression and early childhood growth in developing
countries: systematic review and meta-analysis. Bull World Health Organ., 2011. 89(8):
p. 608-15.
150. Chadoka-Mutanda, N., Gender based Violence and Child Survival: Exploring the
association between domestic violence and Child health consequences in three sub-
Saharan Africa Countries. 2018.
151. Ziaei, S., R. Naved, and E. Ekstrom, Women's exposure to intimate partner violence and
child malnutrition: findings from demographic and health surveys in Bangladesh. Matern
Child Nutr, 2012. 10(3): p. 347-359.
152. Denning, G., Kabambe, P., Sanchez, P., Malik, A., Harawa, R., Nkhoma, P., Zamba, C.,
Banda, C., Magombo, C., Keating, M., Wangila, J., Sachs, J. , Input subsidies to improve
smallholder maize productivity in Malawi: Toward an african green revolution. PLoS
Biol, 2009. 7(1:e1000023).
153. Aneseuw, W., et al., The Quiet Rise of Medium-Scale Farms in Malawi. Land, 2016.
5(19).
184
154. Dickinson, N., et al., A framework to explore micronutrient deficiency in maternal and
child health in Malawi Southern Africa. Environmental Health, 2009. 8(Suppl I): p. S13.
155. Chikhungu, L. and N. Madise, Seasonal variation of child under nutrition in Malawi: is
seasonal food availability an important factor? Findings from a national level cross-
sectional study. BMC Public Health, 2014. 14: p. 1146.
156. Rah, J., et al., Low Dietary Diversity Is a Predictor of Child Stunting in Rural
Bangladesh. European Jr Clin Nutr, 2010. 64(12): p. 1393-8.
157. Bank, W., Nutrition at a Glance - Malawi.
158. Rowland, M., T. Cole, and R. Whitehead, A quantitative study into the role of infection in
determining nutritional status in Gambian village children. British Journal of Nutrition,
1977. 37(441-450).
159. Verhoef, H., et al., Stunting May Determine the Severity of Malaria-Associated Anemia
in African Children. Pediatrics, 2002. 110(4).
160. Kolsteren, P., The determinants of stunting: Can we regard the linear growth
performance as a continuum of fetal development? . Asia Pacific Journal of Public
Health, 1996. 5: p. 59-69.
161. Martins, J., et al., Long-Lasting Effects of Undernutrition. Int. J. Environ. Res. Public
Health, 2011. 8: p. 1817-1846.
162. Bhutta ZA, D.J., Rizvi A, Gaffey MF, Walker N, Horton S, Webb P, Lartey A, Black RE,
Lancet Nutrition Interventions Review Group; Maternal and Child Nutrition Study
Group. Evidence-based interventions for improvement of maternal and child nutrition:
what can be done and at what cost? Lancet, 2013. 382(4): p. 52-77.
163. Elmadfa, I. and M. AL., Developing Suitable Methods of Nutritional Status Assessment:
A Continuous Challenge. Advances in Nutrition 2014. 5: p. 590S-598S.
164. Brown, M., et al., Climate Change, Global Food Security, and the U.S. Food System.
USDA, 2015: p. 1-278.
165. Bhutta, Z., Ahmed, T., Black, RE., Cousens, S., Dewey, K., Giuhliani, M., et al What
works? Interventions for maternal and child undernutrition and survival. Lancet, 2008.
371(9610): p. 417-440.
166. Hoddinott, J.Y.Y., Dietary diversity as a household food security indicator. Food and
Nutrition Technical Assistance Project, Academy for Educational Development. , 2002.
167. FAO, Guidelines for measuring household and individual dietary diversity. 2011.
168. Moursi, M.M., et al., Dietary diversity is a good predictor of the micronutrient density of
the diet of 6- to 23-month-old children in Madagascar. J Nutr, 2008. 138(12): p. 2448-53.
169. Steyn, N.P., et al., Food variety and dietary diversity scores in children: are they good
indicators of dietary adequacy? Public Health Nutr, 2006. 9(5): p. 644-50.
170. Smith, L., et al., The Importance of Women’s Status for Child Nutrition in Developing
Countries. International Food Policy Research Institute, 2003. Research Report 3.
171. Malapit, H., et al., Women’s Empowerment Mitigates the Negative Effects of Low
Production Diversity on Maternal and Child Nutrition in Nepal. The Journal of
Development Studies, 2015. 51(8): p. 1097-1123.
185