abstract title of thesis: site-directed mutagenesis of groel
TRANSCRIPT

ABSTRACT Title of Thesis: SITE-DIRECTED MUTAGENESIS OF GROEL: DEVELOPING A SYSTEM FOR MONITORING ALLOSTERIC MOVEMENTS BY FLUORESCENCE RESONANCE ENERGY TRANSFER
Yu Yang, Master of Science, 2006
Thesis directed by: Professor George H. Lorimer
Department of Chemistry and Biochemistry
The Escherichia coli chaperonin protein GroEL can assist protein folding to its
native state through the consumption of ATP. Accompanying this process, GroEL
undergoes structural change, resulting in an expansion of the central cavity. Monitoring
apical domain movement by fluorescence resonance energy transfer (FRET) between two
mobile apical fluorophores, can provide information about the GroEL allosteric
transitions. To reach this goal, the three native cysteine residues on each subunit of wild
type GroEL were removed and a new cysteine site in the apical domain was introduced
by site-directed mutagenesis. Fluorescent probes were attached to the cysteine residues,
allowing us to perform FRET experiments. The observed change of FRET efficiency (E)
reported the GroEL structural changes.

SITE-DIRECTED MUTAGENESIS OF GROEL: DEVELOPING A SYSTEM FOR MONITORING ALLOSTERIC MOVEMENTS BY FLUORESCENCE RESONANCE ENERGY TRANSFER
By Yu Yang Thesis submitted to the Faculty of the Graduate School of the University of Maryland, College Park in partial fulfillment of the requirements for the degree of Master of Science 2006 Advisory Committee: Dr. George H. Lorimer, Chair Dr. Dorothy Beckett Dr. Douglas Julin

© Copyright by Yu Yang 2006

ACKNOWLEDGMENTS The following thesis was completed through the insights and direction of several
people.
Firstly, deep thanks to my mentor, Dr. George Lorimer, whose encouragement,
scientific attitude, patience and financial support guided me during my graduate study,
the research and writing of the thesis. His kindness made my experience in this lab a
happy one. I am personally very fortunate to have him as my graduate supervisor.
Secondly, I thank my committee members, Dr. Beckett and Dr. Julin, who taught me
the required courses that prepared me to commence this thesis.
Special thanks to Sarah C. Wehri. For me, she is a classmate, friend, colleague and
teacher. For many fluorescent experiments, she guided me, closely looked at the results
and gave me lots of useful suggestions. She also served as the first editor for this thesis
with critical thoughts. Without her, it would not have been possible to complete this
thesis. Her help is highly appreciated.
In addition, I thank Dr. Asha Acharya, who used her scientific experience to solve
my problems in the lab. She also was the reader for this document to check English
grammar and style. She’s a friendly colleague. Thanks for her help and valuable hints.
I would like to thank Patrick Kates, who taught me the necessary techniques in this
lab in the beginning. I also thank Patrick Schmidlein, Seth Yandrofski and Zhechun
Zhang for their friendship.
Finally I would like to thank my family for their support. My parents, Yunmei Yang
and Dengfeng Li, were always giving me encouragement and strength. My husband
Dongyu Guo supported me deeply. His patience, love and encouragement helped me to
ii

complete this project. Thanks to my daughter Jie Guo for her deep understanding and
love and my son Ryan Yang Guo’s cooperation. I am truly thankful to have them in my
life.
iii

TABLE OF CONTENTS List of Figures …………………………………………………………………………vi
List of Tables ………………………………………………………………………….xi
List of Abbreviations …………………………………………………………………..x
Chapter 1: Introduction ………………………………………………………………1 1.1 Why does protein folding require GroEL ………………………………...2 1.2 Basic structure of GroEL …………………………………………………2 1.3 Basic structure of GroES …………………………………………………4 1.4 GroEL/ES complex structure …………………………………………….5 1.5 GroE reaction cycle ………………………………………………………6 1.5.1 SP binding ……………………………………………………..6 1.5.2. Nucleotide and GroES binding ………………………………..8 1.5.3. ATP hydrolysis and polypeptide releasing ……………………9 1.5.4. GroES and ADP release …………………………...................10 1.6 Allosteric states change …………………………………………………10 1.7 Study goal ……………………………………………………………… 12 Chapter 2: Materials and Equipment ……………………………………………….13 2.1 Materials ………………………………………………………………..14 2.2 Equipments ……………………………………………………………..15 Chapter 3: General methods ………………………………………………………..16 3.1 Site-directed mutagenesis for GroEL and GroEL(sr) mutants …………17 3.2 Purification for GroEL(wt) ……………………………………………..21 3.3 Purification for GroEL mutants ………………………………………...24
3.4 Purification for GroES(wt) ……………………………………………..24 3.5 Labeled methods ………………………………………………………..25
3.5.1 GroEL mutants labeled with donor and acceptor …………...25 separately 3.5.2 GroEL mutants or GroEL(wt) labeled with donor following ..27 by labeling with acceptor 3.5.3 GroEL mutants labeled with acceptor following by labeling ..27 with donor
3.5.4 Co-mingling for GroEL mutant labeled with donor only ……27 and GroEL mutant labeled with acceptor only
3.6 FRET experiment ……………………………………………………… 28 Chapter 4: Example of mutagenesis result …………………………………………30 Chapter 5: FRET results and Discussion …………………………………………..32 5.1 Introduction of FRET …………………………………………………..33 5.1.1 The equation of FRET efficiency ……………………………33
iv

5.1.2 Theoretical FRET efficiencies of F5M and TMR, Cy3 …….33 and Cy5, Alexa fluor 488 and Alexa fluor 546
5.2 Distance changes for adjacent and “2-removed” pairs on GroEL …….35 cis ring from T state to R and R’ states 5.3 GroEL(wt) may be labeled with fluorescent probes under some ……...38 labeling condition 5.4 GroEL(wt)K242C/N527C may not be the best mutant for monitoring ……..39 the GroEL allosteric transition 5.5 No FRET occurs between individual GroEL molecules: shown ……...42 by a simple mixing experiment of GroEL(wt)K242C-F5M and GroEL(wt)N527C-TMR 5.6 There was some donor (and acceptor) emission peak shifting from …..42 FRET spectra of GroEL(wt)K242C and GroEL(cf) K242C mutants 5.7 Positions of 242 and 138 might be a pair which could be labeled …….45 with donor and acceptor to monitor allosteric transition 5.8 The fluorescent pair of F5M and TMR is not a suitable pair ………….45 for some GroEL mutants 5.9 Cy3 and Cy5, Alexa fluor 488 and Alexa fluor 546 are good labeling ..47 dyes for the GroEL system
Chapter 6: Summary ………………………………………………………………49 Appendix: The mutagenesis results for the remaining GroEL mutants …………..51 A.1 GroEL(wt)K242C mutant ……………………………………………….51 A.2 GroEL(wt)N527C mutant ……………………………………………….52 A.3 GroEL(wt)K242C/N527C mutant …………………………………………53 A.4 GroEL(wt)K242C/C458A mutant …………………………………………54 A.5 GroEL(wt)K242C/C458A/C519A mutant …………………………………....55 A.6 GroEL(wt)C138S mutant ……………………………………………….56 A.7 GroEL(wt)C138S/C519S mutant ………………………………………….57 A.8 GroEL(cf) mutant …………………………………………………….58 A.9 GroEL(cf)E315C mutant ………………………………………………..59 A.10 GroEL(cf)S217C mutant ………………………………………………..60 A.11 GroEL(cf)K321C mutant ……………………………………………….61 A.12 GroEL(sr)C138S mutant ………………………………………………. 61 A.13 GroEL(sr)C138S/C519S mutant …………………………………………..62 A.14 GroEL(sr)C138S/C519S/C458S mutant ……………………………………..62 A.15 GroEL(sr)C138S/C519S/C458S/E315C mutant ………………………………..63 A.16 GroEL(sr)C138S/C519S/C458S/S217C mutant ………………………………..64 A.17 GroEL(sr)C138S/C519S/C458S/K321C mutant ………………………………..64 Reference ……………………………………………………………………………65
v

LIST OF FIGURES 1-1 Overall architecture and dimensions of GroEL ………………………………..3 1-2 Ribbon drawing of one subunit in the GroES ring …………………………….4 1-3 Overall architecture and dimension of the GroEL–GroES “Bullet” …………..5 complex 1-4 The GroE Reaction Cycle ……………………………………………………..6 1-5 GroEL allosteric states change promoted by ATP and unfolded SP ………...11 3-1 Relationships among GroEL(wt) plasmid and its mutants plasmids ………….17
(top) and GroEL(sr) plasmid and its mutants plasmids (bottom) 3-2 Chemical reaction of a Cys residue with a maleimide ………………………..25 3-3 Statistical re-assembly to give an ensemble of GroEL 14 mers ………………27 4. Result for mutagenesis of GroEL(cf)K242C digested with BseYI. ……………..31 5-1 Absorption (dotted line) and fluorescence emission (solid line) of three ……34 pairs of probes 5-2 Computed FRET efficiencies for different distances between donor and …...35 acceptor and the three pairs: F5M and TMR; Cy3 and Cy5; Alexa fluor 488 and Alexa fluor 546 5-3 Scheme of adjacent subunits and “2-removed” subunits on a ring ………….36 5-4 Distance change for GroEL cis ring residues on two adjacent or …………...37 “2-removed” subunits 5-5 Original FRET spectra for GroEL(wt) labeled with F5M and TMR ………...38 at pH7.5 5-6 Normalized FRET spectra for GroEL(wt) labeled with F5M and TMR ……39
at pH7.2 5-7 Positions of the two sites mutated to Cys ……………………………………40 5-8 Normalized FRET spectra for GroEL(wt)K242C/N527C labeled with ………….. 40 F5M and TMR
vi

5-9 Normalized FRET spectra for GroEL(wt)K242C/N527C labeled with ……………41 Cy3 and Cy5 5-10 Original FRET spectra for the mixture GroEL(wt)K242C labeled with ………..42 F5M and GroEL(wt)N527C labeled with TMR 5-11 Normalized FRET spectra for GroEL(wt)K242C labeled with F5M and ………43 TMR by Method D’A’ 5-12 Normalized FRET spectra for GroEL(cf)K242C labeled with F5M and ………43 TMR by Method D’A’ 5-13 Normalized FRET spectra for GroEL(cf)K242C labeled with F5M and ………44 TMR by co-mingling 5-14 Normalized FRET spectra for GroEL(cf)K242C labeled with F5M and ………44 TMR upon SP addition 5-15 Normalized FRET spectra for GroEL(wt)K242C/C458A/C519A labeled with ……...45 F5M and TMR 5-16 Normalized FRET spectra for GroEL(cf)E315C labeled with F5M by ………..46 Method B’ 5-17 Original FRET spectra for GroEL(cf)E315C labeled with TMR by ……………46 Method B’ 5-18 Normalized FRET spectra for a simple mixture of GroEL(cf)E315C -F5M …...47 and GroEL(cf)E315C -TMR 5-19 Normalized FRET spectra for GroEL(cf)E315C labeled with Alexa …………..48 fluor 488 and Alexa fluor 546 by co-mingling A-1. Result for mutagenesis of GroEL(wt)K242C digested with FspI ……………….51 A-2 Result for mutagenesis of GroEL(wt)N527C digested with PvuII ……………...52 A-3 Result for mutagenesis of GroEL(wt)K242C/N527C digested with PvuII ………..53 A-4 Result for mutagenesis of GroEL(wt)K242C/C458A digested with NaeI ………...54
A-5 Result for mutagenesis of GroEL(wt)K242C/C458A/C519A digested with NsiI …....55
A-6 Result for mutagenesis of GroEL(wt)C138S and GroEL(sr)C138S digested …….56
with BseYI
vii

A-7 Result for mutagenesis of GroEL(wt)C138S/C519S and GroEL(sr)C138S/C519S ……57
Digested with Nco I
A-8 Result for mutagenesis of GroEL(cf) digested with EcoRI ……………………58 A-9 Result for mutagenesis of GroEL(cf)E315C digested with Bln I ………………...59 A-10 Result for mutagenesis of GroEL(cf)S217C and ………………………………...60 GroEL(sr)C138S/C519S/C458S/S217C digested with Bsm I A-11 Result for mutagenesis of GroEL(cf)K321C and GroEL(sr)C138S/C519S/C458S/K321C..61
digested with Stu I A-12 Result for mutagenesis of GroEL(sr)C138S/C519S/C458S digested with EcoRI …….62 A-13 Result for mutagenesis of GroEL(sr)C138S/C519S/C458S/E315C digested with Bln I …63
viii

LIST OF TABLES 2-1 Material list ……………………………………………………………………14 2-2 Equipment list …………………………………………………………………15 3-1 Information about template, primers and restriction enzyme for each ………..18 mutagenesis 3-2 Some properties of the donors and acceptors used in this thesis ………………25
ix

LIST OF ABBREVIATIONS α-LA α-lactalbumin (bovine) E fluorescence resonance energy transfer efficiency FPLC fast protein liquid chromatography FRET fluorescence resonance energy transfer GroEL(wt) wild type GroEL containing three cysteines at 138, 458 and 519 GroEL(cf) cysteine free GroEL GroEL(sr) single ring GroEL containing R452E, E461A, S463A and V464A at the equatorial plate Rubisco ribulose bisphosphate carboxylase SDS-PAGE sodium dodecyl sulfate - polyacrylamide gel electrophoresis SP substrate protein
x

Chapter 1
Introduction
1

1.1 Why does protein folding require GroEL
Functional proteins have their characteristic unique three-dimensional
conformations or structures (1). The protein’s linear sequence of amino acids contains all
the structural information required for it to fold to its biologically active state (32). The
accurate transfer of information from DNA to protein depends on the cell’s ability to
perform a complex process at high speed with no mistakes. For some proteins, correct
spontaneous folding does not occur in vivo, so the process requires error corrections.
Cells have developed some proteins to assist other proteins to fold properly (32). These
assisting proteins are called chaperonins.
The chaperonins are a subgroup of molecular chaperones, the best studied of which in
mechanism and structure is Escherichia coli GroEL (hsp60) (49). It is thought that
GroEL binds nonnative polypeptide substrate via hydrophobic interactions. In the
presence of co-chaperonin GroES and ATP, the polypeptide substrate is enclosed in a
microenvironment that is thermodynamically favorable for correct protein folding. Upon
hydrolyzing ATP, the properly folded polypeptide is released from the chaperone (58).
Most SPs require multiple rounds of binding and release.
1.2 Basic structure of GroEL
GroEL is a homo-oligomer with 547 amino acids (22). It contains 2 rings stacked
back to back (39). Each ring is composed of seven identical 57-kDa subunits (47) (Figure
1-1).
2

Figure 1-1. Overall architecture and dimensions of GroEL. van der Waals space-filling models (6Å
spheres around C ) of GroEL. Left is outside view, showing outer dimension; Right shows the inside of
the assembly and was generated by slicing off the front half with a vertical plane that contains the
cylindrical axis. Various colors are used to distinguish the subunits of GroEL in the upper ring. The
domains are indicated by shading: equatorial, dark hue; apical, medium hue; intermediate, light hue. The
lower GroEL ring is uniformly yellow. (Figure from Sigler, Xu et al. 1998).
Each GroEL monomer contains three distinctive domains (56):
1). The equatorial domain provides residues for the inter- and intra-ring interactions
of the protein complex and contains the ATPase site on the inner sides of the GroE
cylinder.
2). The apical domain is less well organized and more locally flexible than the
equatorial domain. It contains the SP and GroES binding sites.
3). The intermediate domain connects the equatorial domain and the apical domain
(20,47).
The crystal structure of GroEL has been determined to 2.8 Å (4). GroEL is a hollow,
thick-walled cylinder 135Å in diameter and with height of 145Å, containing a central
cavity. The electron microscopy indicated that the GroEL oligomeric complex is
3

composed of two seven-subunit rings, arranged with nearly exact sevenfold rotational
symmetry (47).
1.3 Basic structure of GroES
GroES is composed of 7 identical 10-kDa subunits (Figure 1-2).
Figure 1-2. Ribbon drawing of one subunit in the GroES ring. (Figure from Xu 1997).
The crystal structure of GroES displays a dome-shaped architecture with outside
dimensions of 70-80 Å in diameter, a height of 30 Å. The inside dimensions measure 30
Å in diameter and 20 Å in height (20). A core β-barrel structure with two β-hairpin loops
is found in each of the seven subunits. One of the two β-hairpin loops stands upward and
inward at the top of the dome, enclosing the structure. The other is a disordered and
unstructured mobile loop (Glu 16 to Ala 32) at the bottom of the GroES heptamer. The
second loop is implicated in GroEL-GroES binding.
4

1.4 GroEL/ES complex structure
In general, GroES binds to GroEL with 1:1 ratio (1 GroES7 per 1 GroEL14). The
asymmetric GroES7-GroEL14 complex (Figure 1-3) is referred to as “bullet” (46).
Figure 1-3. Overall architecture and dimension of the GroEL–GroES “Bullet” complex. van der
Waals space-filling model of the entire complex in a side view . The complex is colour
coded as follows: trans GroEL ring, red; cis GroEL ring, green; GroES, gold. (Figure
from Xu & Horwich et al. 1997).
The symmetric complex GroES7-GroEL14- GroES7 is referred to as a “football” (46).
Even though the role of the “football” complex in the GroE reaction cycle is disputed,
several hypotheses have provided an explanation for its involvement in SP folding (2,12).
5

1.5 The GroE reaction cycle
It was found that ATP, Mg and K+ are very important and necessary effectors in the
GroE cycling mechanism (18,52). The GroEL reaction cycle (Figure 1-4) is described as
following:
ADP
ADP
ADP
ADP
ATP
ATP ATP
+GroES, ATP
+GroES
+ATP +Misfolded
SP
ATP Hydrolysis
Release of
GroES and SP
Figure 1-4. The GroE Reaction Cycle. Blue is GroEL, orange GroES, red SP (SP). The events depicted
are described in the text. Bracket means this “football” which is unclear for its role in the cycle. (Figure
from Grason 2003).
1.5.1. SP binding
GroEL facilitates a wide variety of unfolded or partially unfolded proteins to fold
correctly. Binding of non-native protein to GroEL also prevents aggregation. GroEL has
no affinity for native SPs. Without chaperonin non-native subunits of Rubisco aggregate,
6

whereas in the presence of GroEL a stoichiometric complex was formed that facilitated
the production of native Rubisco upon addition of ATP/GroES (49).
Substrates cannot be exchanged across the equatorial plane between the two cavities.
The polypeptide binding sites lie at the inner top rim of the apical domains. The sites
necessary for polypeptide binding have been identified by mutational analyses (15). Nine
residues in helices H and I and a loop between strand 6 and 7 are indispensable. Nonpolar
side chains from eight of the nine residues face the central cavity in the unliganded
GroEL structure (15). Therefore, along the inner edge of its apical cavities GroEL
exhibits a ring of hydrophobic binding surface. The role of hydrophobicity in polypeptide
binding has been examined and confirmed not only from the standpoint of GroEL but
with a number of SPs (31). A negative heat capacity change was detected by isothermal
titration calorimetry when a stably unfolded version of substilisin bound to GroEL,
indicating occurrence of hydrophobic interactions. Other experiments also conclude that
a maximum exposure of hydrophobic surface in nonnative peptide favors its binding to
GroEL (53). Besides the hydrophobic interactions, to some extent electrostatic
interactions also play role in substrate binding (37).
The volume of the GroEL cavity is limited to SPs of less than 70 kDa. The access
size for nonnative polypeptides would be slightly smaller. However, proteins larger than
100 kDa may form stable binary complexes with GroEL because at this stage of binding
a substantial part of bound peptide protrudes outside the cavity (49). A pair of parallel α-
helices of the apical domain form a flexible groove in which polypeptides bind. This
groove is different in the structure of unliganded GroEL, GroEL/peptide complexes, or
GroEL in complex with GroES and ADP (57).
7

1.5.2. Nucleotide and GroES binding
The binding of MgATP to the active site in the equatorial domain of GroEL triggers
a series of concerted, rigid-body, domain movements that are amplified in the presence of
GroES (58). The volume of the centrol cavity of GroEL also doubles by these
conformational changes. At the same time, a bound SP is released and encapsulated by
the cavity (57). The structural transition initiated by the binding of nucleotide also
enables the binding of GroES to the former substrate binding sites. A
GroEL14/GroES7/ATP7 cis complex is thus formed. This GroEL14/GroES7/ATP7 cis
complex is a folding active species in the GroE cycle (20). The binding of GroES to
GroEL/ATP7 occurs very rapidly (>4 x 10⁷ M-1s-1) after the ATP-induced conformational
change (7).However, the association of GroES to a GroEL/ADP7 is slower (1 x 10⁵ M-1s-1)
(27). During this rearrangement the walls of the cavity change their character from
hydrophobic to hydrophilic, thus giving polypeptides the chance to fold without
intermolecular interactions (57). Binding of nucleotide and GroES to one ring weakens
the binding of ATP and GroES to the opposite ring, but it does not affect the binding of a
SP to the trans ring (58).
Unlike the major conformational changes occurring in GroEL, the binding of
GroES depends on the twisting of the apical domain relative to the equatorial domain
(48). The number of GroES mobile loops interacting with GroEL in the binding sites has
been studied using a fused 7-mer of GroEL. The experimental results indicated that
GroEL was capable of accommodating as many as 4 mutant subunits in the heptametric
ring without diminishing the yield of GroEL-GroES complex (50). Although SPs and
8

GroES share common binding sites, it seems that SPs only binds to a subset of the 7
available sites, which leaves the remaining sites available for interaction with the mobile
loops of GroES (49). As a result of conformational changes, GroES replaces SPs in the
binding sites. The binding of GroES to GroEL also enlarges the volume of the central
cavity to about 170,000 Å3, approximately twofold. This is the ultimate limit to the size
of proteins that can be accommodated. Using multimers of green fluorescent protein,
together with theoretical considerations of packing density, it has been calculated that the
upper limit is approximately 58,000 dalton (49). Upon the binding of GroES to GroEL
the polarity of the surface of the central cavity takes a dramatic change (49). In previous
state the surface was hydrophobic. In contrast, in the GroES binding state the surface
changes to hydrophilic. It remains in this hydrophilic state in the rest of the reaction cycle.
The switch between hydrophobic and hydrophilic states and their duration is sensed by
the SP.
1.5.3. ATP hydrolysis and polypeptide releasing
It is believed that all seven sites are associated with ATP at the in vivo ATP
concentrations (50). Fluorescence anisotropy measurements showed that following
binding of GroES and ATP to a GroEL-polypeptide binary complex to form a cis ATP
complex, SP is released into the central channel within a second (43). ATP hydrolysis at
a rate of 0.12 s-1, occurs in the asymmetric GroEL14/GroES7/ATP7, triggering the ring for
subsequent steps in the cycle (43). The ATP hydrolysis is potassium dependent (50).
While inorganic phosphate is released from the active site, ADP is locked in the active
site, leading to the formation of a GroEL14/GroES7/ADP7 complex (11). Polypeptide
folding is believed to occur during this time and after formation of the cis ADP. SPs only
9

have about 6s to fold into the correct conformation prior to disruption of the folding-
active chaperonin, estimated by the schedule of events on GroEL dictated by ATP
binding and hydrolysis (47). Only a portion of SPs reach their native state during this
period. The remaining nonnative SPs either go into another round GroE cycle or are
degraded by proteases. It is critical for cells to remove damaged proteins, preventing the
clogging of the chaperone machinery (47).
1.5.4. GroES and ADP release
The binding of ATP to the opposite GroEL ring induces the release of bound ADP
and GroES from the cis ring (14). The signal appears to be transferred via the equatorial
domains. The binding of another substrate polypeptide to the trans ring only occurs after
ATP hydrolysis in the cis ring (49). The binding of nonnative polypeptide to the trans
ring enhances the rate of the ATP-dependent ligand release 20-50 fold (43). After GroES
leaves, polypeptide is released. During this process, the volume of the central cavity
contracts from 175,000 Å3 to 85,000 Å3 (49). The hydrophobic surface of the central
cavity is reinstalled. The ADP is released from the active site with the contraction of the
intermediate domain. The rate limit in the GroE ATPase cycle is likely set by the rigid
body movements in the GroE complexes, which are induced by ATP binding and
transferred to the other ring via the equatorial domains (20). The apparent rate for the
whole process is 0.042 s-1 in the absence of SP and about 0.6 s-1 in the presence of SP.
1.6 Allosteric states change
The allostery consideration of GroEL is described by a model of nested
cooperativity (figure 1-5) (58).
10

ATP
R R T
R T T
SP Figure 1-5. GroEL allosteric states change promoted by ATP and unfolded SP. ATP binding to a ring
promotes the transition shift from T state to R state, following positive cooperativity in that ring. ATP can
not bind to the second ring unless all 7 ATPs are hydrolyzed in the first ring, following a negative
cooperativity in that ring. (Figure from Yifrach & Horovitz 1995).
Before ATP binding, a single ring of GroEL is in the tight (T) state with low affinity
for ATP and high affinity for unfolded SP. ATP binds to the single ring at low
concentration (<100µM) results in a transition to relaxed (R) state (TT to TR) with
observed positive cooperativity between subunits of a ring. The negative allostery exists
between two rings. Because of this inter-ring negative cooperativity, the transition of the
TR to RR only exists at relatively higher concentration of ATP (59). In the presence of
GroES, a third allosteric state, R’ state, occurs. GroES binding to the cis ring results in a
large volume increase of the central cavity, forming the “bullet” complex. The increasing
volume of central cavity provides increased hydrophilicity which favors to the SP
folding. GroES “locks” the nucleotide in the cis ring. The nucleotide can not be released
unless ATP binds to the trans ring causing the cis ring complex to dissociate. Besides
11

ATP, it is believed that magnesium ion (Mg2+), potassium ion (K+) also have allosteric
effects on GroEL (51).
1.7 Study goal
The purpose of this thesis is to develop a method to monitor the GroEL structure
change in the presence of SP, ATP and GroES. Since FRET monitors the distance change
between donor and acceptor, the structural change of GroEL may be monitored because
of the rigid body motions it undergoes. Therefore, I created GroEL mutants which can be
labeled with fluorescent probes that can be monitored for GroEL allosteric transition.
12

Chapter 2
Materials and Equipment
13
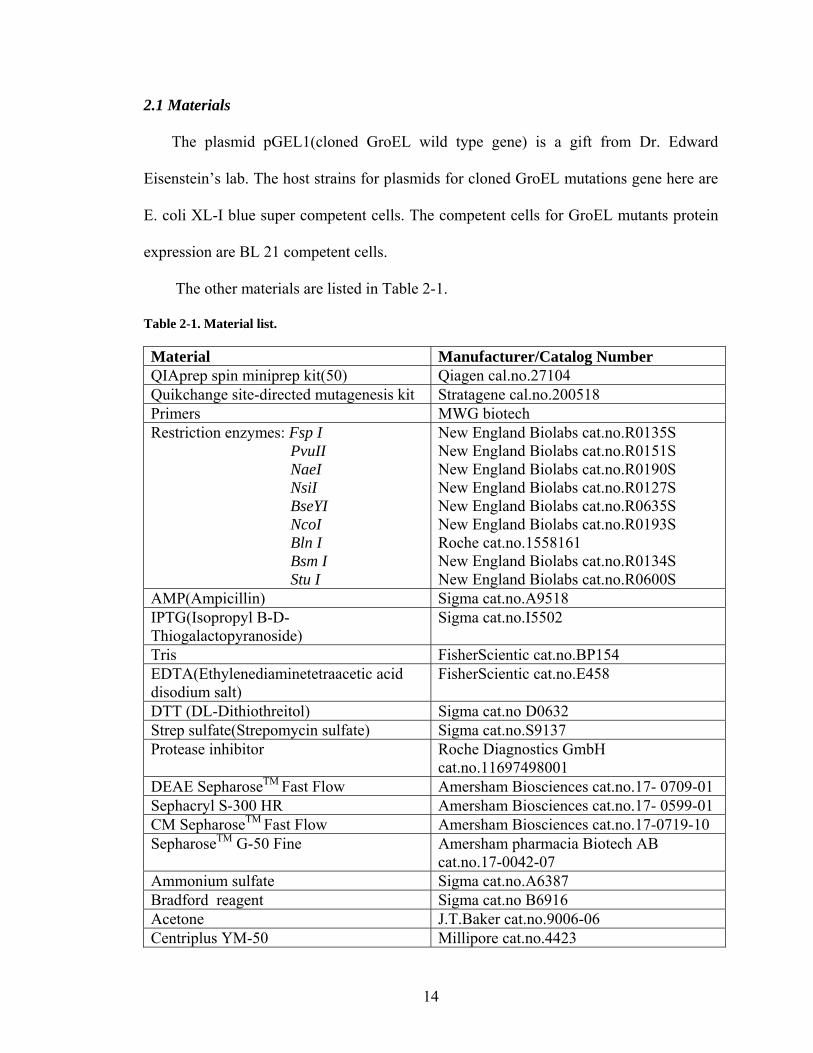
2.1 Materials
The plasmid pGEL1(cloned GroEL wild type gene) is a gift from Dr. Edward
Eisenstein’s lab. The host strains for plasmids for cloned GroEL mutations gene here are
E. coli XL-I blue super competent cells. The competent cells for GroEL mutants protein
expression are BL 21 competent cells.
The other materials are listed in Table 2-1.
Table 2-1. Material list.
Material Manufacturer/Catalog Number QIAprep spin miniprep kit(50) Qiagen cal.no.27104 Quikchange site-directed mutagenesis kit Stratagene cal.no.200518 Primers MWG biotech Restriction enzymes: Fsp I PvuII NaeI NsiI BseYI NcoI Bln I Bsm I Stu I
New England Biolabs cat.no.R0135S New England Biolabs cat.no.R0151S New England Biolabs cat.no.R0190S New England Biolabs cat.no.R0127S New England Biolabs cat.no.R0635S New England Biolabs cat.no.R0193S Roche cat.no.1558161 New England Biolabs cat.no.R0134S New England Biolabs cat.no.R0600S
AMP(Ampicillin) Sigma cat.no.A9518 IPTG(Isopropyl B-D-Thiogalactopyranoside)
Sigma cat.no.I5502
Tris FisherScientic cat.no.BP154 EDTA(Ethylenediaminetetraacetic acid disodium salt)
FisherScientic cat.no.E458
DTT (DL-Dithiothreitol) Sigma cat.no D0632 Strep sulfate(Strepomycin sulfate) Sigma cat.no.S9137 Protease inhibitor
Roche Diagnostics GmbH cat.no.11697498001
DEAE SepharoseTM Fast Flow Amersham Biosciences cat.no.17- 0709-01 Sephacryl S-300 HR Amersham Biosciences cat.no.17- 0599-01 CM SepharoseTM Fast Flow Amersham Biosciences cat.no.17-0719-10 SepharoseTM G-50 Fine Amersham pharmacia Biotech AB
cat.no.17-0042-07 Ammonium sulfate Sigma cat.no.A6387 Bradford reagent Sigma cat.no B6916 Acetone J.T.Baker cat.no.9006-06 Centriplus YM-50 Millipore cat.no.4423
14

Centriplus YM-10 Millipore cat.no. 4421 Centricon YM-50 Millipore cat.no.4424 Microcon YM-50 Millipore cat.no.42416 PD-10 column Amersham Biosciences cat.no.17- 0815-
015 Gdn-HCl(Guanidine Hydrochloride) Sigma cat.no.G4505 Streptavidin - Cy3 Invitrogen cat.no.43-4315 Streptavidin - Cy5 Invitrogen cat.no.43-4316 F5M(fluorescein-5-maleimide) Invitrogen cat.no.F150 T5M(tetramethylrhodamine-5-maleimide) Invitrogen cat.no.T6027 488(Alexa Fluor 488 C5-maleimide) Invitrogen cat.no.A10254 546(Alexa Fluor 546 C5-maleimide) Invitrogen cat.no.A10258 DMSO(Dimethyl Sulfoxide) FisherScientic cat.no.D128 ATP(Adenosine 5’-triphosphate) Sigma cat.no.A7699 ADP(Adenosine 5’-diphosphate) Sigma cat.no.A2754 Hexokinase Sigma cat.no. H4502 BSA(Bovine serum albumin) Bio-Rad cat.no.500-0007 TECP(Tris (2-carboxyethyl) phosphine hydrochloride)
Sigma cat.no.C4706
Glycerol Sigma cat.no.G8207
2.2 Equipment
The main equipment used in this thesis are listed Table 2-2. Cary 100 UV-Vis
spectrophotometer was used to measure GroEL or GroES monomer and dye
concentrations. Fluorescence spectrometer LS50B was used FRET and quenching
fluorescent probes experiments. SDS-PAGE gels were scanned by Personal Densitometer
SI and Agarose gels by Storm 860.
Table 2-2. Equipment list.
Equipment Software Manufacturer Cary 100 UV-Vis spectrophotometer
Cary WinUV Software Varian
Fluorescence spectrometer LS50B
FL WinLab software Perkin Elmer
Personal Densitometer SI PDSI, ImageQuant5.1 software
Molecular Dynamics, Inc
Storm 860 Storm Scanner control software
Molecular Dynamics, Inc
15

Chapter 3
General methods
16

3.1 Site-directed mutagenesis for GroEL and GroEL(sr) mutants
In this thesis, GroEL mutants came from three different backgrounds: 1) wild type
(GroEL(wt)); 2) Cys-free background (GroEL(cf)); 3) single ring GroEL (GroEL(sr)). To
illustrate the relationship among the GroEL wild type (or GroEL(sr)) plasmid and the
mutants plasmids, a flow chart (Figure 3-1) is presented to simplify the description. For
example, to obtain GroEL(wt)K242C/N527C mutant, GroEL(wt)K242C plasmid was used as the
template for PCR and so on.
EL(wt)
EL(wt)C138S EL(wt)N527C EL(wt)K242C EL(wt)K242C/C458A
EL(wt)C138S/C519S ELK242C/N527C EL(wt)K242C/C458A/C519A
EL(wt)C138S/C519S/C458S EL(cf)K242C
EL(cf)/E315C EL(cf)S217C EL(cf)K321C
GroEL(sr)
GroEL(sr)C138S
GroEL(sr)C138S/C519S
GroEL(sr)C138S/C519S/C458S
GroEL(sr)C138S/C519S/C458S/E315C GroEL(sr)C138S/C519S/C458S/S217C GroEL(sr)C138S/C519S/C458S/K321C Figure 3-1. Relationships among GroEL(wt) plasmid and its mutants plasmids (top) and GroEL(sr)
plasmid and its mutants plasmids (bottom).
A table (Table 3-1) is provided to describe each mutant with a template and a pair of
PCR corresponding primers to create each GroEL (or GroEL(sr)) mutant. To gauge the
17

success of each mutagenesis, a restriction enzyme was designed for each corresponding
mutant (Table 3-1).
Table 3-1. Information about template, primers and restriction enzyme for each mutagenesis.
Mutant Template
Primer* Restriction enzyme
EL(wt)K242C EL(wt) K242C-s: CTGGAAGCTGTTGCCTGCGCAGGCAAACCGCTG; K242C-ns: CAGCGGTTTGCCTGCGCAGGCAACAGCTTCCAG.
FspI
EL(wt)N527C EL(wt) N527C-s: CCGACCTGCCGAAATGCGATGCAGCAGACTTAGGC; N527C-ns: GCCTAAGTCTGCTGCATCGCATTTCGGCAGGTCGG.
PvuII
EL(wt)K242C/N527C EL(wt)K242C N527C-s: CCGACCTGCCGAAATGCGATGCAGCAGACTTAGGC; N527C-ns: GCCTAAGTCTGCTGCATCGCATTTCGGCAGGTCGG.
PvuII
EL(wt)K242C/C458A EL(wt)K242C C458A-s: GCGTCAGATCGTATTGAACGCCGGCGAAGAACCG; C458A-ns: CGGTTCTCCGCCGGCGTTCAATACGATCTGACGC.
NaeI
EL(wt)K242C/C458A/C519A EL(wt)K242C
/C458A
C519A-s: GATCACCACCGAAGCCATGGTTACCGACCTGCCG; C519A-ns: CGGCAGGTCGGTAACCATGGCTTCGGTGGTGATC.
NsiI
EL(cf)K242C EL(wt)K242C
/C458A/C519A C138S-s: GCGCTGTCCGTACCCAGCTCTGACTCTAAAGCG; C138S-ns: CGCTTTAGAGTCAGAGCTGGGTACGGACAGCGC.
BseYI
EL(wt)C138S EL(wt) C138S-s: GCGCTGTCCGTACCCAGCTCTGACTCTAAAGCG; C138S-ns: CGCTTTAGAGTCAGAGCTGGGTACGGACAGCGC.
BseYI
EL(wt)C138S/C519S EL(wt)C138S C519S-s: Nco I
18

GATCACCACCGAATCCATGGTTACCGACCTGCCG; C519S-ns: CGGCAGGTCGGTAACCATGGATTCGGTGGTGATC.
EL(cf) EL(wt)C138S
/C519S C458S-s: CCGCTGCGTCAGATCGTATTGAATTCCGGCGAAGAACCG; C458S-ns: CGGTTCTTCGCCGGAATTCAATACGATCTGACGCAGCGG.
EcoRI
EL(cf)E315C EL(cf) E315C-s: GCTGGAAAAAGCAACCCTGTGCGACCTAGGTCAGGCTAAACG; E315C-ns: CGTTTAGCCTGACCTAGGTCGCACAGGGTTGCTTTTTCCAGC. (designed by Dr. John Grason)
Bln I (designed by Dr. John Grason)
EL(cf)S217C EL(cf) S217C-s: GCAGTAGAACTGGAATGCCCGTTCATCCTGCTG; S217C-ns: CAGCAGGATGAACGGGCATTCCAGTTCTACTGC.
Bsm I
EL(cf)K321C EL(cf) K321C-s: CCTGGAAGACCTGGGTCAGGCCTGCCGTGTTGTGATCAAC; K321C-ns: GTTGATCACAACACGGCAGGCCTGACCCAGGTCTTCCAGG.
Stu I
GroEL(sr)C138S GroEL(sr) C138S-s: GCGCTGTCCGTACCCAGCTCTGACTCTAAAGCG; C138S-ns: CGCTTTAGAGTCAGAGCTGGGTACGGACAGCGC.
BseYI
GroEL(sr)C138S/C519S GroEL(sr)C138S C519S-s: GATCACCACCGAATCCATGGTTACCGACCTGCCG; C519S-ns: CGGCAGGTCGGTAACCATGGATTCGGTGGTGATC.
Nco I
GroEL(sr)C138S/C519S/C458S GroEL(sr)C138S
/C519S GroEL(sr)C458S-s: GATCGTATTGAATTCCGGCGAGGCGCCGGCGG; GroEL(sr)C458S-ns:
EcoRI
19

CCGCCGGCGCCTCGCCGGAATTCAATACGATC.
GroEL(sr)C138S/C519S/C458S
/E315C GroEL(sr)C138S
/C519S/C458S E315C-s: GCTGGAAAAAGCAACCCTGTGCGACCTAGGTCAGGCTAAACG; E315C-ns: CGTTTAGCCTGACCTAGGTCGCACAGGGTTGCTTTTTCCAGC. (designed by Dr. John Grason)
Bln I (designed by Dr. John Grason)
GroEL(sr)C138S/C519S/C458S
/S217C GroEL(sr)C138S
/C519S/C458S S217C-s: GCAGTAGAACTGGAATGCCCGTTCATCCTGCTG; S217C-ns: CAGCAGGATGAACGGGCATTCCAGTTCTACTGC.
Bsm I
GroEL(sr)C138S/C519S/C458S
/K321C GroEL(sr)C138S
/C519S/C458S K321C-s: CCTGGAAGACCTGGGTCAGGCCTGCCGTGTTGTGATCAAC; K321C-ns: GTTGATCACAACACGGCAGGCCTGACCCAGGTCTTCCAGG.
Stu I
*Red: changed nucleotide for changing the individual amino acid into Cys; green: changed
nucleotide for creating or deleting a restriction enzyme splice site; blue: changed nucleotide for
changing the individual amino acid into Cys and also creating or deleting a restriction enzyme splice
site.
Since the protocols for all mutagenesis of GroEL mutants are the same except for using
different primers and restriction enzymes, here I only describe the procedure for the first
GroEL mutant (EL(wt)K242C):
By using Stratagene Quick-Change Kit, EL(wt)K242C mutant was introduced into
EL(wt) plasmid. The primers were K242C-s and K242C-ns (see Table 3-1). The PCR
reaction mixture included 125ng of each primer, 20ng EL(wt) plasmid, reaction buffer,
dNTP mix, Pfu Turbo DNA polymerase. PCR cycling followed 3 programs:
1. 95°C, 30 seconds, 1 cycle.
20

2. 95°C, 30 seconds,
55°C, 1 minute,
68°C, 13 minutes,
repeat 16 cycles.
3. 68°C, 10 minutes, 1 cycle.
The PCR product was treated with Dpn I enzyme for 1 hour at 37°C to cut the
EL(wt) plasmid. The Dpn I-treated plasmid was transferred in XL-I blue supercompetent
cells by heat shock, then streaked on a LB+AMP plate and incubated overnight at 37°C.
The next day several colonies were inoculated into 25 ml LB+AMP medium and
incubated overnight at 37°C. The procedure for extracting EL(wt)K242C mutant plasmid
was provided by the QIAprep Spin Miniprep Kit. To check the success of mutagenesis
a restriction enzyme (FspI) was used. 1 µg of plasmid, 0.5 µl of FspI, a final
concentration of 1X reaction buffer and autoclaved distilled water were mixed in total
volume of 13 µl, following with incubation about one hour at 37°C water-bath. The
mixture with 2µl 5X agarose dye was loaded on a 0.7% agarose gel. The mutagenesis
result also was confirmed by DNA sequencing (from the University of Maryland DNA
sequencing facility). Since XL-I blue supercompetent cells are the ideal cells for storing
DNA, but not the best cells for protein expression, the mutant plasmid was transferred
into the BL 21 competent cells. The glycerol stock for the mutant was made with 0.7 ml
culture and 0.3 ml autoclaved glycerol, then stored at -80°C for future using.
3.2 Purification for GroEL(wt)
GroEL(wt) glycerol stock was streaked on a LB+Amp plate and incubated at 37°C
overnight. Three single colonies were inoculated into three 1.5L LB media containing
21

100µg/µl Amp and incubated at 37°C until the OD reached at about 0.6 at 595nm. A final
concentration of 0.5 mM IPTG was added to overexpress GroEL. The culture was
incubated at 30°C for 16 hours. Cells were harvested by centrifugation and resuspended
in buffer containing 50mM Tris, pH8, 5mM MgCl2, 1mM EDTA, 1mM DTT and 3
tablets of protease inhibitor. The cells were lysed in 50 ml portions by a sonicator set to
power level 5, 50% duty cycle, for 75 seconds. The cell debris were removed by
centrifugation. A final concentration of 8 mg/ml streptomycin sulfate was added to
remove nucleic acid. Removal of precipitate was done by centrifugation. The supernatant
was loaded on a 500 ml DEAE Sepharose Fast Flow column which was pre-equilibrated
with 400 ml of 200mM Tris pH 8, then in 1800 ml Buffer A (50 mM Tris pH 8, 1 mM
EDTA, 5 mM MgCl2, 2 mM DTT). Following elution of flow-through, the protein was
eluted over 2 L gradient from 0 mM to 50 mM NaCl on a FPLC system. The GroEL
fractions were determined by SDS-PAGE and pooled. To concentrate GroEL, saturated
ammonium sulfate was added to a final concentration of 65%. The solution was stored at
4°C overnight while slowly stirring. The solution was centrifuged to obtain the
precipitate. S300 buffer containing 50 mM Tris pH 7.5, 10 mM MgCl2, 1mM EDTA, 1
mM DTT was used to resuspend the precipitate. The solution was loaded onto a 300 ml
S300 Sephacryl gel filtration column which was pre-equilibrated with 300 ml S300 buffer.
The flow-through was pooled and concentrated above 10 mg/ml measured by Bradford.
The protein was stored at -80°C until further purifying steps were needed.
In our lab, acetone treatment (communicated by Mark T. Fisher) is a very important
step to obtain high purity of GroEL. The solution is brought to a final concentration of
45% of acetone, added dropwise to the protein solution while stirring. The solution was
22

centrifuged and the precipitate was resuspend with a similar volume of 10:10 buffer (10
mM Tris pH 7.5, 10 mM MgCl2). Only GroEL was resuspend in this buffer. The
contaminating proteins remained cloudy and were removed by a second centrifugation. A
final concentration of 65% saturated ammonium sulfate was added to the supernatant.
The pellets were resuspended in 10:10 buffer. A PD-10 column was used for de-salting.
The final product was concentrated using an YM-50. Since GroEL concentration was
checked by absorbance at 280 nm using 300µl of 8 M Gdn-HCl which dissociated GroEL
14 mers into GroEL monomer, 80µl distilled water and 20µl of protein sample. The
dilution factor (300+20+80)/20 (=20) and an extinction coefficient (ε) of 9600 M-1cm-1
were used for calculation. In this experiment, a cuvette with 1 cm path length (b) was
used. From the equation A= ε*b*c, concentration (c) equals to A/(b*ε). For example, if
the absorbance is 0.5, then the GroEL monomer concentration will be 0.5*20/9600/1
(=1.04 X 10⁻³) M.
The purity of GroEL(wt) was confirmed by tryptophan fluorescence measurement.
GroEL does not have native tryptophan residues, but a typical 40 KDa protein has about
4 Trp residues. Measuring the trp fluorescence emission at 350 nm by excitation at 295
nm indicates the presence of contaminating proteins. Since BSA has 4 trp
residues/molecule, it was diluted into 8M Gdn-HCl to create a standard curve for the
contaminating proteins. The lower the Trp fluorescence emission, the higher is the
GroEL(wt) purity. The ratio of the moles of the contaminating proteins to the moles of
GroEL(wt) 7 mer represents the ratio of GroEL(wt) rings occupied by SPs. A
preparation of GroEL was judged acceptable if more than 85% of the heptametrical rings
are free of contaminating proteins.
23

3.3 Purification for GroEL mutants
The procedure for purifying GroEL mutant was the same for EL(wt) except using
lower concentration of DTT for GroEL(wt) and higher concentration of DTT for GroEL
mutants.
3.4 Purification for GroES(wt)
The purification protocol used in our lab was modified from a published paper (13).
The plasmid for GroES is pGES1. The procedure for obtaining GroES lysate was the
same as GroEL. The lysate was treated at 70°C-74°C for 10 minutes to remove
contaminating proteins. The solution was centrifuged to remove the precipitate. A final
concentration of 65% of saturated ammonium sulfate was added to the supernatant. The
mixture was stored at 4°C overnight while slowly stirring. In the next day, the solution
was centrifuged. The pellet was resuspended in 20 ml of G50 buffer containing 10 mM
Tris pH 7.5, 0.1 mM EDTA, 1 mM DTT. The sample was loaded onto a G50 column
which was pre-equilibrated with 300 ml of G50 buffer. About 60 ml of GroES was
collected. The pH was modified to around pH 5.05 by rapid addition of NaOAC, pH 5
and applied to a 75 ml SP Sepharose HP column pre-equilibrated with 400 ml SP buffer
(50 mM NaOAC pH 5, 0.1 mM EDTA, 1 mM DTT). For each running, about 50 ml of
sample was loaded onto the column. GroES was eluted about 750 ml using a 0 mM-200
mM NaCl gradient. GroES fractions were determined by SDS-PAGE gel. The GroES
fractions from three runs were pooled together and precipitated by saturated ammonium
sulfate to a final concentration of 65%. The solution was stored at 4°C overnight while
stirring. The ammonium sulfate precipitate was centrifuged and the pellet was
resuspended in 4.8 ml of 10 mM Tris, pH7.5. The material was desalted by a PD-10
24

column pre-equilibrated by 25 ml of the same solution. The final product was
concentrated in an YM-10. The absorbance at 280 nm with an extinction coefficient of
1200 M-1cm-1 was used to determine the GroES monomer concentration.
3.5 Labeled methods
In this thesis, all GroEL mutants are cysteine (Cys) mutants with free thiols.
Because maleimides are outstanding chemicals to form thiol-selective modification, the
thiol of a Cys residue can react with the double bond of the maleimide to produce a
thioether (Figure 3-1).
Figure 3-2 Chemical reaction of a Cys residue with a maleimide. (figure from Invitrogen website).
Several maleimides acted as donor and acceptor for this thesis are listed following
( Table 3-2):
Table 3-2 Some properties of the donors and acceptors used in this thesis.
Maleimide Probe Name Abs max. (nm)
Em max. (nm)
Extinction coefficient ( M-1cm-1)
Förster Distance R0 (Å)
Donor Acceptor
Fluorescein(F5M) Tetramethylrhodamine(TMR)
492 541
515 567
83,000 95,000
54
Donor Acceptor
Cy3 Cy5
548 646
562 664
150,000 250,000
53
Donor Acceptor
Alexa fluor 488 Alexa fluor 546
493 554
516 570
72,000 93,000
64
3.5.1 GroEL mutants labeled with donor and acceptor separately
All the following operations were performed in dim light to minimize photo
bleaching. Stock solution of each probe was prepared by dissolving a granule of the
25

probe powder into 50 or 100 µl of fresh DMSO. 5 µl of solution was used to measure the
probe concentration by absorbance using an appropriate extinction coefficient.
The labeling reaction could be done in three different methods:
1) Method B: At the beginning of the reaction, 150 or 120 µM fluorescent
maleimide ( F5M, TMR, Cy3, Cy5, Alexa fluor 488 or Alexa fluor 546) was added to 25
or 20µM (monomer concentration) of the GroEL mutant of interest in 10:10
buffer(10mM, 10mM MgAc), (pH7.2 for F5M and TMR; pH 7 for Alexa fluor 488 or
Alexa fluor 546) for 90 min with 900 rpm shaking at 37°C. The mixture was brought to
10 mM of DTT to quench the reaction. The free dyes were removed by ultrafiltration and
PD-10 gel filtration column which was pre-equilibrated with 10:10 buffer. The labeled
dye concentration was estimated from the maximum absorbance of each probe. The
labeled GroEL protein concentration was checked by comparing it with a standard curve
of a known concentration of GroEL on a SDS-PAGE gel.
2) Method B’: the difference between Method B and Method B’ is in the
beginning of reaction, just the same concentration of fluorescent maleimide as the protein
concentration was added to the mixture, then after 15 minutes of incubation, the same
concentration of dye was added again and repeated this addition 4 times. The other parts
of the produce is the exact same as Method B.
3 )Method C: in this method, the reaction buffer was 50 mM Tris, pH7.5, 50mM
KCl, 0.2mM TCEP, 20% glycerol. Excess of dye was added to 20 µM of the mutant
GroEL. The labeling reaction was performed at 4° for about 24 hours. After this, the
procedure was the same as Method B.
26

3.5.2 GroEL mutants or GroEL(wt) labeled with donor following by labeling with
acceptor
There were also three different ways to label GroEL with donor following by
labeling with acceptor:
1) Method DA: label GroEL protein with donor firstly by Method B, then label
protein with acceptor with Method B again.
2) Method D’A’: label GroEL protein with donor firstly by Method B’, then label
protein with acceptor with Method B’ again.
3) Method CC: use Method C to label GroEL protein with donor following with
labeling acceptor with Method C.
3.5.3 GroEL mutants labeled with acceptor following by labeling with donor
GroEL mutants were labeled with acceptor firstly by Method B’, then labeled with
donor by method B’ again (called Method A’D’).
3.5.4 Co-mingling for GroEL mutant labeled with donor only and GroEL mutant
labeled with acceptor only
This procedure is called “co-mingling” from a protocol developed by Sarah C.
Wehri(56) (Figure 3-3).
Co-mingle
Figure 3-3. Statistical re-assembly to give an ensemble of GroEL 14 mers. Red: GroEL subunits labeled
with donor; green: GroEL subunits labeled with acceptor. (Figure from Sarah C. Wehri).
27

A total final concentration of 20 µM of GroEL mutant of interest (GroEL mutant
labeled with donor and GroEL mutant labeled with acceptor) was added to 10:10 buffer
(pH7.2, with 5 mM DTT) in the ratio of interest. In these cases, the ratio of the labeled
donor concentration to the labeled acceptor concentration was 1:1 or 1:2. A final
concentration of 20% acetone was added to the GroEL mutant solution drop wise. The
solution was mixed completely and left shaking at 900 rpm, room temperature for 10
minutes. This causes the dissociation of GroEL to monomers (Sarah C. Wehri, personal
communication). Then the solution was brought to a final concentration of 65%
ammonium sulfate to remove acetone, mixed thoroughly and left shaking at 900 rpm,
room temperature for 30 minutes. The mixture was centrifuged in a biofuge centrifuge at
10,000 xg, room temperature for 20 minutes. The supernatant was discarded and the
pellet was resuspended in 10:10 buffer (pH 7.2, with 5 mM DTT). To remove
contaminating ammonium sulfate, several rounds of concentration/dilution were used
with an appropriately sized centrifuge filter (like a centricon YM-50). The GroEL final
concentration was checked by comparing it with a known concentration of GroEL on a
SDS/PAGE gel.
3.6 FRET experiment
For FRET experiments, the excitation wavelength was 490nm or 460 nm for F5M +
TMR pair; 514 nm for Cy3 + Cy5 pair; or 460 nm for Alexa fluor 488 + Alexa fluor 546
pair. A final monomer concentration of 0.2 µM, 0.4 µM or 1 uM of labeled GroEL
protein was dissolved in FRET buffer 1 (10 mM Tris, pH 7.2; 10 mM MgAc, pH7.2;
10mM KAc, pH 7.2; 1mM DTT) or FRET buffer 2 ( 50 mM Tris, pH 7.5; 50 mM KCl;
10 mMMgCl2; 1 mM DTT) to a total volume of 200 µl. The mixture containing the
28

labeled protein and the FRET buffer was called “protein only” group. 1-2 µl of a final
concentration of 20 µM or 50 µM ATP was added into the same cuvette of the “protein
only” group, the mixture then was called “protein+ATP” group. For “protein+ADP”
group, 1-2 µl 60 µM ADP was added to the “protein only” group which already had 100
mM glucose and 0.01 unit/µl hexokinase. For some later experiments, ADP was treated
with glucose and hexokinase to remove the contaminating ATP prior to using.
Eventually, a final monomer concentration of 5 times as GroEL concentration of
GroES(wt) was added the same cuvette of the “protein+ATP” or “protein+ADP” group,
named “protein+ATP/ES” or “protein+ADP/ES” group. Spectra were taken for each of
those groups.
29

Chapter 4
Example of mutagenesis result
30

Since the mutagenesis results for all the GroEL mutants (18 mutants) are repetitive,
only one of them (GroEL(cf)K242C mutant) is described here. The other (17 mutants) are
included in the appendix.
GroEL(cf)K242C mutant: The cloning of mutant GroEL(cf)K242C was checked by
restriction enzyme (BseYI) digest (Figure 4). The agarose gel displayed an additional
band for some GroEL(cf)K242C samples as compared to the GroEL(wt) plasmid. This
result matched with the primers’ design which created one more BseYI splice site. The
mutagenesis result of GroEL(cf)K242C mutants was confirmed by DNA sequencing
(University of Maryland DNA sequencing facility).
1 2 3 4 5 6 7
Bse YI - + - + - +
Figure 4. Result for mutagenesis of GroEL(cf)K242C digested with BseYI. (From left to right) Lane 1:
1kb DNA marker. Lanes 2 and 3: GroEL(wt) samples. Lanes 4-7: GroEL(cf)K242C samples. Lanes 2, 4, and
6: treated with Bse YI, and lanes 3, 5 and 7: treated with Bse YI.
31

Chapter 5
FRET results and Discussion
32

5.1 Introduction of FRET
5.1.1 The equation of FRET efficiency
FRET is a process by which an excited donor (D) is quenched by a nearby acceptor
(A). FRET efficiency (E) is described by the equation
E=1/(1+(r/R0)6)
in which R0 is the Förster distance and r is the distance between D and A. Since FRET is
a distance-dependent process, it should be possible to monitor the change in distance
through the GroE cycle based on the change in donor and acceptor fluorescence (30).
5.1.2 Theoretical FRET efficiencies of F5M and TMR, Cy3 and Cy5, Alexa fluor 488
and Alexa fluor 546
In this thesis, three pairs of dyes were used : F5M and TMR, Cy3 and Cy5, Alexa
fluor 488 and Alexa fluor 546.
A favorable FRET pair has following properties (30):
1) A high donor quantum yield in the absence of acceptor.
2) Overlap (J) of the donor emission and acceptor absorbance spectra. The overlap
spectra of fluorescent probes (F5M and TMR, Cy3 and Cy5, Alexa fluor 488 and Alexa
fluor 546) are shown in Figure 5-1.
3) ε, the extinction coefficient of a donor or acceptor, typically in units of
M-1cm-1.
4) κ2, a freely rotating set of fluorophores.
33

Wavelength (nm)
INT
Wavelength (nm)
INT
Wavelength (nm)
INT
Figure 5-1. Absorption (dotted line) and fluorescence emission (solid line) of three pairs of probes.
Top: F5M (green) and TMR (blue) excited at 457 nm. Middle: Cy3 (green) and Cy5 (blue) excited at 514
nm. Bottom: Alexa fluor 488 (green) and Alexa fluor 546 (blue) excited at 514 nm. (Figure from Invitrogen
website).
Once the Förster distance is determined, the expected energy transfer for a dye pair
can be calculated using the equation in section 5.1.1. The distance-dependant expected
energy transfer for each pair is shown in figure 5-2.
34

Computed FRET efficiencies corresponding to different distances and pairs of donor and acceptor
0
20
40
60
80
100
120
0 50 100 150
distance(Å)
FRET
effi
cien
cy(%
)
F5M+TMR,R0=54Å
Cy3+Cy5,R0=53Å
Af488+Af546,R0=64Å
Figure 5-2. Computed FRET efficiencies for different distances between donor and acceptor and the
three pairs: F5M and TMR; Cy3 and Cy5; Alexa fluor 488 and Alexa fluor 546.
5.2 Distance changes for adjacent and ““2-removed”” pairs on GroEL cis ring from T
state to R and R’ states
When a GroEL ring transitions from T to R and then R’ state, the position of each
residue on this ring changes because of the large conformational changes the ring
undergoes. Thus the distance of the same residue between adjacent subunits or subunits
“2-removed” from one another (Figure 5-3) may increase or decrease depending on the
residue.
35

Figure 5-3. Scheme of adjacent subunits and “2-removed” subunits on a ring. Each circle represents a
subunit. For example, subunits 1 and 2, and subunits 1 and 7 may be called adjacent subunits; subunits 1
and 3, and subunits 1 and 6 can be named as “2-removed” subunits, and so on.
The distance change for residues in the equatorial domain and intermediate domain
is small, but can be large for residues in the apical domain. This reflects the fact that the
equatorial and intermediate domains form a stable, relatively immobile platform, upon
which the allosteric motions of the apical domain can be based (Figure 5-4). For this
reason, a single residue mutation coupled with fluorescence can be used to probe the
allosteric transitions of GroEL.
36

Figure 5-4. Distance change for GroEL cis ring residues on two adjacent or “2-removed” subunits.
Top: from T to R state; Bottom: from T to R’ state. The distance was measured from α–carbon of one
residue to another with Rastop software.
37

5.3 GroEL(wt) may be labeled with fluorescent probes under some labeling condition
GroEL(wt), with three native Cys sites at 138, 458 and 519, was difficult to be
labeled with F5M and TMR by Method CC at pH 7.5, obtained an average of 0.007
donor and 0.07 acceptor on each ring. FRET spectra showed that there was very little
FRET occurring upon addition of ATP and ES (Figure 5-5). The observation matched
with the conclusion previously obtained in our lab (21).
Wavelength (nm)
I
NT
Figure 5-5. Original FRET spectra for GroEL(wt) labeled with F5M and TMR at pH7.5. Blue:
“protein only” group; red:“protein + ATP” group; green: “protein + ATP/ES” group.
But GroEL(wt) was able to be labeled with that fluorescent pair by Method DA at
pH 7.2, gained an average of 0.7 donor and 1.8 acceptors on each ring, and FRET could
be observed (Figure 5-6). Since all the native Cys sites are in the equatorial domain, and
the position of equatorial domain does not change a lot through the allosteric states, it
contributed a significant background.
38

INT
INT
Wavelength (nm) Wavelength (nm)
Figure 5-6. Normalized FRET spectra for GroEL(wt) labeled with F5M and TMR at pH7.2. Left: blue:
“protein only” group; red: “protein + ATP” group; green: “protein + ATP/ES” group. Right: blue: “protein
only” group; red: “protein + ADP” group; green: “protein + ADP/ES” group.
5.4 GroEL(wt)K242C/N527C may not be the best mutant for monitoring the GroEL
allosteric transition
When GroEL undergoes an allosteric transition from T state to R’ state, the distance
between residue 242 in the apical domain and residue 527 in the equatorial domain in the
same subunit increases from 52Å to 82Å (Figure 5-7). When these residues are
substituted with Cys, a fluorescent dye can be attached and the apical domain movement
on the cis ring can be reported by FRET. This distance change is optimal for using of
these fluorophores since it falls on the linear region of the expected energy transfer plot
(Figure 5-2).
39

Figure 5-7. Positions of the two sites mutated to Cys. Red: apical domain, green: intermediate domain,
and dark blue: equatorial domain. Top: T state. Bottom: R’ state. (Motojima, et al, 2004).
The FRET results from GroEL(wt)K242C/N527C were unexpected. When labeled with
F5M and TMR by Method CC, GroEL(wt)K242C/N527C was gained an average of 5.3
donors and 4.9 acceptors on each ring. FRET spectra showed that addition of ATP/ES
and ADP/ES both increased E (Figure 5-8).
INT
INT
Wavelength (nm) Wavelength (nm)
Figure 5-8. Normalized FRET spectra for GroEL(wt)K242C/N527C labeled with F5M and TMR. Left:
blue: “protein only” group; red: “protein + ATP” group; green: “protein + ATP/ES” group. Right: blue:
“protein only” group; red: “protein + ADP” group; green: “protein + ADP/ES” group.
40

These results were totally opposite to what we expected. The cause of this may be
that GroELK242C/N527C has 5 Cys sites including 3 native sites and 2 introduced sites.
When this mutant was obtained a high labeling extent, such as an average of 5.3 donors
and 4.9 acceptors for each ring (it means 10.6 donors and 9.6 acceptors for a 14 mer),
there were 3 kinds of effects which might be contributed to FRET: 1) intra-subunit effect
including those pairs: 242-527 ( which was the only one we wanted), 242-138, 242-458,
242-519, 527-138, 527-458, 527-519, 138-458, 138-519, 458-519; 2) inter-subunit; 3)
inter-ring: cis ring-trans ring. Therefore the FRET results could not represent the
transition change.
When GroEL(wt)K242C/N527C was labeled with Cy3 and Cy5, FRET spectra matched
our expectation: addition of ATP alone and ATP/ES decreased E (Figure 5-9), consistent
with an increase in the distance between residues of 242 and 527.
Wavelength (nm)
INT
Figure 5-9. Normalized FRET spectra for GroELK242C/N527C labeled with Cy3 and Cy5. Blue: “protein
only” group; red: “protein + ATP” group; green: “protein + ATP/ES” group.
41

5.5 No FRET occurs between individual GroEL molecules: shown by a simple mixing
experiment of GroEL(wt)K242C-F5M and GroEL(wt)N527C-TMR
Use the simple mixture of GroEL(wt)K242C-F5M and GroEL(wt)N527C-TMR as our
control experiment for the FRET system. In an aqueous environment, the distance
between a residue in one GroEL14 from another residue in another GroEL14 is bigger than
the distance over which FRET can occur. So no FRET should have occurred in the
mixture. Our FRET results (Figure 5-10) confirmed our hypothesis.
Wavelength (nm)
INT
Wavelength (nm)
INT
Figure 5-10. Original FRET spectra for the mixture GroEL(wt)K242C labeled with F5M and
GroEL(wt)N527C labeled with TMR. Left: blue: “protein only” group; red: “protein + ATP” group; green:
“protein + ATP/ES” group. Right: blue: “protein only” group; red: group“protein + ADP”; green: “protein
+ ADP/ES” group.
5.6 There was some donor (and acceptor) emission peak shifting from FRET spectra of
GroEL(wt)K242C and GroEL(cf)K242C mutants
For GroEL(wt)K242C labeled with F5M and TMR by Method D’A’, FRET results
showed that the donor and acceptor emission peaks shifted by addition of nucleotides and
GroES (Figure 5-11).
42

INT
INT
Wavelength (nm) Wavelength (nm) Figure 5-11. Normalized FRET spectra for GroEL(wt)K242C labeled with F5M and TMR by Method
D’A’. Left: blue: “protein only” group; red: “protein + ATP” group; “protein + ATP/ES” group. Right: blue:
“protein only” group; red: “protein + ADP” group; green: “protein + ADP/ES” group.
For GroEL(cf)K242C, which was labeled with F5M and TMR by Method D’A’, FRET
spectra showed that the donor emission peaks also shifted (Figure 5-12).
Wavelength (nm)
INT
Wavelength (nm)
INT
Figure 5-12. Normalized FRET spectra for GroEL(cf)K242C labeled with F5M and TMR by Method
D’A’. Left: blue: “protein only” group; red: “protein + ATP” group; green: “protein + ATP/ES” group.
Right: blue: “protein only” group; red: “protein + ADP” group; green: “protein + ADP/ES” group.
For the same protein, labeled with F5M and TMR by co-mingling, the donor
emission peaks shifted again with nucleotides and GroES addition (Figure 5-13).
43
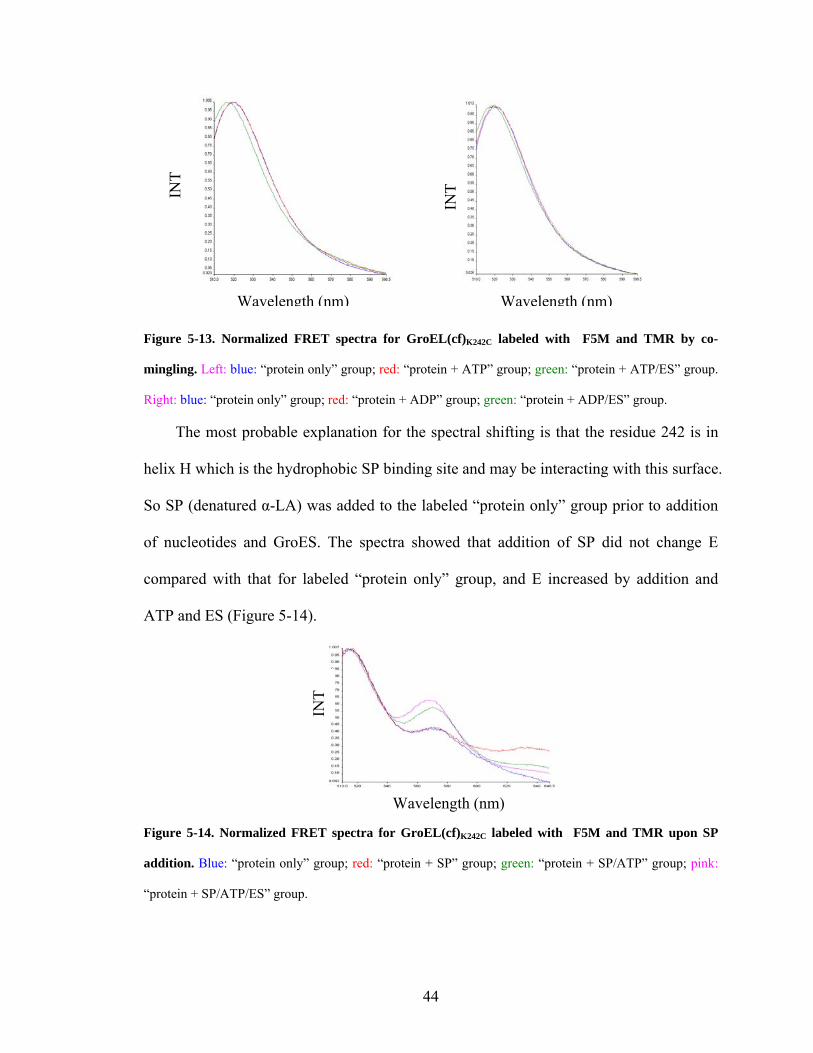
INT
INT
Wavelength (nm) Wavelength (nm) Figure 5-13. Normalized FRET spectra for GroEL(cf)K242C labeled with F5M and TMR by co-
mingling. Left: blue: “protein only” group; red: “protein + ATP” group; green: “protein + ATP/ES” group.
Right: blue: “protein only” group; red: “protein + ADP” group; green: “protein + ADP/ES” group.
The most probable explanation for the spectral shifting is that the residue 242 is in
helix H which is the hydrophobic SP binding site and may be interacting with this surface.
So SP (denatured α-LA) was added to the labeled “protein only” group prior to addition
of nucleotides and GroES. The spectra showed that addition of SP did not change E
compared with that for labeled “protein only” group, and E increased by addition and
ATP and ES (Figure 5-14).
INT
Figure 5-14. Normalized FRET spectra for GroEL(cf)K242C labeled with F5M and TMR upon SP
addition. Blue: “protein only” group; red: “protein + SP” group; green: “protein + SP/ATP” group; pink:
“protein + SP/ATP/ES” group.
Wavelength (nm)
44

These results did not confirm our expectation, however we hypothesize that it is
possible the SP binding is not strong enough to displace a dye that is interacting with the
SP binding site.
5.7 Positions of 242 and 138 might be a pair which could be labeled with donor and
acceptor to monitor GroEL allosteric transition
I removed two native Cys sited (458 and 519) on each subunit so mutant
GroELK242C/C458A/C519A only has two Cys sites (242 and 138) left on each subunit.
GroELK242C/C458A/C519A was labeled with F5M and TMR and gained an average of 1 donor
and 1 acceptor per ring, the spectra corresponded with our initial hypothesis: addition of
ATP decreased the acceptor emission peak; addition of GroES had additional decrease
(Figure 5-15).
Wavelength (nm)
INT
Wavelength (nm)
INT
Figure 5-15. Normalized FRET spectra for GroEL(wt)K242C/C458A/C519A labeled with F5M and TMR.
Left: blue: “protein only” group; red: “protein + ATP” group; green: “protein + ATP/ES” group. Right: blue:
“protein only” group; red: “protein + ADP” group; green: “protein + ADP/ES” group.
5.8 The fluorescent pair of F5M and TMR are not be a suitable pair for some GroEL
mutants
From GroEL(cf)E315C labeled with F5M, a spectra change that resembled the energy
transfer previously observed occurred on addition of ATP and GroES for the labeled
protein (Figure 5-16). This should not happen since no acceptor was present.
45

INT
Wavelength (nm)
Figure 5-16. Normalized FRET spectra for GroEL(cf)E315C labeled with F5M by Method B’. Blue:
“protein only” group; red: “protein + ATP” group; green: “protein + ATP/ES” group.
For GroEL(cf)E315C labeled with acceptor (TMR), addition of ATP and GroES also
increased the emission peaks (Figure 5-17), which was not expected.
Wavelength (nm)
INT
Figure 5-17. Original FRET spectra for GroEL(cf)E315C labeled with TMR by Method B’. Blue:
l“protein only” group; red: “protein + ATP” group; green: “protein + ATP/ES” group.
For simply mixing GroEL(cf)E315C-F5M and GroEL(wt)E315C-TMR, there was FRET
occurring (Figure 5-18), that should not happen since the donors and the acceptors were
on different GroEL 14 mers.
46

INT
Wavelength (nm)
Figure 5-18. Normalized FRET spectra for a single mixture of GroEL(cf)E315C -F5M and
GroEL(cf)E315C –TMR. Blue: GroELE315C-F5M only group; red: GroELE315C-F5M + ATP; green:
GroELE315C-F5M + ATP/ES; pink: GroELE315C-F5M + ATP/ES + GroELE315C-TMR.
We anticipate that F5M and TMR are so sensitive to pH, hydrogen bonding and
other environmental changes, that inclusion in the GroEL system is complicated, so F5M
and TMR may not be the best dyes to monitor GroEL allosteric change.
5.9 Cy3 and Cy5, Alexa fluor 488 and Alexa fluor 546 are good labeling pairs for the
GroEL system
When GroEL(wt)K242C/N527C was labeled with Cy3 and Cy5, even though each
GroEL subunit has 5 Cys sites, with lower labeling extent (average 1.3 donors and 1.5
acceptors on each subunit), FRET spectra looked like that FRET efficiency (E) decreased
in presence of ATP and GroES (Figure 5-9). These results met the expectation.
Since GroEL(cf)E315C only has one Cys site (residue 315 in apical domain), it
prevents the intra-subunit and inter-ring effects from interfering with FRET signals. The
FRET efficiency change appears to represent its allosteric change while minimizing
photochemical and photo physical effects. When this mutant was labeled with Alexa
fluor 488 and Alexa fluor 546, FRET spectra showed that E decreased on addition of
ATP and GroES (Figure 5-19), which matched with the expectation.
47

INT
Wavelength (nm)
Figure 5-19. Normalized FRET spectra for GroEL(cf)E315C labeled with Alexa fluor 488 and Alexa
fluor 546 by co-mingling. Blue: “protein only” group; red: “protein + ATP” group; green: “protein +
ATP/ES” group.
It appears that Cy3 and Cy5, and even more so Alexa fluor 488 and Alexa fluor 546
were good labeling pairs for the GroEL system.
48

Chapter 6
Summary
49
In the presence of ATP and GroES, GroEL transitions from T to R and R’ state. To
follow GroEL allosteric change, several GroEL mutants with Cys sites were created by
site-directed mutagenesis. When these GroEL mutants were labeled with dyes, FRET
experiment could be performed.
The spectra showed that no FRET occurs in individual GroEL 14-mers, since the
distance between 2 GroEL 14-mers is bigger than the distance in which FRET may occur.
Also it is found that GroEL wild type may be labeled with dyes under some labeling
conditions, such as changing the ratio of the dye concentration to the GroEL monomer
concentration, and adjusting the incubation time, pH, etc. It is reported that
GroEL(wt)K242C/N527C is not the best mutant for monitoring the GroEL structural change
because of its wild type background. In GroEL, positions of 242 and 138 might be a pair
which could be labeled F5M and TMR to monitor allosteric change under optimal
labeling conditions, for example, each ring gets an average of one donor and one acceptor.
This mutant (GroEL(cf)K242C/C458A/C519C) represents a double-subunit strategy, and its
FRET signals come from the intra-subunit effect. On the other hand, the mutant
GroEL(cf)E315C labeled with Alexa fluor 488 and Alexa fluor 546 is a promising for
following the GroEL structural change, and it represents a single-subunit strategy and
inter-subunit effect.
For the future study, quenching experiments might be done to explain the problems
from the spectra of mutant GroEL(cf)K242C. By adding the quencher (eg: I-1) to the labeled
GroEL, the fluorescein data might give a complete picture for this system.
50

Appendix: The remaining GroEL mutants mutagenesis results
A.1 GroEL(wt)K242C mutant
The cloning of mutant GroEL(wt)K242C was first checked by restriction enzyme
(FspI) digest (Figure A-1). The mutagenesis was designed so as to create an additional
Fsp I site. This result matched with the primers’ design which created one more FspI
cleavage site. The mutagenesis result of GroEL(wt)K242C mutants was confirmed by DNA
sequencing (University of Maryland DNA sequencing facility).
1 2 3 4 5 6 7 8 9 10 11 12 13 14 15
Fsp I - + - + - + - + - + - + - +
Figure A-1. Result for mutagenesis of GroEL(wt)K242C digested with FspI. (from left to right) Lane 1: 1
kb DNA marker. Lanes 2 and 3: GroEL(wt) samples. Lanes 4-15: GroEL(wt)K242C samples. Lanes 2, 4, 6, 8,
10, 12 and 14: not treated with FspI, and lanes 3, 5, 7, 9, 11, 13 and 15: treated with FspI.
51

A.2 GroEL(wt)N527C mutant
Restriction enzyme (PvuII) was used to check the mutagenesis result of
GroEL(wt)N527C mutant (Figure A-2). Because of the primers’ design, one PvuII cutting
site was removed. From the agarose gel result, there were some differences between
GroEL(wt) and GroELN527C groups after treated with PvuII. DNA sequencing
(University of Maryland DNA sequencing facility) confirmed the success of the
mutagenesis of GroEL(wt)N527C.
1 2 3 4 5 6 7 8 9
Pvu II - + - + - + - +
Figure A-2. Result for mutagenesis of GroEL(wt)N527C digested with PvuII. (From left to right) Lane 1:
DNA marker. Lanes 2 and 3: GroEL(wt) samples. Lanes 4-9: GroELN527C samples. Lanes 2, 4, 6 and 8: not
treated with PvuII, and lanes 3, 5, 7 and 9: treated with PvuII.
52

A.3 GroEL(wt)K242C/N527C mutant
Mutagenesis result of GroEL(wt)K242C/N527C with GroEL(wt)K242C as background was
checked with PvuII (Figure A-3). After digested by PvuII, there were some differences
among the control group and GroEL(wt)K242C/N527C groups. DNA sequencing (University
of Maryland DNA sequencing facility) confirmed the success of the mutagenesis of
GroEL(wt)K242C/N527C.
1 2 3 4 5 6 7
Pvu II - + - + - +
Figure A-3. Result for mutagenesis of GroEL(wt)K242C/N527C digested with PvuII. (From left to right)
Lane 1: DNA marker. Lanes 2 and 3: GroEL(wt) samples. Lanes 4-7: GroEL(wt)K242C/N527C samples. Lanes
2, 4, and 6: not treated with PvuII, and lanes 3, 5 and 7: treated with PvuII.
53

A.4 GroEL(wt)K242C/C458A mutant
Mutagenesis result of GroEL(wt) K242C/C458A with GroEL(wt)K242C as background
was checked with Nae I (Figure A-4). Theoretically, control (GroEL(wt)) should have
one Nae I cutting site, and GroEL(wt)K242C/C458A has two Nae I cutting sites. The gel’s
result matched with the expectation. Also DNA sequencing (University of Maryland
DNA sequencing facility) confirmed the success of the mutagenesis of GroEL(wt)K242C/
C458A.
1 2 3 4 5 6 7 8 9
Nae I - + - + - + - +
Figure A-4. Result for mutagenesis of GroEL(wt)K242C/C458A digested with NaeI. (From left to right)
Lane 1: DNA marker. Lanes 2 and 3: GroEL(wt) samples. Lanes 4-9: GroEL(wt)K242C/C458A samples. Lanes
2, 4, 6 and 8: not treated with Nae I, and lanes 3, 5, 7 and 9: treated with Nae I.
54

A.5 GroEL(wt)K242C/C458A/C519A mutant
Mutagenesis result of GroEL(wt) K242C/C458A/C519A using GroEL(wt)K242C/C458A as
background was checked with Nsi I (Figure A-5). As expected, the gel result showed that
there was one Nsi I cutting site for control, no Nsi I cutting site for
GroEL(wt)K242C/C458A/C519A. DNA sequencing (University of Maryland DNA sequencing
facility) confirmed the success of the mutagenesis of GroEL(wt)K242C/C458A/C519A.
1 2 3 4 5 6 7 8 9
Nsi I - + - + - + - +
Figure A-5. Result for mutagenesis of GroEL(wt)K242C/C458A/C519A digested with Nsi I. (From left to right)
Lane 1: DNA marker. Lanes 2 and 3: GroEL(wt)WT samples. Lanes 4-9: GroEL(wt)K242C/C458A/C519A samples.
Lanes 2, 4, 6 and 8: not treated with Nsi I, and lanes 3, 5, 7 and 9: treated with Nsi I.
55

A.6 GroEL(wt)C138S mutant
Mutagenesis result of GroEL(wt)C138S from GroEL(wt) background was checked
with Bse YI (Figure A-6, lanes 7 & 9). As expected, gel result showed that there were
three Bse YI cutting sites for GroEL(wt)C138S. DNA sequencing (University of Maryland
DNA sequencing facility) confirmed the success of the mutagenesis of GroEL(wt)C138S.
1 2 3 4 5 6 7 8 9
Bse YI - + - + - + - +
Figure A-6. Result for mutagenesis of GroEL(wt)C138S and GroEL(sr)(wt)C138S digested with BseYI.
(From left to right) Lane 1: DNA marker. Lanes 2-5: GroEL(sr)C138S samples. Lanes 6-9: GroEL(wt)C138S
samples. Lanes 2, 4, 6 and 8: not treated with Bse YI, and lanes 3, 5, 7 and 9: treated with Bse YI.
56

A.7 GroEL(wt)C138S/C519S mutant
Mutagenesis result of GroEL(wt)C138S/C519S using GroEL(wt)C138S as background was
checked with Nco I (Figure A-7). As expected, the gel result showed that there was one
Nco I cutting site for control, two Nco I cutting sites for GroEL(wt)C138S/C519S. DNA
sequencing (University of Maryland DNA sequencing facility) confirmed the success of
the mutagenesis of GroEL(wt)C138S/C519.
1 2 3 4 5 6 7 8 9 10 11 12 13
Nco I - + - + - + - + - + + -
Figure A-7. Result for mutagenesis of GroEL(wt)C138S/C519S and GroEL(sr)C138S/C519S digested with
NcoI. (From left to right) Lane 1: DNA marker. Lanes 2 and 3: controls (GroEL(wt)C138S samples). Lanes
4-7: GroEL(wt)C138S/C519S samples. Lanes 8 and 9: controls (GroEL(sr)C138S samples). Lanes 10-13:
GroEL(sr)C138S/C519S samples. Lanes 2, 4, 6, 8, 10 and 13: not treated with Nco I, and lanes 3, 5, 7, 9, 11 and
12: treated with Nco I.
57

A.8 GroEL(cf) mutant
Mutagenesis result of GroEL(cf) using GroEL(wt)C138S/C519S as background was
checked with Eco RI (Figure A-8). The gel result showed that there was one more Eco RI
cutting site for GroEL(cf) than for the control, which matched with the design. DNA
sequencing (University of Maryland DNA sequencing facility) confirmed the success of
the mutagenesis of GroEL(cf).
1 2 3 4 5 6 7
Eco RI - + - + - +
Figure A-8. Result for mutagenesis of GroEL(cf) digested with Eco RI. (From left to right) Lane 1:
DNA marker. Lanes 2 and 3: controls (GroEL(wt)C138S/C519S samples). Lanes 4-7: GroEL(cf) samples.
Lanes 2, 4, and 6: not treated with Eco RI, and lanes 3, 5 and 7: treated with Eco RI.
58

A.9 GroEL(cf)E315C mutant
Mutagenesis result of GroEL(cf)E315C using GroEL(cf) as background was checked
with Bln I (Figure A-9). As expected, the gel result showed that there was one Bln I
cutting site for GroEL(cf)E315C and no Bln I cutting site for the control. DNA sequencing
(University of Maryland DNA sequencing facility) confirmed the success of the
mutagenesis of GroEL(cf)E315C.
1 2 3 4 5 6 7
Bln I - + - + - +
Figure A-9. Result for mutagenesis of GroEL(cf)E315C digested with Bln I. (From left to right) Lane 1:
DNA marker. Lanes 2 and 3: controls (GroEL(cf) samples. Lanes 4, 5, 6 and 7: GroEL(cf)E315C samples.
Lanes 2, 4 and 6: not treated with Bln I, lanes 3, 5 and 7: treated with Bln I.
59

A.10 GroEL(cf)S217C mutant
Mutagenesis result of GroEL(cf)S217C using GroEL(cf) as background was checked
with BsmI (Figure A-10, lane 5). As expected, the gel result showed that there were two
Bsm I cutting sites for GroEL(cf)S217C and one Bsm I cutting site for the control. DNA
sequencing (University of Maryland DNA sequencing facility) confirmed the success of
the mutagenesis of GroEL(cf)S217C.
1 2 3 4 5 6 7 8 9
Bsm I - + - + - + - +
Figure A-10. Result for mutagenesis of GroEL(cf)S217C and GroEL(sr)C138S/C519S/C458S/S217C digested
with Bsm I. (From left to right) Lane 1: DNA marker. Lanes 2 and 3: controls (GroEL(cf) samples). Lanes
4 & 5: GroEL(cf)S217C samples. Lanes 6 and 7: controls (GroEL(sr)C138S/C519S/C458S samples). Lanes 8 and 9:
GroEL(sr)C138S/C519S/C458S/S217C samples . Lanes 2, 4, 6 and 8: not treated with Bsm I, lanes 3, 5, 7 and 9:
treated with Bsm I.
60
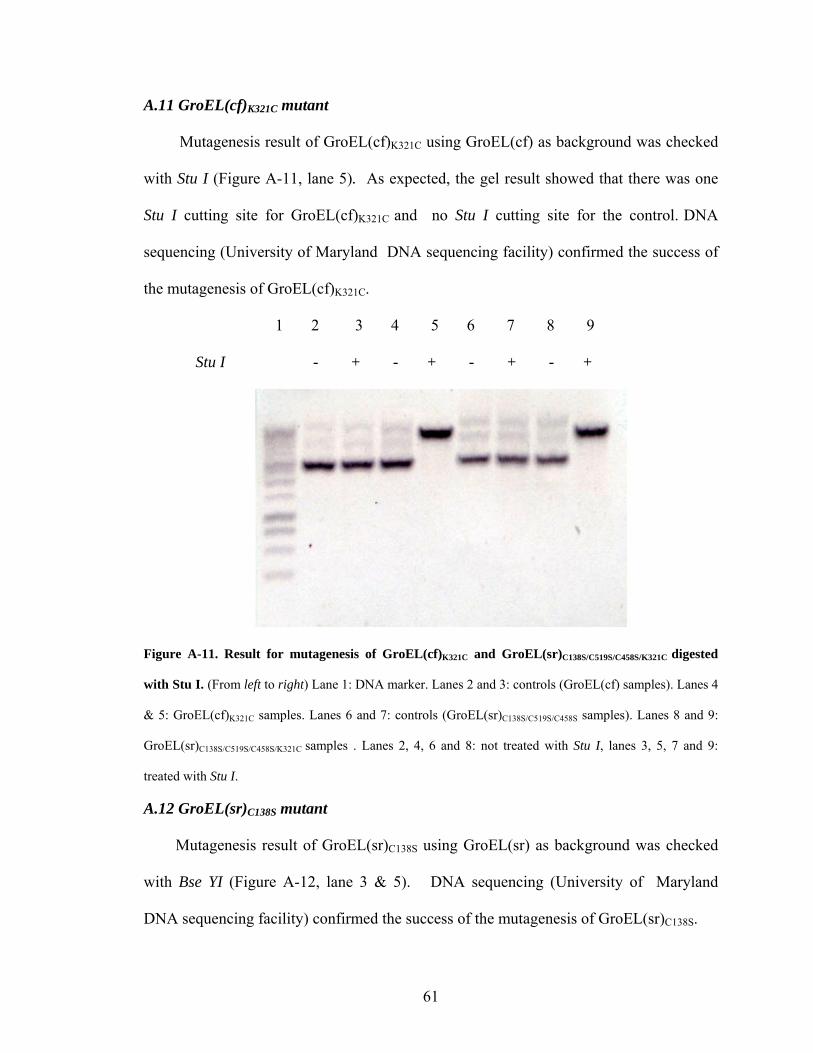
A.11 GroEL(cf)K321C mutant
Mutagenesis result of GroEL(cf)K321C using GroEL(cf) as background was checked
with Stu I (Figure A-11, lane 5). As expected, the gel result showed that there was one
Stu I cutting site for GroEL(cf)K321C and no Stu I cutting site for the control. DNA
sequencing (University of Maryland DNA sequencing facility) confirmed the success of
the mutagenesis of GroEL(cf)K321C.
1 2 3 4 5 6 7 8 9
Stu I - + - + - + - +
Figure A-11. Result for mutagenesis of GroEL(cf)K321C and GroEL(sr)C138S/C519S/C458S/K321C digested
with Stu I. (From left to right) Lane 1: DNA marker. Lanes 2 and 3: controls (GroEL(cf) samples). Lanes 4
& 5: GroEL(cf)K321C samples. Lanes 6 and 7: controls (GroEL(sr)C138S/C519S/C458S samples). Lanes 8 and 9:
GroEL(sr)C138S/C519S/C458S/K321C samples . Lanes 2, 4, 6 and 8: not treated with Stu I, lanes 3, 5, 7 and 9:
treated with Stu I.
A.12 GroEL(sr)C138S mutant
Mutagenesis result of GroEL(sr)C138S using GroEL(sr) as background was checked
with Bse YI (Figure A-12, lane 3 & 5). DNA sequencing (University of Maryland
DNA sequencing facility) confirmed the success of the mutagenesis of GroEL(sr)C138S.
61

A.13 GroEL(sr)C138S/C519S mutant
Mutagenesis result of GroEL(sr) C138S/C519S using GroEL(sr)C138S as background was
checked with Nco I (FigureA-13, lanes 5 & 7). As expected, the gel result showed that
there were one Nco I cutting site for control, two Nco I cutting sites for
GroEL(sr)C138S/C519S. DNA sequencing (University of Maryland DNA sequencing facility)
confirmed the success of the mutagenesis of GroELC138S/C519S.
A.14 GroEL(sr)C138S/C519S/C458S mutant
Mutagenesis result of GroEL(sr)C138S/C519S/C458S using GroEL(sr)C138S/C519S as
background was checked with Eco RI (Figure A-13). The gel result showed that there
was one more Eco RI cutting site for GroELC138S/C519S/C458S than for the control, which
matched with the design. DNA sequencing (University of Maryland DNA sequencing
facility) confirmed the success of the mutagenesis of GroEL(sr)C138S/C519S/C458S.
1 2 3 4 5 6 7
Eco RI - + - + - +
Figure A-12. Result for mutagenesis of GroEL(sr)C138S/C519S/C458S digested with Eco RI. (From left
to right) Lane 1: DNA marker. Lanes 2 and 3: controls (GroEL(sr)C138S/C519S samples). Lanes 4-7:
GroEL(sr)C138S/C519S/C458S samples. Lanes 2, 4,and 6: not treated with Eco RI, and lanes 3, 5 and 7:
treated with Eco RI.
62

A.15 GroEL(sr)C138S/C519S/C458S/E315C mutant
Mutagenesis result of GroEL(sr) C138S/C519S/C458S/E315C from GroEL(sr)C138S/C519S/C458S
background was checked with Bln I (Figure A-13). As expected, the gel result showed
that there was one Bln I cutting site for GroELC138S/C519S/C458S/E315C and no Bln I cutting
site for the control. DNA sequencing (University of Maryland DNA sequencing facility)
confirmed the success of the mutagenesis of GroEL(sr)C138S/C519S/C458S/E315C.
1 2 3 4 5 6 7
Bln I - + - + - +
Figure A-13. Result for mutagenesis of GroEL(sr)C138S/C519S/C458S/E315C digested with Bln I. (From left to
right) Lane 1: DNA marker. Lanes 2 and 3: controls (GroEL(sr)C138S/C519S/C458S samples). Lanes 4, 5, 6 and 7:
GroEL(sr)C138S/C519S/C458S/E315C samples. Lanes 2, 4 and 6: not treated with Bln I, lanes 3, 5 and 7: treated
with Bln I.
63

A.16 GroEL(sr)C138S/C519S/C458S/S217C mutant
Mutagenesis result of GroEL(sr)C138S/C519S/C458S/S217C using GroEL(sr)C138S/C519S/C458S
as background was checked with BsmI (Figure A-10, lane 9). The gel result showed that
there was one more Bsm I cutting site for GroEL(sr)C138S/C519S/C458S/S217C than for the
control, matched with the primers’ design. DNA sequencing (University of Maryland
DNA sequencing facility) confirmed the success of the mutagenesis of
GroEL(sr)C138S/C519S/C458S/S217C.
A.17 GroEL(sr)C138S/C519S/C458S/K321C mutant
Mutagenesis result of GroEL(sr)138S/C519S/C458S/K321C using GroEL(sr)C138S/C519S/C458S
as background was checked with Stu I (Figure A-11, lane 9). As expected, the gel result
showed that there was one Stu I cutting site for GroEL(sr)138S/C519S/C458S/K321C and no Stu I
cutting site for the control. DNA sequencing (University of Maryland DNA sequencing
facility) confirmed the success of the mutagenesis of GroEL(sr)C138S/C519S/C458S/K321C.
64

References
1. Anfinsen, C. B. (1973). "Principles that govern the folding of protein chains." Science
181(96): 223-30.
2. Beissinger, M., Rutkat, K.& Buchner, J. (1999). “Catalysis, commitment and
encapsulation during GroE-mediated folding.” J Mol Biol 289, 1075-92
3. Braig, K., Z. Otwinowski, et al. (1994). "The crystal structure of the bacterial
chaperonin GroEL at 2.8 A." Nature 371(6498): 578-86.
4. Buchner, J., M. Schmidt, et al. (1991). "GroE facilitates refolding of citrate synthase
by suppressing aggregation." Biochemistry 30(6): 1586-91.
5. Buckle, A. M., R. Zahn, et al. (1997). "A structural model for GroEL-polypeptide
recognition." Proc Natl Acad Sci USA 94(8): 3571-5.
6. Burston, S. G., N. A. Ranson, et al. (1995). "The origins and consequences of
asymmetry in the chaperonin reaction cycle." J Mol Biol 249(1): 138-52.
7. Chatellier, J., A. M. Buckle, et al. (1999). "GroEL recognises sequential and non-
sequential linear structural motifs compatible with extended beta-strands and alpha-
helices." J Mol Biol 292(1): 163-72.
8. Chen, L. and P. B. Sigler (1999). "The crystal structure of a GroEL/peptide complex:
plasticity as a basis for substrate diversity." Cell 99(7): 757-68.
9. Cheng, M. Y., F. U. Hartl, et al. (1989). "Mitochondrial heat-shock protein hsp60 is
essential for assembly of proteins imported into yeast mitochondria." Nature 337(6208):
620-5.
10. Clark, A. C. and C. Frieden (1999). "The chaperonin GroEL binds to late-folding
non-native conformations present in native Escherichia coli and murine dihydrofolate
reductases." J Mol Biol 285(4): 1777-88.
65

11. Cliff, M. J., N. M. Kad, et al. (1999). "A kinetic analysis of the nucleotide-induced
allosteric transitions of GroEL." J Mol Biol 293(3): 667-84.
12. Corrales, F.J. & Fersht,A.R. (1996). “Kinetic signigicance of GroEL14(GroES7)2
complexes in molecular chaperone activity.” Folding Design 1, 265-73
13. Eisenstein, E., Reddy, P., and Fisher, M. T. (1998) “Overexpression, purification,
and properties of GroES from Escherichia coli.” Methods in Enzymology 290, 119-135
14. Farr G. W., Furtak K., Rowland M. B., Ranson N. A., Saibi H. R., et al. (2000).
"Multivalent binding of nonnative SPs by the chaperonin GroEL." Cell 100:491-500
15. Fenton, W. A., Y. Kashi, et al. (1994). "Residues in chaperonin GroEL required for
polypeptide binding and release." Nature 371(6498): 614-9.
16. Fenton, W. A. and A. L. Horwich (2003). "Chaperonin-mediated protein folding: fate
of substrate polypeptide." Q Rev Biophys 36(2): 229-56.
17. Goloubinoff, P., Christeller, J. T., Gatenby, A. A., and Lorimer, G. H. (1989)
“Reconstitution of active dimeric ribulose bisphosphate carboxylase from an unfoleded
state depends on two chaperonin proteins and Mg-ATP.” Nature 342, 884-889
18. Goloubinoff, P., A. A. Gatenby, et al. (1989). "GroE heat-shock proteins promote
assembly of foreign prokaryotic ribulose bisphosphate carboxylase oligomers in
Escherichia coli." Nature 337(6202): 44-7.
19. Grallert, H., K. Rutkat, et al. (2000). "Limits of protein folding inside GroE
complexes." J Biol Chem 275(27): 20424-30.
20. Grallert, H. and J. Buchner (2001). "Review: a structural view of the GroE chaperone
cycle." J Struct Biol 135(2): 95-103.
66

21. Grason, J.P. (2003) “Allostery in GroEL: Its role in the refolding of protein
substrates.” In Department of Chemistry and Biochemistry, University of Maryland
College Park, College Park, MD
22. Hemmingsen, S. M., Woolford, C., van der Vies, S. M., Tilly, K., Dennis, D. T.,
Georgopoulos, C. P., Hendrix, R. W., and Ellis, R. J. (1988) “Homologous plant and
bacterial proteins chaperone oligomeric protein assembly. “ Nature 333, 330-334
23. Horwich, A. L., K. B. Low, et al. (1993). "Folding in vivo of bacterial cytoplasmic
proteins: role of GroEL." Cell 74(5): 909-17.
24. Hunt, J. F., A. J. Weaver, et al. (1996). "The crystal structure of the GroES co-
chaperonin at 2.8 A resolution." Nature 379(6560): 37-45.
25. Inbar, E. and A. Horovitz (1997). "GroES promotes the T to R transition of the
GroEL ring distal to GroES in the GroEL-GroES complex." Biochemistry 36(40): 12276-
81.
26. Itzhaki, L. S., D. E. Otzen, et al. (1995). "Nature and consequences of GroEL-protein
interactions." Biochemistry 34(44): 14581-7.
27. Jackson, G. S., R. A. Staniforth, et al. (1993). "Binding and hydrolysis of nucleotides
in the chaperonin catalytic cycle: implications for the mechanism of assisted protein
folding." Biochemistry 32(10): 2554-63.
28. Kad, N. M., N. A. Ranson, et al. (1998). "Asymmetry, commitment and inhibition in
the GroE ATPase cycle impose alternating functions on the two GroEL rings." J Mol Biol
278(1): 267-78.
29. Katsumata, K., A. Okazaki, et al. (1996). "Effect of GroEL on the re-folding kinetics
of alpha-lactalbumin." J Mol Biol 258(5): 827-38.
67

30. Lakowicz, J. (1999) Principle of fluorescence spectroscopy.
31. Lin, Z., F. P. Schwartz, et al. (1995). "The hydrophobic nature of GroEL- substrate
binding." J Biol Chem 270(3): 1011-4.
32. Lin, Z and Rye,H.S. (2006) “GroEL-Mediated Protein Folding: Making the
Impossible, Possible. “ Biochem Mol Biol 41(4),211-39
33. Mande, S. C., V. Mehra, et al. (1996). "Structure of the heat shock protein
chaperonin-10 of Mycobacterium leprae." Science 271(5246): 203-7.
34. Mayhew, M., A. C. da Silva, et al. (1996). "Protein folding in the central cavity of
the GroEL-GroES chaperonin complex." Nature 379(6564): 420-6.
35. Mendoza, J. A., T. Warren, et al. (1996). "The ATPase activity of chaperonin GroEL
is highly stimulated at elevated temperatures." Biochem Biophys Res Commun 229(1):
271-4.
36. Motojima,F., et al. (2004) “Substrate polypeptide presents a load on the apical
domains of the chaperonin GroEL.” Proc Natl Acad Sci 101(42) 15005-12
37. Perrett, S., R. Zahn, et al. (1997). "Importance of electrostatic interactions in the
rapid binding of polypeptides to GroEL." J Mol Biol 269(5): 892-901.
38. Preuss, M., J. P. Hutchinson, et al. (1999). "Secondary structure forming propensity
coupled with amphiphilicity is an optimal motif in a peptide or protein for association
with chaperonin 60 (GroEL)." Biochemistry 38(32): 10272-86.
39. Ranson, N. A., Farr, G. W., Roseman, A. M., Gowen, B., Fenton, W. A., Horwich, A.
L., and Saibil, H. R. (2001) "ATP-bound states of GroEL captured by cryo-electron
microscopy." Cell 107, 3869-879.
68

40. Richarme, G. and M. Kohiyama (1994). "Amino acid specificity of the Escherichia
coli chaperone GroEL (heat shock protein 60)." J Biol Chem 269(10): 7095-8.
41. Robert, M.W.,et al. (1979) "Solvent perturbation of the fluorescein bound to specific
antibody." J Biol Chem 254(5), 1684-1690
42. Ryba, N. J., M. A. Hoon, et al. (1993). "Rhodopsin mobility, structure, and lipid-
protein interaction in squid photoreceptor membranes." Biochemistry 32(13): 3298-305.
43. Rye, H. S., A. M. Roseman, et al. (1999). "GroEL-GroES cycling: ATP and
nonnative polypeptide direct alternation of folding-active rings." Cell 97(3): 325-38.
44. Saibil, H. (2000). "Molecular chaperones: containers and surfaces for folding,
stabilising or unfolding proteins." Curr Opin Struct Biol 10(2): 251-8.
45. Sakikawa, C., H. Taguchi, et al. (1999). "On the maximum size of proteins to stay
and fold in the cavity of GroEL underneath GroES." J Biol Chem 274(30): 21251-6.
46. Schmidt M, Buchner J, Todd M. J, Lorimer G. H. and Viitanen P. V. (1994)." On the
role of groES in the chaperonin-assisted folding reaction. Three case studies." J Biol
Chem. 8;269(14):10304-11
47. Sigler, P. B., Z. Xu, et al. (1998). "Structure and function in GroEL-mediated protein
folding." Annu Rev Biochem 67: 581-608.
48. Thiyagarajan, P., S. J. Henderson, et al. (1996). "Solution structures of GroEL and its
complex with rhodanese from small-angle neutron scattering." Structure 4(1): 79-88.
49. Thirumalai, D. and G. H. Lorimer (2001). "Chaperonin-mediated protein folding."
Annu Rev Biophys Biomol Struct 30: 245-69.
50. Todd, M. J., P. V. Viitanen, et al. (1994). "Dynamics of the chaperonin ATPase cycle:
implications for facilitated protein folding." Science 265(5172): 659-66.
69

51. Todd, M. J., Viitanen, P. V., and Lorimer, G. H. (1993) "Hydrolysis of adenosine 5'-
triphosphate by Escherichia coli GroEL: effects of GroES and potassium ion."
Biochemistry 32, 8560-8567
52. Viitanen, P. V., Lubben, T. H., Reed, J., Goloubinoff, P., O'Keefe, D. P., and
Lorimer, G. H. (1990) "Chaperonin-facilitated refolding of ribulosebisphosphate
carboxylase and ATP hydrolysis by chaperonin 60 (groEL) are K+ dependent."
Biochemistry 29, 5665-5671
53. Wang, Z., H. Feng, et al. (1999). "Basis of substrate binding by the chaperonin
GroEL." Biochemistry 38(39): 12537-46.
54. Weissman, J. S., C. M. Hohl, et al. (1995). "Mechanism of GroEL action: productive
release of polypeptide from a sequestered position under GroES." Cell 83(4): 577-87.
55. Weissman, J. S., H. S. Rye, et al. (1996). "Characterization of the active intermediate
of a GroEL-GroES-mediated protein folding reaction." Cell 84(3): 481-90.
56. Werih, S.C.. (2006) Procedure for monomer mixing experiment.In Department of
Chemistry and Biochemistry, University of Maryland College Park, College Park, MD
57. Xu, Z., A. L. Horwich, et al. (1997). "The crystal structure of the asymmetric GroEL-
GroES-(ADP)7 chaperonin complex." Nature 388(6644): 741-50.
58. Xu, Z. and P. B. Sigler (1998). "GroEL/GroES: structure and function of a two-
stroke folding machine." J Struct Biol 124(2-3): 129-41.
59. Yifrach, O. and A. Horovitz (1995). "Nested cooperativity in the ATPase activity of
the oligomeric chaperonin GroEL." Biochemistry 34(16): 5303-8.
70