acetic acid • vinyl acetate - orbichemorbichem.com/userfiles/kichem...
TRANSCRIPT

Acetic Acid • Vinyl Acetate
Keiji Wakatsuki
Tecnon OrbiChem Seminar at KICHEM 2012Seoul - 2 November, 2012

KICHEM 2012PRESENTATION OUTLINE
• Current Acetic Acid Market Conditions
• Major Downstream Markets
• Summary and Conclusions
Source: Tecnon OrbiChem

KICHEM 2012
TECNON ORBICHEM’S VIEW OF THE MARKETAcetic Acid• Global acetic acid markets have not been as robust in 2012 as
originally expected due to ongoing economic headwinds in Europe and overcapacity in Asia. Market participants expected to retain a wait-and-see attitude in Q3-Q4.
• Despite the gloomy macro-economic outlook, global acetic acid consumption was expected to increase by more than 5% in 2012 compared to 2011.
• Global acetic acid prices spiked briefly in March-April 2012 but fell just as quickly as major production outages failed to offer long-term support. Production problems in the US led to moderate price increases in August.
• Capacity increases are set to continue in China for next 1-2 years, but the period of seemingly non-stop acetic acid plant expansions in the country is coming to an end.
• Global utilisation rates at 70-75% in 2012 as producers cut production in order to reduce supplies and maintain margins.
Source: Tecnon OrbiChem

Total 201217.949 Million Tons
6%
4%
3%
12%
9%
16%
50%
Americas
W Europe
NE Asia
SE Asia
ME/Africa
E Europe
China
Source: Tecnon OrbiChem
KICHEM 2012
WORLD CAPACITY TO PRODUCE ACETIC ACID
1%
4%
15%
15%
29%
21%
15%
Total 200510.554 Million Tons
Source: Tecnon OrbiChem
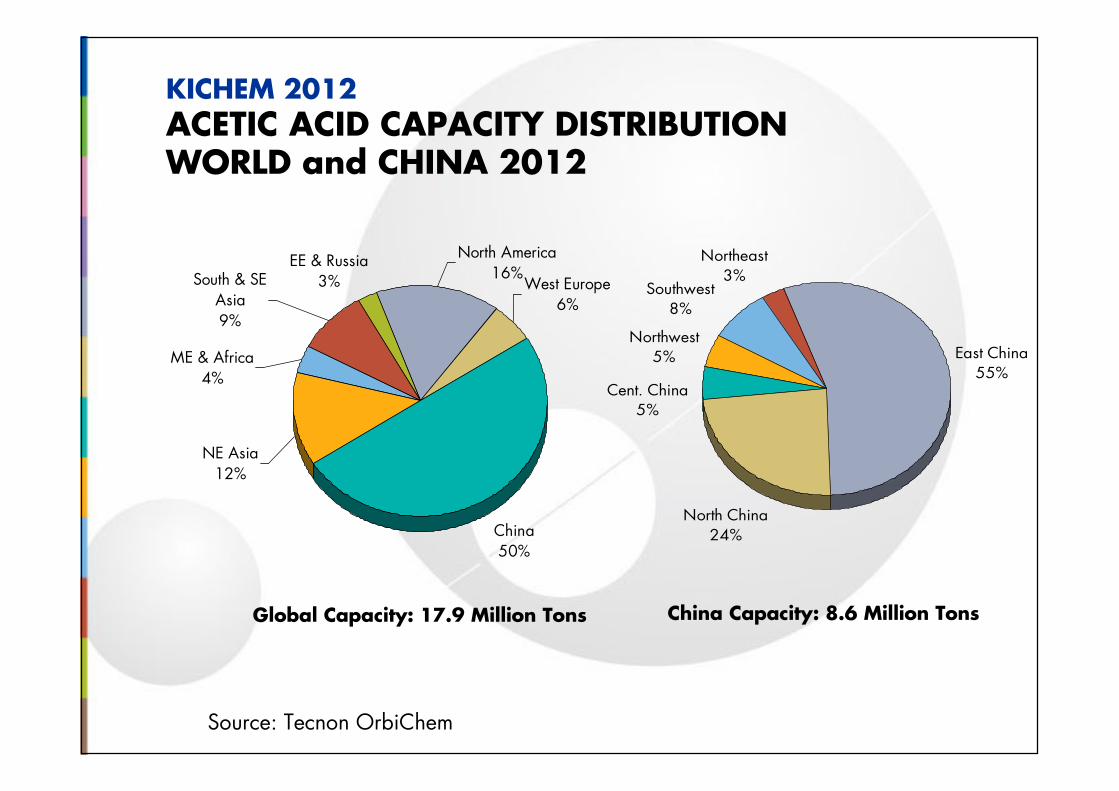
KICHEM 2012
ACETIC ACID CAPACITY DISTRIBUTION WORLD and CHINA 2012
Northeast3%
Southwest8%
Northwest5%
North China24%
Cent. China5%
East China55%
China50%
NE Asia12%
West Europe6%
North America16%
ME & Africa4%
South & SE Asia9%
EE & Russia3%
Global Capacity: 17.9 Million Tons China Capacity: 8.6 Million Tons

1%
19%
19%
23%
28%
10%
14%
3%
38%
12%
9%
16%2012 =12.489 Million Tons
Americas
W/E Europe
NE Asia
SE Asia
ME/Africa
China
Source: Tecnon OrbiChem
KICHEM 2012
WORLD ACETIC ACID CONSUMPTION:2005 vs 2012
2005 = 8.474 Million Tons

Production12.4 Million Tons
NE Asia
N & S America
E & W Europe
S & SE Asia
ME & Africa
China
Source: Tecnon OrbiChem
KICHEM 2012
WORLD ACETIC ACID SUPPLY & DEMAND - 2012
41%
8%5%
15%
10%
21%
37%
3%
15%
15%
20%
10%
Consumption12.4 Million Tons

250
350
450
550
650
750
850
950
1,050
Jan-09Apr-0
9Jul-
09Oct-0
9Jan-1
0Apr-1
0Jul-
10Oct-1
0Jan-1
1Apr-1
1Jul-
11Oct-1
1Jan-1
2Apr-1
2Jul-
12
Dollars per Ton
USGExport
TaiwanImport
ChinaImport
Source: Tecnon OrbiChem
KICHEM 2012
ACETIC ACID PRICES: Q1 2009-2012
EuroContract
ChinaExport
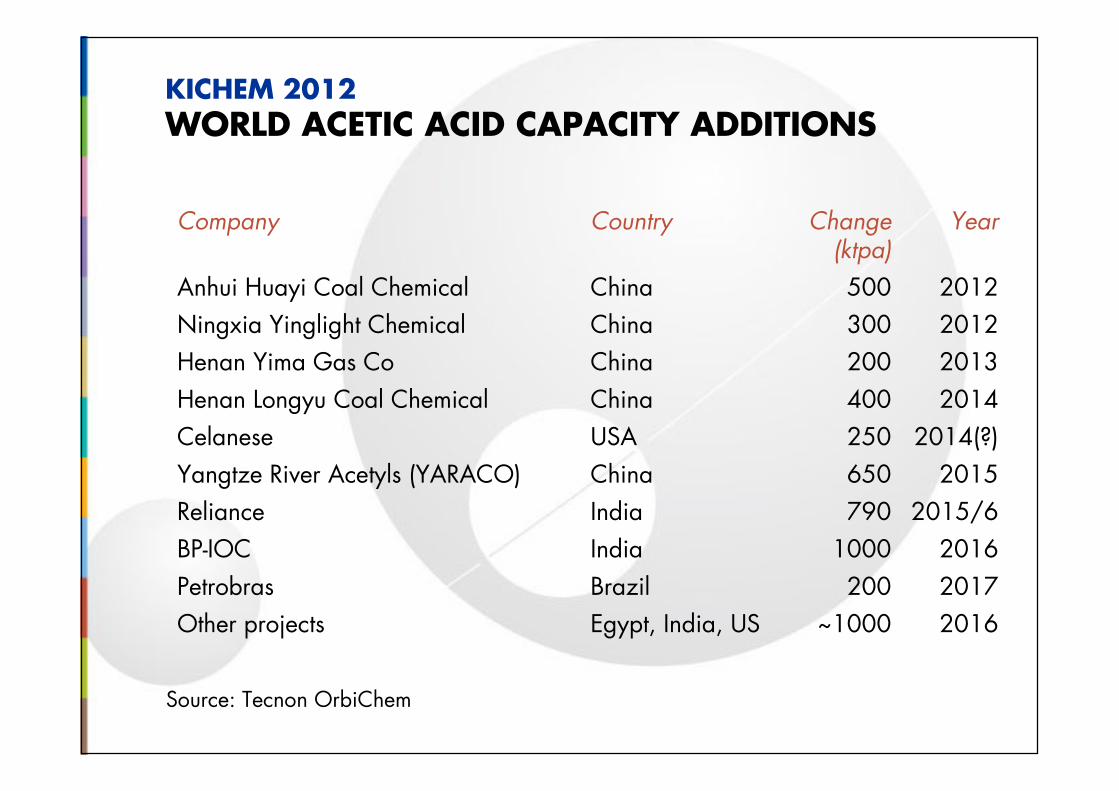
Company Country Change Year(ktpa)
Anhui Huayi Coal Chemical China 500 2012
Ningxia Yinglight Chemical China 300 2012
Henan Yima Gas Co China 200 2013
Henan Longyu Coal Chemical China 400 2014
Celanese USA 250 2014(?)
Yangtze River Acetyls (YARACO) China 650 2015
Reliance India 790 2015/6
BP-IOC India 1000 2016
Petrobras Brazil 200 2017
Other projects Egypt, India, US ~1000 2016
KICHEM 2012
WORLD ACETIC ACID CAPACITY ADDITIONS
Source: Tecnon OrbiChem
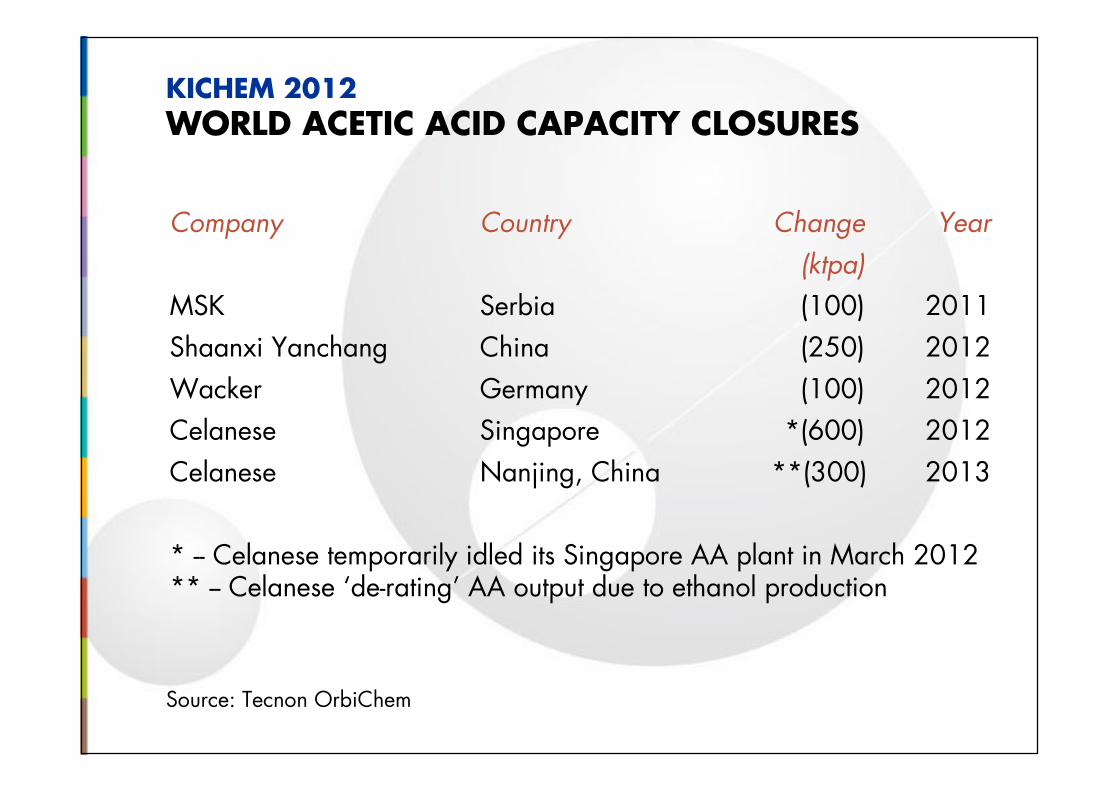
Company Country Change Year
(ktpa)
MSK Serbia (100) 2011
Shaanxi Yanchang China (250) 2012
Wacker Germany (100) 2012
Celanese Singapore *(600) 2012
Celanese Nanjing, China **(300) 2013
* -- Celanese temporarily idled its Singapore AA plant in March 2012** -- Celanese ‘de-rating’ AA output due to ethanol production
KICHEM 2012
WORLD ACETIC ACID CAPACITY CLOSURES
Source: Tecnon OrbiChem
-900
-750
-600
-450
-300
-150
0
150
300
450
600
750
900
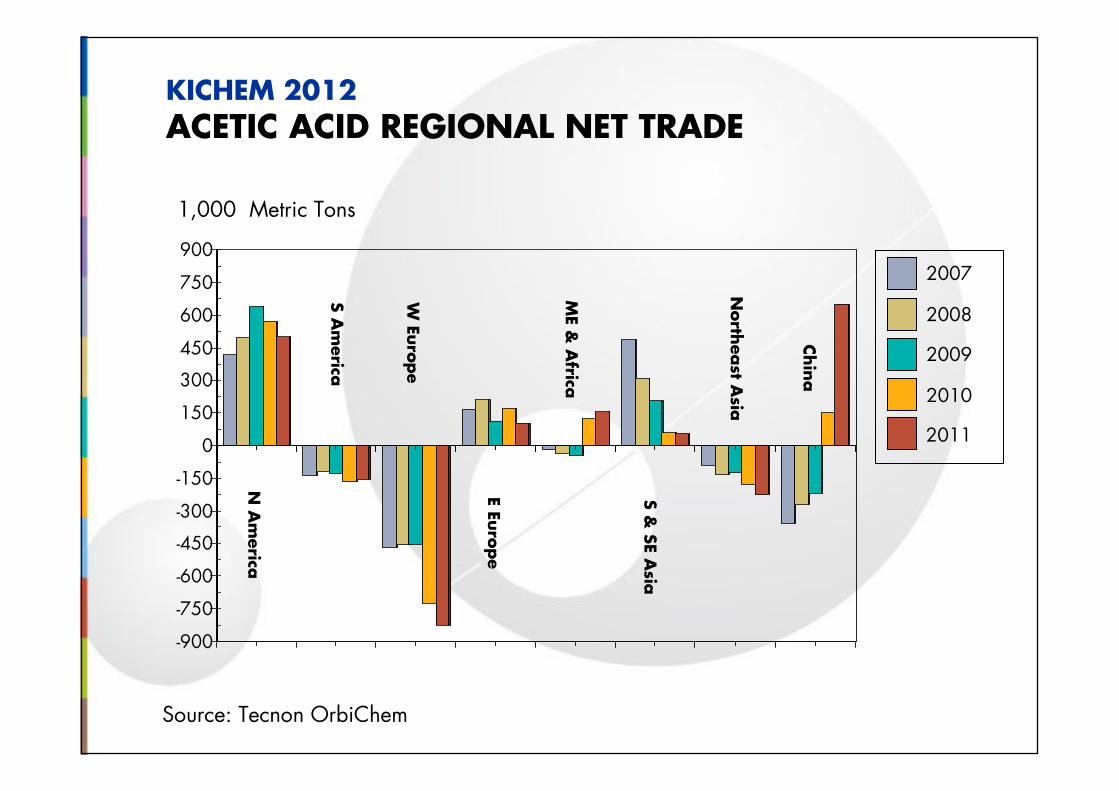
1,000 Metric Tons
Source: Tecnon OrbiChem
KICHEM 2012
ACETIC ACID REGIONAL NET TRADE
S &
SE A
sia
E E
uro
pe
W E
uro
pe
N A
merica
S A
merica
ME &
Africa
North
east A
sia
Chin
a2008
2007
2009
2010
2011

0
200
400
600
800
2000
2001
2002
2003
2004
2005
2006
2007
2008
2009
2010
2011
2012
e
0
100
200
300
400
500
600
700
800
1,000 Metric Tons
Source: Tecnon OrbiChem
US Dollars
KICHEM 2012
CHINA ACETIC ACID IMPORTS and EXPORTS
Import Volume
Export Volume
Import Price
Export Price

KICHEM 2012PRESENTATION OUTLINE
• Current Acetic Acid Market Conditions
• Major Downstream Markets
• Summary and Conclusions
Source: Tecnon OrbiChem
KICHEM 2012
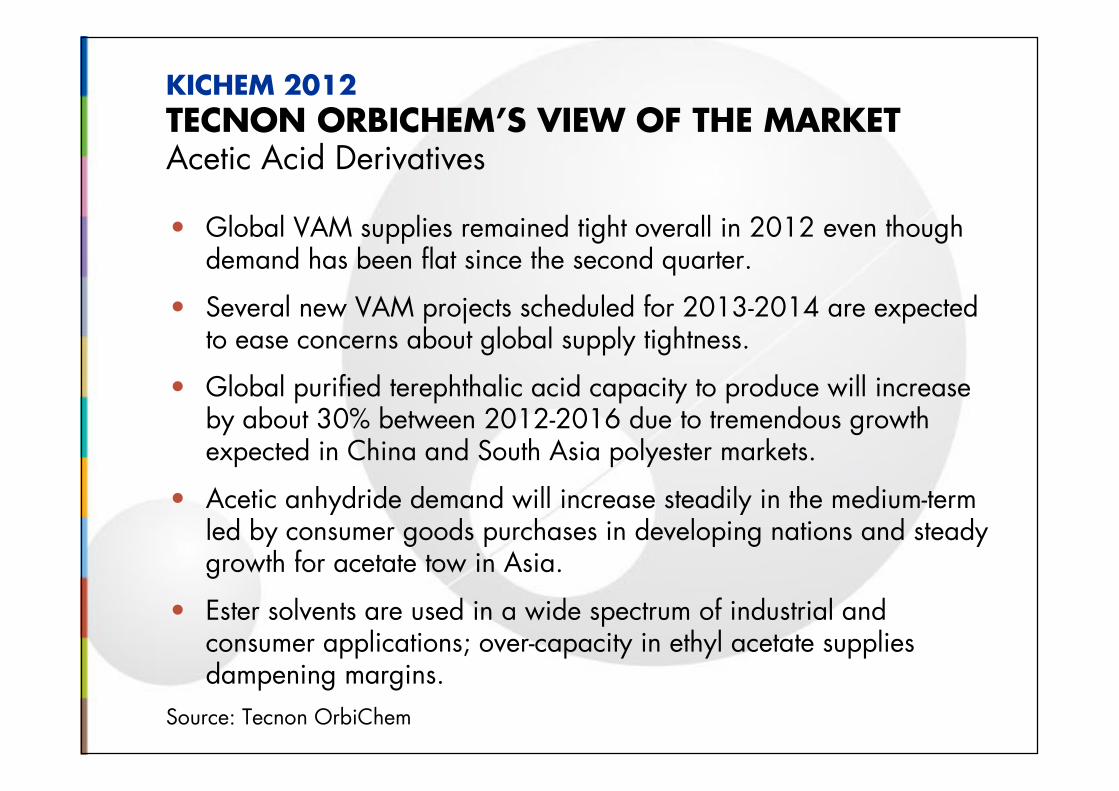
TECNON ORBICHEM’S VIEW OF THE MARKETAcetic Acid Derivatives
• Global VAM supplies remained tight overall in 2012 even though demand has been flat since the second quarter.
• Several new VAM projects scheduled for 2013-2014 are expected to ease concerns about global supply tightness.
• Global purified terephthalic acid capacity to produce will increase by about 30% between 2012-2016 due to tremendous growth expected in China and South Asia polyester markets.
• Acetic anhydride demand will increase steadily in the medium-term led by consumer goods purchases in developing nations and steadygrowth for acetate tow in Asia.
• Ester solvents are used in a wide spectrum of industrial and consumer applications; over-capacity in ethyl acetate supplies dampening margins.
Source: Tecnon OrbiChem

VAM33%
Anhydride14%
Ethyl Acetate12%
Butyl Acetate7%
PTA19%
Others15%
KICHEM 2012
GLOBAL ACETIC ACID CONSUMPTION 2012
Source: Tecnon OrbiChem Total = 12.4 Million Metric Tons

KICHEM 2012ACETIC ACID/ACETYLS CHAIN
Vinyl AcetateMonomer
Vinyl AcetateMonomer
PolyvinylAcetate
PolyvinylAcetate
PolyvinylAlcohol
PolyvinylAlcohol
PolyvinylButyral
PolyvinylButyral
EVA/VAEEVA/VAE
EthyleneEthylene
MethanolMethanol
Acetic AcidAcetic Acid
Natural GasNatural Gas
PTAPTA
Polyester/PET Resin
Polyester/PET Resin
AceticAnhydride
AceticAnhydride Ester SolventsEster Solvents
CoalCoal
MCAAMCAA
Butyl AcetateButyl Acetate
Ethyl AcetateEthyl AcetateAcetate Flake/Acetate Tow
Acetate Flake/Acetate Tow
Construction, Paper,
Packaging
Automotive,Solar
Adhesives, Film, Solar, Coatings
Ag/Pharma,Consumer
Goods
Textiles, Auto,
Packaging
Paints, Coatings, Automotive, Consumer
Goods, Cosmetics
Consumer Goods, Textiles,
Ag/Pharma
Source: Tecnon OrbiChem

Source: Tecnon OrbiChem
KICHEM 2012
ACETIC ACID CONSUMPTION GROWTH
1,000 Metric Tons
0
5,000
10,000
15,000
2009 2010 2011 2012 2013
0
10
20
30
40
50
60
70
80
90
100
VAM
Anhydride
Ethyl Acetate
Butyl/OtherAcetates
PTA
All Others
AA Utilisation
% Utilisation
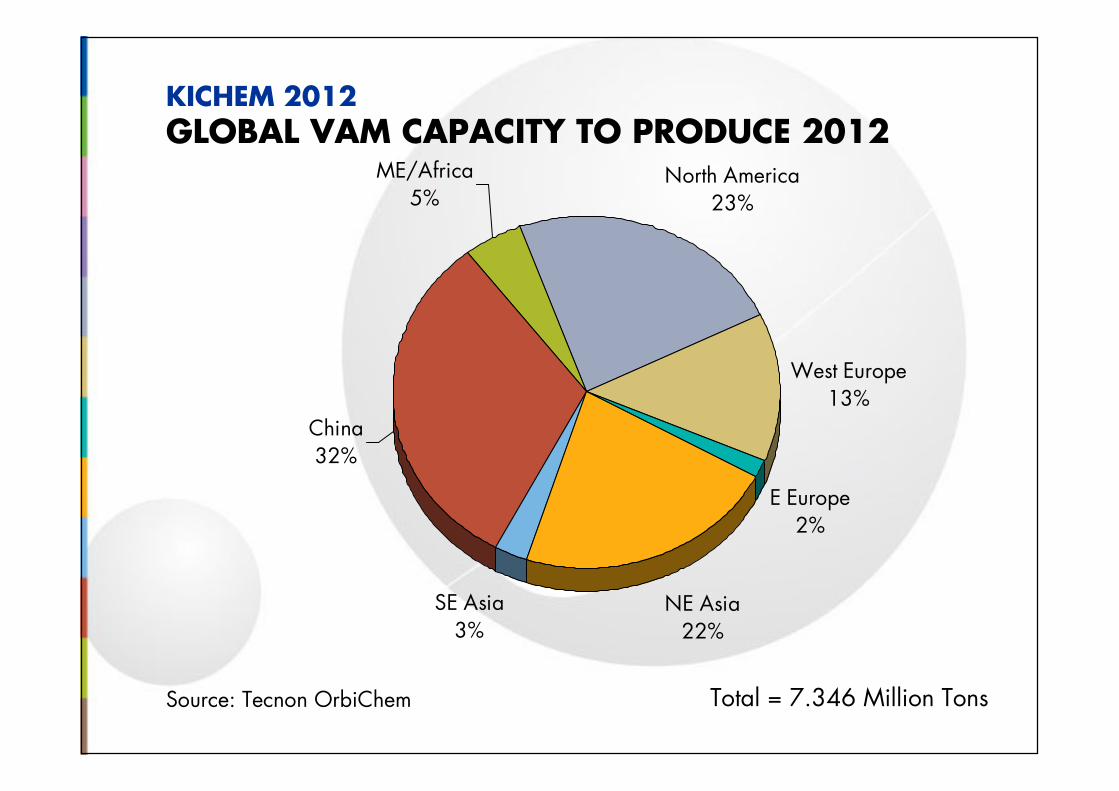
North America23%
West Europe13%
E Europe2%
NE Asia22%
SE Asia3%
China32%
ME/Africa5%
KICHEM 2012
GLOBAL VAM CAPACITY TO PRODUCE 2012
Source: Tecnon OrbiChem Total = 7.346 Million Tons

E Europe~1%
ME/Africa3%
China40%
S America~1%
N America10% W Europe
7%
NE Asia23%
SE Asia16%
Total = 59.6 Million Metric Tons
KICHEM 2012
PTA CAPACITY TO PRODUCE 2012
Source: Tecnon OrbiChem
PTA installed capacity in China to reach 36 million tpaduring 2013/14

E Europe3%
ME/Africa1%
China60%
S America5%
N America4% W Europe
8%NE Asia
6%
SE Asia13%
Total = 4.2 Million Metric Tons
KICHEM 2012
ETHYL ACETATE CAPACITY TO PRODUCE 2012
Source: Tecnon OrbiChem
China Etac plantsoperating close to 50% rates in 2012

South/SE Asia5%
NE Asia9%
China33%
N America37%
W Europe13%
E Europe1%
ME & Africa2%
Total = 3 Million Metric Tons
KICHEM 2012
ACETIC ANHYDRIDE CAPACITY TO PRODUCE 2012
Source: Tecnon OrbiChem
Majority of Acetic Anhydride output used for production of acetate flake/tow

KICHEM 2012PRESENTATION OUTLINE
• Current Acetic Acid Market Conditions
• Major Downstream Markets
• Summary and Conclusions
Source: Tecnon OrbiChem

KICHEM 2012SUMMARY AND CONCLUSIONS
• Growth in downstream derivative capacity has not kept pace with acetic acid capacity growth, but expansion over the next 2-3 years in VAM, PTA and acetate esters markets are expected to make headway into lessening the oversupply of acetic acid.
• Acetic acid utilisation rates globally are forecast to remain between 70%-75% during the period of 2012-2018 based on current capacity figures. Improved business conditions and further rationalisation will impact operating rates moving forward.
• Acetic acid prices remain more sensitive to regional supply/demand problems rather than changes in feedstock prices, but not immune. Feedstock volatility is a constant threat throughout the value chain.
• US acetic acid producers currently enjoy low production costs compared with other regions. Development of shale gas supplies could help US producers maintain cost advantage over many years.
Source: Tecnon OrbiChem

…..your source of expert chemical industry knowledge