acid mediated chemical treatment to remove sugar from
TRANSCRIPT

Accepted Manuscript
Title: Acid mediated chemical treatment to remove sugar fromwaste acid stream from nano-crystalline cellulosemanufacturing process
Authors: Sampa Maiti, Saurabh Jyoti Sarma, Satinder KaurBrar, Rama Pulicharla, Richard Berry
PII: S0144-8617(17)30422-8DOI: http://dx.doi.org/doi:10.1016/j.carbpol.2017.04.033Reference: CARP 12221
To appear in:
Received date: 23-12-2016Revised date: 1-4-2017Accepted date: 14-4-2017
Please cite this article as: Maiti, Sampa., Sarma, Saurabh Jyoti., Brar, SatinderKaur., Pulicharla, Rama., & Berry, Richard., Acid mediated chemical treatment toremove sugar from waste acid stream from nano-crystalline cellulose manufacturingprocess.Carbohydrate Polymers http://dx.doi.org/10.1016/j.carbpol.2017.04.033
This is a PDF file of an unedited manuscript that has been accepted for publication.As a service to our customers we are providing this early version of the manuscript.The manuscript will undergo copyediting, typesetting, and review of the resulting proofbefore it is published in its final form. Please note that during the production processerrors may be discovered which could affect the content, and all legal disclaimers thatapply to the journal pertain.
Acid mediated chemical treatment to remove sugar from waste acid stream from
nano-crystalline cellulose manufacturing process
Sampa Maitia, Saurabh Jyoti Sarmaa, Satinder Kaur Brara*, Rama Pulicharlaa, Richard
Berryc
aInstitut National de la Recherche Scientifique (INRS), Centre Eau, Terre & Environnement,
490 de la Couronne, Québec (QC), G1K 9A9, Canada
cCelluForce, 625-Président-Kennedy avenue, Office 1501, Montreal (Quebec), Canada H3A
1K2
1 Corresponding author: Phone: + 418 654 3116; Fax: + 418 654 2600; E-mail:
Abstract
Nano-crystalline cellulose (NCC) is a nano-scale biomaterial derived from highly abundant
natural polymer cellulose. It is industrially produced by concentrated acid hydrolysis of
cellulosic materials. However, presences of as high as 5-10 % of sugar monomers in spent
sulphuric acid during the manufacturing process, makes it unsuitable for such recycling or
reuse of sulphuric acid. Currently, the industry has been using membrane and ion exchange
technology to remove such sugars, however, such technologies cannot achieve the target of

80-90% removal. In the current investigation, thermal treatment and acid mediated thermal
treatment have been evaluated for sugar removal from the spent sulphuric acid. Almost
complete removal of sugar has been achieved by this approach. Maximum sugar removal
efficiency (99.9%) observed during this study was at 120±1°C for 60 min using 0.8 ratio
(sample: acid) or at 100±1°C for 40 min using 1.5 ratio.
Keywords: Acid hydrolysis; nano-crystalline cellulose; sugar removal, Response surface
methodology (RSM).
1. Introduction
Cellulose constitutes the most abundant renewable polymer resource available today.
Nano-crystalline celluloses (NCCs) have garnered in the materials community a tremendous
level of attention that does not appear to be relenting. These bio-polymeric assemblies
warrant such attention not only because of their unsurpassed quintessential physical and
chemical properties but also because of their inherent renewability and sustainability in
addition to their abundance (Habibi, Lucia, & Rojas, 2010). They have been the subject of a
wide array of research efforts as reinforcing agents in nano-composites due to their low cost,
availability, renewability, light weight, nanoscale dimension, and unique morphology (Peng,
Dhar, Liu, & Tam, 2011).
Typical procedures currently employed for the production of NCCs consist of
subjecting the pure cellulosic material to strong acid hydrolysis under strictly controlled
conditions of temperature agitation, and time (Brinchi, Cotana, Fortunati, & Kenny, 2013;
Karim, Chowdhury, Hamid & Ali, 2016; Rhim, Reddy & Luo, 2015). The nature of the acid
and the acid-to-cellulosic fibers ratio are also important parameters that affect the preparation
of NCCs (Elazzouzi-Hafraoui et al., 2007; Son & Seo, 2015). A resulting suspension is
subsequently diluted with water and washed with successive centrifugations (Bai, Holbery, &
Li, 2009). Dialysis against distilled water is then performed to separate the NCC from the
acid solution (de Souza Lima & Borsali, 2002). Additional steps such as filtration, differential
centrifugation, or ultracentrifugation (using a saccharose gradient) (de Souza Lima & Borsali,
2002) have been also reported (Brinchi et al., 2013; Habibi et al., 2010).
CelluForce® (Montreal, Canada) (http://celluforce.com/en/) is a global leader in
nano-crystalline cellulose (NCCTM) production. NCCs manufacturing process of the industry
and proposed strategy of removing sugar from the acid solution generated during the process
has been presented (Kumar, Negi, Choudhary & Bhardwaj, 2014; Sarma et al., 2016). The
diluted sulfuric acid stream generated during NCCs manufacturing process is subjected to
membrane based ion exchange technique to remove the remaining sugar monomer. However
a significant portion of sugar is still present in the residual acid stream, which could be as
high as 5-10%. Owing to strong hygroscopic nature of sulfuric acid, it makes it difficult for
the manufacturer to concentrate and reuse the same acid stream in presence of such sugars
during a subsequent batch. Currently, waste acid stream from manufacture industry is utilized
mainly to produce biogas or sent to wastewater treatment facility at additional expense. Thus,
in order to make the process more sustainable and environmentally friendly, the industry has
been looking for a simple method to remove at least 80-90% of the sugar without neutralizing
the acid solution, so that it can be concentrated for reuse. Therefore, development of a new
cost-effective and efficient process for the removal of at least 80-90 % of such sugar was the
major objective of this study.

During acid catalyzed thermal-hydrolysis, biopolymeric assemblies (e.g. cellulose and
hemicellulose) are degraded into monomers (e.g. hexoses and pentoses) and further
byproducts as shown in Figure-1 (Choudhary et al., 2013; Shen, Zhang, Xue, Guan, Liu &
Xiao, 2015). However, depending on the process conditions, the conversion of these
biopolymers could be directed in different directions, such as sugars monomers (e. g:
glucose) (Rugg & Brenner, 1982); furfural derivative (furfural and 5-hydroxymethyl furfural)
(Choudhary et al., 2013); levulinic acid (Girisuta, Janssen, & Heeres, 2007), nanostructured
ceramics and nano-composites (Pang, Chin, & Yih, 2011) and others via rehydration,
dehydration and other mechanism (Choudhary et al., 2013). In this context, sulfuric acid
mediated heating could be a promising novel technology for sugar removal from diluted
sulfuric acid stream generated during nano-crystalline cellulose (NCCTM) manufacturing
process. Hence, the objectives of the study were: (1) physicochemical characterization of
waste acid stream from NCC manufacturing process; (2) heating at different temperatures to
evaluate the effect of heating on sugar removal; (3) evaluation of acid mediated heating using
different ratios of sample and acid as a novel method for sugar removal and; (4) optimization
of process parameters, such as time, temperature and acid sample ratio to enhance sugar
removal process. Central composite design was used for optimizing these parameters. This
article will provide an alternative solution to remove residual sugar from the waste acid
stream from NCCTM manufacturing process and the proposed method has the potential to be
an environment-friendly solution.
2. Materials and methods

2.1 Chemicals and Waste acid stream sample
Chemicals, such as sulfuric acid, sodium hydroxide, acetone, methanol, acetonitrile,
NH4OH etc. were purchased from Fisher Scientific (Ontario, Canada). Glucose, xylose,
fructose, treholose, furfural, hydroxymethyl furfural, levulinic acid, acetic acid, among others
have been purchased from Sigma Aldrich (USA). All the standards used for analytical
methods are of analytical grade. Waste acid stream from NCC manufacturing process was
received from CelluForce® (Windsor, Quebec).
2.2 Heating experiment on sugar removal from waste acid stream of manufacturing
process
Heat mediated in-situ acid catalyzed the hydrolysis of cellulose was performed to
reduce sugars and further conversion of other byproducts to reuse the acid. For this
investigation, heating at different temperatures, such as 40 ºC, 60 ºC, 80 ºC and 100 ºC have
been carried out using about 10 mL of sample from the sulfuric acid stream received from
CelluForce® (Windsor, Quebec). Each sample was heated to the aforementioned temperatures
in a closed COD vial and boiled for 120 minutes. After heating, each sample was cooled to
room temperature and total reducing sugars, total carbohydrates and byproducts were
analyzed using different analytical methods (Maiti et al., 2016; Miller, 1959)
(http://web.itu.edu.tr/~dulekgurgen/Carbs.pdf).
2.3 Acid mediated heating experiment on sugar removal from waste acid stream of
manufacturing process

During the transformation of the biopolymer, such as cellulose to sugar monomer and
other byproducts, several operational variables interact and influence the process (Zhang,
Xin, Liu, & Ge, 2015). Slight change in process condition could lead the entire process in a
definite direction (Choudhary et al., 2013). Thus, in order to enhance the sugar removal and
by-products removal, different ratios of (sample: sulfuric acid) have been used at different
temperatures as mentioned earlier in a closed COD vial and boiled for 120 minutes. After
heating, each sample was cooled to room temperature and total reducing sugars, total
carbohydrates and byproducts were analyzed using different analytical methods. Sugar was
finally converted to black nanoparticles. These particles were removed from the solution by
the method described in section 3.7.
2.4 Experimental design and sugars and byproducts removal optimization through
response surface methodology (RSM)
During acid hydrolysis of cellulose, several operational variables interact and
influence the response. Determination of the optimum point can be achieved with a limited
amount of experiments through statistical analysis. Response surface methodology (RSM), a
compilation of mathematical and statistical techniques, can be used to interpret and evaluate
the combined effects of all the factors in the hydrolysis process (Zhang et al., 2015). Central
composite design (Zhang et al., 2015) was applied to investigate sugars and byproducts
removal (dependent variable) as a function of three independent variables: reaction time (A),
temperature (B) and sample & concentrate sulphuric acid ratio (C). Design-Expert-7 software
(Stat-Ease Inc. Minneapolis, MN) has been used to construct the experimental design and the
design has been extended up to +α and –α level (Maiti et al., 2015). The experimental design
resulted in a set of 20 experiments, comprising three different code levels (low (-1), middle

(0) and high (+1)). The ranges of the variables investigated and responses were reported in
terms of sugars (glucose, xylose, and trehalose) and by-products (levulinic acid, 5-HMF)
removal as shown in Table-1 and Table-2.
A quadratic polynomial equation (Eq. 1) was proposed to interlink the effects of the
three independent variables on sugar removal as follows:
(Sugar/Byproducts)removal
= X0+∑ XiYini=1 +∑ XiiYi
2ni=1 +∑ ∑ XijYiYj
nj=i+1
n-1
i=1
(Eq. 1)
where, (Sugar/Byproducts) removal is the dependent variable; Yi and Yj are the
independent variables (n = 3 (A, B and C ); X0 is the intercept constant and Xi, Xii and Xij
correspond to the regression coefficients. The same software (Design-Expert®-7) employed
for test-matrix design was used to check the experimental responses obtained. An analysis of
variance (ANOVA report) was performed to fit the quadratic polynomial equations. Final
values of code factors (A, B, C, A2, B2, C2 etc.) were considered to be statistically significant
at p< 0.05. The quality of the model fit was evaluated by the coefficient of determination (R2)
and the adjusted coefficient of determination (R2Adj).
2.5 Total reducing sugar analysis by standard DNS method
Total reducing sugar concentration was analyzed by di-nitro salicylic acid (DNS)
method (Miller, 1959). Briefly, 200 µL solutions of the sample were taken each time. It was
mixed with 800 µL water and 2 mL of 3, 5 di-nitro salicylic acid reagents (alkaline) and
placed in water bath for 10 minutes at 100 ± 1ºC and cooled to room temperature. Later,
about 7 mL water was added and the solution was vortexed for 30 sec. The optical density

was measured at 540 nm using 200 µL of resulting solution in 96 well polystyrene assay plate
and absorbance readings were then compared to a standard curve prepared using standard
glucose solution.
2.6 Determination of sugar concentration in the acid stream
Sugar concentration in the acid stream was determined by anthrone method and
expressed as total carbohydrate. Briefly, the sample was diluted 50 times with distilled water
and 1 mL of diluted sample was taken. Later, about 2 mL of chilled H2SO4 (75% v/v) was
mixed with the sample. This solution was then mixed with 4 mL of chilled anthrone reagent
and the resulting mixture was taken in a closed COD vial and boiled for 15 minutes at 100 ±1
ºC. After cooling to room temperature, absorbance was measured at 578 nm
(http://web.itu.edu.tr/~dulekgurgen/Carbs.pdf). Anthrone reagent used in this analysis was
freshly prepared by dissolving 0.5 g of anthrone in 10 mL of ethanol and by making up the
volume to 250 mL by using H2SO4 (75%).
2.7 Reducing sugars and different by-products analysis by LC/MS-MS method
Reducing sugars (e.g: glucose etc.) and complex mixture of other by-products (such
as furfural, 5-hydroxymethyl furfural (5-HMF), levulinic acid, among others) were generated
during acid hydrolysis of cellulose. To analyze different reducing sugars, liquid samples were
collected and analyzed using Liquid Chromatography - Mass Spectrometry equipped with
5µm, 150 mm ID, 4.6 mm df column where D6 glucose was used as internal standard.
Likewise, different inhibitors produced during hydrolysis were analyzed by Liquid
Chromatography - Tandem Mass Spectrometry (ZORBAX Carbohydrate, Agilent
Technologies, USA) equipped with biobasic-18 column (5µm, 250 mm ID, 4.6 mm df) of
Agilent Technologies, USA was used. Before injecting the sample in LC/MS-MS for product
analysis, the sample was centrifuged for 5 minutes at 7650 x g and the supernatant was

filtered by 0.45 µm syringe filter. Phenylethanol-D5 is used as internal standard for inhibitory
analysis. Before injecting the sample in LC/MS-MS for product analysis, the sample was
centrifuged for 5 minutes and the supernatant was filtered by 0.45 µm syringe filter.
Methanol: water (8:2) and acetonitrile: water (8.5:1.5) was used to dilute the sample before
analyzing the inhibitors and carbohydrate. All data presented are an average value from
duplicate runs for triplicate samples. The standard deviation for each data has been calculated
with respect to the average (mean) value from duplicate runs for triplicate samples.
Sugars, as well as by-products removal,, were calculated using (Eq. 2):
Removal of (sugar/ byproducts) (%)= 100 x Sugar/ byproducts acid removed after reaction (g)
Initial sugars/ byproducts (g) (Eq. 2)
2.8 Particle size analysis
Black particles obtained during the current investigation were characterized for
particle size and zeta-potential distribution. This analysis was carried out using a zetasizer
nano ZS (Malvern instruments Ltd., UK). Distilled water was used to disperse the activated
carbon particles used in this analysis. Finally, scanning electron microscope (SEM) analysis
was carried out for further investigation.
2.9 Statistical analysis
All the data were an average of successive three reading of measurements using either
standard or developed methods. Standard deviations were calculated based on these means
and average values.
3. Results and discussion
3.1 Characterization of waste acid stream sample

Prior to sugar removal experiment, physicochemical characterization of the waste acid
stream from manufacturing process has been analysed to assess carbon pool. The pH of the
waste acid stream sample was about (0.6±0.1) whereas its total carbohydrate concentration
was about 6510 mg/L. Glucose (3664.5 mg/L) and xylose (857.1 mg/L) were the two major
sugar monomers present in the solution. A small amount of disaccharides, such as trehalose
(102.4 mg/L) and oligosaccharides were the other likely constituents of the sample together
with by-products, such as furfural derivatives, furfural (56.8 mg/L), 5-hydroxy methyl
furfural (110.2 mg/L) and levulinic acid (76 mg/L).
3.2 Heating experiment on sugar removal from waste acid stream from
manufacturing process
During acid catalyzed thermal-hydrolysis, cellulose degraded into hexose (e.g.
glucose). Hexoses are primarily dehydrated to 5-HMF, which is accelerated by Brønsted acid
catalysts, and thereupon 5-HMF is rehydrated into levulinic acid as shown in Figure-
1.However, depending on the process conditions, these sugar monomers could also end up
with other by-products rather than levulinic acid (Choudhary et al., 2013; Galletti, Antonetti,
De Luise, Licursi, & Nassi, 2012; Hu, Song, Wu, Gholizadeh, & Li, 2013). Typically, the
concentration of sulphuric acid during hydrolysis reactions to obtain NCCs does not vary
much from a typical value of ca. 65% (wt); however, the temperature can range from 25 °C
up to 70 °C and the corresponding hydrolysis time can be varied from 30 min to overnight
depending on the temperature (Habibi et al., 2010). In order to study the in-situ acid catalyzed
conversion of free sugar monomers to corresponding by-products, the samples were heated at
different temperatures as mentioned in section 2.2. The purpose of this study was to convert
sugar monomer to other by-products to remove sugar from the waste sample as shown in
Figure-1. However, no significant colour change and by-products conversion was observed at
the end of experiments as shown in Figure-2 (a). From Figure -2 (a), it has been evident that

with increase in heating temperature (40-100 °C ), percentage of removal is slowly increased
and compared with control, percentage of sugar removal from heat mediated auto-hydrolysis
leads to only around (15-20%) from the waste effluent at 100°C for 1 hr. Moreover, to
enhance this removal efficiency, different time durations have been considered for further
investigation. Percentage of sugar removal with increased time duration was increased but
ranged from (20-30%). Thus, heating up to 100 °C for different time durations in closed COD
tube was not so effective to provide enough activation energy for higher conversion of
reducing sugar to other by-products.
3.3 Acid mediated heating experiment on sugar removal from waste acid stream
from manufacturing process
Effect of diluted different mineral acid on hydrolysis has been investigated previously
by (Sarchami el at., 2014). It has been reported that as compared to HCl, H3PO4, sulfuric
acid (H2SO4) had a positive impact on diluted mineral acid catalyzed the hydrolysis of
cellulose (Hamid & Ali, 2016; Sarchami & Rehmann, 2015). Thus, for the current
investigation, H2SO4 has considered for dilute mineral acid catalyzed the hydrolysis of the
waste sample. Previously, it has been observed that the sugar removal efficiency slightly
increases with an increase in temperature. Thus, acid mediated thermal treatment was carried
out initially at 100°C for 2 h using different ratios of sample: sulphuric acid concentrated
(H2SO4: 18M). As mentioned in the materials and methods section, the purpose of this study
was to hydrolyze any disaccharides or oligosaccharides which were present in the solution to
corresponding monomers as well as the further conversion of monomer to other by-products
to remove the sugars from the solution. Different ratios of the sample and sulfuric acid have
been investigated to enhance the removal efficiency of sugar from waste effluent. Results of

this investigation have been presented in Figure-2 (b). From Figure-2 (b), it has been shown
that increase in the sample: acid ratio had a positive effect on the removal of sugar from
waste effluent. About (1:1) ratio of sample and sulphuric acid and higher (sulphuric acid:
sample) proved to be promising compared to other ratios in current process condition.
Around 99% of sugar (glucose, xylose trehalose) removal was observed when (1:1) ratio of
sample and 18 (M) sulphuric acid was mixed and heated together at 100°C for 2 h. Thus,
present process conditions ((1:1) ratio of sample and sulphuric acid, 100°C for 2 h) was
promising for removal of sugar from the waste sample.
3.4 Optimization of process parameters to enhance sugar removal efficiency from
waste acid stream from manufacturing process
The responses (sugars removal from the waste acid stream from the manufacturing
process) obtained for different runs of experiments carried out using four independent
variables (reaction time (A), temperature (B) and the ratio of sample and sulphuric acid (C)
have been presented in Table-2. Obtained responses of the experiments were analyzed by
using the same software (Design-expert) used for designing of the experiments. The response
surface quadratic model was suggested for the response observed in terms of glucose, xylose
and trehalose removal. The ANOVA reports for the response surface quadratic model are
presented in Table-3. The model was highly significant (p < 0.0004) for the observed
responses of sugar removal from the waste acid stream from the manufacturing process. In
fact, smaller the magnitude of p (p< 0.05), the more significant the corresponding factor.
Based on this criterion, temperature (B) and sample sulphuric acid ratio (C) showed a
significant effect (p< 0.05) in LA production. On the other side, time (A) presented
comparatively less significant effect on LA production. The quadratic terms, such as
(substrate: sulphuric acid) showed a highly significant negative effect on sugar removal (p<
0.0001) indicating the fact that it could turn into a limiting factor and its variation could

lower sugar removal. Corresponding equations to predict sugar removal from the waste acid
stream from the manufacturing process in terms of real factors are as follows (Eq. 3- 4):
Glucoseremoval= -362.86 +0.79 ×Time+3.21×Temp+282.98 ×H2SO4-4.49E-003 ×Time ×Temp
-0.128 × Time ×H2SO4-1.34× Temp×H2SO4-5.29E-004 ×Time2-34.81×H2SO42 -1.196E-003×Temp2
…………………..
(Eq.-3)
Xyloseremoval
= -225.83 +0.79 ×Time+3.21×Temp+282.98 ×H2SO4-4.49E-003 ×Time ×Temp
-0.128 × Time ×H2SO4-1.34× Temp×H2SO4-5.29E-004 ×Time2-34.81×H2SO42 -1.196E-003×Temp2
…………………..
(Eq.-4)
The goodness of the model adjusted for the range of variables posed was checked by
the determination coefficient (R2). In both models, R2 values higher than 0.93 indicated that
93% variations in sugar removal can be well explained by the model. The adjusted R2 value
higher than 93% indicated that experimental and predicted values fit well. Sugar removal
ranged from about 6.18% to a maximum 99.99% for glucose, while it oscillated from 48.98%
g to 99.99 and 81.20% to 99.99% for xylose and trehalose removal.
Figure 3 (a) and 3 (b) show the response surface plots and the corresponding contour
plot of the quadratic model developed for sugar removal, such as glucose and xylose,
respectively from the waste acid stream from the manufacturing process. Each figure consists
of three graphs, where one different variable is kept at a constant level and the other two
varied with the experimental values chosen. Therefore, the relationship between sugar

removal and experimental levels of each variable and interactions between the remaining two
independent terms are visually observed. The shapes of the plots are related to the intensity of
interactions between the independent terms (Zhang et al., 2015). In this case, the three-
dimensional surface diagram given for the both substrates indicated strong interactions
between all three of them. Additionally, a local optimum point was defined for each case in
the experimentally investigated range, which indicated that sugars removal were sensitive to
modifications in the independent variables’ values.
Regarding the optimized parameters, currently optimized acid mediated heating
allowed 50% reduction in processing time from 2 h to 1 h. Apart from process time reduction,
the heating method has offered additional improvements (e.g. sample: acid ratio reduction) in
the literature (Szabolcs, Molnár, Dibó, & Mika, 2013). With respect to sample: acid ratio,
sugar removal achieved a maximum at 0.8 for all sugars, such as glucose, xylose, and
trehalose as shown in Figure-3 (a) and (b). Even for the current investigation, the addition of
higher ratio compared to 0.8 also resulted in the same (99.9% removal of each sugar). These
results were similar to the literature when enhanced acid strength mediated hydrolysis of
biopolymers (such as cellulose, hemicellulose) resulted in higher levulinic acid production
with no sugar remaining (Galletti et al., 2012). A temperature setting of 120±1 °C was
chosen based on current investigation and to avoid the sharp increase of brown/black humins
generation (dehydration undesired by-products) when reaction temperature was above 170 °C
which was hard to separate (Szabolcs et al., 2013).
Thus, it is evident that acid mediated heating at 120°C, 0.8 ratio, for 60 min removed
more than 99% of sugars from the waste sample. However, with an increase in the sample:
acid ratio, similar results were also obtained at a comparatively lower temperature of around
100°C and lower time of 40 min as shown in Figure 4 and 5. Furthermore, either heating at

120°C for 60 min using 0.8 ratio or at 100°C for 40 min using 1.5 ratio were observed to be
promising options sugar removal from the waste sample.
3.5 Investigation of different by-products during acid mediated heating experiment
on sugar removal from waste acid stream from manufacturing process
During acid mediated hydrolysis of biopolymer (e.g. cellulose) monomer, such as
glucose was produced and depending on the process condition was further converted to
different by-products (e.g. furfural, 5-hydroxy methyl furfural, levulinic acid, among others)
as shown in Figure-1. Results of this investigation have been presented in Figure 6. As seen
earlier, increase in the sample: acid ratio had a positive effect on by-products formation. With
the increase in the ratio (sample: acid) from (6:1) to (1:1) by-products, levulinic acid
production significantly increased from 0.19 g/L to 2.1 g/L. Previously, it has been observed
that when (1:1) ratio was used, around 99% sugar was removed which implied that this sugar
has been converted to mainly levulinic acid and other by-products as shown in Figure-4.
Although, this method can convert sugar to its derivatives, still it cannot be considered as
actual sugar removal as long as the by-products are there. However, for the same
experimental conditions, when the ratio was changed to (1:1.5) no sugar as well as by-
products, such as levulinic acid, furfural, 5-hydroxymethyl furfural was reported ( Figure-4).
Thus, (1:1.5) sample: acid ratio led to around 99.99% of sugar and by-products removal from
the waste acid solution. All these compounds were converted to black carbon particles which
were removed by centrifugation. Furthermore, different parameters, such as time, temperature
and sample: acid ratio which have their influence in by-products formation, have been
optimized using central composite model (Zhang et al., 2015).

3.6 Optimization of process parameters to enhance by-products removal from waste
acid stream from manufacturing process
The similar central composite design was used to study the interaction effects of the
three factors and find the suitable values of these variables to remove by-products and the
measured responses are mentioned in session 3.1. Results of this study have been presented in
Figure-S1 (supplementary file) Increase in substrate acid ratio and temperature have a
positive effect on by-products, such as levulinic acid and 5-HMF removal. Thus, at 100°C for
40 min using 1.5 sample: acid ratio was observed to be promising in by-products removal
from the waste sample.
3.7 Investigation of black particles formed at the end of acid mediated heating
experiment on sugar removal from waste acid stream from manufacturing process and
reuse of acid
Black particles were produced during the treatment to remove sugar present in the
waste acid stream. To analyze the black particles produced at the end of acid mediated
heating, particle size and zeta-potential distribution were measured. Particles are found to be
around 18.6 nm in diameter which indicated that present black particles were of nano-
diameter. For further characterization of the particles, scanning electron microscope (SEM)
imaging was carried out as shown in Figure-5. Figure-5 (A-1 and A-2) represented the SEM
image of starting material and the particle size was about 1.5 µm. Figure-5 (B-1 and B-2)
represented the SEM of the sample after acid treatment and containing the black particles.
From the images, it is evident that the black particles are of needle shape and with nano-
diameter. However, in order to reuse the acid, removal of black particles was required. To
remove the black nanoparticles generated during treatment, sodium hydroxide treatment was
carried out. Around 0.1 (M) of NaOH was used in different ratios with sample followed by

centrifugation. From the results, it was evident that (sample: 0.1 (M) NaOH = 1:1) ratio was
promising in this context followed by centrifugation. Thus, acid mediated heating treatment
followed by NaOH treatment could assist in the reuse of acid instead of biogas production or
being sent to wastewater treatment facility at additional expense.
4. Conclusions
Acid mediated thermal treatment of waste acid stream from NCC manufacturing
process was confirmed to be promising in sugar removal. The approach will be helpful for
efficient recycling of the acid used in the process. An investigation using response surface
methodology has shown that temperature, time and substrate acid ratio are the dominating
factors for successful removal of sugar as well as different byproducts. Heating at 120°C for
60 min using 0.8 sample: acid ratio or at 100°C for 40 min using 1.5 sample: acid ratio
showed excellent results in sugar or and by-products removal from the waste sample.
5. Acknowledgement
NSERC CRD and Prima-Quebec have been acknowledged for financial support.
Contributions of the technical staff of INRS involved in sample analysis have been
acknowledged. CelluForce is acknowledged for providing sugar samples and technical
support.

Reference
Bai, W., Holbery, J., & Li, K. (2009). A technique for production of nanocrystalline cellulose
with a narrow size distribution. Cellulose, 16(3), 455-465.
Brinchi, L., Cotana, F., Fortunati, E., & Kenny, J. (2013). Production of nanocrystalline
cellulose from lignocellulosic biomass: technology and applications. Carbohydrate Polymers,
94(1), 154-169.
Choudhary, V., Mushrif, S. H., Ho, C., Anderko, A., Nikolakis, V., Marinkovic, N. S.,
Frenkel, A. I., Sandler, S. I., & Vlachos, D. G. (2013). Insights into the interplay of Lewis
and Brønsted acid catalysts in glucose and fructose conversion to 5-(hydroxymethyl) furfural
and levulinic acid in aqueous media. Journal of the American Chemical Society, 135(10),
3997-4006.
de Souza Lima, M. M., & Borsali, R. (2002). Static and dynamic light scattering from
polyelectrolyte microcrystal cellulose. Langmuir, 18(4), 992-996.
Elazzouzi-Hafraoui, S., Nishiyama, Y., Putaux, J.-L., Heux, L., Dubreuil, F., & Rochas, C.
(2007). The shape and size distribution of crystalline nanoparticles prepared by acid
hydrolysis of native cellulose. Biomacromolecules, 9(1), 57-65.
Galletti, A. M. R., Antonetti, C., De Luise, V., Licursi, D., & Nassi, N. (2012). Levulinic acid
production from waste biomass. BioResources, 7(2), 1824-1835.
Girisuta, B., Janssen, L., & Heeres, H. (2007). Kinetic study on the acid-catalyzed hydrolysis
of cellulose to levulinic acid. Industrial & engineering chemistry research, 46(6), 1696-1708.
Habibi, Y., Lucia, L. A., & Rojas, O. J. (2010). Cellulose nanocrystals: chemistry, self-
assembly, and applications. Chemical reviews, 110(6), 3479.
Hamid, S. B. A., Chowdhury, Z. Z., Karim, M. Z., & Ali, M. E. (2016). Catalytic Isolation
and Physicochemical Properties of Nanocrystalline Cellulose (NCC) using HCl-FeCl3
System Combined with Ultrasonication. BioResources, 11(2), 3840-3855.
Hu, X., Song, Y., Wu, L., Gholizadeh, M., & Li, C.-Z. (2013). One-pot synthesis of levulinic
acid/ester from C5 carbohydrates in a methanol medium. ACS Sustainable Chemistry &
Engineering, 1(12), 1593-1599.
Karim, M. Z., Chowdhury, Z. Z., Hamid, S. A., & Ali, M. E. (2016). Optimizing the
pretreatment condition for α-cellulose using lewis acid catalyst. Sci. Adv. Mater., 8, 534-544.
Kumar, A., Negi, Y. S., Choudhary, V., & Bhardwaj, N. K. (2014). Characterization of
cellulose nanocrystals produced by acid-hydrolysis from sugarcane bagasse as agro-waste.
Journal of Materials Physics and Chemistry, 2(1), 1-8.
Maiti, S., Sarma, S. J., Brar, S. K., Le Bihan, Y., Drogui, P., Buelna, G., & Verma, M.
(2016). Agro-industrial wastes as feedstock for sustainable bio-production of butanol by
Clostridium beijerinckii. Food and Bioproducts Processing, 98, 217-226.
Maiti, S., Sarma, S. J., Brar, S. K., Le Bihan, Y., Drogui, P., Buelna, G., Verma, M., &
Soccol, C. R. (2015). Novel spectrophotometric method for detection and estimation of
butanol in acetone–butanol–ethanol fermenter. Talanta, 141, 116-121.
Miller, G. L. (1959). Use oi Dinitrosalicylic Acid Reagent tor Determination oi Reducing
Sugar. Analytical chemistry, 31(3), 426-428.
Pang, S. C., Chin, S. F., & Yih, V. (2011). Conversion of cellulosic waste materials into
nanostructured ceramics and nanocomposites. Adv. Mater. Lett, 2(2), 118-124.
Peng, B. L., Dhar, N., Liu, H., & Tam, K. (2011). Chemistry and applications of
nanocrystalline cellulose and its derivatives: a nanotechnology perspective. The Canadian
Journal of Chemical Engineering, 89(5), 1191-1206.

Rhim, J.-W., Reddy, J. P., & Luo, X. (2015). Isolation of cellulose nanocrystals from onion
skin and their utilization for the preparation of agar-based bio-nanocomposites films.
Cellulose, 22(1), 407-420.
Rugg, B. A., & Brenner, W. (1982). Process for the chemical conversion of cellulose waste to
glucose. Google Patents.
Sarchami, T., & Rehmann, L. (2015). Optimizing acid hydrolysis of Jerusalem artichoke-
derived inulin for fermentative butanol production. BioEnergy Research, 8(3), 1148-1157.
Shen, D., Zhang, L., Xue, J., Guan, S., Liu, Q., & Xiao, R. (2015). Thermal degradation of
xylan-based hemicellulose under oxidative atmosphere. Carbohydrate Polymers, 127, 363-
371.
Son, H. N., & Seo, Y. B. (2015). Physical and bio-composite properties of nanocrystalline
cellulose from wood, cotton linters, cattail, and red algae. Cellulose, 22(3), 1789-1798.
Szabolcs, Á., Molnár, M., Dibó, G., & Mika, L. T. (2013). Microwave-assisted conversion of
carbohydrates to levulinic acid: an essential step in biomass conversion. Green Chemistry,
15(2), 439-445.
Zhang, Y., Gao, X., Liu, J., & Ge, Y. (2015). Pilot production of Clonostachys rosea conidia
in a solid‐ state fermentor optimized using response surface methodology. Engineering in
Life Sciences, 15(8), 772-778.

Tautomerisation
D-Fructofuranose
D-Glucopyranose
O O
HO
5-Hydroxymethyl furfural
- 3 H2O
-2H2O
HCOOH
OO
Furfural
O
O
OH
Levulinic acid
+ 2H2O
HCOOH
O
OH
OH
OH
HO
HO
O
OH
HO
HO
D-Fructopyranose
OH
O
HO
OH
CH2OH
OH
HO
CH2OH
O
OH
Furfuryl alcohol
O
O
O
O
HO
HO
OH
OH
OO
O
HOOH
OH
OH
OH
HO
OH
OHOH
n
H+
Cellulose
Figure-1: Schematic presentation of acid catalyzed conversion of nanocrystalline cellulose
(NCCs) to monomer (e.g. glucose) and further conversion to other by-products.
0
1000
2000
3000
4000
5000
Controle Filter only sample +40C
sample +60C
sample +80C
sample +100C
Suga
r (m
g/L)
Glucose (mg/L)(a)

Figure-2 Effect on sugar removal from waste effluent of nano-crystalline cellulose (NCC)
manufacturing process; (a): heating on in-situ hydrolysis; (b): acid mediated heating
0
1000
2000
3000
4000
5000
Controle (6:1)
Sample:
Acid
(4:1)
Sample:
Acid
(2:1)
Sample:
Acid
(1:1)
Sample:
Acid
(1:1.5)
Sample:
Acid
Su
ga
r (m
g/l
)
Glucose (mg/L)
Xylose(mg/L)
(b)


Figure-3 : Effect of different parameters on acid mediated heating to remove (a) glucose and
(b) xylose from waste effluent from nano-crystalline cellulose (NCC) manufacturing
processing

Figure-4: Effect of acid mediated heating on by-product formation to remove sugars from the
waste effluent from nano-crystalline cellulose (NCC) manufacturing process.

Figure-5: Scanning electron microscope image where A-1: waste sample without treatment
at lower magnification; A-2: waste sample without treatment at higher magnification; B-1:
waste sample with acid mediated heating treatment at lower magnification; B-2: waste
sample with acid mediated heating treatment at higher magnification.
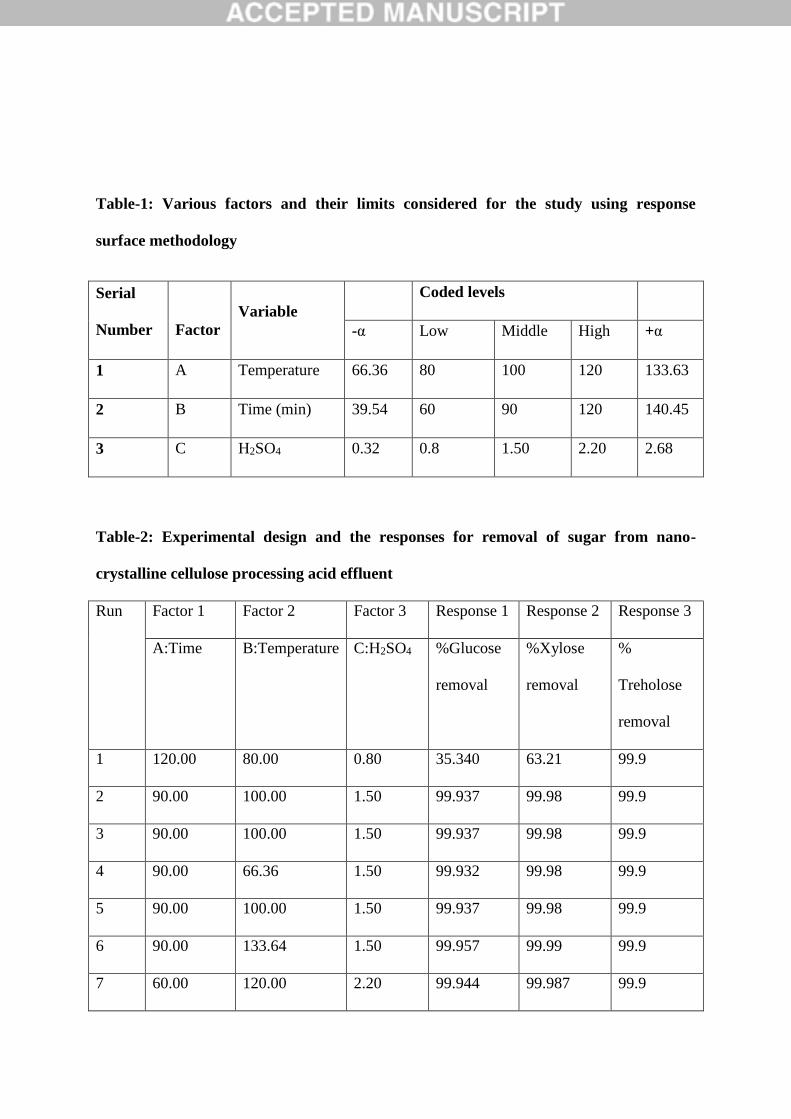
Table-1: Various factors and their limits considered for the study using response
surface methodology
Serial
Number
Factor
Variable Coded levels
-α Low Middle High +α
1 A Temperature 66.36 80 100 120 133.63
2 B Time (min) 39.54 60 90 120 140.45
3 C H2SO4 0.32 0.8 1.50 2.20 2.68
Table-2: Experimental design and the responses for removal of sugar from nano-
crystalline cellulose processing acid effluent
Run Factor 1 Factor 2 Factor 3 Response 1 Response 2 Response 3
A:Time B:Temperature
C:H2SO4 %Glucose
removal
%Xylose
removal
%
Treholose
removal
1 120.00 80.00 0.80 35.340 63.21 99.9
2 90.00 100.00 1.50 99.937 99.98 99.9
3 90.00 100.00 1.50 99.937 99.98 99.9
4 90.00 66.36 1.50 99.932 99.98 99.9
5 90.00 100.00 1.50 99.937 99.98 99.9
6 90.00 133.64 1.50 99.957 99.99 99.9
7 60.00 120.00 2.20 99.944 99.987 99.9

8 60.00 80.00 0.80 13.669 40.98 81.20
9 60.00 120.00 0.80 99.923 99.962 99.9
10 120.00 80.00 2.20 99.925 99.9618 99.9
11 39.55 100.00 1.50 99.917 99.9543 99.9
12 90.00 100.00 1.50 99.937 99.98 99.9
13 120.00 120.00 0.80 99.909 99.913 99.9
15 120.00 120.00 2.20 99.990 99.98 99.9
16 90.00 100.00 1.50 99.937 99.98 99.9
17 140.45 100.00 1.50 99.99 99.99 99.9
18 90.00 100.00 0.32 6.183 60.9 99.9
19 90.00 100.00 2.68 99.900 99.9 99.9
20 60.00 80.00 2.20 99.980 99.95 99.9

Table 3. Analysis of variance (ANOVA) for the fitted quadratic polynomial model for
removal of sugar from nano-crystalline cellulose processing acid effluent.
Source
Sum of
squares
Degree of
freedom
Mean
square
p-value*
Model
15869.50
9 1763.28 < 0.0004
A-Time 34.70 1 34.70 0.06457
B-Temperature 1667.20 1 1667.20 0.0082*
C-(Sample:H2SO4) 6973.75 1 6973.75 < 0.0001*
AB 58.25 1 58.25 0.5529
AC 58.68 1 58.68 0.5514
BC 2842.36 1 2842.36 0.0016*
A2 3.26 1 3.26 0.8874
B2 3.30 1 3.30 0.8867
C2 4195.01 1 4195.01 0.0004*
Residual 1544.80 10 1415.86 -
Lack of fit 1544.80 5 2123.79 -
Core total 17414.30 19 -
-
-
* Significant (p < 0.05)