acoustic monitoring with the beaufort shelf cabled observatory peter mikhalevsky acoustic and marine...
Post on 21-Dec-2015
216 views
TRANSCRIPT

Acoustic Monitoring with the Beaufort Shelf Cabled Observatory
Peter Mikhalevsky
Acoustic and Marine Systems Operation
SAIC, Arlington, VA
Cabled Observatory Workshop
Barrow, Alaska Feb. 7-8, 2005

Acoustics in Arctic Observatories• Acoustic Remote Sensing
– Acoustic Thermometry and Tomography
– Acoustic Halinometry
– Acoustic Digital Current Profilers
– Upward looking Ice Profiling Sonar
– Multi-beam and side scan bathymetry and bottom profiling from AUV’s
– Acoustic backscatter for biologics, effluents
• Ambient Noise Monitoring– Marine mammals (bowhead whales)
– Ice noise (correlated with thickness)
– Seismics
– Manmade noise, seismic surveys, drilling
• Acoustic Communications – Data Telemetry and Network Control
• Subsurface Navigation

Acoustic Remote SensingSpeed of sound is a function of water
temperature and velocity and these can be derived from travel time measurements
• Acoustic Thermometry– Average temperature and integral or
average heat content along the propagation path between source and receiver, scale is function of source-receiver separation.
– Arctic Ocean uniquely suited for acoustic thermometry due to good coupling of acoustic modes and major Arctic water masses

Acoustic Remote Sensing• Transport monitoring with acoustics
– Use reciprocal transmissions to obtain projection of average transport along the propagation path
– Two paths at different angles resolve current direction and speed
– Combination of transport and heat measurements can provide heat flux
• Acoustic Tomography– Use many intersecting paths to obtain
spatial resolution and circulation, scale function of path density

Acoustic Remote Sensing: Examples• Convection Studies
– Greenland Sea 1988-1989– Mediterranean Sea 1991-1992, THETIS I
• Transport Studies– Gibraltar 1996
• Basin Scale Studies – heat content– Mediterranean Sea 1994, THETIS II– North Pacific 1996-1999, 2002-?, ATOC– Arctic Ocean, 1994, 1998-1999, ACOUS
Dushaw, et al.,”Observing the Ocean in the 2000’s: A Strategy for theRole of Acoustic Tomography in Ocean Climate Observation” inObserving the Oceans in the 21st Century, GODAE Project Office

Transport Monitoring in the Straits of Gibraltar
Send, et al., Deep Sea Res., 2002
Acoustic measurements blackCurve, current meters red

Monitoring Temperature in the Western Mediterranean
Send, et al., Nature,1997
Acoustic measurement ofaverage temperature 0-2000m~30 m°C uncertainty

Arctic Climate Observations using Underwater Sound (ACOUS)
• US/Russia bilateral program started in 1992• Use acoustic thermometry to measure Arctic
Ocean temperature and heat content• Feasibility exp. in 1994 showed strong coupling
between travel times and AIW temp., observed basin scale AIW warming (~.4 °C avg. max)
• Source installed in Oct. 1998 with transmissions every 4 days to receive array in Lincoln Sea (array recovered in Spring 2001)
• Reception of source signals at APLIS ice camp in April 1999 showed continued warming in AIW consistent with SCICEX CTD’s (~.5°C avg. max)

MAJOR ARCTIC OCEAN WATER MASSES ARE WELL SAMPLED BYACOUSTIC MODES/RAYS
Acoustic Remote Sensing in the Arctic
Mikhalevsky, “Arctic Acoustics”, in Encyclopedia of Ocean Sciences, 2001


MODAL ARRIVALPATTERN 1962BEAUFORT SEA
MODAL ARRIVALPATTERN 1994TRANS-ARCTICPROPAGATIONEXPERIMENT
Mode 2 arrival ~ 2 secs earlier than modelbased on climatology
20 Hz
STABLE ACOUSTIC PROPAGATION in the ARCTIC OCEAN

ACOUS SOURCE – Franz Victoria StraitACOUS RECEIVE ARRAY - Lincoln Sea
106, 20 min transmissions every four days Oct. 10, 1998 to Dec. 8, 1999
ACOUS - LINCOLN SEA EXPERIMENT

ACOUS SOURCE Deployed OCT. 1998
ACOUS VLA Deployed OCT. 1998 Recovered MAR. 2001
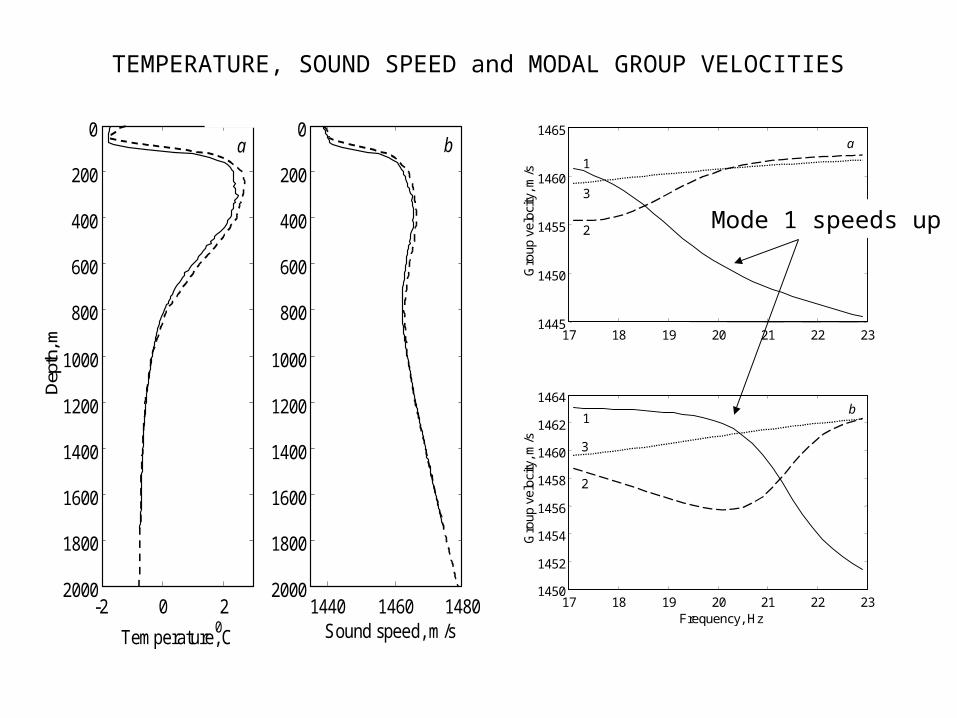
-2 0 2
0
200
400
600
800
1000
1200
1400
1600
1800
2000
Temperature,0C
Dep
th, m
1440 1460 1480
0
200
400
600
800
1000
1200
1400
1600
1800
2000
Sound speed, m/s
a b
17 18 19 20 21 22 231445
1450
1455
1460
1465
Gro
up v
eloc
ity, m
/s
17 18 19 20 21 22 231450
1452
1454
1456
1458
1460
1462
1464
Frequency, Hz
Gro
up v
eloc
ity, m
/s
b
2
3
1
2
3
a
1
TEMPERATURE, SOUND SPEED and MODAL GROUP VELOCITIES
Mode 1 speeds up

0 100 200 300 400 5006
6.5
7
7.5
8
8.5
9
Time, day
Tim
e, s
10/10/1998 12/8/1999
+ 0.3°C OVER300 KM OF THE PATH
DIFFERENCE IN ARRIVAL TIME OF MODE 1 and MODE 2
SCICEX 99

Temperature sectionusing profiles fromearly 1990’s perturbedto fit “cooler” part ofacoustic record
Temperature sectionusing profiles fromlate 1990’s perturbedto fit late 1999 “warm”part of acoustic record
Modeled sections consistent with acoustic data

ACOUS-LINCOLN SEA

N ansen-G akkelR idge
Lom onosovR idge
M endeleyevR idge
D istance (km )
M ik h a le v sk y a n d M o u sta fa - S A IC - 4 /0 1
CanadianBasin
0 200 400 600 800 1000 1200 1400 1600 1800 2000 2200 24004000
3000
2000
Dep
th (m
)
Northw indR idge
D eg C
(85.0 N , 46.0 E ) (72.39 N , -156.2 W )
2 5
2 5
0 500 1000 1500 2000
SC ICEX-2000
1000
800
600
400
200
0 500 1000 1500 2000
SC IC EX-99
1000
800
600
400
200
-2 .0-1 .8-1 .6-1 .4-1 .2-1 .0-0 .8-0 .6-0 .4-0 .20 .00 .20 .40 .60 .81 .01 .21 .41 .61 .82 .0
T em perature (C ) along S C ICEX T ransarctic T ransect

50 100 150 200 250 300 350 400
125
130
135
140
145
Time, day
Inte
gral
mod
een
ergy
,dB
re.u
Pa
a
N D J F M A M J J A S O N2.5
3
3.5
4
Met
ers
Month
b
Ice thickness
A seasonal component can be clearly seen in the acoustic data
Modeled seasonal cycle*
Received acoustic energyon Lincoln Sea array
Synoptic long term monitoring of sea ice
*D.A. Rothrock et.al., GRL,v.26(23), 1999
oFiltered long period component
o

deg.C
-1.8 -1.4 -1 -0.6 -0.2 0.2 0.6 1 1.4 1.8 2.2
0 500 1000 1500 2000
0
500
1000
Depth, m
Temperature profile:Scicex95
-1.6 -1.2 -0.8 -0.4 0 0.4 0.8 1.2 1.6 2 2.4
0 500 1000 1500 2000
0
500
1000
Depth, m
Scicex-98
-1.6 -1.2 -0.8 -0.4 0 0.4 0.8 1.2 1.6 2 2.4
0 500 1000 1500 2000
0
500
1000
Range, km (from 85.03N, 47.1E to 73.65N, 155.55W)
Depth, m
Scicex-99
0 500 1000 1500 2000 2500
0
1000
2000
3000
4000
Bathymetry along the pathLomonosov Ridge
Alpha Ridge
Chukchi Rise
TEMPERATURE SECTIONS FROM SCICEX 1995, 1998, AND 1999 ACROSSTHE ARCTIC BASIN WITH CORRESPONDING BATHYMETRY. WARMING INTHE ATLANTIC LAYER IS EVIDENT IN TOPOGRAPHICALLY GUIDED EXTENSIONSOF THE ATLANTIC WATER CIRCULATION.

SCICEX CTD SECTIONS
AVERAGE TEMPERATUREOVER RANGE and DEPTHBETWEEN 0°C ISOTHERMS:
1995 - .421°C
1998 - .478°C
1999 - .488°C

Section AverageTemp. vs Travel Timerms fit error ~ 9 m°C
1557.5 1558 1558.5 1559 1559.5 1560 1560.5 1561 1561.5 0.3
0.35
0.4
0.45
0.5
0.55
Time, s
Tem
pera
ture
, 0 C
1557.5 1558 1558.5 1559 1559.5 1560 1560.5 1561 1561.5 1.5
2
2.5
3
3.5 x 10 12
Time, s
Inte
gra
l heat co
nte
nt, k
J/m
1995
Climate
1998 1999
2000
2000
1999 1998
1995
Climate
a
b
Integral Heat Contentrms error ~ 7x10¹⁰ kJ/m
5 yr increase of ~1012 kJ/m over 2269 km path
is 2.8 W/m2 heat flux
Linear dependence ontravel time of mode 2 (*) and Mode 3 (o)

ACOUSTIC REMOTE SENSING Technical Requirements
• Temperature and Heat content– Good clock for absolute travel time
measurements, rubidium standard 1-8 ms/yr– Acoustic pulse travel time measurement
precision of .5 ms demonstrated in TAP 1994– Signal in Arctic from 1994-1999 for mode 2
(AIW temperature) was ~.4 secs/yr– Acoustic source and receiver technology
very mature– Power requirements for basin scale
observations ~250 watts acoustic power, ACOUS source ~50% efficiency, 20 min transmission ~.17 kWh

ACOUSTIC REMOTE SENSING CAPABILITIES in the ARCTIC
• UNDER RESEARCH– Combine transport and temp. measurements
for heat flux thru Fram Straits etc.– Average sea ice thickness and roughness
over several hundreds of kms– Average thermocline layer depth over
several hundreds of kms– Acoustic halinometry: changes in salinity and
thickness of cold halocline layer

Acoustic Remote Sensing: Advantages
• Permits rapid and repeated measurements over large ocean areas (3000 kt ship!) ie. basin scales for climate oriented studies
• Measures the average properties between the moorings, “extends” coverage of field, the data grows as the product of the number of source and receiver moorings
• Makes possible monitoring in regions where mooring installation/maintenance/recovery is difficult, eg. Arctic, Gulf Stream, Gibralter, Fram Strait, Bering Strait, etc.

VISION FOR EULERIANARCTIC MOORING GRIDBASIN & STRAITSExact number, layout andmooring design determined bymultidisciplinary requirements
Build in stages,Barrow Cabled Observatory,SEARCH, and build on experience from MARS and NEPTUNE International participationwith cable terminations inSvalbard, Greenland, andRussia (as well as US andCanada) will greatly reduceundersea cable costs withcost sharing for systeminstallation and operation
ARCTIC REGIONAL UNDERSEA OBSERVATORY for RESEARCH and ANALYSISAURORA

Acoustic monitoring: bowhead whales• Well documented that acoustic listening provides more
accurate count than visual methods– Possibility to identify and track particular individuals
• Current methods involve establishing ice camps and deploying hydrophones through the ice– Temporary, must be re-established, spring migration only– Subject to weather and ice conditions– Difficult to establish and maintain long baselines– Can drift out of optimal locations
• Cabled observatory with field of distributed hydrophones or several distributed hydrophone arrays– Permanent presence, spring and fall migration– Available during all weather conditions year-round– Optimal sensor locations can be established and maintained

1/31/0228
Phone Locations at the Pacific Missile Range Facility

1 / 3 1 / 0 2
3 5
A u t o m a t e d M o d e l - B a s e d L o c a l i z a t i o n
P a i r - w i s e s p e c t r a l p a t t e r n c o r r e l a t i o n o n t r a n s i e n t s m e a s u r e s t i m e l a g …
… C o m p a r i s o n o f m o d e l e d a n d m e a s u r e d t i m e l a g s d e t e r m i n e s s o u r c e l o c a t i o n .

1 / 3 1 / 0 2
3 7
M a m m a l B e h a v i o r S t u d i e s
• L o c a l i z a t i o n s o v e r m a n y h o u r s g i v e c l u e s t o a n i m a l b e h a v i o r
• T r a c k i n g o f p e r s i s t e n t s i n g e r sP o s s i b l e
• C a n p o t e n t i a l l y r e l a t e s u r f a c e ( v i s u a l ) c o u n t s t o v o l u m e t r i c c o u n t s f o r m o r e a c c u r a t e p o p u l a t i o n s t u d i e s

Courtesy of Bruce Howe, Craig Lee and Jason Gobat, APL/UW

RECOMMENDATIONS• Integrated acoustic systems and sensors needed
for observatory planning and design (http://www.oce.uri.edu/ao/IASOO)– Manage frequency spectrum, passive and active– Exploit same signals and sources/receivers for
tomography, data telemetry and control, and navigation• Control noise environment (sources, pumps,
AUV’s, etc.)– Impact on marine habitat and acoustic systems
performance • Undertake detailed cost study for cable-based
mooring undersea Arctic Ocean observing system and develop integrated plan leveraging existing and proposed programs like SEARCH, Neptune and the NSF Ocean Observatories Initiative

BACKUP

Consensus StatementOCEANOBS 1999 Conference*
“In terms of the scientific approach to sampling the full depth of the ocean, globally, acoustic tomography… provides long-path, integral (low wavenumber) measurements of thermal variations to complement those from Argo and satellite altimetry.”
“The Conference concluded that acoustic tomography did represent a potentially valuable approach and that, initially, it should be implemented in the Arctic…”
*Koblinsky and Smith eds.,”Observing the Oceans in the 21st Century”

856 858 860 862 864 866 8680
0.05
0.1
0.15
0.2
0.25
0.3
Travel time, s
Am
plit
ude
Modeled arrival pattern of modes 1-5
856 858 860 862 864 866 8680
0.05
0.1
0.15
0.2
0.25
0.3
Travel time, s
Am
plit
ude
Filtered modes of ACOUS signal N079
Mode 1
Mode 2
Mode 3
Mode 4
Mode 5

0 500 1000 1500 2000 2500 0.2
0.4
0.6
0.8
1
1.2
Tem
pera
ture
,
0 C
0 500 1000 1500 2000 2500 0
1
2
3
x 10 6
Heat
conte
nt,
kJ/m
2
0 500 1000 1500 2000 2500 1445
1450
1455
1460
Gro
up v
elo
city o
f m
ode 2
, m
/s
a
b
c
0 500 1000 1500 2000 2500
0
2
4Depth
, km
Range, km (from 85 N, 46 E to 73.56 N, 156.45 W)
d1
Na
ns
en
Bas
in
Fra
m B
as
in
Ma
ka
ro
v B
as
in
4
Ca
na
da
Bas
in
2 3
Temperaturevertical average vs range
Heat Contentvertical average vs range
Mode 2 Group Velocity
EWG Climatology andSCICEX 95, 98, 99, 00

Acoustic Remote Sensing Implementation
• Addition of acoustic hydrophones to moorings during the design phase costs ~$6K/phone for cabled moorings, and ~$26K/phone for autonomous moorings (on board data storage and rubidium clock required for latter), 4-8 phones per mooring required
• Acoustic sources cost $300-500K depending on whether cabled or autonomous


-2000 -1500 -1000 -500 0 500
K m
-2000 -1500 -1000 -500 0 500
SC ICEX-1999/2000 Transarctic Transect CTD Sam ple Locations
-1000
-500
0
500
Km
-1000
-500
0
500
SAIC - 4 /01
N orthP ole
1999
2000