activation-dependent rapid postsynaptic … activation-dependent rapid postsynaptic clustering of...
TRANSCRIPT

Development
Activation-Dependent Rapid Postsynaptic Clusteringof Glycine Receptors in Mature Spinal Cord Neurons
Yoshihisa Nakahata,1,2 Kei Eto,1,2 Hideji Murakoshi,2,3,4 Miho Watanabe,5 Toshihiko Kuriu,6 HiromiHirata4,7,8,9, Andrew J. Moorhouse,10 Hitoshi Ishibashi,1,2,11 and Junichi Nabekura1,2,12
DOI:http://dx.doi.org/10.1523/ENEURO.0194-16.2017
1Division of Homeostatic Development, Department of Developmental Physiology, National Institute for PhysiologicalSciences, Okazaki 444-8585, Japan, 2Department of Physiological Sciences, The Graduate University for AdvancedStudies (SOKENDAI), Okazaki 444-8585, Japan, 3Supportive Center for Brain Research, National Institute forPhysiological Science, Okazaki 444-8585, Japan, 4PRESTO, Japan Science and Technology Agency (JST),Kawaguchi 332-0012, Japan, 5Department of Neurophysiology, Hamamatsu University School of Medicine,Hamamatsu 431-3192, Japan, 6Department of Neurophysiology, Kagawa School of Pharmaceutical Sciences,Tokushima Bunri University, Tokushima 769-2193, Japan, 7Division of Molecular and Developmental Biology, NationalInstitute of Genetics, Mishima 411-8540, Japan, 8Department of Genetics, The Graduate University for AdvancedStudies (SOKENDAI), Mishima 411-8540, Japan, 9Department of Chemistry and Biological Science, Graduate Schoolof Science and Engineering, Aoyama Gakuin University, Sagamihara 252-5258, Japan, 10Department of Physiology,School of Medical Sciences, University of New South Wales, Sydney 2052, Australia, 11Department of Physiology,Kitasato University School of Allied Health Sciences, Sagamihara 252-0373, Japan, and 12CREST, Japan Science andTechnology Agency (JST), Kawaguchi 332-0012, Japan
AbstractInhibitory synapses are established during development but continue to be generated and modulated in strength in themature nervous system. In the spinal cord and brainstem, presynaptically released inhibitory neurotransmitterdominantly switches from GABA to glycine during normal development in vivo. While presynaptic mechanisms of theshift of inhibitory neurotransmission are well investigated, the contribution of postsynaptic neurotransmitter receptorsto this shift is not fully elucidated. Synaptic clustering of glycine receptors (GlyRs) is regulated by activation-dependentdepolarization in early development. However, GlyR activation induces hyperpolarization after the first postnatal week,and little is known whether and how presynaptically released glycine regulates postsynaptic receptors in adepolarization-independent manner in mature developmental stage. Here we developed spinal cord neuronal cultureof rodents using chronic strychnine application to investigate whether initial activation of GlyRs in mature stage couldchange postsynaptic localization of GlyRs. Immunocytochemical analyses demonstrate that chronic blockade of GlyRactivation until mature developmental stage resulted in smaller clusters of postsynaptic GlyRs that could be enlargedupon receptor activation for 1 h in the mature stage. Furthermore, live cell-imaging techniques show that GlyR
Significance Statement
Clustering of postsynaptic glycine receptors (GlyRs) is critical for the developmental shift from GABAergic toglycinergic inhibitory neurotransmission in the spinal cord and brainstem. Synaptic GlyR localization is mediatedby the receptor activation and followed by depolarization-dependent Ca2� influx in the immature stage.However, little is known whether and how presynaptically released glycine enhances postsynaptic GlyRclustering in the mature stage when glycinergic transmission is upregulated without depolarization. Here wereport postsynaptic GlyR clustering induced by the receptor activation in mature neurons. Furthermore,postsynaptic stabilization of laterally diffusive GlyRs is mediated in Ca2�-independent PKC activity at sitesexpressing gephyrin, a postsynaptic scaffolding protein. Our results provide new insights into homeostaticreceptor dynamics underlying activation-dependent modulation of inhibitory synaptic strength in the maturenervous system.
New Research
January/February 2017, 4(1) e0194-16.2017 1–20

activation decreases its lateral diffusion at synapses, and this phenomenon is dependent on PKC, but neither Ca2� norCaMKII activity. These results suggest that the GlyR activation can regulate receptor diffusion and cluster size atinhibitory synapses in mature stage, providing not only new insights into the postsynaptic mechanism of shiftinginhibitory neurotransmission but also the inhibitory synaptic plasticity in mature nervous system.
Key words: gephyrin; glycine receptor (GlyR); inhibitory synaptic plasticity; mature neuron; spinal cord; synap-tic clustering
IntroductionGABA and glycine mediate fast inhibitory neurotrans-
mission in the mature nervous system by activating post-synaptic GABAA and glycine receptors, respectively, toreduce neuronal excitability via postsynaptic hyperpolar-ization and membrane shunting. The inhibitory neu-rotransmissions in the adult brainstem and spinal cord arepredominantly mediated by glycine and play essentialroles for the auditory system and the ascending nocice-ptive pathways (Sanes et al., 1998; Lynch and Callister,2006). Interestingly, the predominant neurotransmissionduring the early developmental stage is GABAergic anddevelopmentally shifts to glycinergic in these synapses(Kotak et al., 1998; Gao et al., 2001; Russier et al., 2002).This unique developmental feature is primarily regulatedby switching the proportions of GABA and glycine inpresynaptic vesicles (Nabekura et al., 2004). In the pre-synaptic terminals, vesicular inhibitory amino acid trans-porter [VIAAT (or VGAT)] uptakes both GABA and glycinewith different binding affinity (McIntire et al., 1997); thus,the relative proportions of presynaptic glycine and GABAconcentrations determine the contents of released inhib-itory neurotransmitters (Ishibashi et al., 2013). Therefore,with developmental reductions of glutamic acid decarboxy-lases, GABA-synthesizing enzymes regulate the switching ofpresynaptically released inhibitory neurotransmitters (Maet al., 1994; Nabekura et al., 2004).
Although the presynaptic mechanism underlying thedevelopmental shift of inhibitory neurotransmission hasbeen well investigated, it is still has not been elucidatedwhether and how postsynapses contribute to the shift ofinhibitory neurotransmission. The postsynaptic localiza-tion of appropriate neurotransmitter receptors is primarilyessential for the effective neurotransmission, and twoscenarios in postsynaptic receptor localization are postu-lated for the developmental shift of neurotransmission.One scenario is that both GABAA receptors and glycinereceptors (GlyRs) are preexisting and stable; therefore,the developmental shift of neurotransmission is purelyattributable to the proportions of presynaptically releasedGABA/glycine. The other scenario is that postsynapticreceptor localization is actively modulated in correspon-dence with developmental switching of released neu-rotransmitters. The number of receptors clusteringpostsynaptically is determined first by trafficking of thereceptors between the cytoplasm and the plasma mem-brane at extrasynaptic sites (exocytosis and endocytosis),and, second, by the lateral diffusion of receptors in theplasma membrane and their stabilization at synaptic sites(Jacob et al., 2008). Extensive studies on excitatory syn-apses indicate that neurotransmission-dependent stabili-zation of laterally diffusing postsynaptic receptors may bea principal determinant of excitatory synaptic potentiation(Huganir and Nicoll, 2013). Similarly, the inactivation ofpostsynaptic GlyRs suppressed formation of the receptorclusters during early development in spinal cord neurons(Kirsch and Betz, 1998; Lévi et al., 1998), indicating thatthe neurotransmitter itself promotes receptor clustering.Thus, the neurotransmission-dependent clustering ofGlyRs was explained by the GlyR-mediated depolariza-tion and subsequent Ca2� influx and CaMKII activationthat occur when GlyRs are activated in early development(Kirsch and Betz, 1998; Yamanaka et al., 2013).
GABAA receptor- or GlyR-mediated neurotransmis-sions developmentally shift from depolarizing to hyperpo-larizing responses (D–H shift) after the first postnatal weekwith decreasing intracellular Cl� concentration (Kakazuet al., 1999; Ben-Ari, 2002). However, the expression ofGlyR�1, the mature-type subunit constructs the hetero-meric GlyR, which localizes at postsynapses, and in-creases in parallel with the upregulated presynapticglycine releases, and this persists after the D–H shift up toat least the third postnatal week (Friauf et al., 1997; Ko-rada and Schwartz, 1999). Therefore, the activation-induced depolarization model in early development maybe insufficient to explain the postsynaptic clustering ofGlyRs in the mature stage, and we hypothesize that thepostsynaptic localization of GlyRs are regulated bypresynaptically released glycine in a depolarization-
Received July 6, 2016; accepted January 17, 2017; First published January 25,2017.The authors declare no competing financial interests.Author contributions: Y.N., H.M., H.I., and J.N. designed research; Y.N., M.W.,
T.K., and H.H. performed research; H.M contributed unpublished analytic tools;Y.N., and M.W. analyzed data; Y.N., K.E, A.J.M., and J.N. wrote the paper.
This work was supported by Grants-in-Aid for Scientific Research (KAK-ENHI) from the Japan Society for the Promotion of Science to Y.N. (11J02839,14J30003, and 26870826) and to J.N. (25253017).
Acknowledgments: We thank Dr. H. Bannai (Nagoya University, Nagoya,Japan), Dr. T. Inoue (Waseda University, Tokyo, Japan), Dr. A. Triller (EcoleNormale Supérieure, Paris, France), and Dr. K. Mikoshiba (RIKEN Brain Sci-ence Institute, Wakō City, Japan) for providing technical skills and software forsingle-particle tracking. We also thank Dr. Y. Fukata and Dr. M. Fukata(National Institute for Physiological Sciences, Okazaki, Japan) for expert tech-nical assistance; Dr. Y. Fukazawa (University of Fukui, Fukui, Japan); and Dr.G. Miesenböck (University of Oxford, Oxford, UK) for providing the SEPconstruct. In addition, we thank the Spectrography and Bioimaging Facility,National Institute for Basic Biology Core Research Facilities (Okazaki, Japan)for confocal microscopy facilities.
Correspondence should be addressed to Junichi Nabekura, Division ofHomeostatic Development, Department of Developmental Physiology, Na-tional Institute for Physiological Sciences, 38 Nishigonaka, Myodaiji, Okazaki444-8585, Japan. E-mail: [email protected].
DOI:http://dx.doi.org/10.1523/ENEURO.0194-16.2017Copyright © 2017 Nakahata et al.This is an open-access article distributed under the terms of the CreativeCommons Attribution 4.0 International, which permits unrestricted use, distri-bution and reproduction in any medium provided that the original work isproperly attributed.
New Research 2 of 20
January/February 2017, 4(1) e0194-16.2017 eNeuro.org
independent manner in mature stage. To address thisquestion, we generated a spinal neuron culture model todistinguish and mimic the initial activation events of GlyRsafter the D–H shift. In this model, we chronically preventedactivation of GlyRs by strychnine, a competitive GlyRantagonist treatment, during the developmental period.Then GlyRs are activated after the D–H shift by strychnineremoval. Thus, this model enables us to analyze the ef-fects of GlyR activation on the spatiotemporal dynamicsof postsynaptic GlyRs in mature neurons. In contrast tothe current depolarization-dependent model of GlyR clus-tering, we found that the activation of GlyRs in moremature neurons could still elicit changes in diffusion andincreases in the postsynaptic GlyR clusters.
Materials and MethodsAll procedures performed in this study were approved
by the Okazaki Institutional Animal Care and Use Com-mittee and were conducted in accordance with guidelinesdefined by the National Institute of Natural Sciences. Allefforts were made to minimize the suffering and numberof animals used in this study.
Primary spinal cord cultureDissociated primary cultures of spinal cord neurons
were prepared as described previously (Ishibashi et al.,2013). Wild-type C57BL/6 mice (Japan SLC) were usedfor electrophysiology and experiments with DNA transfec-tion, VGAT-Venus transgenic C57BL/6 mice (Wang et al.,2009) were used for quantum dot (QD) single-particletracking (SPT) and wild-type Wistar rats (Japan SLC) wereused for immunocytochemistry and immunoblotting.Briefly, embryos [embryonic day 13 (E13) to E15] of bothsexes were isolated from pregnant animals under isoflu-rane anesthesia and were immediately placed into ice-cold Leibovitz’s L-15 medium (Life Technologies). Spinalcords were quickly removed and incubated in HEPES-buffered DMEM containing papain (24 �l/ml; Worthington)for 20 min at 32ºC. Individual cells were dissociated byrepeated gentle pipette trituration in Neurobasal mediumcontaining DNase and L-glutamate. Neurons were col-lected by centrifugation at 8000 rpm for 1 min, and thesupernatant was exchanged with fresh Neurobasal me-dium containing B27 supplement (50�), Glutamax (LifeTechnologies), penicillin 100 U/ml, and streptomycin 100�g/ml. Cells were plated on polyethylenimine-coated cov-erslips, either 18 mm diameter or 8 � 8 mm (Matsunami)at a density of 1.0–1.6 � 104 cells/cm2, and were incu-bated at 37°C and 5% CO2 for 14–42 d before theexperiments.
Three experimental groups were typically used (see Fig.2A). The first group [chronic strychnine (cSTR)] waschronically treated with strychnine (1 �M) to block GlyRactivation from the first day of culture through to whenexperiments were performed after at least 2 weeks inculture, when neurons and their intracellular Cl� concen-trations were equivalent to mature neurons. The secondgroup was similarly treated with chronic administration ofstrychnine, but strychnine was then washed out 1 h priorto each experiment (WASH group). Hence, neurons in thisgroup had GlyRs activated by endogenous synaptic ac-
tivity for 1 h. The third group [control (Ctrl)] was treatedwith vehicle (Neurobasal culture medium, the solvent ofstrychnine) from the first day of culture plating, resulting innormal activation of GlyRs throughout development fromendogenous synaptic activity.
DNA Constructs and transfectionThe coding sequence of superecliptic pHluorin (SEP; a
gift from Dr. G. Miesenböck, University of Oxford, Oxford,UK) was fused at the extracellular domain of the mouseGlyR�1 subunit, just following the signal peptide sequence(pCAG-SEP-GlyR�1). The mCherry–gephyrin (GPHN) con-struct was constructed from the rat gephyrin-P1 splice vari-ant 1, which was labeled at its N terminus with mCherry(Kuriu et al., 2012). Cells were transfected 13–15 d in vitro(DIV) and imaged within 48 h after transfections. Transfec-tions were performed by incubating cell in Lipofectamine2000 (Life Technologies) in Neurobasal medium lackingpenicillin-streptomycin for 6–8 h.
ReagentsDrugs used in the present study were 5 �M DL-2-amino-7-
phosphonovalerate (DL-APV), 5 �M 6-cyano-7-nitroquinoxaline-2,3-dione (CNQX), 1 �M 6-imino-3-(4-methoxyphenyl)-1(6H)-pyridazinebutanoic acid (SR95531), 1 �M strychnine, 20–40�g/ml gramicidin D, 100 �M or 1M glycine, 5 �g/ml brefeldin A(BFA), 1 �M ginkgolide B, 0.5 �M mecamylamine hydrochloride,10 �M BAPTA-AM, 30 �M KN-62, 10 �M Rp-adenosine 3, and1 �M ginkgolide monophosphorothioate triethylammonium salt(all from Sigma-Aldrich Japan); 50 nM GF 109203X (GFX; EnzoLife Sciences); and 0.3 �M tetrodotoxin (TTX; Latoxan). Drug-containing solutions were locally applied via a Y-tube perfusionsystem (Murase et al., 1989) in electrophysiological recordingsand via bath application in imaging experiments.
SolutionsThe standard extracellular solution for imaging and
electrophysiological experiments contained the following(in mM): 148 NaCl, 5 KCl, 1 MgCl2, 2 CaCl2, 10 glucose,and 10 HEPES, and adjusted to pH 7.4 with Tris-OH. In allexperiments, the standard extracellular solution con-tained the (in �M) 5 CNQX, 5 DL-APV, 1 SR95531, and 0.3TTX, concentrations that were sufficient to fully inhibitspontaneous excitatory and GABAergic postsynaptic cur-rents, and action potentials. Additionally, 1 �M strychninewas constantly present in the cSTR group and was pres-ent in the WASH group until 1 h before experiments. QDbinding buffer contained the following (in mM): 2.62 so-dium tetraborate decahydrate, 39.5 boric acid, and 2%(w/v) bovine serum albumin and adjusted to pH 7.4 with 1M HCl or 1 M NaOH. In electrophysiological experiments,the internal pipette solution for the perforated patch-clamp configuration contained the following (in mM): 90KCl, 60 K-methanesulfonate, and 10 HEPES. The pipettesolution for conventional whole-cell configuration con-tained the following (in mM): 100 K-methanesulfonate, 8NaCl, 30 KCl, 1 MgCl2, 2 EGTA, 4 Mg-ATP, 5 QX-314-Cl,and 10 HEPES. All pipette solutions were adjusted to pH7.3 with Tris-OH. In a perforated patch-clamp configura-tion, gramicidin D was initially dissolved in DMSO at 10mg/ml and then diluted to a final concentration of 20–40
New Research 3 of 20
January/February 2017, 4(1) e0194-16.2017 eNeuro.org

�g/ml in the pipette solution. The gramicidin was pre-pared just before use.
Electrophysiological measurementsCultured neurons were observed under phase contrast
on an inverted microscope (model IX70, Olympus). Ioniccurrents were measured with a Multiclamp 700B patch-clamp amplifier (Molecular Devices) and were recordedwith a sampling frequency of 20 kHz after low-pass filter-ing at 5 kHz. Currents were recorded, and voltage proto-cols were applied, using pClamp 10.2 software (MolecularDevices; RRID: SCR_011323). The resistance betweenthe patch pipette filled with the internal solution and thereference electrode in the standard external solution was6–8 M�. The neurons were voltage clamped at a holdingpotential of �53 mV in gramicidin-perforated patch ex-periments and �70 mV in the conventional whole-cellpatch-clamp configurations.
The reversal potentials of glycine-induced currents(Egly) were recorded using gramicidin-perorated patchconfigurations to maintain intracellular Cl� concentrationsintact (Ebihara et al., 1995). Voltage-ramps from –113 to�37 mV, with duration of 1.6 s, were applied to the neuronbefore and during glycine application. Voltage protocolswere generated by a software-driven digital-to-analogconverter (Digidata 1322A, Molecular Devices). Correc-tions for the liquid junction potentials (–3.4 mV) wereapplied to the data in gramicidin-perforated recordings.Current–voltage (I–V) relationships were measured bysubtracting current values during the control from thoseduring glycine application, and the Egly was quantified asthe reversal potential of this control subtracted current.
Spontaneous mIPSCs were recorded using a conven-tional whole-cell patch-clamp configuration. To measuremIPSCs, in the cSTR group the bath solution includingstrychnine was completely exchanged with the standardrecording solution lacking strychnine immediately beforerecording. In the control group, the bath solution wasexchanged to a recording solution that included 1 �M
strychnine for 30 s and then was exchanged again to thestandard solution lacking strychnine in order to excludethe effect of any residual strychnine between the controland chronic strychnine treatment groups. Recordingsstarted within 10 min after strychnine washout and lastedfor 60 min. mIPSCs were confirmed by application of 1 �M
strychnine after each recording. All experiments wereperformed at room temperature (21 � 24ºC). Recordingswere discontinued if the access resistance changed�30%.
Spontaneous mIPSCs were analyzed using the tem-plate search tool in Clampfit 10.2 (Molecular Devices). Thetemplate was created from 100 responses and automat-ically detected events. Amplitude threshold values wereset at threefold of SD values of the baseline noise ampli-tude. False-positive results were rejected by visual in-spection. Over 200 events were detected and statisticallyanalyzed at each time point � 2.5 min from each neuron.Decay time constants were calculated by fitting a double-exponential function to the mIPSC decay from the time
period corresponding to that between 90% and 10% ofthe peak mIPSC amplitude.
Immunostaining, image acquisition, and quantitativeanalysis
Cultured rat spinal cord neurons were fixed with para-formaldehyde (PFA; 4% w/v) in PBS and then permeabil-ized with Triton X-100 (0.1% v/v). Nonspecific antibody-binding sites were blocked with PBS containing normalgoat serum (2% v/v) and bovine serum albumin (1% w/v).Cells were double labeled using the following primaryantibodies: polyclonal rabbit anti-VIAAT (1:500; SynapticSystems; RRID: AB_887871), polyclonal guinea pig anti-VIAAT (1:1000; catalog #131-004, Synaptic Systems;RRID: AB_887873), monoclonal mouse anti-glycine re-ceptor �1 (mAb2b; 1:200; Synaptic Systems 146-111;RRID: AB_887723), and polyclonal rabbit anti-gephyrin(1:1000; catalog #147-003, Synaptic Systems; RRID:AB_887718) overnight at 4°C, followed by incubation withfluorescence-conjugated secondary antibodies (AlexaFluor 488, RRID: AB_2534117 or AB_2534069, 1:1000;Alexa Fluor 594, RRID: AB_2534095, 1:1000; Alexa Fluor633, RRID: AB_2535731, 1:1000; Life Technologies) for 30min at room temperature. Coverslips were mounted inPermaFluor aqueous mounting medium (Thermo Shan-don). Fluorescence images were acquired with a confocallaser-scanning microscope [Plan Apo-VC 100� H, nu-merical aperture (NA) 1.4; model A1, Nikon]. Pixel size andfocus steps were 0.1 and 0.37 �m, respectively, withimages of 1024 � 1024 pixels.
The number and areas of puncta were measured usingMetaMorph 7.7 (Molecular Devices) as described previ-ously (Kuriu et al., 2012), with slight modifications. Maxi-mal intensity projection images were prepared for eachimage stack, and these projection images were filteredusing a 3 � 3 pixel low-pass filter to remove noise. Imageswere converted to binary images using an intensitythreshold to determine the outline of the punctate signals.After applying built-in erosion and dilation processing toremove single-pixel noises, the numbers and areas offluorescence signals were automatically counted from bi-nary images using the integrated morphometry analysisfunction. Colocalization of immunostained presynapticmarker proteins (VIAAT) and postsynaptic GlyRs was de-termined using Wright Cell Imaging Facility ImageJ soft-ware (RRID: SCR_008488) based on the overlapcoefficient of Manders et al. (1993) after automated back-ground subtraction to avoid user bias in setting analysisparameters. A colocalization coefficient value of 0 indi-cates nonoverlapping immunostained proteins, while acoefficient of 1 corresponds to 100% colocalization. Thecoefficient indicates the proportion of the GlyR or GPHNsignals coincident with the VIAAT signal intensity. Resultswere shown as the ratio of the summed intensities ofpixels from the GlyR or GPHN for which the intensity ofVIAAT was above zero.
Cell surface biotinylation and immunoblottingSurface biotinylation experiments were performed us-
ing a cell surface protein biotinylation and purification kit(ThermoFisher Scientific) according to the manufacturer
New Research 4 of 20
January/February 2017, 4(1) e0194-16.2017 eNeuro.org

protocol. Briefly, cultured spinal cord neurons from fourindividual cultures (19–33 DIV) were washed with ice-coldPBS and then labeled with 0.25 mg/ml sulfo-NHS-SS-biotin for 30 min at 4°C before washing with PBS supple-mented with quenching solution to remove excess biotin.The cell lysates were centrifuged (10,000 � g, for 2 min),the supernatant was isolated with NeutrAvidin gel, and thebound proteins were then eluted with SDS sample buffer(62.5 mM Tris-HCl, pH 6.8, 1% SDS, and 10% glycerol)and were analyzed by SDS-PAGE and Western blotting.
Proteins were separated using 7.5% acrylamide gels bySDS-PAGE. The gels were transferred to an Immobilon-Pmembrane (Millipore). The blots were blocked in 1% bo-vine serum albumin and incubated overnight with primaryantibody at 4°C. They were then incubated with horserad-ish peroxidase-conjugated secondary antibody (GEHealthcare UK) for 1 h at room temperature. Enhancedchemiluminescence (ECL; GE Healthcare) exposure oninstant film and an ECL mini-camera luminometer wereused to visualize labeled protein. The following primaryantibodies were used: anti-pan GlyRs (1:1000; mAb4a,Synaptic Systems; RRID: AB_887722) and anti-actin (1:10,000; Sigma-Aldrich- RRID: AB_476744). The opticaldensities of bands were analyzed with ImageJ software(RRID: SCR_003070). Since pan-GlyR antibody (mAb4a)detects isoforms of GlyR� subunits, we analyzed thedensity of assumptive bands indicating 48 kDa GlyR�1(Becker et al., 1992; Weltzien et al., 2012). The densities ofthe total GlyR band and the surface GlyR band werenormalized to the densities of actin band and total band,respectively.
Fluorescence recovery after photobleaching andfluorescence loss in photobleaching
For experiments applying fluorescence recovery afterphotobleaching (FRAP) and fluorescence loss in photo-bleaching (FLIP; Jaskolski et al., 2009; Hildick et al.,2012), mouse spinal cord neurons (13–15 DIV) were trans-fected with pCAG-SEP-GlyR�1 (and CMV-mCherry-gephyrin) constructs at 24–48 h prior to experiments.Imaging was performed at room temperature (24 � 2ºC) inthe standard recording solution, and images were ac-quired with a confocal laser-scanning microscope (PlanApo-VC 60� H, NA 1.4; model A1, Nikon). Fluorescenceof SEP was photobleached using a 488 nm laser at a fullpower of 40 mW for 62.5 ms, repeated seven times in a 3� 5 �m rectangular region of interest (ROI) in SEP-expressed neurites. For the focal FRAP protocol, photo-bleaching was applied to two 1-�m-diameter circularregions of interests with and without mCherry-expressingpuncta. Laser power at 1% was used for image acquisi-tions. In the FRAP-FLIP protocol, repetitive photobleach-ing at the FLIP regions (3 � 5 �m rectangles) was appliedthroughout the imaging period directly lateral to a largerinitial central bleaching region (10 � 5 �m). The fluores-cence intensity of the central ROI (3 � 5 �m) was mea-sured. Since the fluorescence intensity of SEP can beobserved in early endosomes, the baseline intensity be-fore photobleaching may contain this fluorescence inten-sity. Thus, we confirmed surface fractions of SEP
fluorescence by extracellular acidification (pH 5.5), whichquenches fluorescence after FRAP experiments. In addi-tion, fluorescence in early endosome fractions is photo-bleached in the ROI; thus, it may not affect fluorescencerecovery after photobleaching.
Images were acquired 93 times with 2.9 s intervals inwide FRAP and FRAP-FLIP experiments, and 93 timeswith 3 s in focal FRAP experiments. The intensity offluorescence recovery was measured after backgroundsubtraction and a correction based on the intensity of theunbleached regions, and was normalized to prebleachintensity. The average fluorescence intensities after pho-tobleaching were fitted by single exponential recoverycurves using KaleidaGraph 4.1 (HULINKS). The mobilefraction (MF) was calculated according to Equation 1:
MF � (Fmax � F(0))/ (Fpre � F(0)) (1)
where Fpre is the prebleach intensity, Fmax is the plateauintensity after photobleaching, and F(0) is the postbleachintensity at time zero.
For the experiment monitoring fluorescence intensityunder local application of glycine, the standard extracel-lular solution containing both 1 M glycine and Alexa Fluor594 hydrazide (ThermoFisher Scientific) is applied to sin-gle dendrites by glass pipettes (approximate tip diameter,1 �m) at 2 Hz using a valve-controlled pressure applicationsystem (IM300 Microinjector). The area of local glycine ap-plication was confirmed by monitoring the fluorescence ofAlexa Fluor 564 hydrazide. The fluorescence intensity ofSEP-GlyR�1 was measured at gephyrin-positive (GPHN�)and gephyrin-negative (GPHN�) dendritic shafts, whichwere covered by glycine application.
Quantum dot live cell staining, image acquisition,and quantitative analysis
After a single wash with Neurobasal medium, neuronswere incubated for 5 min with a primary antibody thatrecognizes an extracellular epitope of the GlyR�1 subunit(5 �g/ml; mAb2b, Synaptic Systems; RRID: AB_887723),then neurons were washed five times with Neurobasalmedium. They were subsequently incubated for 5 minwith the secondary antibody [5.2 �g/ml; biotin Fab goatanti-mouse IgG (H�L), Jackson ImmunoResearch; RRID:AB_2338586], then washed again five times. The neuronswere next incubated with streptavidin-conjugated quan-tum dots emitted at 605 nm (1 nM; Life Technologies) inQD binding buffer (Bannai et al., 2006) for 1 min beforewashing eight times with the standard extracellular solu-tion. Finally, neurons were incubated with FM4-64 (2 �M;Life Technologies) in 40 mM KCl standard solution for 30s to label active presynaptic sites (Gaffield and Betz,2006), before returning to the standard external solution.QD labeling, washing, and image acquisition procedureswere performed at 37ºC.
QD-labeled neurons were imaged in the standard re-cording solution using an inverted microscope (modelIX70, Olympus) equipped with an oil-immersion objective(100�, NA 1.4), and an EM-CCD camera (ImagEM C9100-13, Hamamatsu Photonics), mercury lamp, appropriatebandpass filter sets for QD 605 (excitation wavelength
New Research 5 of 20
January/February 2017, 4(1) e0194-16.2017 eNeuro.org
(ex.) 457/50 and emission wavelength (em.) 605/15),FM4-64 (ex. 510/84 and em.736/128), and Venus (ex.457/50 and em.530/55). Single images of FM4-64 weretaken before the QD imaging. QD image acquisition mov-ies were composed of 300 frames, with each frame beingof 67 ms duration and separated by 33 ms, giving a totalimaging time of 30 s with MetaMorph software version 7.7(Molecular Devices; RRID: SCR_002368). The movementsof QD-GlyR�1s were recorded within 45 min after label-ing. Strychnine (1 �M) was presented only in the cSTRgroup during staining and imaging.
For single-particle tracking, QD-GlyR particles onVenus-expressing neurons were selectively analyzed. Thetrajectory of each particle was determined by cross-correlating the image with a Gaussian model of the pointspread function (Bonneau et al., 2005), using TI work-bench software written by T. Inoue (Waseda University,Tokyo, Japan; Bannai et al., 2009). Only single QDs iden-tified by their characteristic blinking were analyzed, andparticles that fluoresced in �295 (of 300) frames wereexcluded. The synaptic regions were defined by process-ing FM4-64 images with top-hat filtering (Waataja et al.,2008). For each frame, QD-GlyR fluorescence thatmerged by at least 1 pixel with the binarized image of FM4-64 was defined as a synaptic location, and if the QDwas �2 pixels away from the FM 4-64 image, this wasdefined as extrasynaptic. For the calculation of diffusionparameters in the synaptic and extrasynaptic regions, thelongest subtrajectories (segments) of single QD-GlyRsthat consisted of at least 30 frames in each compartmentwere used to represent the behavior of each particle inthat compartment. Synaptic dwell times were quantifiedby counting the total number of consecutive frames inwhich a QD was localized to synaptic regions.
To obtain the diffusion coefficients, values of the meansquare displacement (MSD) plot versus time were calcu-lated for each trajectory using Equation 2 (Saxton andJacobson, 1997), as follows:
MSD(n�) �1
N � n �i�1
N�n
[(x((i � n)�) � x(i�))2
� (y((i � n)�) � y(i�))2], (2)
where � is the acquisition time, N is the total number offrames, and n and i are positive integers with n represent-ing the time increment. Diffusion coefficients (D) werecalculated by fitting the first three points of the MSDversus time curves with Equation 3 (Kusumi et al., 1993;Bannai et al., 2006), as follows:
MSD(n�) � 4Dn� � b , (3)
where b is a constant reflecting the spot localizationaccuracy.
The confinement sizes (L) were calculated by fitting theMSD-n� plot of the trajectories showing a restricted mo-tion to Equation 4 (Kusumi et al., 1993), as follows:
MSD(n�) �L2
3 �1 � exp��12Dn�
L2 �� � 4Dmacn� , (4)
where L2 is the confinement area where diffusion isrestricted, and Dmac is the diffusion coefficient on a longtime scale.
Statistical analysisData are presented as the median � interquartile range
for diffusion coefficients obtained from SPT. All other dataare expressed as the mean � SEM. Statistical signifi-cance was determined using Student’s unpaired two-tailed t test for comparing the reversal potential of glycine-induced currents, for comparing the decay time constantof mIPSCs and for comparing changes in SEP-GlyR�1fluorescence intensities at gephyrin-positive and gephyrin-negative areas by local glycine application; Student’spaired two-tailed t test for comparing fractions of fluores-cence recovery between mCherry-GPHN and SEP-GlyR�1; one-way ANOVA with Bonferroni’s post hoc testfor multiple comparisons for immunostaining experimentsand for dwell time and confinement size in SPT experi-ments; and Kruskal–Wallis test followed by post hoc com-parisons using Mann–Whitney U test with Bonferroni’scorrection for other statistical comparisons. Pearson’scorrelation coefficient was calculated using linear regres-sion fit on the fractions of fluorescence recovery betweenmCherry-GPHN and SEP-GlyR�1.
ResultsActivation-dependent increase in the amplitude ofpostsynaptic glycine responses
The present study used a culture model in which initialactivation of GlyRs could be pharmacologically delayeduntil after the developmental shift from depolarizing tohyperpolarizing responses (Fig. 1A). Washout of strych-nine, which had been applied from the first DIV until eachexperiment, allowed initial activation of GlyRs once neu-rons had matured. To validate this model, we first exam-ined whether the cSTR application (1 �M) affected thetypical maturation of intracellular Cl� concentrations. Wecultured primary spinal cord neurons over 14 DIV andmeasured the reversal potential of Egly using gramicidin-perforated patch-clamp recording (Fig. 1C). By subtract-ing the amplitude of currents that were induced by ramppulses between the presence and absence of 100 �M
glycine (Fig. 1C), the I–V curves were obtained (Fig. 1D).The reversal potentials in cSTR conditions (�70.6 � 1.9mV, n � 5) were comparable to those in the nonstrych-nine Ctrl conditions (�74.2 � 0.8 mV; n � 6; p � 0.25;Fig. 1D). These results indicate that chronic treatmentwith strychnine does not affect the development of theintracellular Cl� regulatory system, and that glycinergictransmission after a 2 week culture induces hyperpo-larization.
To examine whether the initial activation of postsynap-tic GlyRs in the mature stage subsequently modulatesglycinergic transmission, we chronically incubated cul-tures with 1 �M strychnine, from the first DIV until imme-diately before the experiment (�14 DIV; Fig. 1B).Spontaneous mIPSCs were measured by the conven-tional whole-cell patch-clamp recording in the presenceof TTX, CNQX, DL-APV, and SR95531 in the standard bath
New Research 6 of 20
January/February 2017, 4(1) e0194-16.2017 eNeuro.org
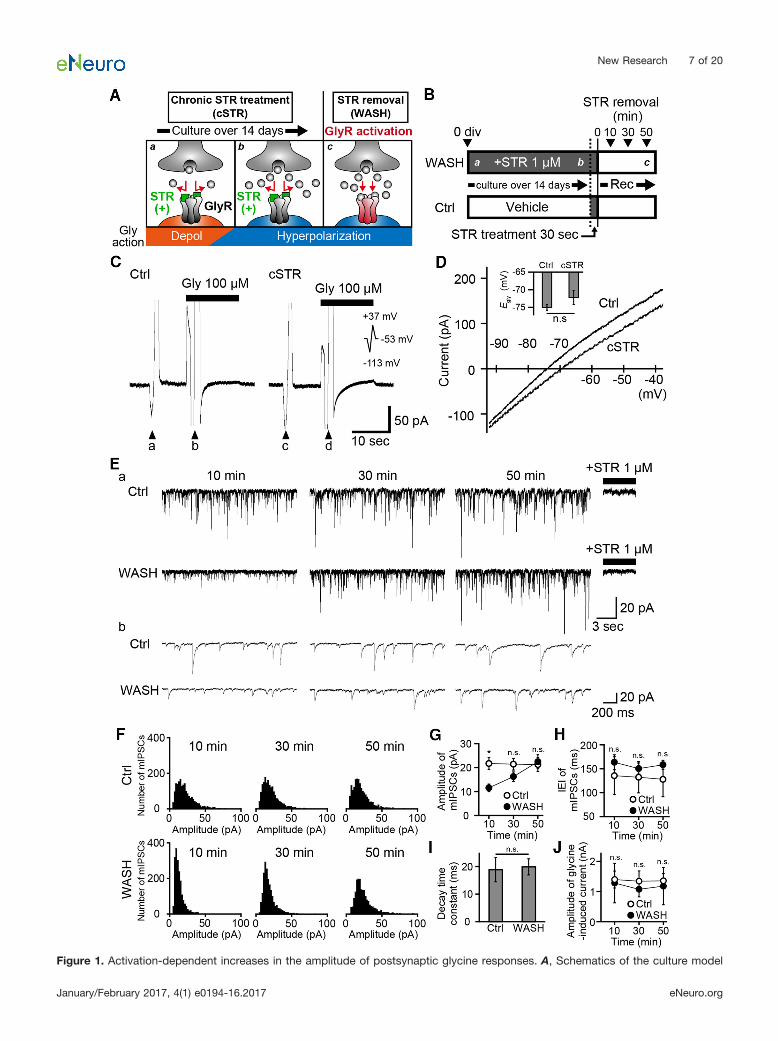
Figure 1. Activation-dependent increases in the amplitude of postsynaptic glycine responses. A, Schematics of the culture model
New Research 7 of 20
January/February 2017, 4(1) e0194-16.2017 eNeuro.org
solution to isolate GlyR responses. In the WASH group,neurons cultured in the chronic presence of strychnine,glycinergic mIPSCs were recorded �60 min after strych-nine removal. In the Ctrl group, cultured without strych-nine, neurons were transiently incubated with strychninefor 30 s to examine the effect of residual strychnine,before being transferred to the standard bath solution(Fig. 1B). The decay time constants of the mIPSCs at 10min in the WASH group (mean, 19.9 � 2.9 ms; n � 7 cells)were comparable to those in the Ctrl group (mean, 18.8 �4.4 ms; n � 8 cells; p � 0.92, Student’s unpaired two-tailed t test; Fig. 1I), suggesting that the developmentalshift of GlyR subunit compositions was unaffected bychronic strychnine treatment. In the WASH group, theamplitude of glycinergic mIPSCs gradually increased afterstrychnine removal (11.5 � 1.6, 16.2 � 2.0, and 22.4 �2.9 pA, respectively, at 10, 30, and 50 min after strychnineremoval; n � 7; Fig. 1E–G). In contrast, the amplitudes ofmIPSCs were stable in the Ctrl group across the samerecording period (21.7 � 2.4, 21.4 � 2.5, and 21.2 � 2.9pA, respectively, at 10, 30, and 50 min; n � 8; Fig. 1E–G).The amplitudes of mIPSCs in WASH groups was signifi-cantly lower than those in the Ctrl groups at 10 min (p �0.0037) but were time-dependently increased in the Ctrlgroup (p � 0.094 at 30 min; p � 0.779 at 50 min). Hence,glycinergic mIPSCs gradually increase in amplitude fol-lowing relief from chronic strychnine block, and this is notdue to the slow washout of residual strychnine. The inter-event intervals (IEIs) of mIPSCs were constant in both theCtrl conditions (136 � 16, 132 � 11, and 128 � 10 ms,respectively, at 10, 30, and 50 min; n � 8) and the WASHconditions (164 � 39, 150 � 33, and 158 � 36 ms,respectively, at 10, 30, and 50 min; n � 7). This result mayindicate that chronic strychnine treatment has little effecton presynaptic glycine release (Fig. 1E,H). However, adetailed analysis of synaptic numbers is required since
the balance between presynaptic release probability andthe number of synapses affects the IEI.
To distinguish whether the gradual increases in theamplitudes of mIPSCs in the WASH group is due to theincrease in the number of GlyRs on the whole cell surfaceor specifically at synapses, 100 �M glycine was locallyapplied using Y-tube at different time points after strych-nine removal. However, the amplitudes of glycine-evokedcurrents were similar at different time points between theCtrl group (1.4 � 0.3, 1.3 � 0.3, and 1.4 � 0.2 nA,respectively, at 10, 30, and 50 min after strychnine re-moval; n � 7) and the WASH group (1.3 � 0.7, 1.1 � 0.3,and 1.2 � 0.6 nA, respectively, at 10, 30, and 50 min afterstrychnine removal; n � 8) groups, and no differenceswere detected between these groups (p � 0.23, 0.23, and0.19, respectively, at 10, 30, and 50 min; Fig. 1J), indicat-ing that cell surface expressions of GlyRs did not changeduring the recording period.
Chronic blockade of glycine receptors decreasesGlyR cluster size at inhibitory synapses
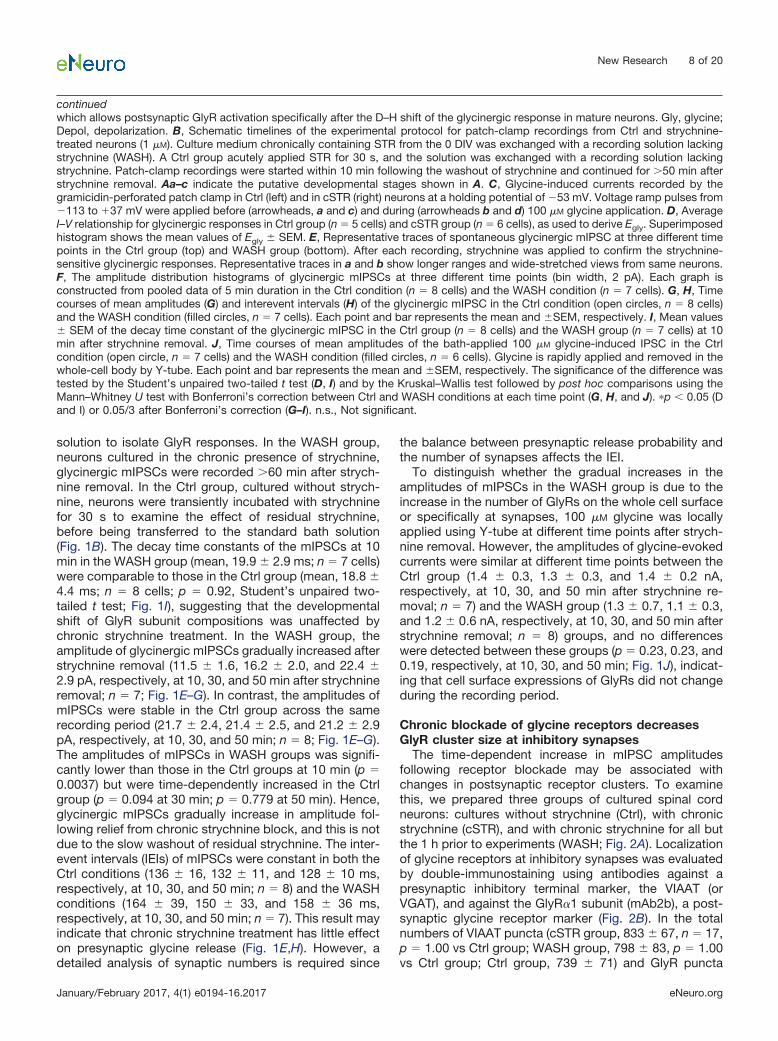
The time-dependent increase in mIPSC amplitudesfollowing receptor blockade may be associated withchanges in postsynaptic receptor clusters. To examinethis, we prepared three groups of cultured spinal cordneurons: cultures without strychnine (Ctrl), with chronicstrychnine (cSTR), and with chronic strychnine for all butthe 1 h prior to experiments (WASH; Fig. 2A). Localizationof glycine receptors at inhibitory synapses was evaluatedby double-immunostaining using antibodies against apresynaptic inhibitory terminal marker, the VIAAT (orVGAT), and against the GlyR�1 subunit (mAb2b), a post-synaptic glycine receptor marker (Fig. 2B). In the totalnumbers of VIAAT puncta (cSTR group, 833 � 67, n � 17,p � 1.00 vs Ctrl group; WASH group, 798 � 83, p � 1.00vs Ctrl group; Ctrl group, 739 � 71) and GlyR puncta
continuedwhich allows postsynaptic GlyR activation specifically after the D–H shift of the glycinergic response in mature neurons. Gly, glycine;Depol, depolarization. B, Schematic timelines of the experimental protocol for patch-clamp recordings from Ctrl and strychnine-treated neurons (1 �M). Culture medium chronically containing STR from the 0 DIV was exchanged with a recording solution lackingstrychnine (WASH). A Ctrl group acutely applied STR for 30 s, and the solution was exchanged with a recording solution lackingstrychnine. Patch-clamp recordings were started within 10 min following the washout of strychnine and continued for �50 min afterstrychnine removal. Aa–c indicate the putative developmental stages shown in A. C, Glycine-induced currents recorded by thegramicidin-perforated patch clamp in Ctrl (left) and in cSTR (right) neurons at a holding potential of �53 mV. Voltage ramp pulses from�113 to �37 mV were applied before (arrowheads, a and c) and during (arrowheads b and d) 100 �M glycine application. D, AverageI–V relationship for glycinergic responses in Ctrl group (n � 5 cells) and cSTR group (n � 6 cells), as used to derive Egly. Superimposedhistogram shows the mean values of Egly � SEM. E, Representative traces of spontaneous glycinergic mIPSC at three different timepoints in the Ctrl group (top) and WASH group (bottom). After each recording, strychnine was applied to confirm the strychnine-sensitive glycinergic responses. Representative traces in a and b show longer ranges and wide-stretched views from same neurons.F, The amplitude distribution histograms of glycinergic mIPSCs at three different time points (bin width, 2 pA). Each graph isconstructed from pooled data of 5 min duration in the Ctrl condition (n � 8 cells) and the WASH condition (n � 7 cells). G, H, Timecourses of mean amplitudes (G) and interevent intervals (H) of the glycinergic mIPSC in the Ctrl condition (open circles, n � 8 cells)and the WASH condition (filled circles, n � 7 cells). Each point and bar represents the mean and �SEM, respectively. I, Mean values� SEM of the decay time constant of the glycinergic mIPSC in the Ctrl group (n � 8 cells) and the WASH group (n � 7 cells) at 10min after strychnine removal. J, Time courses of mean amplitudes of the bath-applied 100 �M glycine-induced IPSC in the Ctrlcondition (open circle, n � 7 cells) and the WASH condition (filled circles, n � 6 cells). Glycine is rapidly applied and removed in thewhole-cell body by Y-tube. Each point and bar represents the mean and �SEM, respectively. The significance of the difference wastested by the Student’s unpaired two-tailed t test (D, I) and by the Kruskal–Wallis test followed by post hoc comparisons using theMann–Whitney U test with Bonferroni’s correction between Ctrl and WASH conditions at each time point (G, H, and J). �p 0.05 (Dand I) or 0.05/3 after Bonferroni’s correction (G–I). n.s., Not significant.
New Research 8 of 20
January/February 2017, 4(1) e0194-16.2017 eNeuro.org
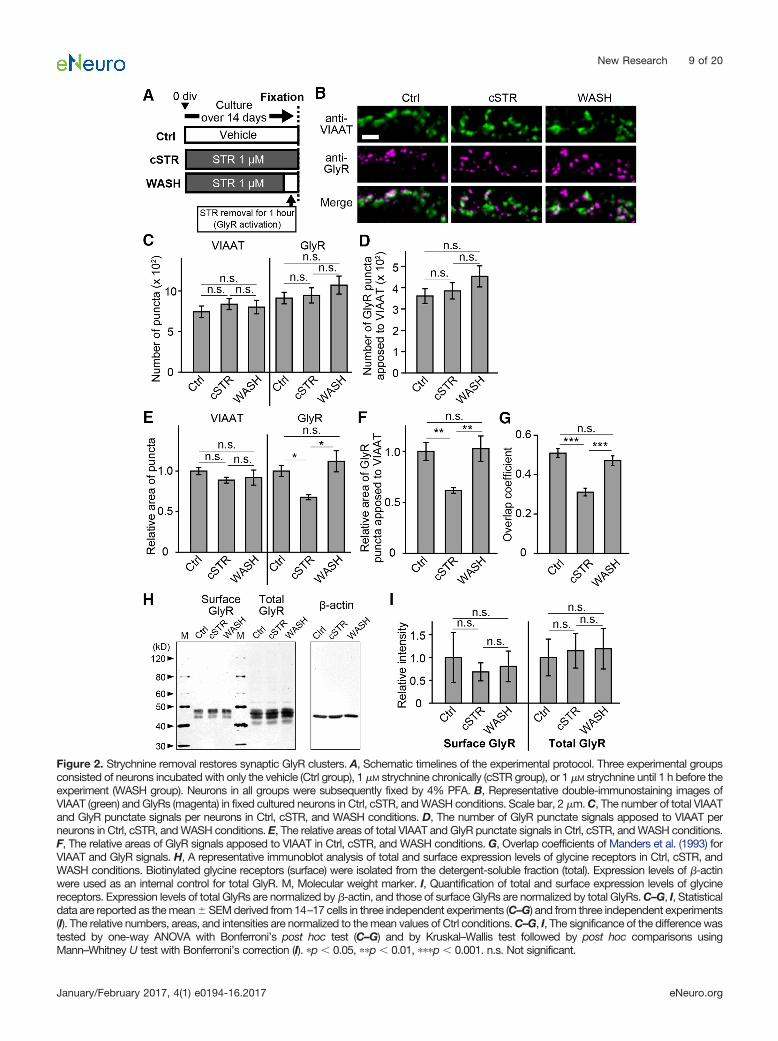
Figure 2. Strychnine removal restores synaptic GlyR clusters. A, Schematic timelines of the experimental protocol. Three experimental groupsconsisted of neurons incubated with only the vehicle (Ctrl group), 1 �M strychnine chronically (cSTR group), or 1 �M strychnine until 1 h before theexperiment (WASH group). Neurons in all groups were subsequently fixed by 4% PFA. B, Representative double-immunostaining images ofVIAAT (green) and GlyRs (magenta) in fixed cultured neurons in Ctrl, cSTR, and WASH conditions. Scale bar, 2 �m. C, The number of total VIAATand GlyR punctate signals per neurons in Ctrl, cSTR, and WASH conditions. D, The number of GlyR punctate signals apposed to VIAAT perneurons in Ctrl, cSTR, and WASH conditions. E, The relative areas of total VIAAT and GlyR punctate signals in Ctrl, cSTR, and WASH conditions.F, The relative areas of GlyR signals apposed to VIAAT in Ctrl, cSTR, and WASH conditions. G, Overlap coefficients of Manders et al. (1993) forVIAAT and GlyR signals. H, A representative immunoblot analysis of total and surface expression levels of glycine receptors in Ctrl, cSTR, andWASH conditions. Biotinylated glycine receptors (surface) were isolated from the detergent-soluble fraction (total). Expression levels of �-actinwere used as an internal control for total GlyR. M, Molecular weight marker. I, Quantification of total and surface expression levels of glycinereceptors. Expression levels of total GlyRs are normalized by �-actin, and those of surface GlyRs are normalized by total GlyRs. C–G, I, Statisticaldata are reported as the mean � SEM derived from 14–17 cells in three independent experiments (C–G) and from three independent experiments(I). The relative numbers, areas, and intensities are normalized to the mean values of Ctrl conditions. C–G, I, The significance of the difference wastested by one-way ANOVA with Bonferroni’s post hoc test (C–G) and by Kruskal–Wallis test followed by post hoc comparisons usingMann–Whitney U test with Bonferroni’s correction (I). �p 0.05, ��p 0.01, ���p 0.001. n.s. Not significant.
New Research 9 of 20
January/February 2017, 4(1) e0194-16.2017 eNeuro.org

(cSTR group, 942 � 94, p � 1.00, vs Ctrl group; WASHgroup, 1068 � 110, p � 0.76 vs Ctrl group; Ctrl group, 909� 72), no differences were detected among the threegroups (Fig. 2C). Similarly, the numbers of GlyR�1 punctacolocalized to VIAAT puncta were not different among allthree conditions (cSTR, 383 � 38, p � 1.00 vs Ctrl;WASH, 451 � 49, p � 0.40, vs Ctrl; Ctrl, 359 � 34; Fig.2D). Although no differences were observed in the relativesize of VIAAT puncta across the three groups (cSTRgroup, 0.89 � 0.04, p � 0.58 vs Ctrl group; WASH group,0.92 � 0.09, p � 1.00 vs Ctrl; Ctrl group, 1.00 � 0.05), therelative size of GlyR puncta was significantly smaller in thecSTR group than those in Ctrl and WASH groups (cSTRgroup, 0.68 � 0.03, p � 0.02 vs Ctrl; WASH group, 1.12� 0.13, p � 0.98 vs Ctrl; Ctrl group, 1.00 � 0.07; Fig. 2E).In addition, the relative size of GlyR�1 puncta apposed toVIAAT signals in the cSTR group (0.62 � 0.03) was sig-nificantly smaller than those of GlyR�1 puncta in both theCtrl group (1.00 � 0.09; p � 0.007) and the WASH group(1.03 � 0.13; p � 0.004; Fig. 2F). In addition, the extent ofcolocalization of the VIAAT and GlyR�1 puncta was sig-nificantly lower in the cSTR group (overlap coefficient,0.31 � 0.02) compared with that in the Ctrl group (0.51 �0.02; p 0.0001) and the WASH group (0.47 � 0.02; p 0.0001; Fig. 2G). The total number of GlyR�1 proteinsexpressed in the cells (cSTR group, p � 1.00 vs Ctrlgroup; WASH group, p � 1.00 vs Ctrl group), or the totalnumber of GlyR�1 proteins expressed on the plasmamembrane were not significantly different across all threeexperimental groups, as measured by Western blotting(cSTR group, p � 1.00 vs Ctrl group; WASH group, p �1.00 vs Ctrl group; Fig. 2H,I). This indicates that chronictreatment with strychnine reduces the size of GlyR clus-ters localized at inhibitory synapses, without affecting thenumbers of total and synaptic GlyR clusters. The distri-bution of GlyR cluster size and localization returns tocontrol levels within 1 h of strychnine washout. Hence, inthese mature cultures, synaptic GlyR cluster size is rapidlyincreased following receptor activation, coincident with achange in surface GlyR localization.
In addition, chronic strychnine treatment does not af-fect the synaptic number (Fig. 2D). Thus, the comparablelength of IEIs in mIPSCs between the WASH and Ctrlgroups (Fig. 1E,H) indicates that presynaptic releaseprobability is unaffected by chronic strychnine treatment.
GlyR activation reduces the spatial dynamics oflaterally diffusive GlyRs in the cytoplasmicmembrane
The increase in GlyR cluster size and change in surfacelocalization without any apparent change in total cellularor surface expression of GlyRs suggests that GlyR acti-vation somehow changes GlyR surface distribution torecruit receptors to synaptic clusters. To examine thebehavior of surface-localized GlyRs, we applied FRAP tosingle neuronal processes (Soumpasis, 1983; Reits andNeefjes, 2001). To selectively visualize surface GlyRs, wegenerated a GlyR�1 construct tagged with SEP to give apH-sensitive enhanced green fluorescent protein se-quence in the extracellular N-terminal domain of GlyR�1
subunit (SEP-GlyR). SEP emits a distinctively high fluo-rescence when in a neutral pH environment but does notfluoresce when within a more acidic environment, such asthat found inside intracellular transport organelles, andhence this enables the selective visualization of the sur-face population of proteins (Miesenböck et al., 1998;Sankaranarayanan and Ryan, 2001; Ashby et al., 2004).The fluorescence intensity of SEP-GlyRs on single neuro-nal processes in the three groups was measured beforeand after photobleaching (Fig. 3A). Localized photo-bleaching eliminates fluorescent signals from SEP-GlyRswithin the targeted region, and hence recovery of thefluorescent signal reflects the movement of unbleachedSEP-GlyRs into the target region, a so-called “mobilefraction,” that was quantified as the relative recovery offluorescence at the end of the 257 s imaging period afterphotobleaching (Fig. 3B,C). In neurons from the Ctrlgroup, the mobile fraction reached a plateau of 0.18 �0.03 (n � 15), which was similar to that observed in theWASH group (0.14 � 0.03; n � 12; p � 0.52). In contrast,the mobile fraction in the cSTR group was significantlyhigher (0.46 � 0.03; n � 16; p 0.0001), indicating anincrease in the population of new or mobile SEP-GlyRsthat reappear at the neurite plasma membrane after pho-tobleaching. Conversely, the lower mobile fractions in theCtrl and WASH groups suggest that GlyRs in thesegroups are less mobile or that receptor activation makesthem more stable.
The increase in GlyR-SEP fluorescence after photo-bleaching may arise from either (1) exocytosis of GlyRsfrom cytoplasmic vesicles into the plasma membrane or(2) lateral diffusion of surface GlyRs from outside of thebleached region. To distinguish which of these is in-creased by chronic strychnine administration, we mea-sured the fluorescence recovery in chronically strychnine-treated neurons in the presence of BFA, an inhibitor ofER–Golgi transport that blocks exocytosis (Fujiwara et al.,1988; Rannals and Kapur, 2011). BFA (5 �g/ml) wasadded to the external solution for 90 min before eachimaging. The mobile fraction in the presence of BFA wasalso elevated relative to control and was not significantlydifferent from that seen in the cSTR group (cSTR plusBFA: 0.54 � 0.03, n � 5, p � 0.11; Fig. 3B,C).
We therefore next examined whether the higher mobilefraction of SEP-GlyR in the cSTR group is due to anincrease in the appearance of new GlyRs from lateraldiffusion, using a combination of FRAP with FLIP (Jaskol-ski et al., 2009; Hildick et al., 2012). FLIP involved re-peated photobleaching of regions bilateral to the centerregion targeted by FRAP, so that GlyRs moving into thecenter target region are photobleached before they arrive(Fig. 3D,E). Thus, FLIP excludes laterally diffusing GlyRsfrom the mobile fraction, leaving just newly exocytosedSEP-GlyR�1 to contribute to the fluorescence recovery.The mobile fractions in these FRAP-FLIP experimentswere comparable among the experimental groups (cSTRgroup, 0.14 � 0.02, n � 13, p � 0.70 vs Ctrl group; WASHgroup, 0.11 � 0.02, n � 11, p � 0.09 vs Ctrl group;Ctrl group, 0.17 � 0.03, n � 8; Fig. 3F,G). Together, theseresults demonstrate that chronic strychnine administration
New Research 10 of 20
January/February 2017, 4(1) e0194-16.2017 eNeuro.org
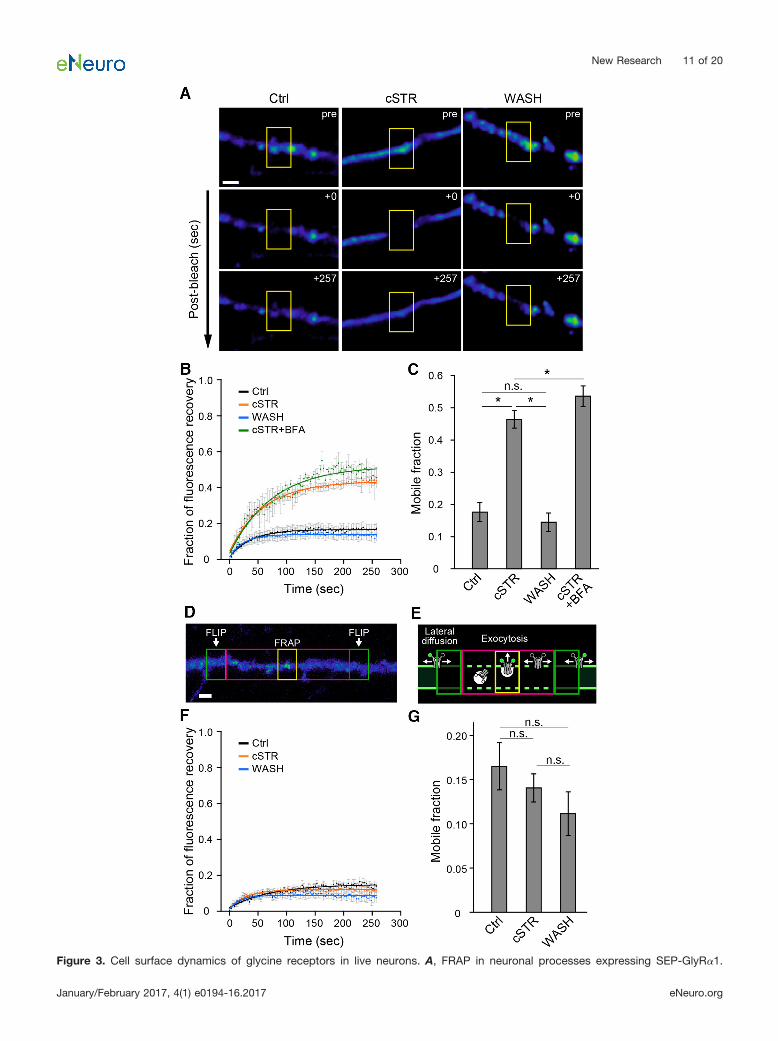
Figure 3. Cell surface dynamics of glycine receptors in live neurons. A, FRAP in neuronal processes expressing SEP-GlyR�1.
New Research 11 of 20
January/February 2017, 4(1) e0194-16.2017 eNeuro.org
does not affect the rate of exocytosis of new GlyRs fromintracellular stores into the plasma membrane but, rather,increases the lateral diffusion of GlyRs along the plasmamembrane.
GlyR dynamics at gephyrin-expressing postsynapsesChanges of the diffusion properties of receptors can
determine the receptor localization at synapses (Dahanet al., 2003; Bannai et al., 2009; Choquet and Triller,2013). The postsynaptic localization and cluster sizes ofGlyRs are regulated by gephyrin, a major scaffolding pro-tein of GlyRs (Kirsch and Betz, 1995; Calamai et al., 2009).The distribution of gephyrin has been reported to be eitheraffected (Kirsch and Betz, 1998) or unaffected (Lévi et al.,1998; Tyagarajan and Fritschy, 2014) by GlyR activation.Hence, we examined whether chronic strychnine treat-ment affects the distribution of gephyrin at inhibitory syn-apses in the present study by measuring the overlapcoefficient of Manders et al. (1993) between immuno-stained gephyrin and VIAAT puncta. Neither chronicstrychnine application (cSTR group) nor the wash fromchronic strychnine with subsequent GlyR activation(WASH group) affected the gephyrin distribution (cSTRgroup, 0.53 � 0.01, p � 1, n � 15 vs Ctrl group; WASHgroup, 0.52 � 0.01, p � 0.57, n � 16, vs Ctrl group;Ctrl group, 0.54 � 0.01, n � 13; Fig. 4A,B).
Next, we examined whether the GlyR activation-induced change in GlyR mobility was selective for regionsaround inhibitory postsynapses, as defined by gephyrin-positive locations. Neuronal cultures were cotransfectedwith both SEP-GlyR�1 and mCherry-GPHN, and the flu-orescence intensity of SEP-GlyR�1 was measured beforeand after photobleaching and was compared betweenmCherry-GPHN-positive and mCherry-GPHN-negativeregions (Fig. 4C). At mCherry-GPHN-positive spots, themobile fraction of SEP-GlyR�1 was larger in the chronicpresence of strychnine (cSTR; 0.48 � 0.06, n � 8, p �0.002) in comparison with the mobile fraction of SEP-GlyR�1s at mCherry-GPHN-positive spots in Ctrl cultures(0.23 � 0.03, n � 14). Although ectopic expression ofSEP-GlyR�1s are likely to form homomeric GlyRs, synap-tic localization of GlyRs is regulated by interactions be-tween gephyrin and heteromeric GlyRs containing �1-and �-subunits (Tyagarajan and Fritschy, 2014). Thus, wealso measured the mobile fraction of SEP-GlyR�1 in the
chronic presence of ginkgolide B (cGinkB), a potent chan-nel blocker of heteromeric GlyR (Kondratskaya et al.,2005; 0.40 � 0.06, n � 8) and confirmed that it wassignificantly larger than that in the Ctrl group (p � 0.005).In contrast, the mobile fraction in the WASH group (0.25 �0.03, n � 15) was similar to that in the Ctrl group (p �0.62; Fig. 4D,E). However, the mobile fractions atmCherry-GPHN-lacking regions were all relatively high,with no significant differences among the groups (Ctrlgroup, 0.47 � 0.04, n � 14; cSTR group, 0.59 � 0.07, n� 8; cGinkB group, 0.62 � 0.04, n � 8; WASH group, 0.53� 0.05, n � 15; Fig. 4F,G). Although high-power excita-tion laser light also decreased the fluorescence intensityof mCherry-GPHN, the mobile fractions of fluorescencerecovery between SEP-GlyR�1 and mCherry-GPHN in thesame FRAP regions in the sum of the three experimentalgroups were not correlated (r � 0.20, p � 0.25, n � 37;Fig. 4H). Thus, mobile fractions of SEP-GlyR�1 were in-dependent of the photobleaching of mCherry-GPHN.These results suggest that the lateral mobility of GlyRs onthe cell surface under intact glycinergic transmission islower at sites of gephyrin localization, and this receptorstabilization is absent in chronically inactivated GlyRs. Inaddition, 1 �M strychnine is reported to affect nicotinicacetylcholine receptors (nAChRs; Matsubayashi et al.,1998). However, the mobile fraction of SEP-GlyR�1 in thechronic presence 0.5 �M mecamylamine hydrochloride(cMec), a noncompetitive antagonist of nAChRs (Papkeet al., 2001; Yasuyoshi et al., 2002; cMec, 0.28 � 0.06, n� 8) was comparable to that in the Ctrl group (p � 0.62)in mCherry-GPHN-positive regions (Fig. 4E). Thus, higherGlyR mobility in the cSTR group is independent of nAChRblockade.
We next confirmed whether the local glycine applicationdirectly and selectively induces GlyR clustering at thegephyrin-positive area. The 1 M glycine was applied usinga micropipette placed beside single dendrites in cSTRgroup. After glycine application for 60 min, the fluores-cence intensity of SEP-GlyR�1 was increased atgephyrin-positive spots, and the changes are significantlylarger in the GPHN� area (1.49 � 0.15, n � 7 cells) than inthe GPHN� area (0.95 � 0.06, n � 7 cells; p � 0.01; Fig.4I,J). These results suggest that activated GlyRs makeclusters selectively at gephyrin-expressing postsynapseswithin 60 min.
continuedFluorescence of SEP-GlyR�1 was bleached in the region of the neuronal process indicated by the yellow rectangles. Each rowrepresents before (pre), immediately after (�0 s), and at a later time (�257 s) after photobleaching in each condition (Ctrl, cSTR, andWASH). Scale bar, 2 �m. B, Normalized fluorescence recovery curves after photobleaching in Ctrl (black, n � 15 cells), cSTR (orange,n � 16 cells), WASH (cyan, n � 12 cells), and cSTR� BFA (green, n � 5 cells) conditions. Each plot and bar represents the mean and�SEM. C, Averaged mobile fractions in Ctrl, cSTR, WASH, and cSTR with BFA conditions (mean � SEM), as shown in B. The mobilefraction was defined as the extent of fluorescence recovery at the end of the imaging time. D, A representative image of SEP-GlyR�1fluorescence and the regions of the neuronal processes used for the FRAP-FLIP experiments. Repetitive photobleaching (FLIP, greenrectangles) occurred at regions bilateral to the central FRAP region (yellow rectangle). A magenta rectangle shows the buffer regionused to minimize any effects of the leakage of light from the FLIP regions. Scale bar, 2 �m. E, A schematic of hypotheticalSEP-GlyR�1 movements under the FRAP-FLIP configuration shown in D. F, Normalized fluorescence recovery curves (mean � SEM)in Ctrl (n � 8 cells, black), cSTR (n � 15 cells, orange), and WASH (n � 12 cells, cyan) conditions in the FRAP-FLIP experiments. G,Averaged mobile fractions in the Ctrl, cSTR, and WASH conditions (mean � SEM), as shown in F. The significance of difference wastested by Kruskal–Wallis test followed by post hoc comparisons using the Mann–Whitney U test with Bonferroni’s correction. ���p 0.001/6 after Bonferroni’s correction for the six tests. n.s., Not significant.
New Research 12 of 20
January/February 2017, 4(1) e0194-16.2017 eNeuro.org
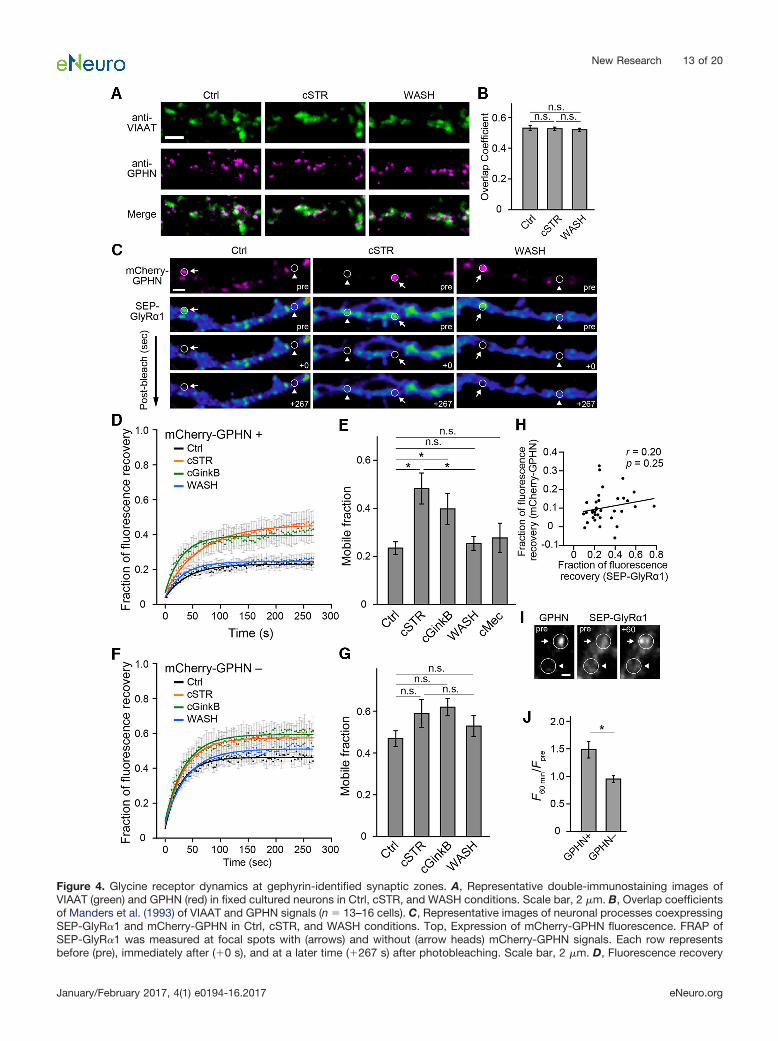
Figure 4. Glycine receptor dynamics at gephyrin-identified synaptic zones. A, Representative double-immunostaining images ofVIAAT (green) and GPHN (red) in fixed cultured neurons in Ctrl, cSTR, and WASH conditions. Scale bar, 2 �m. B, Overlap coefficientsof Manders et al. (1993) of VIAAT and GPHN signals (n � 13–16 cells). C, Representative images of neuronal processes coexpressingSEP-GlyR�1 and mCherry-GPHN in Ctrl, cSTR, and WASH conditions. Top, Expression of mCherry-GPHN fluorescence. FRAP ofSEP-GlyR�1 was measured at focal spots with (arrows) and without (arrow heads) mCherry-GPHN signals. Each row representsbefore (pre), immediately after (�0 s), and at a later time (�267 s) after photobleaching. Scale bar, 2 �m. D, Fluorescence recovery
New Research 13 of 20
January/February 2017, 4(1) e0194-16.2017 eNeuro.org
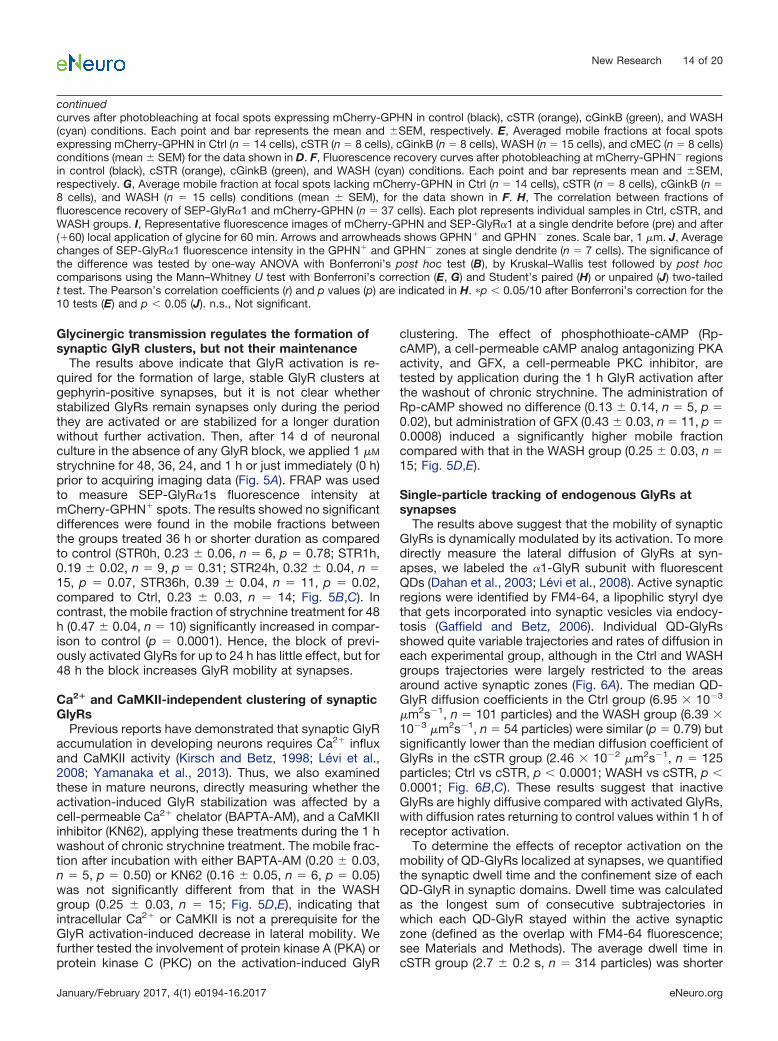
Glycinergic transmission regulates the formation ofsynaptic GlyR clusters, but not their maintenance
The results above indicate that GlyR activation is re-quired for the formation of large, stable GlyR clusters atgephyrin-positive synapses, but it is not clear whetherstabilized GlyRs remain synapses only during the periodthey are activated or are stabilized for a longer durationwithout further activation. Then, after 14 d of neuronalculture in the absence of any GlyR block, we applied 1 �M
strychnine for 48, 36, 24, and 1 h or just immediately (0 h)prior to acquiring imaging data (Fig. 5A). FRAP was usedto measure SEP-GlyR�1s fluorescence intensity atmCherry-GPHN� spots. The results showed no significantdifferences were found in the mobile fractions betweenthe groups treated 36 h or shorter duration as comparedto control (STR0h, 0.23 � 0.06, n � 6, p � 0.78; STR1h,0.19 � 0.02, n � 9, p � 0.31; STR24h, 0.32 � 0.04, n �15, p � 0.07, STR36h, 0.39 � 0.04, n � 11, p � 0.02,compared to Ctrl, 0.23 � 0.03, n � 14; Fig. 5B,C). Incontrast, the mobile fraction of strychnine treatment for 48h (0.47 � 0.04, n � 10) significantly increased in compar-ison to control (p � 0.0001). Hence, the block of previ-ously activated GlyRs for up to 24 h has little effect, but for48 h the block increases GlyR mobility at synapses.
Ca2� and CaMKII-independent clustering of synapticGlyRs
Previous reports have demonstrated that synaptic GlyRaccumulation in developing neurons requires Ca2� influxand CaMKII activity (Kirsch and Betz, 1998; Lévi et al.,2008; Yamanaka et al., 2013). Thus, we also examinedthese in mature neurons, directly measuring whether theactivation-induced GlyR stabilization was affected by acell-permeable Ca2� chelator (BAPTA-AM), and a CaMKIIinhibitor (KN62), applying these treatments during the 1 hwashout of chronic strychnine treatment. The mobile frac-tion after incubation with either BAPTA-AM (0.20 � 0.03,n � 5, p � 0.50) or KN62 (0.16 � 0.05, n � 6, p � 0.05)was not significantly different from that in the WASHgroup (0.25 � 0.03, n � 15; Fig. 5D,E), indicating thatintracellular Ca2� or CaMKII is not a prerequisite for theGlyR activation-induced decrease in lateral mobility. Wefurther tested the involvement of protein kinase A (PKA) orprotein kinase C (PKC) on the activation-induced GlyR
clustering. The effect of phosphothioate-cAMP (Rp-cAMP), a cell-permeable cAMP analog antagonizing PKAactivity, and GFX, a cell-permeable PKC inhibitor, aretested by application during the 1 h GlyR activation afterthe washout of chronic strychnine. The administration ofRp-cAMP showed no difference (0.13 � 0.14, n � 5, p �0.02), but administration of GFX (0.43 � 0.03, n � 11, p �0.0008) induced a significantly higher mobile fractioncompared with that in the WASH group (0.25 � 0.03, n �15; Fig. 5D,E).
Single-particle tracking of endogenous GlyRs atsynapses
The results above suggest that the mobility of synapticGlyRs is dynamically modulated by its activation. To moredirectly measure the lateral diffusion of GlyRs at syn-apses, we labeled the �1-GlyR subunit with fluorescentQDs (Dahan et al., 2003; Lévi et al., 2008). Active synapticregions were identified by FM4-64, a lipophilic styryl dyethat gets incorporated into synaptic vesicles via endocy-tosis (Gaffield and Betz, 2006). Individual QD-GlyRsshowed quite variable trajectories and rates of diffusion ineach experimental group, although in the Ctrl and WASHgroups trajectories were largely restricted to the areasaround active synaptic zones (Fig. 6A). The median QD-GlyR diffusion coefficients in the Ctrl group (6.95 � 10�3
�m2s�1, n � 101 particles) and the WASH group (6.39 �10�3 �m2s�1, n � 54 particles) were similar (p � 0.79) butsignificantly lower than the median diffusion coefficient ofGlyRs in the cSTR group (2.46 � 10�2 �m2s�1, n � 125particles; Ctrl vs cSTR, p 0.0001; WASH vs cSTR, p 0.0001; Fig. 6B,C). These results suggest that inactiveGlyRs are highly diffusive compared with activated GlyRs,with diffusion rates returning to control values within 1 h ofreceptor activation.
To determine the effects of receptor activation on themobility of QD-GlyRs localized at synapses, we quantifiedthe synaptic dwell time and the confinement size of eachQD-GlyR in synaptic domains. Dwell time was calculatedas the longest sum of consecutive subtrajectories inwhich each QD-GlyR stayed within the active synapticzone (defined as the overlap with FM4-64 fluorescence;see Materials and Methods). The average dwell time incSTR group (2.7 � 0.2 s, n � 314 particles) was shorter
continuedcurves after photobleaching at focal spots expressing mCherry-GPHN in control (black), cSTR (orange), cGinkB (green), and WASH(cyan) conditions. Each point and bar represents the mean and �SEM, respectively. E, Averaged mobile fractions at focal spotsexpressing mCherry-GPHN in Ctrl (n � 14 cells), cSTR (n � 8 cells), cGinkB (n � 8 cells), WASH (n � 15 cells), and cMEC (n � 8 cells)conditions (mean � SEM) for the data shown in D. F, Fluorescence recovery curves after photobleaching at mCherry-GPHN� regionsin control (black), cSTR (orange), cGinkB (green), and WASH (cyan) conditions. Each point and bar represents mean and �SEM,respectively. G, Average mobile fraction at focal spots lacking mCherry-GPHN in Ctrl (n � 14 cells), cSTR (n � 8 cells), cGinkB (n �8 cells), and WASH (n � 15 cells) conditions (mean � SEM), for the data shown in F. H, The correlation between fractions offluorescence recovery of SEP-GlyR�1 and mCherry-GPHN (n � 37 cells). Each plot represents individual samples in Ctrl, cSTR, andWASH groups. I, Representative fluorescence images of mCherry-GPHN and SEP-GlyR�1 at a single dendrite before (pre) and after(�60) local application of glycine for 60 min. Arrows and arrowheads shows GPHN� and GPHN� zones. Scale bar, 1 �m. J, Averagechanges of SEP-GlyR�1 fluorescence intensity in the GPHN� and GPHN� zones at single dendrite (n � 7 cells). The significance ofthe difference was tested by one-way ANOVA with Bonferroni’s post hoc test (B), by Kruskal–Wallis test followed by post hoccomparisons using the Mann–Whitney U test with Bonferroni’s correction (E, G) and Student’s paired (H) or unpaired (J) two-tailedt test. The Pearson’s correlation coefficients (r) and p values (p) are indicated in H. �p 0.05/10 after Bonferroni’s correction for the10 tests (E) and p 0.05 (J). n.s., Not significant.
New Research 14 of 20
January/February 2017, 4(1) e0194-16.2017 eNeuro.org
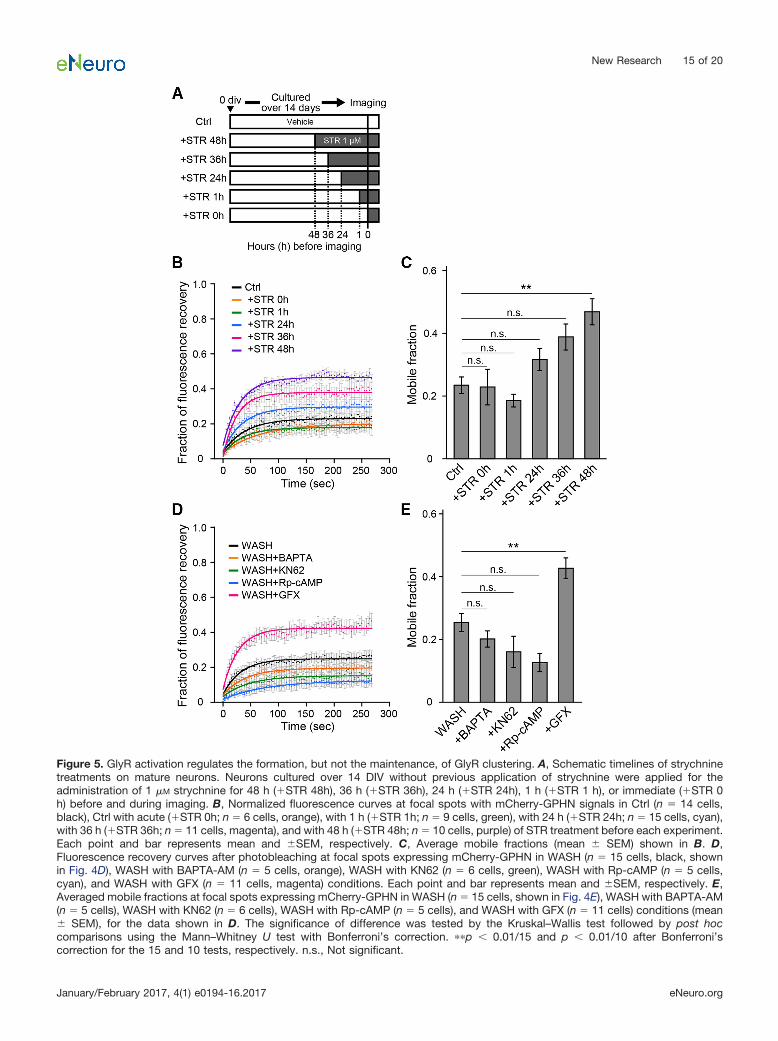
Figure 5. GlyR activation regulates the formation, but not the maintenance, of GlyR clustering. A, Schematic timelines of strychninetreatments on mature neurons. Neurons cultured over 14 DIV without previous application of strychnine were applied for theadministration of 1 �M strychnine for 48 h (�STR 48h), 36 h (�STR 36h), 24 h (�STR 24h), 1 h (�STR 1 h), or immediate (�STR 0h) before and during imaging. B, Normalized fluorescence curves at focal spots with mCherry-GPHN signals in Ctrl (n � 14 cells,black), Ctrl with acute (�STR 0h; n � 6 cells, orange), with 1 h (�STR 1h; n � 9 cells, green), with 24 h (�STR 24h; n � 15 cells, cyan),with 36 h (�STR 36h; n � 11 cells, magenta), and with 48 h (�STR 48h; n � 10 cells, purple) of STR treatment before each experiment.Each point and bar represents mean and �SEM, respectively. C, Average mobile fractions (mean � SEM) shown in B. D,Fluorescence recovery curves after photobleaching at focal spots expressing mCherry-GPHN in WASH (n � 15 cells, black, shownin Fig. 4D), WASH with BAPTA-AM (n � 5 cells, orange), WASH with KN62 (n � 6 cells, green), WASH with Rp-cAMP (n � 5 cells,cyan), and WASH with GFX (n � 11 cells, magenta) conditions. Each point and bar represents mean and �SEM, respectively. E,Averaged mobile fractions at focal spots expressing mCherry-GPHN in WASH (n � 15 cells, shown in Fig. 4E), WASH with BAPTA-AM(n � 5 cells), WASH with KN62 (n � 6 cells), WASH with Rp-cAMP (n � 5 cells), and WASH with GFX (n � 11 cells) conditions (mean� SEM), for the data shown in D. The significance of difference was tested by the Kruskal–Wallis test followed by post hoccomparisons using the Mann–Whitney U test with Bonferroni’s correction. ��p 0.01/15 and p 0.01/10 after Bonferroni’scorrection for the 15 and 10 tests, respectively. n.s., Not significant.
New Research 15 of 20
January/February 2017, 4(1) e0194-16.2017 eNeuro.org

than that of Ctrl group (5.9 � 0.7 s, n � 150 particles; p 0.0001). The average dwell time in the WASH group (4.3 �0.7 s, n � 97 particles) returned to that seen in the Ctrlgroup, although it was not significantly different from thatin the cSTR group (p � 0.09; Fig. 6D). The confinementsize of each QD-GlyR, defined as the length of an equiv-
alent square within which diffusion was restricted (seeMaterials and Methods), was significantly larger in thecSTR condition (0.55 � 0.09 �m, n � 38 particles) com-pared with that in the Ctrl condition (0.22 � 0.02 �m, n �45 particles; p � 0.0002) and the WASH condition (0.21 �0.05 �m, n � 19 particles; p � 0.004; Fig. 6E). Hence,
Figure 6. GlyR activation modulates its diffusion properties around active synapses. A, Representative images of QD-labeledendogenous GlyRs (magenta) and FM4-64-labeled active synapses (green) shown as maximum intensity projections of 30 s of imagerecordings in Ctrl, cSTR, and WASH conditions (top panels). The bottom panels show the trajectories of correspondent QD-labeledGlyRs (centroids) shown in the top panels inside (green) and outside (magenta) active synapses. Scale bars, 2 �m. B, Cumulativeprobabilities of the median diffusion coefficient of each QD-GlyR within the active synapse region in Ctrl (n � 101 particles, 7 cells),cSTR (n � 125 particles, 8 cells), and WASH (n � 54 particles, 7 cells) conditions. C, Median diffusion coefficients of each QD-GlyRat synapses comparing Ctrl, cSTR, and WASH conditions (median � 25–75% interquartile range (IQR)). D, Average dwell times ofQD-GlyRs within synapse regions (Ctrl: n � 150 particles, 7 cells; cSTR: n � 314 particles, 8 cells; WASH: n � 97 particles, 7 cells,mean � SEM). E, Average confinement size of QD-GlyRs at synapses (mean � SEM) in Ctrl (n � 49 particles, 7cells), cSTR (n � 38particles, 8 cells), and WASH (n � 19 particles, 7 cells) conditions. Significance of difference was tested by Kruskal–Wallis testfollowed by post hoc comparisons using the Mann–Whitney U test with Bonferroni’s correction, ���p 0.001/3 after Bonferroni’scorrection for the three tests (C) and by one-way ANOVA with Bonferroni post hoc test (D, E). ��p 0.01, ���p 0.001. n.s., Notsignificant.
New Research 16 of 20
January/February 2017, 4(1) e0194-16.2017 eNeuro.org
chronically blocked (inactive) GlyRs diffuse at a faster rateand over a larger area in synaptic domains compared withactivated GlyRs. Inactive GlyRs also reside for brieferdurations at synapses.
DiscussionThe present study demonstrated here that glycinergic
synaptic responses and spatial distributions of GlyRswere modulated by receptor activation via presynapticallyreleased glycine in mature spinal cord neurons indepen-dent of the Ca2�-mediated mechanism. The clustering ofother ionotropic receptors, such as AMPA receptors andGABAA receptors, are regulated by a Ca2�-dependentprocess in both immature and mature neurons (Borgdorffand Choquet, 2002; Petrini et al., 2014). As for GABAA
receptors, for example, excitatory activity induces depo-larization and increases clustering of GABAA receptors viaCaMKII activity (Petrini et al., 2014). The prevailing con-cept for GlyR synaptic clusters that was developed fromstudies on immature circuits is similar to that for AMPAreceptors and GABAA receptors. Glycine receptor activa-tion induces depolarization in immature neurons and sub-sequent Ca2� influx (Kirsch and Betz, 1998), whichactivates Ca2�-dependent kinases to elicit increases inreceptor clusters (Charrier et al., 2010; Yamanaka et al.,2013). This concept relies on the fact that glycine andGABAA receptor activation induces depolarizations inearly development, as intracellular Cl� is elevated due tothe absence of functional K�-Cl� cotransporter 2 (KCC2).Since KCC2 is expressed during development, the resul-tant Cl� efflux lowers intracellular Cl� and converts theGABA and glycine response to hyperpolarizing (Kakazuet al., 1999; Rivera et al., 1999). This upregulation of KCC2and switch from depolarization to hyperpolarization oc-curs over the first postnatal weeks in most regions of thecentral nervous system (Ehrlich et al, 1999; Jean-Xavieret al., 2006). In cultured neurons of spinal cord and brain-stem, the switch from GABA or glycine-induced depolar-izations to hyperpolarizations occurs between 1 and 3weeks in vitro, with the precise timing depending onculture conditions (Chen et al., 1996; Khirug et al., 2005).In our experiments, the glycine reversal potential after 14d of culture was already hyperpolarizing and, more impor-tantly, was the same as that in cultures in which GlyRswere chronically blocked with strychnine (Fig. 1D). Thus,our culture model system mimicked the first activation ofnewly expressed GlyRs on the cytoplasmic membraneafter maturation of Cl� homeostasis when glycinergictransmission becomes dominant from GABAergic trans-mission in physiological conditions (Kotak et al., 1998;Gao et al., 2001; Russier et al., 2002). Indeed, the presentresults demonstrate that the activation-induced decreaseof synaptic GlyR mobility that was associated withactivation-dependent GlyR aggregation at synapses wasnot affected by Ca2� chelation and inhibition of CaMKII(Fig. 5D,E). Although the activity-dependent cluster stabi-lization at the mature stage that we demonstrated hereshares similarities with previous reports during earlydevelopment, the underlying mechanisms must be dis-tinct due to the lack of depolarization. Accordingly, our
results propose that presynaptic release of inhibitoryneurotransmitters alone is sufficient to regulate postsyn-aptic localization of inhibitory neurotransmitter receptors.Furthermore, this Ca2�-independent clustering of inhibi-tory neurotransmitter receptors might contribute to thehomeostatic turnover of the postsynaptic receptors inmature synapses.
Neural activity and NMDA receptor activation de-creases the lateral diffusion of GlyRs and increases theiraccumulation into synaptic clusters (Kirsch and Betz,1998; Lévi et al., 2008). A remarkable observation in thepresent study is the speed at which this can occur. Only1 h of GlyR activation was sufficient to restrict GlyRdiffusion to synapses and to stabilize and increase func-tional clusters. Our experiments were all conducted inthe continued presence of TTX, DL-APV, CNQX, andSR95531, excluding any more general changes in neuralactivity and excitatory receptor activation as contributorsto this receptor stabilization. In addition, the intereventintervals of mIPSCs were not affected by chronic strych-nine administration, indicating no prolonged changes inthe neural circuit excitability (Fig. 1H). Hence, GlyR acti-vation by itself stabilizes synaptic GlyRs, independent ofchanges in overall levels of excitatory neural activity.
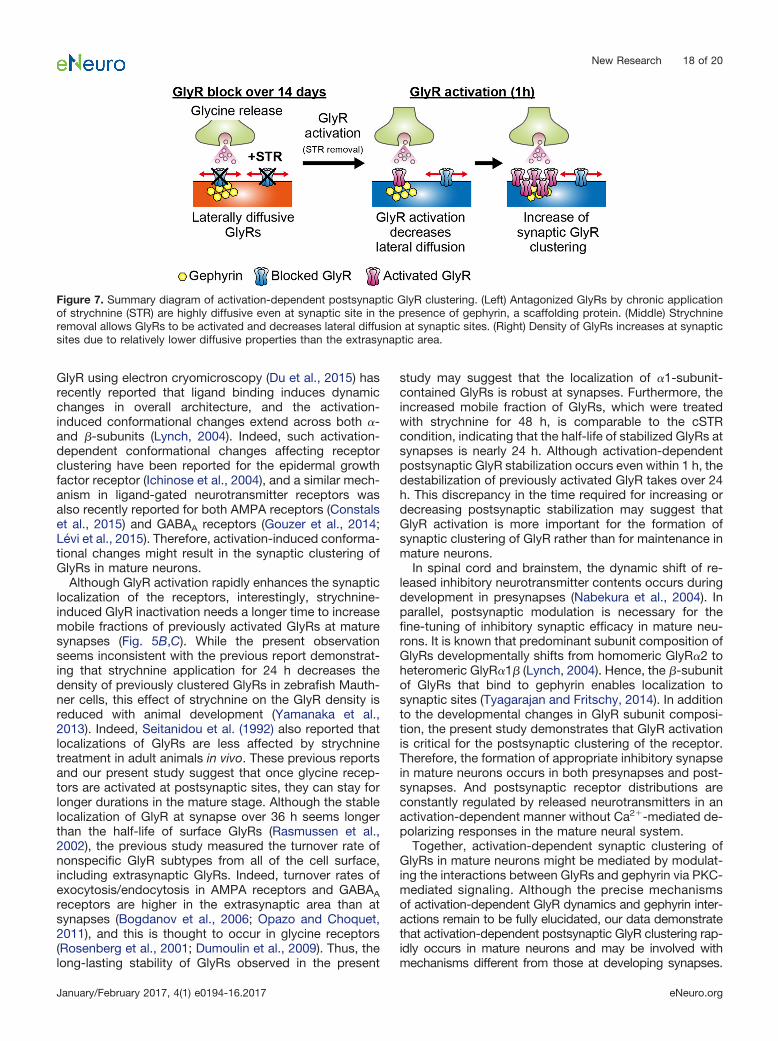
GlyR diffusion properties and synaptic localization isknown to depend critically on interactions with gephyrin,the scaffolding protein of inhibitory neurotransmitter re-ceptors (Tyagarajan and Fritschy, 2014). In the presentstudy, direct measurement of endogenous GlyR move-ments by single-particle tracking demonstrated thatchronic receptor inactivation resulted in larger diffusioncoefficients and an increase in the area over which GlyRsmoved (Fig. 6B,C,E). When GlyR activation was allowed,the diffusive property of those GlyRs at synaptic domainsdecreased (Figs. 6, 7). The restricted mobility of activatedGlyRs at synapses is likely to also involve interactions withgephyrin, as the mobility of GlyRs outside gephyrin clus-ters (in control condition) was much higher and was sim-ilar to that seen with chronic blockade of GlyRs (Fig.4D–G). Gephyrin interaction with the GlyR� subunit hasbeen suggested to decrease the lateral mobility of GlyRs(Schrader et al., 2004; Specht et al., 2011) through aphosphorylation-dependent mechanism (Zita et al., 2007;Charrier et al., 2010). And PKC-mediated phosphorylationenhanced postsynaptic localization of GABAA receptors(Bannai et al., 2015). In the present study, treatment of thePKC inhibitor, but not the Ca2� chelator, disturbedactivation-dependent GlyR stabilization at postsynapses(Fig. 5D,E), suggesting that activation-dependent post-synaptic GlyR clustering in mature neurons may be me-diated by the activity of Ca2�-independent PKC isoforms.Indeed, enhancement of glycinergic responses via PKCactivation in hippocampal neurons (Schönrock and Bor-mann, 1995), and more specifically by Ca2�-independentPKC activity in sacral dorsal commissural nucleus, hasbeen reported (Xu et al., 1996). In addition, ligand-inducedconformational changes in GlyRs resulting from their ac-tivation may also mediate interactions with gephyrin (orassociated proteins) and account for increased stabilityand cluster size (Meier, 2003). A structural analysis of
New Research 17 of 20
January/February 2017, 4(1) e0194-16.2017 eNeuro.org
GlyR using electron cryomicroscopy (Du et al., 2015) hasrecently reported that ligand binding induces dynamicchanges in overall architecture, and the activation-induced conformational changes extend across both �-and �-subunits (Lynch, 2004). Indeed, such activation-dependent conformational changes affecting receptorclustering have been reported for the epidermal growthfactor receptor (Ichinose et al., 2004), and a similar mech-anism in ligand-gated neurotransmitter receptors wasalso recently reported for both AMPA receptors (Constalset al., 2015) and GABAA receptors (Gouzer et al., 2014;Lévi et al., 2015). Therefore, activation-induced conforma-tional changes might result in the synaptic clustering ofGlyRs in mature neurons.
Although GlyR activation rapidly enhances the synapticlocalization of the receptors, interestingly, strychnine-induced GlyR inactivation needs a longer time to increasemobile fractions of previously activated GlyRs at maturesynapses (Fig. 5B,C). While the present observationseems inconsistent with the previous report demonstrat-ing that strychnine application for 24 h decreases thedensity of previously clustered GlyRs in zebrafish Mauth-ner cells, this effect of strychnine on the GlyR density isreduced with animal development (Yamanaka et al.,2013). Indeed, Seitanidou et al. (1992) also reported thatlocalizations of GlyRs are less affected by strychninetreatment in adult animals in vivo. These previous reportsand our present study suggest that once glycine recep-tors are activated at postsynaptic sites, they can stay forlonger durations in the mature stage. Although the stablelocalization of GlyR at synapse over 36 h seems longerthan the half-life of surface GlyRs (Rasmussen et al.,2002), the previous study measured the turnover rate ofnonspecific GlyR subtypes from all of the cell surface,including extrasynaptic GlyRs. Indeed, turnover rates ofexocytosis/endocytosis in AMPA receptors and GABAA
receptors are higher in the extrasynaptic area than atsynapses (Bogdanov et al., 2006; Opazo and Choquet,2011), and this is thought to occur in glycine receptors(Rosenberg et al., 2001; Dumoulin et al., 2009). Thus, thelong-lasting stability of GlyRs observed in the present
study may suggest that the localization of �1-subunit-contained GlyRs is robust at synapses. Furthermore, theincreased mobile fraction of GlyRs, which were treatedwith strychnine for 48 h, is comparable to the cSTRcondition, indicating that the half-life of stabilized GlyRs atsynapses is nearly 24 h. Although activation-dependentpostsynaptic GlyR stabilization occurs even within 1 h, thedestabilization of previously activated GlyR takes over 24h. This discrepancy in the time required for increasing ordecreasing postsynaptic stabilization may suggest thatGlyR activation is more important for the formation ofsynaptic clustering of GlyR rather than for maintenance inmature neurons.
In spinal cord and brainstem, the dynamic shift of re-leased inhibitory neurotransmitter contents occurs duringdevelopment in presynapses (Nabekura et al., 2004). Inparallel, postsynaptic modulation is necessary for thefine-tuning of inhibitory synaptic efficacy in mature neu-rons. It is known that predominant subunit composition ofGlyRs developmentally shifts from homomeric GlyR�2 toheteromeric GlyR�1� (Lynch, 2004). Hence, the �-subunitof GlyRs that bind to gephyrin enables localization tosynaptic sites (Tyagarajan and Fritschy, 2014). In additionto the developmental changes in GlyR subunit composi-tion, the present study demonstrates that GlyR activationis critical for the postsynaptic clustering of the receptor.Therefore, the formation of appropriate inhibitory synapsein mature neurons occurs in both presynapses and post-synapses. And postsynaptic receptor distributions areconstantly regulated by released neurotransmitters in anactivation-dependent manner without Ca2�-mediated de-polarizing responses in the mature neural system.
Together, activation-dependent synaptic clustering ofGlyRs in mature neurons might be mediated by modulat-ing the interactions between GlyRs and gephyrin via PKC-mediated signaling. Although the precise mechanismsof activation-dependent GlyR dynamics and gephyrin inter-actions remain to be fully elucidated, our data demonstratethat activation-dependent postsynaptic GlyR clustering rap-idly occurs in mature neurons and may be involved withmechanisms different from those at developing synapses.
Figure 7. Summary diagram of activation-dependent postsynaptic GlyR clustering. (Left) Antagonized GlyRs by chronic applicationof strychnine (STR) are highly diffusive even at synaptic site in the presence of gephyrin, a scaffolding protein. (Middle) Strychnineremoval allows GlyRs to be activated and decreases lateral diffusion at synaptic sites. (Right) Density of GlyRs increases at synapticsites due to relatively lower diffusive properties than the extrasynaptic area.
New Research 18 of 20
January/February 2017, 4(1) e0194-16.2017 eNeuro.org
The dynamic molecular changes we report here are likely tocontribute to a postsynaptic mechanism underlying the de-velopmental switching of inhibitory neurotransmission andthe activity-dependent functional strengthening of inhibitorysynaptic transmission in the adult CNS.
ReferencesAshby MC, Ibaraki K, Henley JM (2004) It’s green outside: tracking
cell surface proteins with pH-sensitive GFP. Trends Neurosci 27:257–261. CrossRef Medline
Bannai H, Lévi S, Schweizer C, Dahan M, Triller A (2006) Imaging thelateral diffusion of membrane molecules with quantum dots. NatProtoc 1:2628–2634. CrossRef Medline
Bannai H, Lévi S, Schweizer C, Inoue T, Launey T, Racine V, SibaritaJB, Mikoshiba K, Triller A (2009) Activity-dependent tuning ofinhibitory neurotransmission based on GABAAR diffusion dynam-ics. Neuron 62:670–682. CrossRef Medline
Bannai H, Niwa F, Sherwood MW, Shrivastava AN, Arizono M,Miyamoto A, Sugiura K, Lévi S, Triller A, Mikoshiba K (2015)Bidirectional control of synaptic GABAAR clustering by glutamateand calcium. Cell Rep 13:2768–2780. CrossRef Medline
Becker CM, Schmieden V, Tarroni P, Strasser U, Betz H (1992)Isoform-selective deficit of glycine receptors in the mouse mutantspastic. Neuron 8:283–289. Medline
Ben-Ari Y (2002) Excitatory actions of GABA during development: thenature of the nurture. Nat Rev Neurosci 3:728–739. CrossRefMedline
Bogdanov Y, Michels G, Armstrong-Gold C, Haydon PG, LindstromJ, Pangalos M, Moss SJ (2006) Synaptic GABAA receptors aredirectly recruited from their extrasynaptic counterparts. EMBO J25:4381–4389. CrossRef Medline
Bonneau S, Dahan M, Cohen LD (2005) Single quantum dot trackingbased on perceptual grouping using minimal paths in a spatiotem-poral volume. IEEE Trans Image Process 14:1384–1395. CrossRef
Borgdorff AJ, Choquet D (2002) Regulation of AMPA receptor lateralmovements. Nature 417:649–653. CrossRef Medline
Calamai M, Specht CG, Heller J, Alcor D, Machado P, Vannier C,Triller A (2009) Gephyrin oligomerization controls GlyR mobilityand synaptic clustering. J Neurosci 29:7639–7648. CrossRef Med-line
Charrier C, Machado P, Tweedie-Cullen RY, Rutishauser D, MansuyIM, Triller A (2010) A crosstalk between �1 and �3 integrinscontrols glycine receptor and gephyrin trafficking at synapses. NatNeurosci 13:1388–1395. CrossRef Medline
Chen G, Trombley PQ, van den Pol AN (1996) Excitatory actions ofGABA in developing rat hypothalamic neurones. J Physiol 494:451–464. CrossRef
Choquet D, Triller A (2013) The dynamic synapse. Neuron 80:691–703. CrossRef Medline
Constals A, Penn AC, Compans B, Toulmé E, Phillipat A, Marais S,Retailleau N, Hafner AS, Coussen F, Hosy E, Choquet D (2015)Glutamate-induced AMPA receptor desensitization increases theirmobility and modulates short-term plasticity through unbindingfrom Stargazin. Neuron 85:787–803. CrossRef Medline
Dahan M, Lévi S, Luccardini C, Rostaing P, Riveau B, Triller A (2003)Diffusion dynamics of glycine receptors revealed by single-quantum dot tracking. Science 302:442–445. CrossRef Medline
Du J, Lü W, Wu S, Cheng Y, Gouaux E (2015) Glycine receptormechanism elucidated by electron cryo-microscopy. Nature 526:224–229. CrossRef Medline
Dumoulin A, Triller A, Kneussel M (2009) Cellular transport andmembrane dynamics of the glycine receptor. Front Mol Neurosci2:28. CrossRef Medline
Ebihara S, Shirato K, Harata N, Akaike N (1995) Gramicidin-perforated patch recording: GABA response in mammalian neu-rones with intact intracellular chloride. J Physiol 484:77–86.CrossRef
Ehrlich I, Lohrke S, Friauf E (1999) Shift from depolarizing to hyper-polarizing glycine action in rat auditory neurones is due to age-dependent Cl- regulation. J Physiol 520:121–137. CrossRef
Friauf E, Hammerschmidt B, Kirsch J (1997) Development of adult-type inhibitory glycine receptors in the central auditory system ofrats. J Comp Neurol 385:117–134. Medline
Fujiwara T, Oda K, Yokota S, Takatsuki A, Ikehara Y (1988) BrefeldinA causes disassembly of the Golgi complex and accumulation ofsecretory proteins in the endoplasmic reticulum. J Biol Chem263:18545–18552.
Gaffield MA, Betz WJ (2006) Imaging synaptic vesicle exocytosis andendocytosis with FM dyes. Nat Protoc 1:2916–2921. CrossRefMedline
Gao BX, Stricker C, Ziskind-Conhaim L (2001) Transition fromGABAergic to glycinergic synaptic transmission in newly formedspinal networks. J Neurophysiol 86:492–502. Medline
Gouzer G, Specht CG, Allain L, Shinoe T, Triller A (2014)Benzodiazepine-dependent stabilization of GABA(A) receptors atsynapses. Mol Cell Neurosci 63:101–113. CrossRef Medline
Hildick KL, González-González IM, Jaskolski F, Henley JM (2012)Lateral diffusion and exocytosis of membrane proteins in culturedneurons assessed using fluorescence recovery and fluorescence-loss photobleaching. J Vis Exp 60:1–9.
Huganir RL, Nicoll RA (2013) AMPARs and synaptic plasticity: thelast 25 years. Neuron 80:704–717. CrossRef Medline
Ichinose J, Murata M, Yanagida T, Sako Y (2004) EGF signallingamplification induced by dynamic clustering of EGFR. BiochemBiophys Res Commun 324:1143–1149. CrossRef Medline
Ishibashi H, Yamaguchi J, Nakahata Y, Nabekura J (2013) Dynamicregulation of glycine-GABA co-transmission at spinal inhibitorysynapses by neuronal glutamate transporter. J Physiol 591:3821–3832. CrossRef Medline
Jacob TC, Moss SJ, Jurd R (2008) GABA(A) receptor trafficking andits role in the dynamic modulation of neuronal inhibition. Nat RevNeurosci 9:331–343. CrossRef Medline
Jaskolski F, Mayo-Martin B, Jane D, Henley JM (2009) Dynamin-dependent membrane drift recruits AMPA receptors to dendriticspines. J Biol Chem 284:12491–12503. CrossRef Medline
Jean-Xavier C, Pflieger JF, Liabeuf S, Vinay L (2006) Inhibitory post-synaptic potentials in lumbar motoneurons remain depolarizingafter neonatal spinal cord transection in the rat. J Neurophysiol96:2274–2281. CrossRef
Kakazu Y, Akaike N, Komiyama S, Nabekura J (1999) Regulation ofintracellular chloride by cotransporters in developing lateral supe-rior olive neurons. J Neurosci 19:2843–2851.
Khirug S, Huttu K, Ludwig A, Smirnov S, Voipio J, Rivera C, Kaila K,Khiroug L (2005) Distinct properties of functional KCC2 expressionin immature mouse hippocampal neurons in culture and in acuteslices. Eur J Neurosci 21:899–904. CrossRef Medline
Kirsch J, Betz H (1995) The postsynaptic localization of the glycinereceptor-associated protein gephyrin is regulated by the cytoskel-eton. J Neurosci 15:4148–4156. Medline
Kirsch J, Betz H (1998) Glycine-receptor activation is required forreceptor clustering in spinal neurons. Nature 392:717–720. Cross-Ref Medline
Kondratskaya EL, Betz H, Krishtal OA, Laube B (2005) The betasubunit increases the ginkgolide B sensitivity of inhibitory glycinereceptors. Neuropharmacology 49:945–951. CrossRef Medline
Korada S, Schwartz IR (1999) Development of GABA, glycine, andtheir receptors in the auditory brainstem of gerbil: a light andelectron microscopic study. J Comp Neurol 409:664–681. Medline
Kotak VC, Korada S, Schwartz IR, Sanes DH (1998) A developmentalshift from GABAergic to glycinergic transmission in the centralauditory system. J Neurosci 18:4646–4655. Medline
Kuriu T, Yanagawa Y, Konishi S (2012) Activity-dependent coordi-nated mobility of hippocampal inhibitory synapses visualized withpresynaptic and postsynaptic tagged-molecular markers. Mol CellNeurosci 49:184–195. CrossRef Medline
Kusumi A, Sako Y, Yamamoto M (1993) Confined lateral diffusion ofmembrane receptors as studied by single particle tracking (nano-
New Research 19 of 20
January/February 2017, 4(1) e0194-16.2017 eNeuro.org

vid microscopy). Effects of calcium-induced differentiation in cul-tured epithelial cells. Biophys J 65:2021–2040. CrossRef Medline
Lévi S, Vannier C, Triller A (1998) Strychnine-sensitive stabilization ofpostsynaptic glycine receptor clusters. J Cell Sci 111:335–345.
Lévi S, Schweizer C, Bannai H, Pascual O, Charrier C, Triller A (2008)Homeostatic regulation of synaptic GlyR numbers driven by lateraldiffusion. Neuron 59:261–273. CrossRef Medline
Lévi S, Le Roux N, Eugène E, Poncer JC (2015) Benzodiazepineligands rapidly influence GABAA receptor diffusion and clusteringat hippocampal inhibitory synapses. Neuropharmacology 88:199–208. CrossRef Medline
Lynch JW (2004) Molecular structure and function of the glycinereceptor chloride channel. Physiol Rev 84:1051–1095. CrossRefMedline
Lynch JW, Callister RJ (2006) Glycine receptors: a new therapeutictarget in pain pathways. Curr Opin Investig Drugs 7:48–53. Medline
Ma W, Behar T, Chang L, Barker JL (1994) Transient increase inexpression of GAD65 and GAD67 mRNAs during postnatal devel-opment of rat spinal cord. J Comp Neurol 346:151–160. CrossRefMedline
Manders EMM, Verbeek FJ, Aten JA (1993) Measurement of co-localization of objects in dual-colour confocal images. J Microsc169:375–382. CrossRef
Matsubayashi H, Alkondon M, Pereira EF, Swanson KL, AlbuquerqueEX (1998) Strychnine: a potent competitive antagonist of alpha-bungarotoxin-sensitive nicotinic acetylcholine receptors in rat hip-pocampal neurons. J Pharmacol Exp Ther 284:904–913. Medline
McIntire SL, Reimer RJ, Schuske K, Edwards RH, Jorgensen EM(1997) Identification and characterization of the vesicular GABAtransporter. Nature 389:870–876. CrossRef Medline
Meier J (2003) The enigma of transmitter-selective receptor accu-mulation at developing inhibitory synapses. Cell Tissue Res 311:271–276. CrossRef Medline
Miesenböck G, De Angelis DA, Rothman JE (1998) Visualizing se-cretion and synaptic transmission with pH-sensitive green fluores-cent proteins. Nature 394:192–195. CrossRef Medline
Murase K, Ryu PD, Randic M (1989) Excitatory and inhibitory aminoacids and peptide-induced responses in acutely isolated rat spinaldorsal horn neurons. Neurosci Lett 103:56–63. Medline
Nabekura J, Katsurabayashi S, Kakazu Y, Shibata S, Matsubara A,Jinno S, Mizoguchi Y, Sasaki A, Ishibashi H (2004) Developmentalswitch from GABA to glycine release in single central synapticterminals. Nat Neurosci 7:17–23. CrossRef Medline
Opazo P, Choquet D (2011) A three-step model for the synapticrecruitment of AMPA receptors. Mol Cell Neurosci 46:1–8. Cross-Ref Medline
Papke RL, Sanberg PR, Shytle RD (2001) Analysis of mecamylaminestereoisomers on human nicotinic receptor subtypes. J PharmacolExp Ther 297:646–656. Medline
Petrini EM, Ravasenga T, Hausrat TJ, Iurilli G, Olcese U, Racine V,Sibarita JB, Jacob TC, Moss SJ, Benfenati F, Medini P, KneusselM, Barberis A (2014) Synaptic recruitment of gephyrin regulatessurface GABAA receptor dynamics for the expression of inhibitoryLTP. Nat Commun 5:3921. CrossRef
Rannals MD, Kapur J (2011) Homeostatic strengthening of inhibitorysynapses is mediated by the accumulation of GABAA receptors. JNeurosci 31:17701–17712. CrossRef Medline
Rasmussen H, Rasmussen T, Triller A, Vannier C (2002) Strychnine-blocked glycine receptor is removed from synapses by a shift ininsertion/degradation equilibrium. Mol Cell Neurosci 19:201–215.CrossRef Medline
Reits EA, Neefjes JJ (2001) From fixed to FRAP: measuring proteinmobility and activity in living cells. Nat Cell Biol 3:E145–E147.CrossRef Medline
Rivera C, Voipio J, Payne JA, Ruusuvuori E, Lahtinen H, Lamsa K,Pirvola U, Saarma M, Kaila K (1999) The K�/Cl- co-transporter
KCC2 renders GABA hyperpolarizing during neuronal maturation.Nature 397:251–255. CrossRef
Rosenberg M, Meier J, Triller A, Vannier C (2001) Dynamics of glycinereceptor insertion in the neuronal plasma membrane. J Neurosci21:5036–5044. Medline
Russier M, Kopysova IL, Ankri N, Ferrand N, Debanne D (2002) GABAand glycine co-release optimizes functional inhibition in rat brain-stem motoneurons in vitro. J Physiol 541:123–137. Medline
Sanes DH, Malone BJ, Semple MN (1998) Role of synaptic inhibitionin processing of dynamic binaural level stimuli. J Neurosci 18:794–803. Medline
Sankaranarayanan S, Ryan TA (2001) Calcium accelerates endocy-tosis of vSNAREs at hippocampal synapses. Nat Neurosci 4:129–136. CrossRef Medline
Saxton MJ, Jacobson K (1997) Single-particle tracking: applicationsto membrane dynamics. Annu Rev Biophys Biomol Struct 26:373–399. CrossRef Medline
Schönrock B, Bormann J (1995) Modulation of hippocampal glycinereceptor channels by protein kinase C. Neuroreport 6:301–304.Medline
Schrader N, Kim EY, Winking J, Paulukat J, Schindelin H, Schwarz G(2004) Biochemical characterization of the high affinity bindingbetween the glycine receptor and gephyrin. J Biol Chem 279:18733–18741. CrossRef Medline
Seitanidou T, Nicola MA, Triller A, Korn H (1992) Partial glycinergicdenervation induces transient changes in the distribution of aglycine receptor-associated protein in a central neuron. J Neurosci12:116–131.
Soumpasis DM (1983) Theoretical analysis of fluorescence photo-bleaching recovery experiments. Biophys J 41:95–97. CrossRefMedline
Specht CG, Grünewald N, Pascual O, Rostgaard N, Schwarz G,Triller A (2011) Regulation of glycine receptor diffusion propertiesand gephyrin interactions by protein kinase C. EMBO J 30:3842–3853. CrossRef Medline
Tyagarajan SK, Fritschy JM (2014) Gephyrin: a master regulator ofneuronal function? Nat Rev Neurosci 15:141–156. CrossRef Med-line
Waataja JJ, Kim HJ, Roloff AM, Thayer SA (2008) Excitotoxic loss ofpost-synaptic sites is distinct temporally and mechanistically fromneuronal death. J Neurochem 104:364–375. CrossRef Medline
Wang Y, Kakizaki T, Sakagami H, Saito K, Ebihara S, Kato M,Hirabayashi M, Saito Y, Furuya N, Yanagawa Y (2009) Fluorescentlabeling of both GABAergic and glycinergic neurons in vesicularGABA transporter (VGAT)-venus transgenic mouse. Neuroscience164:1031–1043. CrossRef Medline
Weltzien F, Puller C, O’Sullivan GA, Paarmann I, Betz H (2012)Distribution of the glycine receptor �-subunit in the mouse CNS asrevealed by a novel monoclonal antibody. J Comp Neurol 520:3962–3981. CrossRef Medline
Xu TL, Nabekura J, Akaike N (1996) Protein kinase C-media-ted enhancement of glycine response in rat sacral dorsalcommissural neurones by serotonin. J Physiol 496:491–501.CrossRef
Yamanaka I, Miki M, Asakawa K, Kawakami K, Oda Y, Hirata H (2013)Glycinergic transmission and postsynaptic activation of CaMKIIare required for glycine receptor clustering in vivo. Genes Cells18:211–224. CrossRef Medline
Yasuyoshi H, Kashii S, Kikuchi M, Zhang S, Honda Y, Akaike A (2002)New insight into the functional role of acetylcholine in developingembryonic rat retinal neurons. Invest Ophthalmol Vis Sci 43:446–451. Medline
Zita MM, Marchionni I, Bottos E, Righi M, Del Sal G, Cherubini E,Zacchi P (2007) Post-phosphorylation prolyl isomerisation ofgephyrin represents a mechanism to modulate glycine receptorsfunction. EMBO J 26:1761–1771. CrossRef Medline
New Research 20 of 20
January/February 2017, 4(1) e0194-16.2017 eNeuro.org