active management and portfolio constraints
TRANSCRIPT
1
苅 2004, Security Analysts Association of Japan拡
Table of Contents
This article attempts to simulate and measure the impacts/effects on active management of various constraints, such as
limit on the number of issues held in a portfolio, restriction of short-sales, or upper/lower limits of holding weights. The
simulation results indicate that it is effective to hold many issues, as in enhanced index (EI) funds, in order to increase the
efficiency of portfolio/fund operations. Constraints on holding weights, such as the upper/lower limits of weights, have a
greater possibility to improve the efficiency of portfolio operations rather than lowering the information ratio, because they
alleviate the negative impact on performance of extreme estimated returns. Furthermore, in some cases, such as existing
active funds, the high efficiency of fund operations cannot be maintained when the number of holdings is limited, unless
greater risks are taken.
Active Management and Portfolio Constraints
Norihiro Sodeyama, Senior Quants Analyst Indexing and Quantitative Investment Department
The Sumitomo Trust & Banking Co., Ltd. (Chartered Member of the Security Analysts Association of Japan)
Manabu Yano, Senior Researcher
Pension Research Institute The Sumitomo Trust & Banking Co., Ltd.
(Chartered Member of the Security Analysts Association of Japan)
Feature Article-Portfolio Constraints and Information Ratio
1. Emerging Enhanced Index Funds 2. Effects of Constraints on Portfolio Construction 3. Analytical Framework 4. Results of Analysis 5. Conclusion and Issues for the Future
Norihiro Sodeyama: Graduated from Waseda University (Department of Education) in 1988, and joined The Sumitomo Trust &Banking Co., Ltd. in the same year; Gained considerable experience in Asset Management Business Department; in the currentposition since April 2001. Acquired on MA (Economics) from Tsukuba University in 1992. Main works: “Implied Theoretical Bond Future Price of Delivery Options” (Sumitomo Trust Bank Working Paper, No. 25, 1994,co-authored); “Market Sentiment and TAA” (Securities Analysts Journal, February 2002, co-authored).
Manabu Yano: Graduated from Kwansei Gakuin University (Department of Science) in 1991, and joined The Sumitomo Trust &Banking Co., Ltd. in the same year. Obtained considerable experience in Public Funds Investment Department and SecuritiesBusiness Planning Department as a quantitative analyst; in the current position since September 2000. Acquired an MA(Business Science Administration) and Ph.D. (Finance) from Tsukuba University. Main works: “Fund Operation Risk Management Based on Risk Budget” (Securities Analysts Journal, April 2001), “AssetManagement of Corporate Pensions” (Co-authored, Chuo Keizai-sha Inc., 2003).

2
苅 2004, Security Analysts Association of Japan拡
1. Emerging Enhanced Index Funds In reviewing “manager structure,” quantitative performance with respect to both past and expected future returns is highly
evaluated as well as qualitative considerations such as philosophy or investment style. In this context, the ratio between active
returns and active risk against a benchmark, namely the “Information Ratios” (IR), is used, and some managers have adopted
“Enhanced Index (EI) funds” which restrains active risks in order to maintain IR at a high level by investing in many issues.
It is said that IR indicates the fund operational ability of fund managers. If ability is irrelevant to active risk (TE: Tracking Error)
level and constant, greater tracking error means higher active returns. When TE increases, however, returns do not actually improve
in proportion to TE due to various constraints and effects caused by costs, resulting in lowering IR. Thus, managers tend to avoid
taking high risks in other to maintain IR. The purpose of this article is to verify the impact on IR by constraints associated with
portfolio construction.
We assume active equity operations set against particular benchmarks. In constructing a portfolio, stocks are selected and active
positions taken. Then decisions regarding investment weights for active stock issues are made. Of course, in some cases these
processes are pursued simultaneously.
EI Funds are generally said to be these which restrain active risks by maintaining investment weights almost unchanged from
those of their benchmark levels. In other words, this is a strategy where effective returns are pursued with risks restrained by
narrowing the range of bets and increasing the frequency of bets simultaneously.
Grinold and Kahn (1999) showed that the following relation exists between the number of invested issues and operational ability
(IR).
NICIR ×=
Here,IC (Information Coefficient) is the correlation between the (ex-post) realized active returns1 and the (ex ante) expected
active returns estimated in previous (alpha)2. The “N” independent expected alpha frequency per year, namely the number of all
issues. In short, IR increases in proportion to alpha accuracy and the square root of the number of stocks held. (Alpha here refers to
what extent the expectation/projection was achieved.)
Furthermore, Clarke, de Silva and Thorley (2002) showed that the following relation would exist if the covariance structure of
active returns were not considered.
NICTCIR ××=
Here, TC (Transfer Coefficient) is the correlation between each issue’s active weight and alpha. Generally, even though managers
can predict alpha with some accuracy, they cannot construct a portfolio based on such prediction. Due to fund operation constraints,
they may not be able to utilize their predictions to the full. As a result, their operational ability depends not only on the number of
issues held and alpha projection accuracy, but also their ability to construct portfolios, as shown in equation (1).
Here, we assume that the alpha (or structure of active risk) of each of the issues held for EI funds is identical to that of a known
active fund, which means they have the same IC. The IR difference between these funds is derived from N (number of issues held)
shown in equation (2) and TC (portfolio construction ability)3.
Under the condition of long-only constraints without any short-sales, ordinary active funds focus investment on a small number of
issues which carry big alphas. This lowers N as well as restrains taking issues with small (or negative) alphas for short positions. At
the same time, the relevant weight becomes negative against the benchmark regardless of alpha size by holding not many issues. 1 Hereafter “realized active return” is termed “active return” unless otherwise specified. 2 Hereafter “active return” is called “α” to clearly distinguish it from realized active return. 3 The question how many issues should be held depends on constraints on portfolio construction, research costs needed to increase α
accuracy, and transaction costs of actual trading. As analysis taking these factors into account would make discussion in this article extremely complex, we do not discuss the matter here. See Section 5.
(1)
(2)
3
苅 2004, Security Analysts Association of Japan拡
This lowers TC. In short, EI operations enlarge N by investing smaller amounts in many issues more broadly, while increasing IR by
preventing TC from dropping. Recently, another operational style, Long-Short (LS) funds has appeared, which increases TC by
reducing constraints on short-sales.
Grinold and Kahn (2000)’s simulation indicated that not a negligible impact is inflicted on performance due to inefficiency
deriving from holding weight constraints. Contrarily however, Frost and Savarino (1988) pointed out the possibility that the effect of
estimated errors (discrepancy) in risk structure is neutralized by non-negative constraints on portfolio construction or by the upper
limit of the number of individual issues held in a portfolio. Similarly, Jagannathan and Ma (2002) theoretically showed that
non-negative constraints or the upper limit weaken the variance-covariance structure of total returns, resulting in positive effects
which offset the estimated error of risk structure.
Based on these points, this article projects the effects of these constraints from the viewpoint of numerical analysis through
simulations. Here, we also consider the concept of returns estimated in previous and actual returns in order to measure actual
performance of portfolios constructed based on estimates/projections made in previous, which idea was not considered by Grinold
and Kahn. Furthermore, we also verified the case where these is an upper limit on the number of issues held in a portfolio by
covering not all the issues of the relevant benchmark as the investment universe. Also, simulations are made to measure the effects
of the points raised by Frost and Savarino (1988) and Jagannathan and Ma (2002). As a result, the effects of constraints limiting
issues held become extremely significant for operational efficiency. The possibility is shown that higher active risks can achieve
higher efficiencies when the number of issues held is limited. It is also shown that constraints on weights, such as upper/lower limits,
can improve operational efficiency.
This article is constructed as follows. First in the next section, effects of practical constraints are considered using a model. In
Section 3, we explain the simulation framework used to project the effects stemming from the constraints. Section 4 shows the
projection results. Finally, in Section 5, we give our conclusions as well as problems and possibilities not considered by the
simulation.
2. Effects of Constraints on Portfolio Construction 2.1 Effects of non-negative constraints
The number of issues held by ordinary domestic active funds is approximately 100, while the number of issues comprising
TOPIX (the benchmark) is as many as 1,5004. This means that ordinary active funds always underweight most issues according to
the benchmark weights. It seems that usually they do not have a very bearish view (which means a negative alpha) regarding all the
issues compared to the benchmark. On the other hand, even if they are not very bullish (positive alpha), the funds must hold issues
which have high benchmark weights and high carrying risks in order to restrain TE to some degree. Considering all this, it is
possible that the portfolio construction abilities (TC) of many existing active funds are fairly low, as pointed out by Clarke, de Silva
and Thorley (2002).
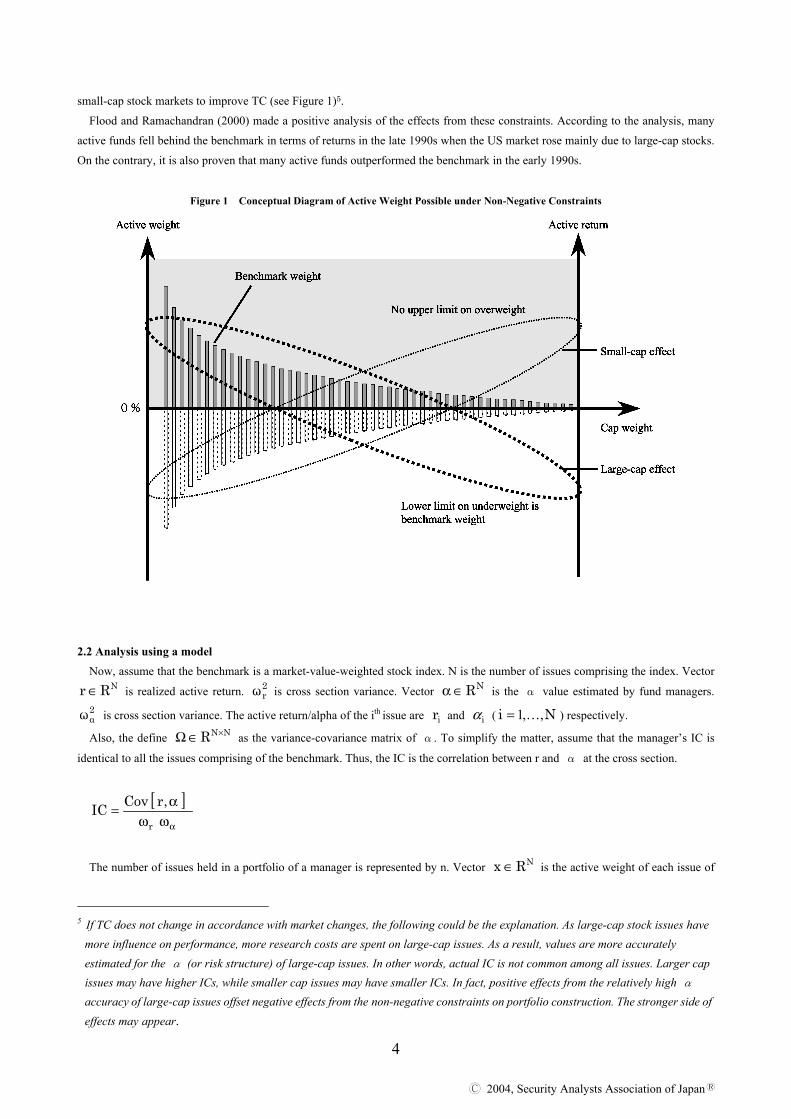
Furthermore, markets change dynamically. If one expects a market environment where returns on small-cap stocks tend to be
higher in a particular period (small-cap effect), one can underweight large-cap stocks and overweight small-cap stocks so that the
TC would be increased. In this case, even under non-negative constraints, large-cap stocks could be rather significantly
underweighted down to their benchmark weights, while no upper limit exists on the overweight range of small-cap stocks. It is
relatively easy to increase TC if the market impact is ignored. On the contrary, if one expects a market environment where returns
on large-cap stocks tend to be higher in a particular period (large-cap effect), one needs to overweight large-cap stocks and
underweight small-cap stocks to increase TC. Under non-negative constraints, however, small-cap stocks can be underweighted only
down to a very marginal benchmark weight. Thus, large-cap stocks cannot be much overweighted and it is not as easy as in
4 As of the time of writing this article.
4
苅 2004, Security Analysts Association of Japan拡
small-cap stock markets to improve TC (see Figure 1)5.
Flood and Ramachandran (2000) made a positive analysis of the effects from these constraints. According to the analysis, many
active funds fell behind the benchmark in terms of returns in the late 1990s when the US market rose mainly due to large-cap stocks.
On the contrary, it is also proven that many active funds outperformed the benchmark in the early 1990s.
Figure 1 Conceptual Diagram of Active Weight Possible under Non-Negative Constraints
2.2 Analysis using a model Now, assume that the benchmark is a market-value-weighted stock index. N is the number of issues comprising the index. Vector
NRr ∈ is realized active return. 2rω is cross section variance. Vector NR∈α is the α value estimated by fund managers.
2αω is cross section variance. The active return/alpha of the ith issue are ir and iα ( Ni ,,1K= ) respectively.
Also, the define NNR ×∈Ω as the variance-covariance matrix of α. To simplify the matter, assume that the manager’s IC is
identical to all the issues comprising of the benchmark. Thus, the IC is the correlation between r and α at the cross section.
[ ]αωωα=
r
,rCovIC
The number of issues held in a portfolio of a manager is represented by n. Vector NRx ∈ is the active weight of each issue of
5 If TC does not change in accordance with market changes, the following could be the explanation. As large-cap stock issues have
more influence on performance, more research costs are spent on large-cap issues. As a result, values are more accurately estimated for the α (or risk structure) of large-cap issues. In other words, actual IC is not common among all issues. Larger cap issues may have higher ICs, while smaller cap issues may have smaller ICs. In fact, positive effects from the relatively high α accuracy of large-cap issues offset negative effects from the non-negative constraints on portfolio construction. The stronger side of effects may appear.

5
苅 2004, Security Analysts Association of Japan拡
the portfolio. The ix is the active weight of the ith issue. 2xσ is cross-section variance. The manager’s TC is the correlation
between α and x at the cross section, shown as follows. Vector NRb ∈ is the benchmark weight of individual issues. Scholar
ib is the benchmark weight of ith issue.
[ ]x
x,CovTCσω
α=α
Now, a manager structures a portfolio minimizing active risks to achieve a target expected value “t” for the investment return
which outperforms the benchmark performance required to be achieved by investors. Practically, fund constraints are set to make the
sum of active weights zero (0) so as not to cause a shortage/excess of funds. Thus, the active weight of respective issues is x which
satisfies the constraints of the following variance minimization question.
Min. ,xx21 T Ω
s. t. ,txT =α
.0xeT =
(Here, T represents the transposed matrix. [ ] NT R11e ∈= K and t is the target return.)
More realistically, the existing active operation style selects one “nth ” issue for investment among all N issues comprising of the
benchmark. The following is the variance minimization question where a constraint requires the other issues not to be held6.
Min. ,xx21 T Ω
s. t ,txT =α
,0xeT =
( )[ ] ( )[ ] .b1hdiagx1hdiag −−−=−−
(Here, NRh ∈ is a vector of holdings that shows the issue held is 1 and that the issue not held is 0. diag [・] is the operator which
diagonalizes the vector.)
One can also use the following equation setting the constraint. This constraint requires portfolios to hold issues at the same weights
as benchmark weights. This is different from just “not investing in issues which are excluded from the investment universe.”
Min. ,xx21 T Ω
s. t. ,txT =α
,0xeT =
( )[ ] ( )[ ] .O1hdiagx1hdiag −−=−−
(Here, NRO∈ is the vector which shows all the elements are 0.)
Furthermore, it is more common to set the constraint on holding weights of respective individual issues for investment as follows, in
6 This is so-called “long/short strategy”.
(3)
(4)
(4’)
6
苅 2004, Security Analysts Association of Japan拡
addition to equations (4) and (4’)7.
Min. ,xx21 T Ω
s. t. ,txT =α
,0xeT =
( )[ ] ( )[ ] ,b1hdiagx1hdiag −−−=−−
[ ] [ ] .bhdiagxhdiagub −≥≥
(Here is the vector NRub ∈ which indicates the upper limit of active weight of respective issues.)
Or it would be more common to put the variance minimization question as follows8.9
Min. ,xx21 T Ω
s. t. ,txT =α
,0xeT =
( )[ ] ( )[ ] ,O1hdiagx1hdiag −−=−−
[ ] [ ] .bhdiagxhdiagub −≥≥
TC (portfolio construction ability), which is the correlation between α and active weight x, is significantly constrained by
setting these constraints in addition to equation (3). Next, we confirm these effects with the simulation.
3. Analytical Framework
This section projects the above-mentioned effects caused by the number of issues held or non-negative constraints, or upper/lower
limits of active weights on performance, simulating them as follows: ① First, generate realized actual returns based on a normal random number of N issues.
② Assume that prediction accuracy is IC for realized active returns. And, generate estimated α using the Cholesky
decomposition method. ③ Based on this estimated α, construct a portfolio. Set the following constraints in accordance with equation (4) or (5).
a)Limit on number of issues held
b)Non-negative constraint
c)Upper/lower limits of active weights
④ Measure the portfolio’s realized active return, active risks, and realized IR.
The above steps were repeated 1,000 times for every case of constraints and respective average figures were calculated for
realized active return, active risk, and realized IR. The number of issues comprising the benchmark is set at 500 for convenience. No consideration is made for costs related to α
estimation or portfolio construction.
7 This is ordinary “active strategy”. 8 This can be the same as enhanced indexing funds. 9 More practically, it is common to set constraints on sector weighting or factor exposures. To simplify discussion, these issues are
not considered here.
(5)
(5’)

7
苅 2004, Security Analysts Association of Japan拡
4. Results of Analysis
4.1 Effects from constraints of holding weights
To see the effects of “holding weights constraints” (non-negative constraint or upper/lower limits), compare results of equations
(4) and (5) for the n=500 case (total 500 issues consisting of the benchmark). Each equation minimizes its target function, using estimated αseries. Figure 2 shows de-facto performance before using the portfolio’s estimated α calculated by the equation. And
Figure 3 show the portfolio’s de-facto performance after using the realized active return series. For comparison, we also describe the
respective results when we set the upper/lower limits of active weights at 1%, 0.75%, and 0.5%10. First, we assess the effects of holding weight constraints on portfolio construction, using the α estimated in previous. Figure 2
shows the average value of estimated IR and TE, generated by optimizing each simulation for cases where there is no weight
constraint, and that there are upper/lower limits on active weights and that there is a non-negative constraint. According to this, if
there is no weight constraint at all, the higher the target active return “t” is, the higher TE is. This is a linear relation. Thus, estimated
IR is constantly the same, irrelevant to the target active return level. However, if there is an upper/lower limit or non-negative
constraint, one sees that higher target active return levels tend to lower IR. As assumed qualitatively to a certain degree, estimated
IR under a non-negative constraint lowers rather rapidly when TE increases. This is a significant constraint in terms of portfolio
construction. The upper/lower limit can be a constraint factor for portfolio construction as the possible range of active weights is
narrowed11. The effects, however, are not as significant as those of non-negative constraints.
Figure 2 Effects on IR by Weight Constraints (1) [500 issues, estimated active returns]
Note: Here, TE means active risks and realized IR shows α/TE.
10 In some cases, upper/lower limits are set at relative ratios against benchmark weights. However, here we assume constraints are
set at absolute levels of active weights. 11 In the simulations, the benchmark weights of respective stock issues are generated to make logarithms of the benchmark weights at
normal distribution using normal random numbers, so that benchmark weights will approximate actual weights. As a result, benchmark weights here are approximately 2% at maximum and approximately 0.01% at minimum.

8
苅 2004, Security Analysts Association of Japan拡
Figure 3 Effects on IR by Weight Constraints (2) [500 issues, realized active returns]
Note: Here, TE means active risks and realized IR shows α/TE.
Next, we confirm such de-facto performance. Figure 3 is the result measured on a realized-return basis. The realized de-facto
active return and TE where there is no weight constraint are the same as those before. The higher the target active return “t”
becomes, the higher TE becomes. This is a linear relation.This simulation chose 0.05 as the IC level, which shows how much of the
active return expected before the fact can be realized after the fact. Thus, although the level itself is very different from that of the
estimated IR, the realized IR becomes constant regardless of the target active return level. Suppose that the relation in equation (2)
exists here. Then, TC in this case would be projected as follows: 12
919.050005.0
027.1NIC
IRTC
=×
=
×=
On the other hand, the non-negative constraint, which is a very big restriction on estimated IR before the fact, also significantly
influences after the fact. The higher the target active return is set, the more conspicuous the effects become. In the case where “t” is
5.0%, realized active return becomes 1.426% and TE becomes 1.655%. If one uses equation (2), TC is calculated to be 0.800. This
means that portfolio construction ability is reduced by approximately as much as 13%, compared to the case where there is no
constraint. The realized active return level, however, outperforms that in the case of no constraints. TC lowered rather due to
increased active risk. This can be explained as follows. Non-negative constraints force investment to focus on issues which bring a positive α. This results in lowering risk diversification efficiency and estimated accuracy. In the case of high risk/high return, the
impact becomes more significant.
Furthermore, we obtained a very interesting result for the after the fact effect from the upper/lower limits, which were relatively
marginal constraints for portfolio construction in terms of estimated IR before the fact. The narrower the range of possible active
weights becomes or the higher the target active return level becomes, the higher realized IR becomes. If the upper/lower limit of
active weights is 0.5%, TC (t=5.0%) is calculated to be 0.937 in equation (2). This means that portfolio construction ability
improves by approximately 2% compared to the case of no constraints. These phenomena can be interpreted as follows. If no
12 Realized IR is measured using realized active returns carrying a correlation between the estimated α before the fact and IC.
The realized IR level itself is affected by cross-section varianceω2r, which is used for simulation. This is probably the reason why
TC becomes smaller than theoretical value, 1.

9
苅 2004, Security Analysts Association of Japan拡
upper/lower limit exists for issues carrying α estimated to have extremely large absolute values, extremely large active weights are
set for such issues through the optimization process. If this estimated high α (active return) is not achieved, performance is very
negatively influenced. However, if one set upper/lower limits, one can avoid these extreme weightings and alleviate the negative
effect on performance. This can improve portfolio operational efficiency. Thus, it is observed that these upper/lower limits have the
effects pointed out by Frost and Savarino (1988) and Jagannathan and Ma (2002), although they are minor. It is assumed that the positive effects these upper/lower limits have on performance depend on α accuracy (IC) and variance of
cross-section distribution of estimated active returns. A higher IC has smaller effects, while a lower IC has bigger ones. The broader
cross-section variance is, the stronger the effect becomes. The narrower the variance is, the weaker the effect, Figure 4 shows the
effects of different ICs and Figure 5 illustrates the results of the effects caused by different cross-section variances. The upper/lower
limits on weights are all set at 0.5%.
Figure 4 Effects on IR by Weight Constraints (3) [500 issues, realized active returns]
Note: Here, TE means active risks and realized IR shows r/TE. TC is
calculated by equation (2). The active weight of upper/lower limits
is set at 0.5%.
Figure 5 Effects on IR by Weight Constraints (4) [500 issues, realized active returns]
Note: Here, TE means active risks and realized IR shows r/TE. TC is
calculated by equation (2). The active weight of upper/lower limits
is set at 0.5%.

10
苅 2004, Security Analysts Association of Japan拡
First, we discuss the effects weight constraints have on portfolio construction for different ICs. Naturally, a higher IC heightens
the realized IR level after the fact. If IC is increased more and more from 0.01 through 0.05 to 0.10, the difference in realized IR
levels becomes wider and wider. It is evident, however, that TC tends to be higher when IC is lower. If ICs are 0.10 and 0.05
respectively, the IR becomes higher provided the target active return “t” (or TE) is set higher. If the IC is 0.01, TC increases until TE
reaches around 0.6%. However, if TE increases above this level, TC lowers. This can be explained as follows. As “t” increases, the
negative effects on portfolio construction caused by upper/lower limits become bigger than the positive effects from the estimated
errors in active returns. Next, we see how portfolio construction is influenced by weight constraints derived from different cross-section variance ω2
α
of estimated active returns. Effects caused by the ωα change depend on the target active return “t” level. It can be said that a
smaller ωα can alleviate negative effects on portfolio construction stemming from upper/lower limits on weights. On the other
hand, however, an extreme position needs to be taken in order to achieve the same level “t,” compared to the higher ωα case.
Influenced by this, portfolio construction ability (TC) weakens. These factors are the reasons why ωα starts to lower when TE
reaches around 1%, while ωα is 2.5% . On the contrary, it is assumed that when ωα is 10%, TC improvement remains at a
relatively low level, as the constraint from “t” is relatively moderate.
4.2 Effects from different number of issues held in portfolios Next, we discuss how active ability is influenced by the number of issues held. As is the case where there is no weight constraint
on issues included in portfolios, Figure 6 shows the relation between realized IR and active risks when “n” (number of issues in the
investment universe) is changed in equation (4). In addition, another case is illustrated to compare the effects made by non-held
issues. It transpires that issues not to be held, are held at benchmark weights, while other issues are actively held. This is the result of
equation (4’). Figure 7 shows similar results from equations (5) and (5’) where there are non-negative constraints and a 5% upper
limit.
Figure 6 Effects on IR by Constraints of Issues Held (1) [Realized active returns with no weight constraint]
Note: All_50, All_100, All_200, All_400, and All_500 are cases where the
shown number of issues are invested in by the portfolios. Act_50,
Act_100, Act_200, and Act_400 are cases where all issues are held
in portfolios which actively hold 50 issues, 100 issues, 200 issues,
and 400 issues, respectively, while the rest are held at the benchmark
weight. And, TE means active risk and realized IR shows r/TE.

11
苅 2004, Security Analysts Association of Japan拡
Figure 7 Effects on IR by the Constraint of Issues Held (2) [Realized active returns with weight constraint(non-negative and 5% upper
limit)]
Note: All_50, All_100, All_200, All_400, and All_500 are cases where the
shown number of issues are invested in by the portfolios. Act_50,
Act_100, Act_200, and Act_400 are cases where all issues are held
in portfolios which actively hold 50 issues, 100 issues, 200 issues,
and 400 issues, respectively, while the rest are held at the benchmark
weight. And, TE means active risk and realized IR shows r/TE.
Now, we discuss the different effects occasioned by the number of issues held where there is no weight constraint (Figure 6).
All_50, All_100, All_200, All_400, and All_500 in the following diagrams are cases of investing in the shown number of issues.
Act_50, Act_100, Act_200, and Act_400 are cases where all the issues are held, while 50, 100, 200, and 400 issues are held on an
active-operation basis, and other issues at benchmark weights. When the number of issues held in a portfolio is 500, realized IR is
constant, irrelevant to target active return “t” and TE. This is same as where there is no weight constraint as described in the former
section. Also, the realized IR level is constant, irrelevant to “t” and TE, although the realized IR level itself lowers where a certain
portion of the issues are held at the active weight and the rest at benchmark weights. Of course, the realized IR level becomes low.
This is because if a smaller number of issues are held actively, the constraint becomes more strict.
The tendency is quite different from where a portfolio does not include all the issues consisting of the benchmark. The result: the
higher “t” and TE become, the higher realized IR becomes. Here is the interpretation of the phenomenon. If the number of issues
held is limited, the issues not to be held are actively underweighted against benchmark weights. To set them so as not to be held
generates active returns and active risks. Such non-holding constraints account for most of the active factors when the increase in “t”
relatively weakens the strength of the effect. This turned out to show the seemingly strange result where the higher “t” and TE are,
the higher realized IR becomes. The realized IR level lowers because the smaller the number of issues held in a portfolio, the more
significant the effect of the non-holding constraints becomes. When looked at from the viewpoint of realized active return levels, the
smaller the number of issues held, the higher active returns tend to be. Thus, the effects on portfolio construction of “issues not to be
held” may work to lower active operational ability, as they cannot diversify active risks very well.
Now, we discuss the case of non-negative constraints and a 5% upper limit (Figure 7). If 500 issues are held in a portfolio, the
realized IR lowers if we set the target active return “t” higher. This is the same result as the analysis discussed in the previous
section. Furthermore, when a certain portion of the 500 issues is held at an active weight, realized IR lowers as “t” increases. This is
due to the impact of non-negative constraints and upper limits. However, when one compares All_200 and Act_200, All_200 has the
higher realized IR with lower risks. This is because in the All_200 case, one cannot decrease risk due to the issues not held, resulting
in high risks and decreased efficiency. In other words, if one holds “issues not decided actively” at the benchmark weight, one can
decrease risk and maintain a high IR. These results can explain why EI fund operations with low risks are adopted. As Act_50,
12
苅 2004, Security Analysts Association of Japan拡
Act_100, and Act_200 cannot realize the target portfolio at certain “t” levels, such portions are omitted in the diagram.
Next, if a portfolio does not hold all the issues comprising the benchmark, the higher “t” and TE become, the higher realized IR
becomes. This is the same as the case of no weight constraint. The same interpretation of the case of no weight constraint can be
applied to this case. If weight constraint is added to the non-holding constraint, the total constraint becomes bigger than just the
non-holding constraint. Thus, even if one increases “t,” realized IR improves less moderately than in the case of no weight constraint.
If the number of issues held becomes smaller, realizable portfolios which can satisfy the constraint become more limited. Thus, the
unrealizable portfolios of the All_50 and All_100 cases are not shown in the diagrams. Often in actual active operations, the number
of issues held is considerably limited and non-negative constraints and upper/lower limits are set for active weights. In these cases,
one can say that one might not be able to sufficiently increase operational efficiency unless one increases TE substantially.
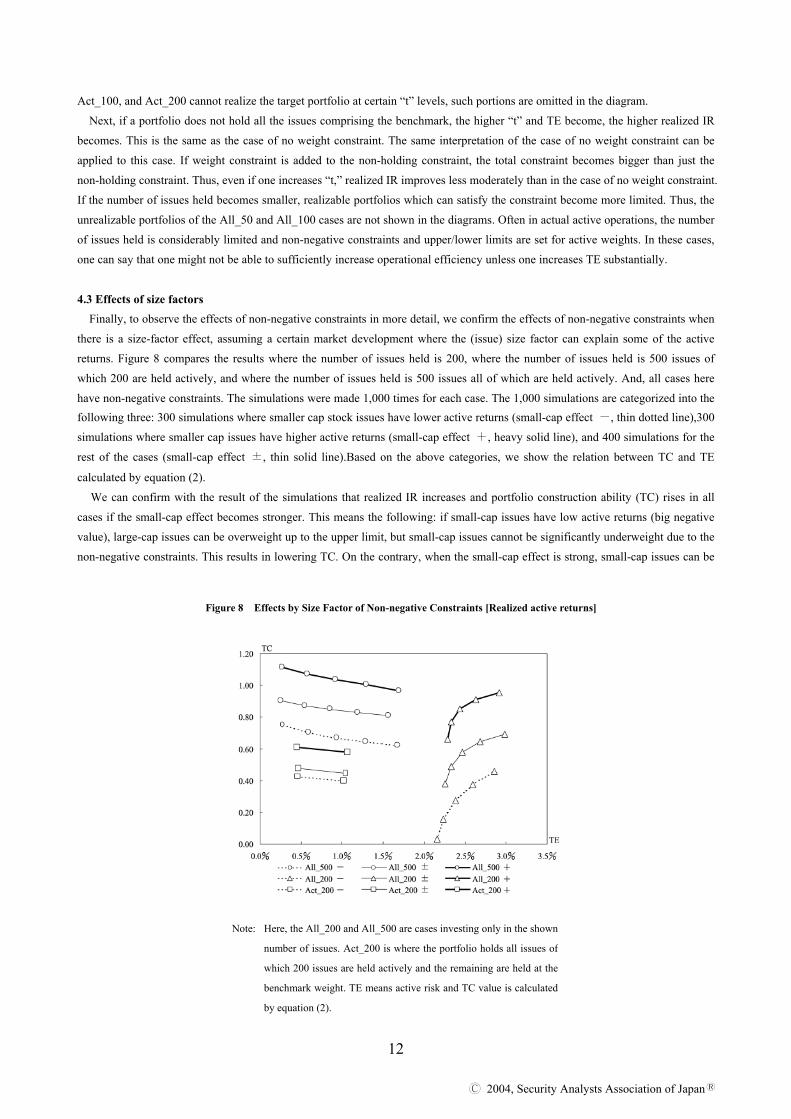
4.3 Effects of size factors Finally, to observe the effects of non-negative constraints in more detail, we confirm the effects of non-negative constraints when
there is a size-factor effect, assuming a certain market development where the (issue) size factor can explain some of the active
returns. Figure 8 compares the results where the number of issues held is 200, where the number of issues held is 500 issues of
which 200 are held actively, and where the number of issues held is 500 issues all of which are held actively. And, all cases here
have non-negative constraints. The simulations were made 1,000 times for each case. The 1,000 simulations are categorized into the following three: 300 simulations where smaller cap stock issues have lower active returns (small-cap effect -, thin dotted line),300
simulations where smaller cap issues have higher active returns (small-cap effect +, heavy solid line), and 400 simulations for the
rest of the cases (small-cap effect ±, thin solid line).Based on the above categories, we show the relation between TC and TE
calculated by equation (2).
We can confirm with the result of the simulations that realized IR increases and portfolio construction ability (TC) rises in all
cases if the small-cap effect becomes stronger. This means the following: if small-cap issues have low active returns (big negative
value), large-cap issues can be overweight up to the upper limit, but small-cap issues cannot be significantly underweight due to the
non-negative constraints. This results in lowering TC. On the contrary, when the small-cap effect is strong, small-cap issues can be
Figure 8 Effects by Size Factor of Non-negative Constraints [Realized active returns]
Note: Here, the All_200 and All_500 are cases investing only in the shown
number of issues. Act_200 is where the portfolio holds all issues of
which 200 issues are held actively and the remaining are held at the
benchmark weight. TE means active risk and TC value is calculated
by equation (2).
13
苅 2004, Security Analysts Association of Japan拡
overweight up to the upper limit and large-cap issues can be underweight maximally at the relatively large benchmark weight. Thus,
TC will not fall much. Thus, non-negative constraints have asymmetric effects, depending on the market situation where large-cap
issues or small-cap issues rise.
5. Conclusion and Issues for the Future
In this article, we attempted to measure the effects of various constraints on portfolio construction in terms of IR, the operational
ability of active operations. A similar study was made by Grinold and Kahn (2000). In this article, however, we obtained the
following new insights, considering not only non-negative constraints, but also weight constraints, such as upper/lower limits, and
the correlation between returns before/after the fact related in terms of IC and “issues not to be held” in portfolios among issues
comprising the benchmark.
First, non-negative constraints potentially and significantly lower portfolio construction ability (TC). On the other hand, it was
confirmed that upper/lower limits lowers efficiency on the frontier before they are used for portfolio construction but efficiency
improves marginally on the frontier after they are used for portfolio construction. If there is no upper/lower limit, as active returns
are estimated to have extremely large absolute values, sometimes extremely large active weights are placed through the optimization
process. As their realized returns are not necessarily large values, performance is negatively influenced. On the other hand, as Frost
and Savarino (1988) and Jagannathan and Ma (2002) pointed out, these extreme weightings can be avoided by setting upper/lower
limits. It is possible that such alleviates the effects on performance and improves operational efficiency. It was also confirmed that such effects depend on α accuracy (IC) and that the smaller IC becomes, the more conspicuous the effect of improving operational
efficiency by upper/lower limits becomes. It was assumed that if the variance of cross-section distribution of active returns is bigger,
the effect must be stronger. The simulation results, however, show that they largely depend on the target active return levels of
portfolios. In the case of small variance, upper/lower limits affect portfolio construction less negatively. One has to, however, take
extreme positions to achieve the same target return “t,” compared to large variance cases. It seems that these effects reduce portfolio
construction ability (TC).
Next, where a portfolio does not hold all issues comprising the benchmark, one realizes higher IR if target active returns and
active risks are set higher. This can be explained as follows. The constraint restricting the holding of certain issues becomes a big
constraining factor when the target active return is low. However, as the target active return becomes higher, the effects weaken.
Furthermore, the smaller the number of issues held becomes, the stronger the effects of non-holding constraints become. The level
of realized IR lowers. On the other hand, the realized active return level tends to become higher. Thus, when there are “issues not to
be held,” the effects on portfolio construction can reduce active operational ability due to the insufficient distribution of active risks.
On the contrary, this means that risks can be reduced and lower efficiency avoided by holding issues other than actively-held ones at
the benchmark weight. This provides the ground for EI operations.
We also analyzed the effects of non-negative constraints where size factors exist. The simulation results confirmed the following.
The stronger small-cap effects, the greater portfolio construction ability (TC). And, operational efficiency tends to increase. This
can be also explained as follows. In the large-cap stock market, large-cap issues can be overweight up to the upper limit, but
small-cap issues cannot be much underweighted due to non-negative constraints. This lowers TC. On the contrary, in a stock market
where small-cap effects are strong, small-cap issues can be overweight up to the upper limit and large-cap issues underweight
maximally at the big benchmark weight. Thus, TC has little room to fall. Therefore, non-negative constraints can have asymmetrical
effects, depending on market developments, such as on markets for large-cap stocks and small-cap stocks.
The above results are the conclusion derived from the simulation set within the assumed cases. Here, we should point out the
possibility that another conclusion could be deduced from assuming various other factors not considered in this article. First, in this
analysis, costs are not considered at all. Specific fund sizes are not assumed, either. In particular, if funds are huge, enormous costs
may be incurred. In this case, the effects at the size factor would be different. In other words, it is assumed that TC in the small-cap stock market may not outperform TC in the large-cap stock market. Furthermore, given the research costs needed to generate α, it
can be a non-efficient task to estimate α of thinly-traded small-cap issues with enormous market impact at the same accuracy as
that of other issues. In terms of the effects of the constraint on number of issues held, when the number of issues held is increased,
the cost associated with rebalancing the fund cannot be ignored. To avoid unnecessary complexity in this article, our analysis did not

14
苅 2004, Security Analysts Association of Japan拡
consider these effects and they remain to be addressed in the future. Finally, the simulation in this article indicated several useful possibilities. However, our discussions were for cases using
estimated values, such as α and risk which had already been used in existing operations. Most important for portfolio operations is to improve operational efficiency by increasing the number of issues to be researched and improving α accuracy, not to mention
making efforts to improve operational efficiency.
Acknowledgment and Disclaimer:
The authors would like to thank Yukihiro Asano (Yokohama National University) for his many useful comments. It should be noted that the opinions contained herein are solely those of the authors and do not necessarily reflect those of The Sumitomo Trust & Banking Co., Ltd.
List of References ・ Clarke, R., H. de Silva and S. Thorley (2002), “Portfolio Constraints and the Fundamental Law of Active Management,”
Financial Analysts Journal, September / October. ・ Flood, E. and N. Ramachandran (2000), “Integrating Active and Passive Management,” Journal of Portfolio Management, Fall. ・ Frost, P. A. and J. E. Savarino (1988), “For Better Performance: Constrain portfolio weights,” Journal of Portfolio Management,
Fall. ・ Grinold, C. G. and R. N. Kahn (2000), “The Efficiency Gains of Long-Short Investing,” Financial Analysts Journal, November /
December. ・ Jagannathan, R. and T. Ma (2002), “Risk Reduction in Large Portfolios: A Role for Portfolio Weight Constraints,” Unpublished
Working Paper. ・ Kahn, R. N. (2000), “Most Pension Plans Need More Enhanced Indexing,” Enhanced Indexing, Fall. ・ R. C. Grinold, R. N. Kahn (1999), Active Portfolio Management, Toyo Keizai Inc.