active retroreflector to measure the rotational...
TRANSCRIPT
Updated 1 March 2012
Active retroreflector to measure the rotational orientation in conjunction with a laser tracker
O. Hofherr*a, C. Wachtenb, C. Müllera, H. Reineckea
aUniversity of Freiburg – IMTEK, Department of Mirosystems Engineering, Laboratory for Process Technology, Georges-Köhler-Allee 103, 79110 Freiburg, Germany;
bPI miCos GmbH, Freiburger Strasse 30, 79427 Germany
ABSTRACT
High precision optical non-contact position measurement is a key technology in modern engineering. Laser trackers (LT) can determine accurately x-y-z coordinates of passive retroreflectors. Next-generation systems answer the additional need to measure an object’s rotational orientation (pitch, yaw, roll). These devices are based on photogrammetry or on enhanced retroreflectors. However, photogrammetry relies on camera systems and time-consuming image processing. Enhanced retroreflectors analyze the LT’s beam but are restricted in roll angle measurements. Here we present an inte-grated laser based method to evaluate all six degrees of freedom. An active retroreflector directly analyzes its orientation to the LT’s beam path by outcoupling laser light on detectors. A proof of concept prototype has been designed with a specified measuring range of 360° for roll angle measurements and ±15° for pitch and yaw angle respectively. The proto-type’s optical design is inspired by a cat’s eye retroreflector. First results are promising and further improvements are under development. We anticipate our method to facilitate simple and cost-effective six degrees of freedom measure-ments. Furthermore, for industrial applications wide customizations are possible, e.g. adaptation of measuring range, optimization of accuracy, and further system miniaturization.
Keywords: Laser tracker, retroreflector, orientation sensor, six degrees of freedom, coordinate measurements
1. INTRODUCTION
Laser trackers determine the 3D coordinate of a target by measuring the respective distance and two angles. The most commonly used targets are passive retroreflectors. They reflect the laser beam back to the LT’s distance meter and a sen-sor to maintain the tracking function. The LT’s angles (azimuth and elevation) are given by two integrated angular en-coders. State of the art laser-based distance measurement methods use an absolute distance meter (ADM) together with a heterodyne helium-neon laser interferometer as an integrated reference with higher accuracy and resolution. The first LT with an ADM was introduced in 1995. The ADM made it possible to re-establishing a broken laser beam with high accu-racy to continue immediately the measurement. This feature lead LTs among the most versatile coordinate measuring machines. Next-generation systems answer the need to measure an object’s rotational orientation. These devices are based on photogrammetry or on modified triple prisms with integrated sensors. Our goal, however, was to develop an active retroreflector that is capable to analyze in situ the incident and reflected laser beam of a LT. Thereby, the active retroreflector can calculate its rotational orientation relative to an incident laser beam.
2. METHODOLOGY
2.1 Retroreflector with in situ analysis (RISA)
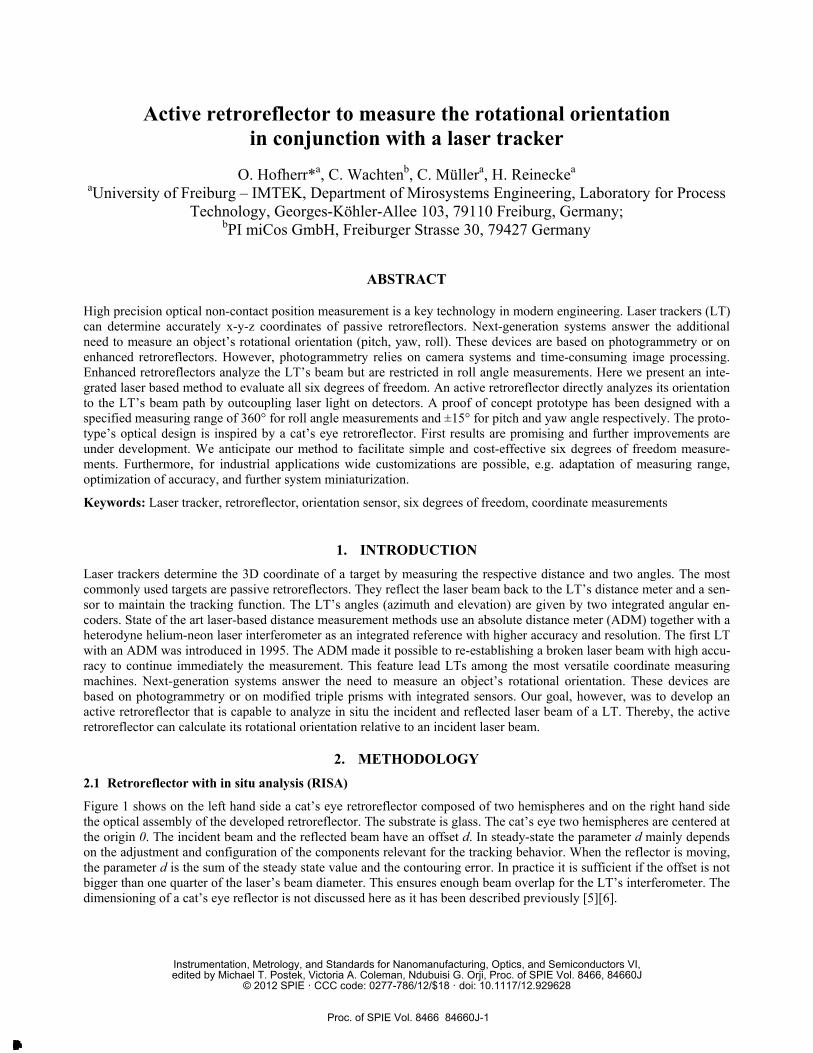
Figure 1 shows on the left hand side a cat’s eye retroreflector composed of two hemispheres and on the right hand side the optical assembly of the developed retroreflector. The substrate is glass. The cat’s eye two hemispheres are centered at the origin 0. The incident beam and the reflected beam have an offset d. In steady-state the parameter d mainly depends on the adjustment and configuration of the components relevant for the tracking behavior. When the reflector is moving, the parameter d is the sum of the steady state value and the contouring error. In practice it is sufficient if the offset is not bigger than one quarter of the laser’s beam diameter. This ensures enough beam overlap for the LT’s interferometer. The dimensioning of a cat’s eye reflector is not discussed here as it has been described previously [5][6].
Instrumentation, Metrology, and Standards for Nanomanufacturing, Optics, and Semiconductors VI,edited by Michael T. Postek, Victoria A. Coleman, Ndubuisi G. Orji, Proc. of SPIE Vol. 8466, 84660J
© 2012 SPIE · CCC code: 0277-786/12/$18 · doi: 10.1117/12.929628
Proc. of SPIE Vol. 8466 84660J-1
Downloaded From: http://proceedings.spiedigitallibrary.org/ on 09/24/2013 Terms of Use: http://spiedl.org/terms
Updated 1 March 2012
The measuring signal for the active retroreflector is the LT’s laser beam itself. The laser beam is partially reflected two times by an integrated beam splitter. This creates two laser beams for further analysis. The first beam represents the fo-cusing incident beam; the second the diverging reflected beam. From the path the two laser beams take through the retroreflector the rotational orientation of the device can be inferred.
Figure 1. Left: Cat’s eye reflector composed of two hemispheres; Right: RISA’s modified optical setup. Both pictures show the relation to a cat’s eye reflector.
2.2 Functional principle
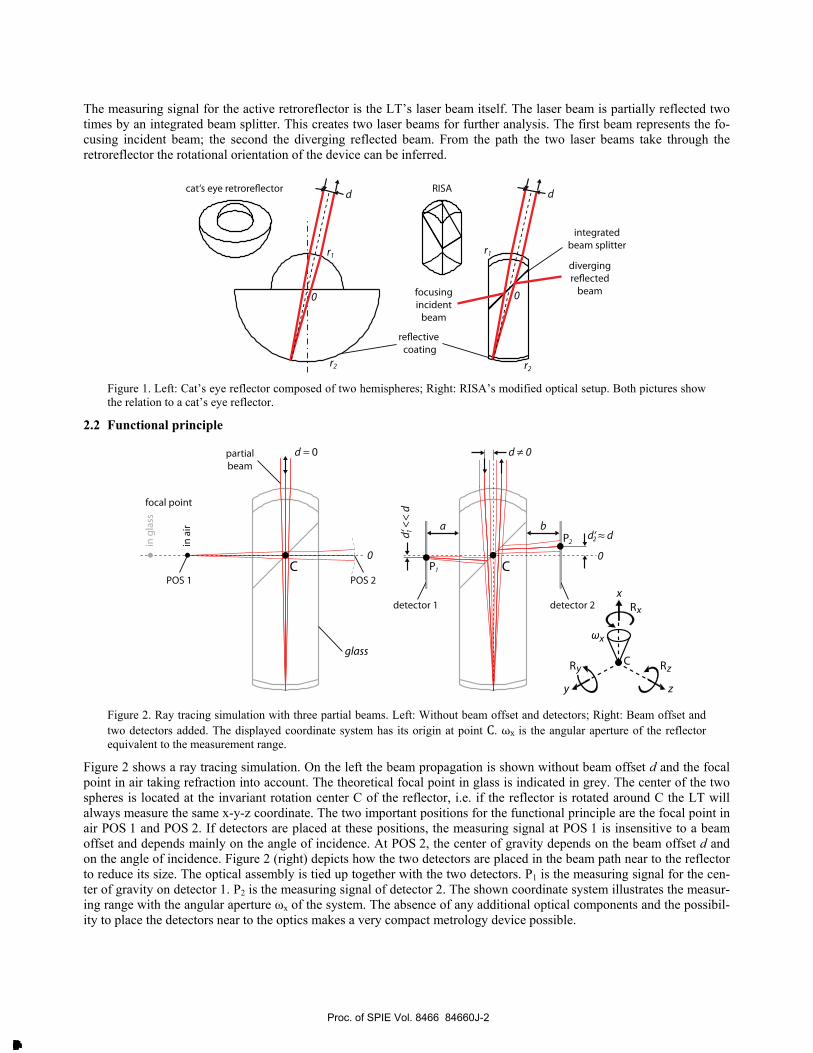
Figure 2. Ray tracing simulation with three partial beams. Left: Without beam offset and detectors; Right: Beam offset and two detectors added. The displayed coordinate system has its origin at point C. ωx is the angular aperture of the reflector equivalent to the measurement range.
Figure 2 shows a ray tracing simulation. On the left the beam propagation is shown without beam offset d and the focal point in air taking refraction into account. The theoretical focal point in glass is indicated in grey. The center of the two spheres is located at the invariant rotation center C of the reflector, i.e. if the reflector is rotated around C the LT will always measure the same x-y-z coordinate. The two important positions for the functional principle are the focal point in air POS 1 and POS 2. If detectors are placed at these positions, the measuring signal at POS 1 is insensitive to a beam offset and depends mainly on the angle of incidence. At POS 2, the center of gravity depends on the beam offset d and on the angle of incidence. Figure 2 (right) depicts how the two detectors are placed in the beam path near to the reflector to reduce its size. The optical assembly is tied up together with the two detectors. P1 is the measuring signal for the cen-ter of gravity on detector 1. P2 is the measuring signal of detector 2. The shown coordinate system illustrates the measur-ing range with the angular aperture ωx of the system. The absence of any additional optical components and the possibil-ity to place the detectors near to the optics makes a very compact metrology device possible.
Proc. of SPIE Vol. 8466 84660J-2
Downloaded From: http://proceedings.spiedigitallibrary.org/ on 09/24/2013 Terms of Use: http://spiedl.org/terms
Updated 1 March 2012
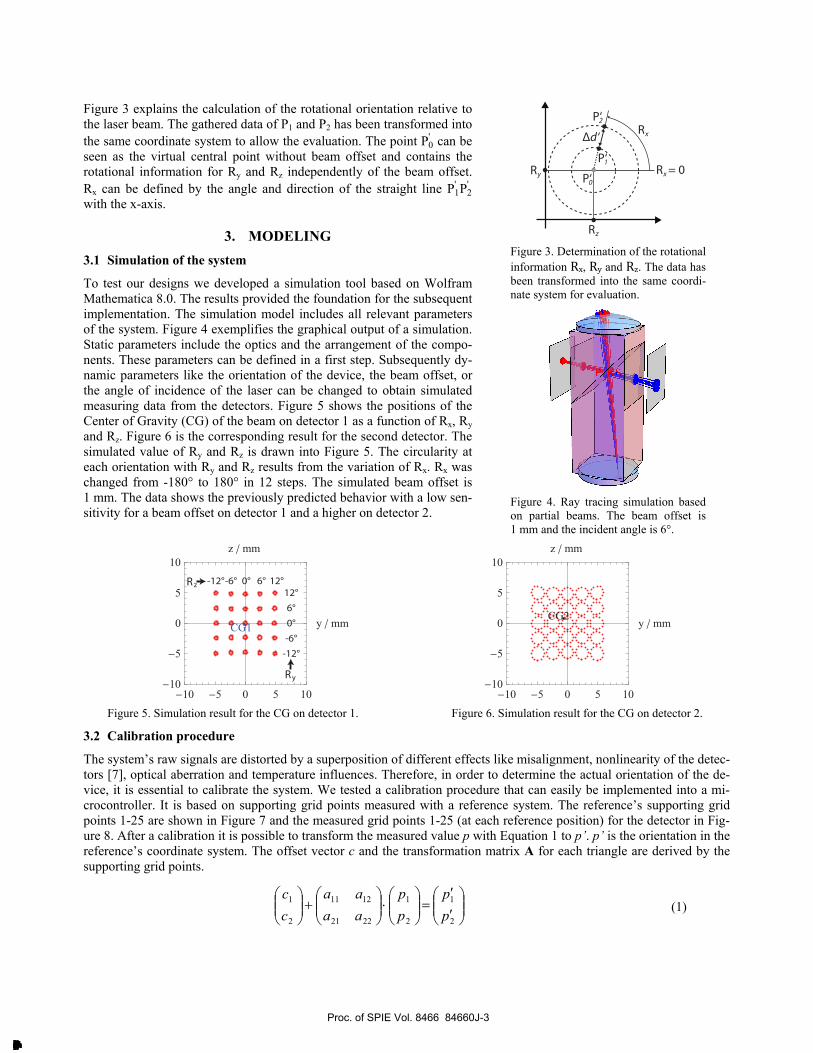
Figure 3 explains the calculation of the rotational orientation relative to the laser beam. The gathered data of P1 and P2 has been transformed into the same coordinate system to allow the evaluation. The point P0
' can be seen as the virtual central point without beam offset and contains the rotational information for Ry and Rz independently of the beam offset. Rx can be defined by the angle and direction of the straight line P1
' P2'
with the x-axis.
3. MODELING
3.1 Simulation of the system
To test our designs we developed a simulation tool based on Wolfram Mathematica 8.0. The results provided the foundation for the subsequent implementation. The simulation model includes all relevant parameters of the system. Figure 4 exemplifies the graphical output of a simulation. Static parameters include the optics and the arrangement of the compo-nents. These parameters can be defined in a first step. Subsequently dy-namic parameters like the orientation of the device, the beam offset, or the angle of incidence of the laser can be changed to obtain simulated measuring data from the detectors. Figure 5 shows the positions of the Center of Gravity (CG) of the beam on detector 1 as a function of Rx, Ry and Rz. Figure 6 is the corresponding result for the second detector. The simulated value of Ry and Rz is drawn into Figure 5. The circularity at each orientation with Ry and Rz results from the variation of Rx. Rx was changed from -180° to 180° in 12 steps. The simulated beam offset is 1 mm. The data shows the previously predicted behavior with a low sen-sitivity for a beam offset on detector 1 and a higher on detector 2.
Figure 3. Determination of the rotational information Rx, Ry and Rz. The data has been transformed into the same coordi-nate system for evaluation.
Figure 4. Ray tracing simulation based on partial beams. The beam offset is 1 mm and the incident angle is 6°.
Figure 5. Simulation result for the CG on detector 1.
Figure 6. Simulation result for the CG on detector 2.
3.2 Calibration procedure
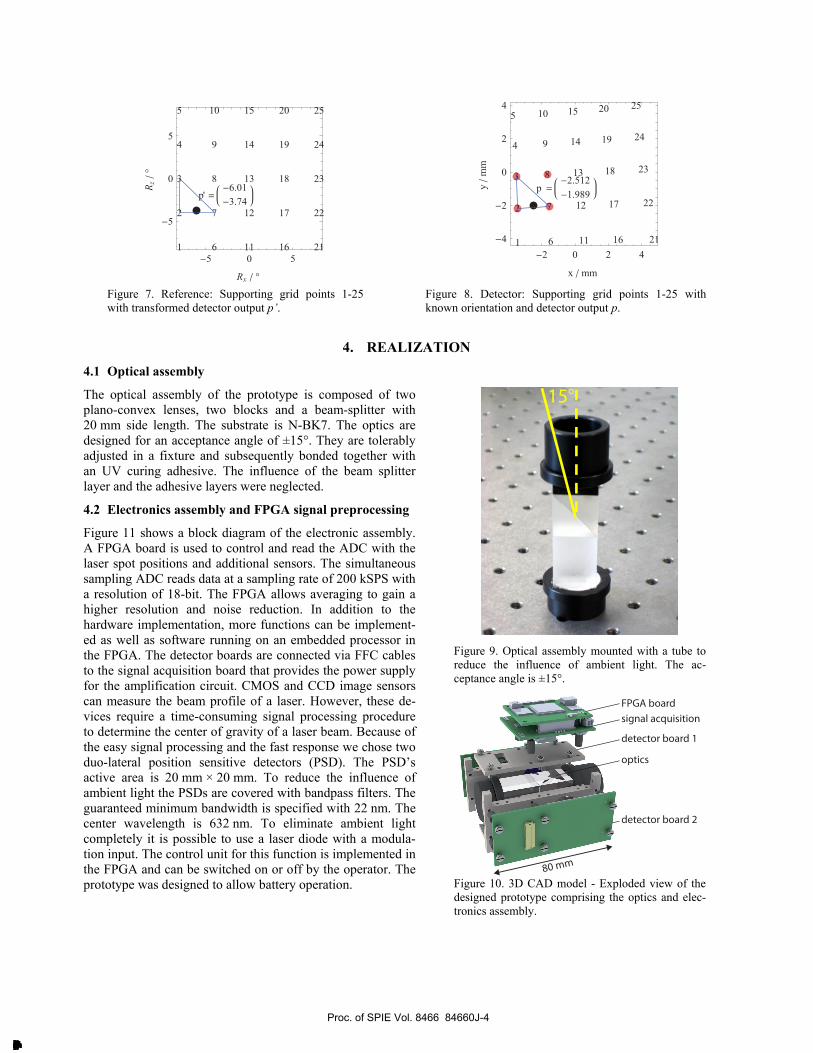
The system’s raw signals are distorted by a superposition of different effects like misalignment, nonlinearity of the detec-tors [7], optical aberration and temperature influences. Therefore, in order to determine the actual orientation of the de-vice, it is essential to calibrate the system. We tested a calibration procedure that can easily be implemented into a mi-crocontroller. It is based on supporting grid points measured with a reference system. The reference’s supporting grid points 1-25 are shown in Figure 7 and the measured grid points 1-25 (at each reference position) for the detector in Fig-ure 8. After a calibration it is possible to transform the measured value p with Equation 1 to p’. p’ is the orientation in the reference’s coordinate system. The offset vector c and the transformation matrix A for each triangle are derived by the supporting grid points.
2
1
2
1
2221
1211
2
1
p
p
p
p
aa
aa
c
c (1)
Proc. of SPIE Vol. 8466 84660J-3
Downloaded From: http://proceedings.spiedigitallibrary.org/ on 09/24/2013 Terms of Use: http://spiedl.org/terms
Updated 1 March 2012
Figure 7. Reference: Supporting grid points 1-25 with transformed detector output p’.
Figure 8. Detector: Supporting grid points 1-25 with known orientation and detector output p.
4. REALIZATION
4.1 Optical assembly
The optical assembly of the prototype is composed of two plano-convex lenses, two blocks and a beam-splitter with 20 mm side length. The substrate is N-BK7. The optics are designed for an acceptance angle of ±15°. They are tolerably adjusted in a fixture and subsequently bonded together with an UV curing adhesive. The influence of the beam splitter layer and the adhesive layers were neglected.
4.2 Electronics assembly and FPGA signal preprocessing
Figure 11 shows a block diagram of the electronic assembly. A FPGA board is used to control and read the ADC with the laser spot positions and additional sensors. The simultaneous sampling ADC reads data at a sampling rate of 200 kSPS with a resolution of 18-bit. The FPGA allows averaging to gain a higher resolution and noise reduction. In addition to the hardware implementation, more functions can be implement-ed as well as software running on an embedded processor in the FPGA. The detector boards are connected via FFC cables to the signal acquisition board that provides the power supply for the amplification circuit. CMOS and CCD image sensors can measure the beam profile of a laser. However, these de-vices require a time-consuming signal processing procedure to determine the center of gravity of a laser beam. Because of the easy signal processing and the fast response we chose two duo-lateral position sensitive detectors (PSD). The PSD’s active area is 20 mm × 20 mm. To reduce the influence of ambient light the PSDs are covered with bandpass filters. The guaranteed minimum bandwidth is specified with 22 nm. The center wavelength is 632 nm. To eliminate ambient light completely it is possible to use a laser diode with a modula-tion input. The control unit for this function is implemented in the FPGA and can be switched on or off by the operator. The prototype was designed to allow battery operation.
Figure 9. Optical assembly mounted with a tube to reduce the influence of ambient light. The ac-ceptance angle is ±15°.
Figure 10. 3D CAD model - Exploded view of the designed prototype comprising the optics and elec-tronics assembly.
15°
Proc. of SPIE Vol. 8466 84660J-4
Downloaded From: http://proceedings.spiedigitallibrary.org/ on 09/24/2013 Terms of Use: http://spiedl.org/terms
Updated 1 March 2012
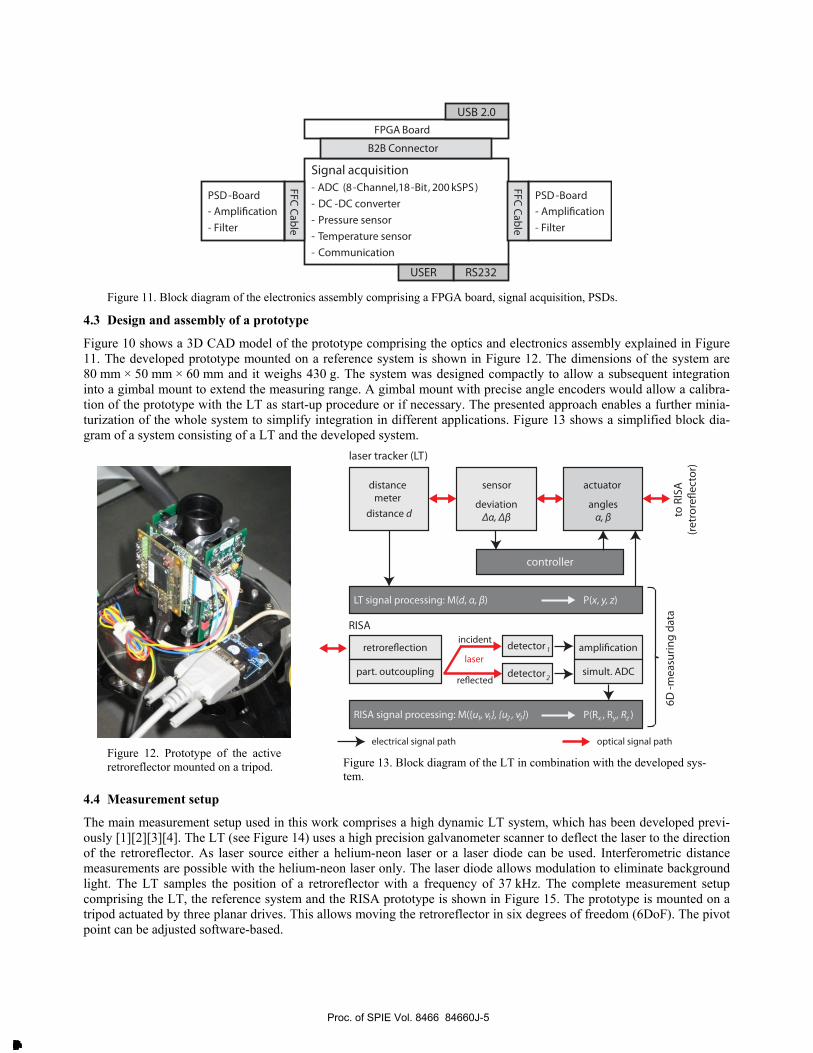
Figure 11. Block diagram of the electronics assembly comprising a FPGA board, signal acquisition, PSDs.
4.3 Design and assembly of a prototype
Figure 10 shows a 3D CAD model of the prototype comprising the optics and electronics assembly explained in Figure 11. The developed prototype mounted on a reference system is shown in Figure 12. The dimensions of the system are 80 mm × 50 mm × 60 mm and it weighs 430 g. The system was designed compactly to allow a subsequent integration into a gimbal mount to extend the measuring range. A gimbal mount with precise angle encoders would allow a calibra-tion of the prototype with the LT as start-up procedure or if necessary. The presented approach enables a further minia-turization of the whole system to simplify integration in different applications. Figure 13 shows a simplified block dia-gram of a system consisting of a LT and the developed system.
Figure 12. Prototype of the active retroreflector mounted on a tripod.
Figure 13. Block diagram of the LT in combination with the developed sys-tem.
4.4 Measurement setup
The main measurement setup used in this work comprises a high dynamic LT system, which has been developed previ-ously [1][2][3][4]. The LT (see Figure 14) uses a high precision galvanometer scanner to deflect the laser to the direction of the retroreflector. As laser source either a helium-neon laser or a laser diode can be used. Interferometric distance measurements are possible with the helium-neon laser only. The laser diode allows modulation to eliminate background light. The LT samples the position of a retroreflector with a frequency of 37 kHz. The complete measurement setup comprising the LT, the reference system and the RISA prototype is shown in Figure 15. The prototype is mounted on a tripod actuated by three planar drives. This allows moving the retroreflector in six degrees of freedom (6DoF). The pivot point can be adjusted software-based.
Proc. of SPIE Vol. 8466 84660J-5
Downloaded From: http://proceedings.spiedigitallibrary.org/ on 09/24/2013 Terms of Use: http://spiedl.org/terms
aS
Updated 1 March 2012
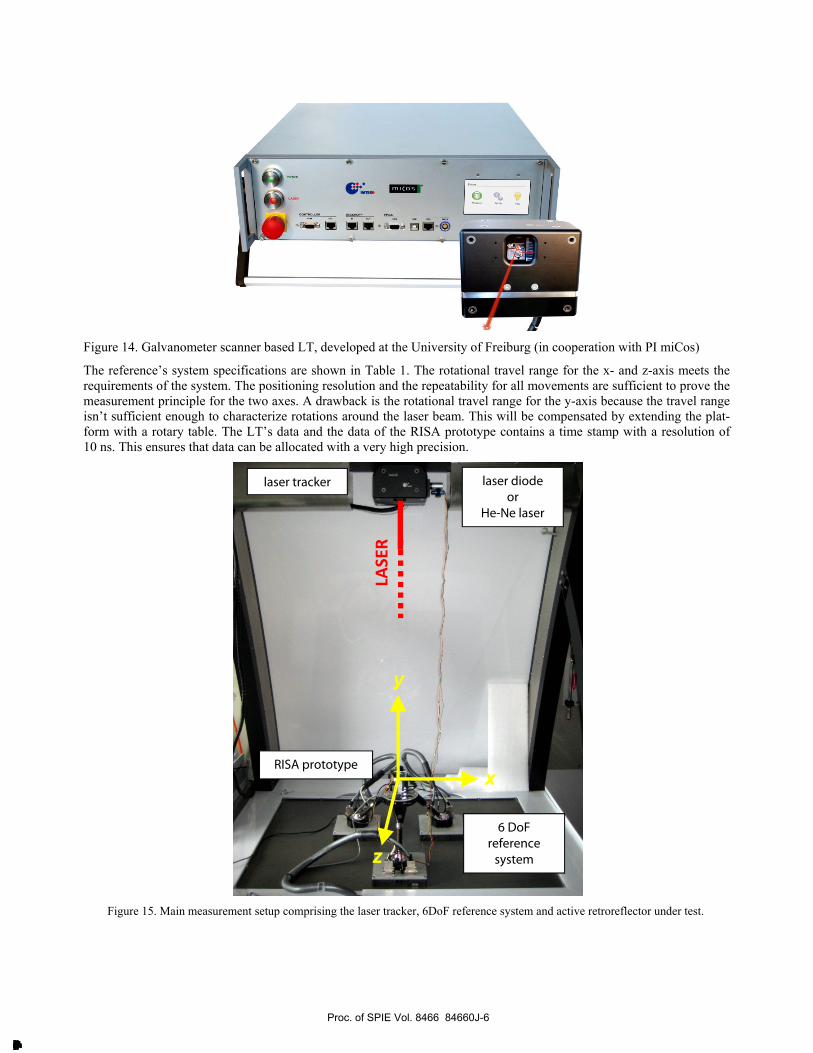
Figure 14. Galvanometer scanner based LT, developed at the University of Freiburg (in cooperation with PI miCos)
The reference’s system specifications are shown in Table 1. The rotational travel range for the x- and z-axis meets the requirements of the system. The positioning resolution and the repeatability for all movements are sufficient to prove the measurement principle for the two axes. A drawback is the rotational travel range for the y-axis because the travel range isn’t sufficient enough to characterize rotations around the laser beam. This will be compensated by extending the plat-form with a rotary table. The LT’s data and the data of the RISA prototype contains a time stamp with a resolution of 10 ns. This ensures that data can be allocated with a very high precision.
Figure 15. Main measurement setup comprising the laser tracker, 6DoF reference system and active retroreflector under test.
laser tracker laser diodeor
He-Ne laser
6 DoFreference
system
RISA prototypex
y
z
LASER
Proc. of SPIE Vol. 8466 84660J-6
Downloaded From: http://proceedings.spiedigitallibrary.org/ on 09/24/2013 Terms of Use: http://spiedl.org/terms
Ss,
Updated 1 March 2012
Table 1. System specifications of the 6 DOF planar drive based reference system (* best case).
Travel range (max.)
Rx, Ry, Rz ±15°, ±85°, ±15°
x - 285 mm - 285 mm
y -0.4 mm - 40 mm
z -72 mm - 172 mm
Resolution* x, y, z < 1 µm
Rx, Ry, Rz < 0.001°
Repeatability* x, y, z ≈ 4 µm
Rx, Ry, Rz ≈ 0.004°
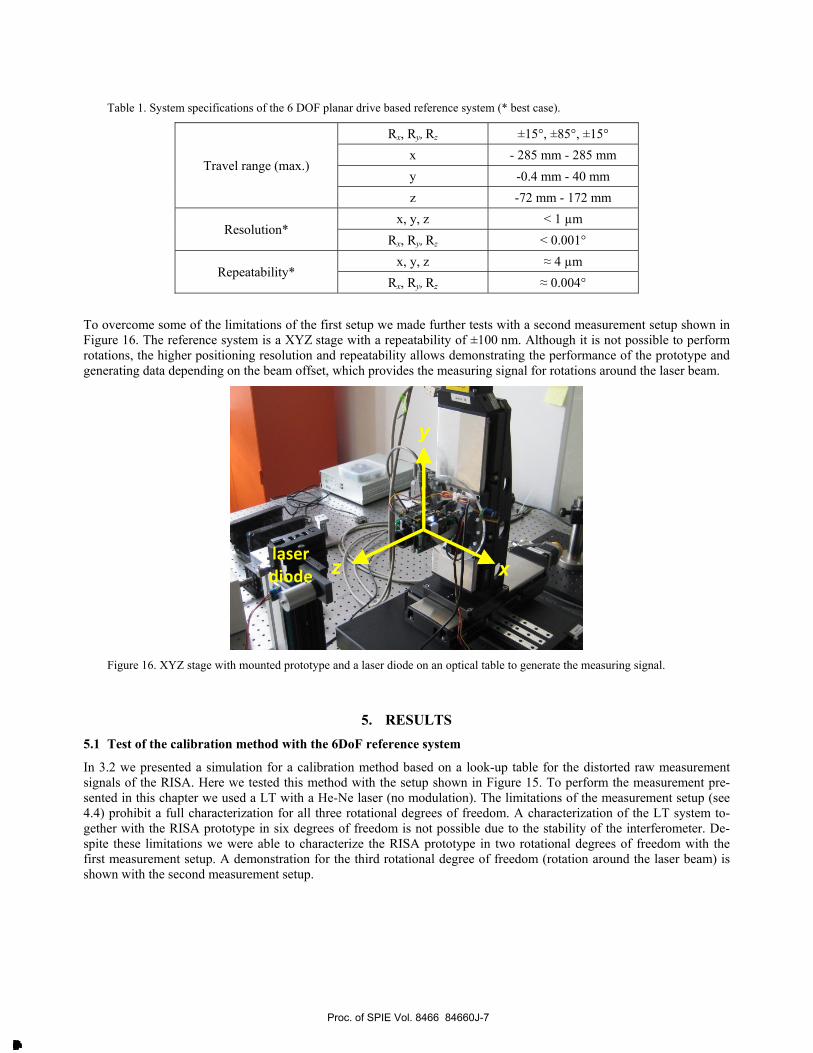
To overcome some of the limitations of the first setup we made further tests with a second measurement setup shown in Figure 16. The reference system is a XYZ stage with a repeatability of ±100 nm. Although it is not possible to perform rotations, the higher positioning resolution and repeatability allows demonstrating the performance of the prototype and generating data depending on the beam offset, which provides the measuring signal for rotations around the laser beam.
Figure 16. XYZ stage with mounted prototype and a laser diode on an optical table to generate the measuring signal.
5. RESULTS
5.1 Test of the calibration method with the 6DoF reference system
In 3.2 we presented a simulation for a calibration method based on a look-up table for the distorted raw measurement signals of the RISA. Here we tested this method with the setup shown in Figure 15. To perform the measurement pre-sented in this chapter we used a LT with a He-Ne laser (no modulation). The limitations of the measurement setup (see 4.4) prohibit a full characterization for all three rotational degrees of freedom. A characterization of the LT system to-gether with the RISA prototype in six degrees of freedom is not possible due to the stability of the interferometer. De-spite these limitations we were able to characterize the RISA prototype in two rotational degrees of freedom with the first measurement setup. A demonstration for the third rotational degree of freedom (rotation around the laser beam) is shown with the second measurement setup.
x
y
z laser diode
Proc. of SPIE Vol. 8466 84660J-7
Downloaded From: http://proceedings.spiedigitallibrary.org/ on 09/24/2013 Terms of Use: http://spiedl.org/terms
Updated 1 March 2012
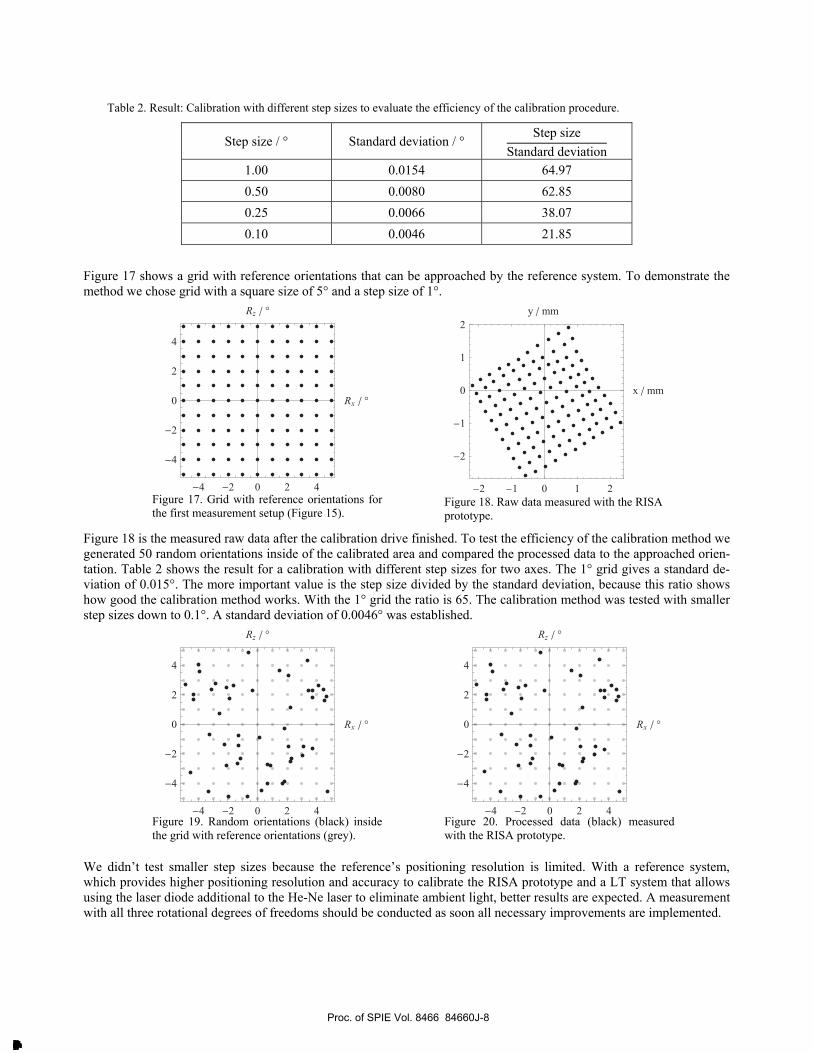
Table 2. Result: Calibration with different step sizes to evaluate the efficiency of the calibration procedure.
Step size / ° Standard deviation / ° Step size
Standard deviation
1.00 0.0154 64.97
0.50 0.0080 62.85
0.25 0.0066 38.07
0.10 0.0046 21.85
Figure 17 shows a grid with reference orientations that can be approached by the reference system. To demonstrate the method we chose grid with a square size of 5° and a step size of 1°.
Figure 17. Grid with reference orientations for the first measurement setup (Figure 15).
Figure 18. Raw data measured with the RISA prototype.
Figure 18 is the measured raw data after the calibration drive finished. To test the efficiency of the calibration method we generated 50 random orientations inside of the calibrated area and compared the processed data to the approached orien-tation. Table 2 shows the result for a calibration with different step sizes for two axes. The 1° grid gives a standard de-viation of 0.015°. The more important value is the step size divided by the standard deviation, because this ratio shows how good the calibration method works. With the 1° grid the ratio is 65. The calibration method was tested with smaller step sizes down to 0.1°. A standard deviation of 0.0046° was established.
Figure 19. Random orientations (black) inside the grid with reference orientations (grey).
Figure 20. Processed data (black) measured with the RISA prototype.
We didn’t test smaller step sizes because the reference’s positioning resolution is limited. With a reference system, which provides higher positioning resolution and accuracy to calibrate the RISA prototype and a LT system that allows using the laser diode additional to the He-Ne laser to eliminate ambient light, better results are expected. A measurement with all three rotational degrees of freedoms should be conducted as soon all necessary improvements are implemented.
Proc. of SPIE Vol. 8466 84660J-8
Downloaded From: http://proceedings.spiedigitallibrary.org/ on 09/24/2013 Terms of Use: http://spiedl.org/terms
Updated 1 March 2012
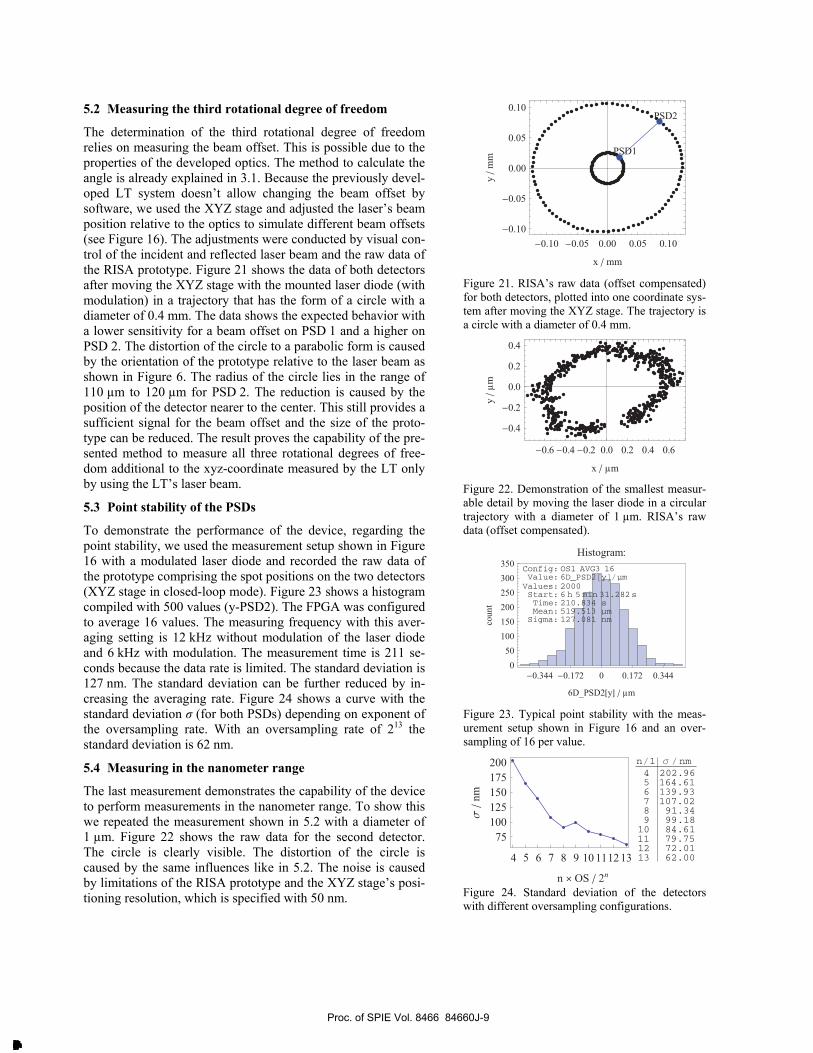
5.2 Measuring the third rotational degree of freedom
The determination of the third rotational degree of freedom relies on measuring the beam offset. This is possible due to the properties of the developed optics. The method to calculate the angle is already explained in 3.1. Because the previously devel-oped LT system doesn’t allow changing the beam offset by software, we used the XYZ stage and adjusted the laser’s beam position relative to the optics to simulate different beam offsets (see Figure 16). The adjustments were conducted by visual con-trol of the incident and reflected laser beam and the raw data of the RISA prototype. Figure 21 shows the data of both detectors after moving the XYZ stage with the mounted laser diode (with modulation) in a trajectory that has the form of a circle with a diameter of 0.4 mm. The data shows the expected behavior with a lower sensitivity for a beam offset on PSD 1 and a higher on PSD 2. The distortion of the circle to a parabolic form is caused by the orientation of the prototype relative to the laser beam as shown in Figure 6. The radius of the circle lies in the range of 110 µm to 120 µm for PSD 2. The reduction is caused by the position of the detector nearer to the center. This still provides a sufficient signal for the beam offset and the size of the proto-type can be reduced. The result proves the capability of the pre-sented method to measure all three rotational degrees of free-dom additional to the xyz-coordinate measured by the LT only by using the LT’s laser beam.
5.3 Point stability of the PSDs
To demonstrate the performance of the device, regarding the point stability, we used the measurement setup shown in Figure 16 with a modulated laser diode and recorded the raw data of the prototype comprising the spot positions on the two detectors (XYZ stage in closed-loop mode). Figure 23 shows a histogram compiled with 500 values (y-PSD2). The FPGA was configured to average 16 values. The measuring frequency with this aver-aging setting is 12 kHz without modulation of the laser diode and 6 kHz with modulation. The measurement time is 211 se-conds because the data rate is limited. The standard deviation is 127 nm. The standard deviation can be further reduced by in-creasing the averaging rate. Figure 24 shows a curve with the standard deviation σ (for both PSDs) depending on exponent of the oversampling rate. With an oversampling rate of 213 the standard deviation is 62 nm.
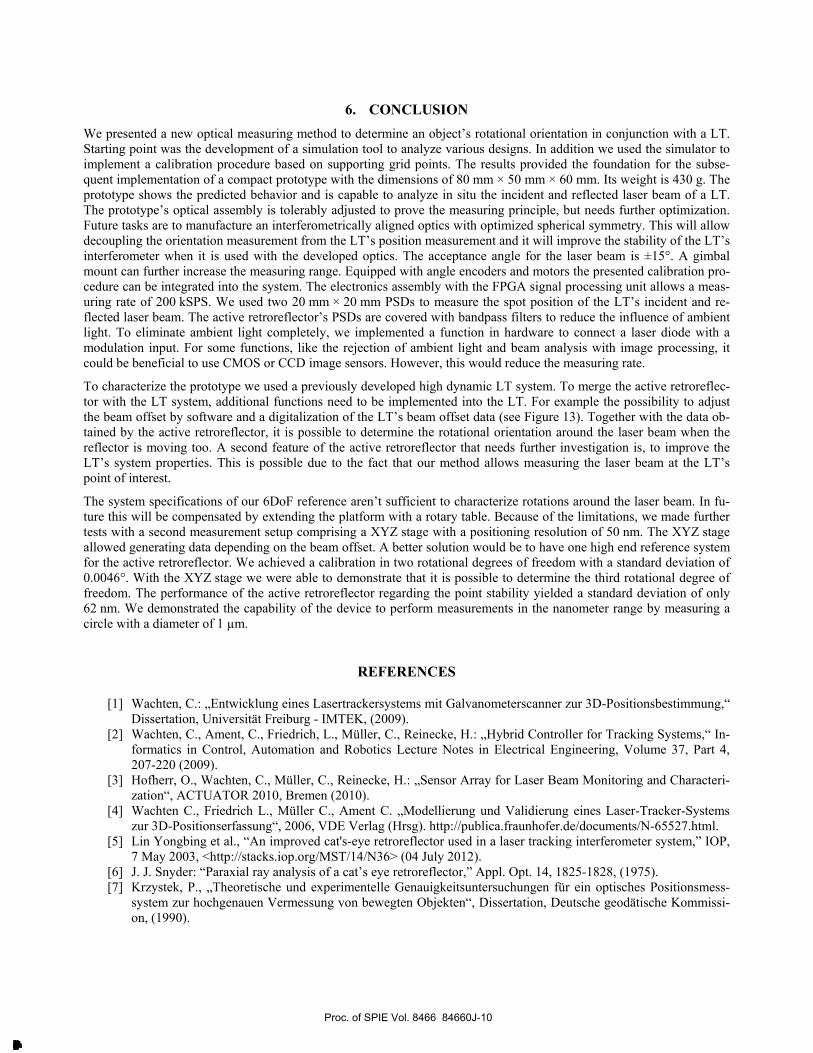
5.4 Measuring in the nanometer range
The last measurement demonstrates the capability of the device to perform measurements in the nanometer range. To show this we repeated the measurement shown in 5.2 with a diameter of 1 µm. Figure 22 shows the raw data for the second detector. The circle is clearly visible. The distortion of the circle is caused by the same influences like in 5.2. The noise is caused by limitations of the RISA prototype and the XYZ stage’s posi-tioning resolution, which is specified with 50 nm.
Figure 21. RISA’s raw data (offset compensated) for both detectors, plotted into one coordinate sys-tem after moving the XYZ stage. The trajectory is a circle with a diameter of 0.4 mm.
Figure 22. Demonstration of the smallest measur-able detail by moving the laser diode in a circular trajectory with a diameter of 1 µm. RISA’s raw data (offset compensated).
Figure 23. Typical point stability with the meas-urement setup shown in Figure 16 and an over-sampling of 16 per value.
Figure 24. Standard deviation of the detectors with different oversampling configurations.
Proc. of SPIE Vol. 8466 84660J-9
Downloaded From: http://proceedings.spiedigitallibrary.org/ on 09/24/2013 Terms of Use: http://spiedl.org/terms
Updated 1 March 2012
6. CONCLUSION
We presented a new optical measuring method to determine an object’s rotational orientation in conjunction with a LT. Starting point was the development of a simulation tool to analyze various designs. In addition we used the simulator to implement a calibration procedure based on supporting grid points. The results provided the foundation for the subse-quent implementation of a compact prototype with the dimensions of 80 mm × 50 mm × 60 mm. Its weight is 430 g. The prototype shows the predicted behavior and is capable to analyze in situ the incident and reflected laser beam of a LT. The prototype’s optical assembly is tolerably adjusted to prove the measuring principle, but needs further optimization. Future tasks are to manufacture an interferometrically aligned optics with optimized spherical symmetry. This will allow decoupling the orientation measurement from the LT’s position measurement and it will improve the stability of the LT’s interferometer when it is used with the developed optics. The acceptance angle for the laser beam is ±15°. A gimbal mount can further increase the measuring range. Equipped with angle encoders and motors the presented calibration pro-cedure can be integrated into the system. The electronics assembly with the FPGA signal processing unit allows a meas-uring rate of 200 kSPS. We used two 20 mm × 20 mm PSDs to measure the spot position of the LT’s incident and re-flected laser beam. The active retroreflector’s PSDs are covered with bandpass filters to reduce the influence of ambient light. To eliminate ambient light completely, we implemented a function in hardware to connect a laser diode with a modulation input. For some functions, like the rejection of ambient light and beam analysis with image processing, it could be beneficial to use CMOS or CCD image sensors. However, this would reduce the measuring rate.
To characterize the prototype we used a previously developed high dynamic LT system. To merge the active retroreflec-tor with the LT system, additional functions need to be implemented into the LT. For example the possibility to adjust the beam offset by software and a digitalization of the LT’s beam offset data (see Figure 13). Together with the data ob-tained by the active retroreflector, it is possible to determine the rotational orientation around the laser beam when the reflector is moving too. A second feature of the active retroreflector that needs further investigation is, to improve the LT’s system properties. This is possible due to the fact that our method allows measuring the laser beam at the LT’s point of interest.
The system specifications of our 6DoF reference aren’t sufficient to characterize rotations around the laser beam. In fu-ture this will be compensated by extending the platform with a rotary table. Because of the limitations, we made further tests with a second measurement setup comprising a XYZ stage with a positioning resolution of 50 nm. The XYZ stage allowed generating data depending on the beam offset. A better solution would be to have one high end reference system for the active retroreflector. We achieved a calibration in two rotational degrees of freedom with a standard deviation of 0.0046°. With the XYZ stage we were able to demonstrate that it is possible to determine the third rotational degree of freedom. The performance of the active retroreflector regarding the point stability yielded a standard deviation of only 62 nm. We demonstrated the capability of the device to perform measurements in the nanometer range by measuring a circle with a diameter of 1 µm.
REFERENCES
[1] Wachten, C.: „Entwicklung eines Lasertrackersystems mit Galvanometerscanner zur 3D-Positionsbestimmung,“ Dissertation, Universität Freiburg - IMTEK, (2009).
[2] Wachten, C., Ament, C., Friedrich, L., Müller, C., Reinecke, H.: „Hybrid Controller for Tracking Systems,“ In-formatics in Control, Automation and Robotics Lecture Notes in Electrical Engineering, Volume 37, Part 4, 207-220 (2009).
[3] Hofherr, O., Wachten, C., Müller, C., Reinecke, H.: „Sensor Array for Laser Beam Monitoring and Characteri-zation“, ACTUATOR 2010, Bremen (2010).
[4] Wachten C., Friedrich L., Müller C., Ament C. „Modellierung und Validierung eines Laser-Tracker-Systems zur 3D-Positionserfassung“, 2006, VDE Verlag (Hrsg). http://publica.fraunhofer.de/documents/N-65527.html.
[5] Lin Yongbing et al., “An improved cat's-eye retroreflector used in a laser tracking interferometer system,” IOP, 7 May 2003, <http://stacks.iop.org/MST/14/N36> (04 July 2012).
[6] J. J. Snyder: “Paraxial ray analysis of a cat’s eye retroreflector,” Appl. Opt. 14, 1825-1828, (1975). [7] Krzystek, P., „Theoretische und experimentelle Genauigkeitsuntersuchungen für ein optisches Positionsmess-
system zur hochgenauen Vermessung von bewegten Objekten“, Dissertation, Deutsche geodätische Kommissi-on, (1990).
Proc. of SPIE Vol. 8466 84660J-10
Downloaded From: http://proceedings.spiedigitallibrary.org/ on 09/24/2013 Terms of Use: http://spiedl.org/terms