active transportation network
TRANSCRIPT
1 | P a g e
TransPlan50
Active
Transportation
Network
Appendix E
2 | P a g e
TransPlan50
BICYCLE AND PEDESTRIAN IMPROVEMENTS (ACTIVE TRANSPORTATION)
Utah County leaders have embraced non-motorized transportation as integral to
improving air quality, reducing congestion, and lowering travel costs. Feedback from
local leaders during the MAG Transportation Summits of 2018 indicated that while
great strides have been made, we should accelerate our efforts to build out the
planned system.
While major highway and transit facility construction consumes the vast majority of
transportation dollars, Active Transportation (AT) facilities are low-cost and low-
impact improvements to a truly multi-modal transportation system. Initial
construction costs, especially where facilities are included in the design and
construction of highway projects, is very low, at 5-10% of project costs.
The goal of the bicycle/pedestrian system is to reduce vehicle trips and mitigate
traffic congestion. As Utah Valley continues to grow and urbanize so the need and
demand for multi-use paths, neighborhood connections, on-street bike lanes,
sidewalks, and pedestrian friendly development increases. Walking and biking are
viable alternatives to driving for short trips, typically under two miles. For longer trips
connections to transit are vital. TransPlan50 identifies AT facilities that are needed to
better integrate AT and transit.
ACTIVE TRANSPORTATION PROJECT
SELECTION
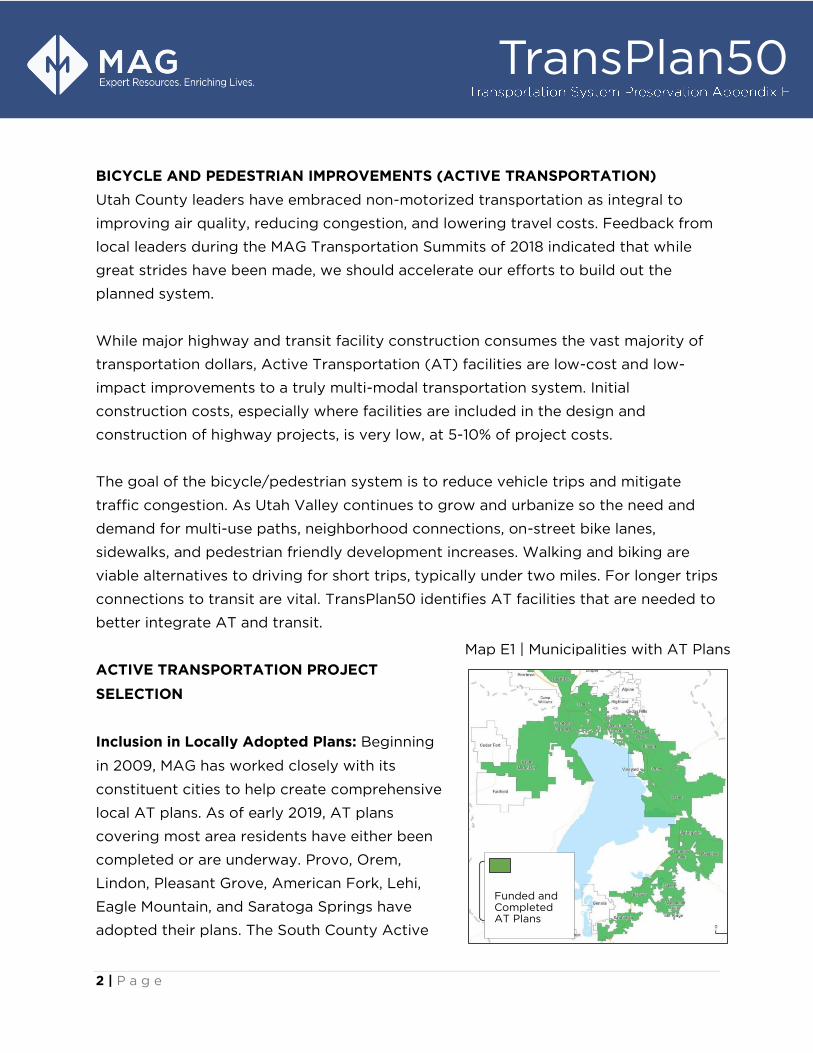
Inclusion in Locally Adopted Plans: Beginning
in 2009, MAG has worked closely with its
constituent cities to help create comprehensive
local AT plans. As of early 2019, AT plans
covering most area residents have either been
completed or are underway. Provo, Orem,
Lindon, Pleasant Grove, American Fork, Lehi,
Eagle Mountain, and Saratoga Springs have
adopted their plans. The South County Active
Funded and Completed AT Plans
Map E1 | Municipalities with AT Plans
3 | P a g e
TransPlan50
Transportation Plan from 2015 covered the communities of Elk Ridge, Mapleton,
Payson, Salem, Santaquin, Spanish Fork, Springville, Woodland Hills and the southern
portion of unincorporated Utah County. TransPlan50 draws on these plans for most
of the proposed projects.
Projects that Extend the Regionally Significant Network: Utah Valley enjoys a large,
connected bikeway network including over 200 miles of paved off-street pathways,
on-street bike lanes and signed shared roadways. TransPlan50 projects are those
that broaden the geographic reach and continuity of the AT system, such as those
that cross jurisdictional boundaries or provide access to a regional destination.
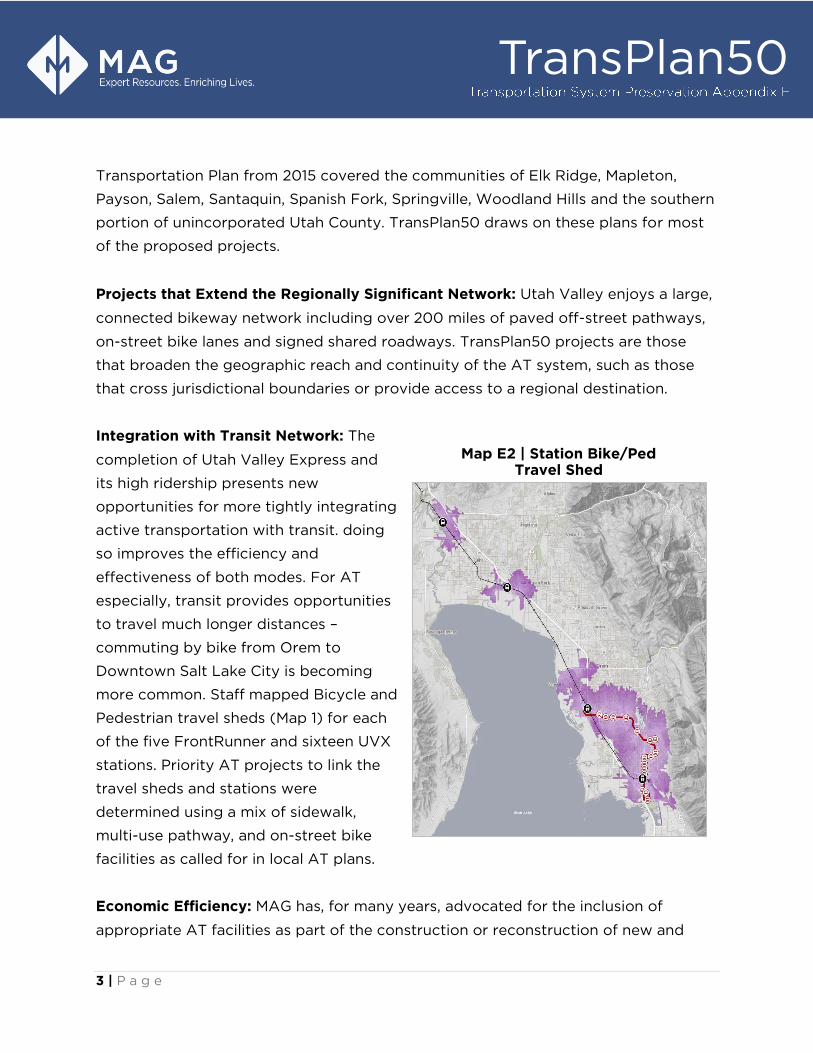
Integration with Transit Network: The
completion of Utah Valley Express and
its high ridership presents new
opportunities for more tightly integrating
active transportation with transit. doing
so improves the efficiency and
effectiveness of both modes. For AT
especially, transit provides opportunities
to travel much longer distances –
commuting by bike from Orem to
Downtown Salt Lake City is becoming
more common. Staff mapped Bicycle and
Pedestrian travel sheds (Map 1) for each
of the five FrontRunner and sixteen UVX
stations. Priority AT projects to link the
travel sheds and stations were
determined using a mix of sidewalk,
multi-use pathway, and on-street bike
facilities as called for in local AT plans.
Economic Efficiency: MAG has, for many years, advocated for the inclusion of
appropriate AT facilities as part of the construction or reconstruction of new and
Map E2 | Station Bike/Ped Travel Shed
4 | P a g e
TransPlan50
existing roads. Doing so minimizes the
impacts and reduces the cost of building
the AT network and takes advantage of all
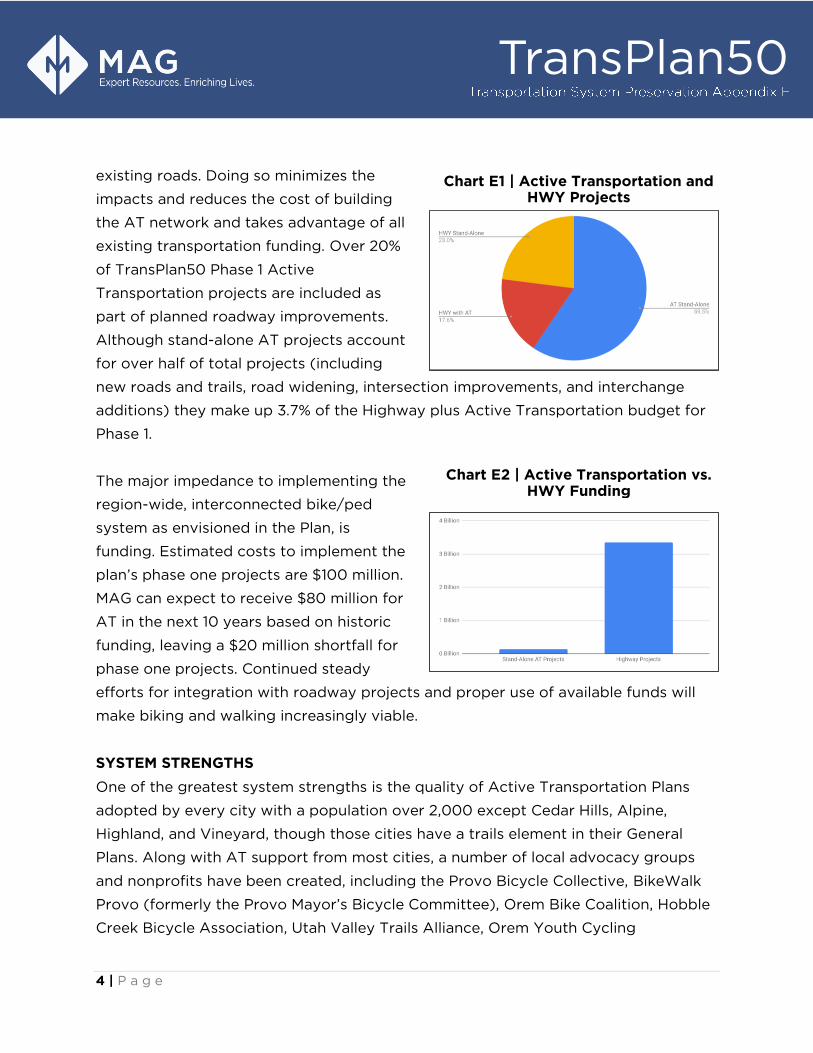
existing transportation funding. Over 20%
of TransPlan50 Phase 1 Active
Transportation projects are included as
part of planned roadway improvements.
Although stand-alone AT projects account
for over half of total projects (including
new roads and trails, road widening, intersection improvements, and interchange
additions) they make up 3.7% of the Highway plus Active Transportation budget for
Phase 1.
The major impedance to implementing the
region-wide, interconnected bike/ped
system as envisioned in the Plan, is
funding. Estimated costs to implement the
plan’s phase one projects are $100 million.
MAG can expect to receive $80 million for
AT in the next 10 years based on historic
funding, leaving a $20 million shortfall for
phase one projects. Continued steady
efforts for integration with roadway projects and proper use of available funds will
make biking and walking increasingly viable.
SYSTEM STRENGTHS
One of the greatest system strengths is the quality of Active Transportation Plans
adopted by every city with a population over 2,000 except Cedar Hills, Alpine,
Highland, and Vineyard, though those cities have a trails element in their General
Plans. Along with AT support from most cities, a number of local advocacy groups
and nonprofits have been created, including the Provo Bicycle Collective, BikeWalk
Provo (formerly the Provo Mayor’s Bicycle Committee), Orem Bike Coalition, Hobble
Creek Bicycle Association, Utah Valley Trails Alliance, Orem Youth Cycling
Chart E1 | Active Transportation and HWY Projects
Chart E2 | Active Transportation vs. HWY Funding
5 | P a g e
TransPlan50
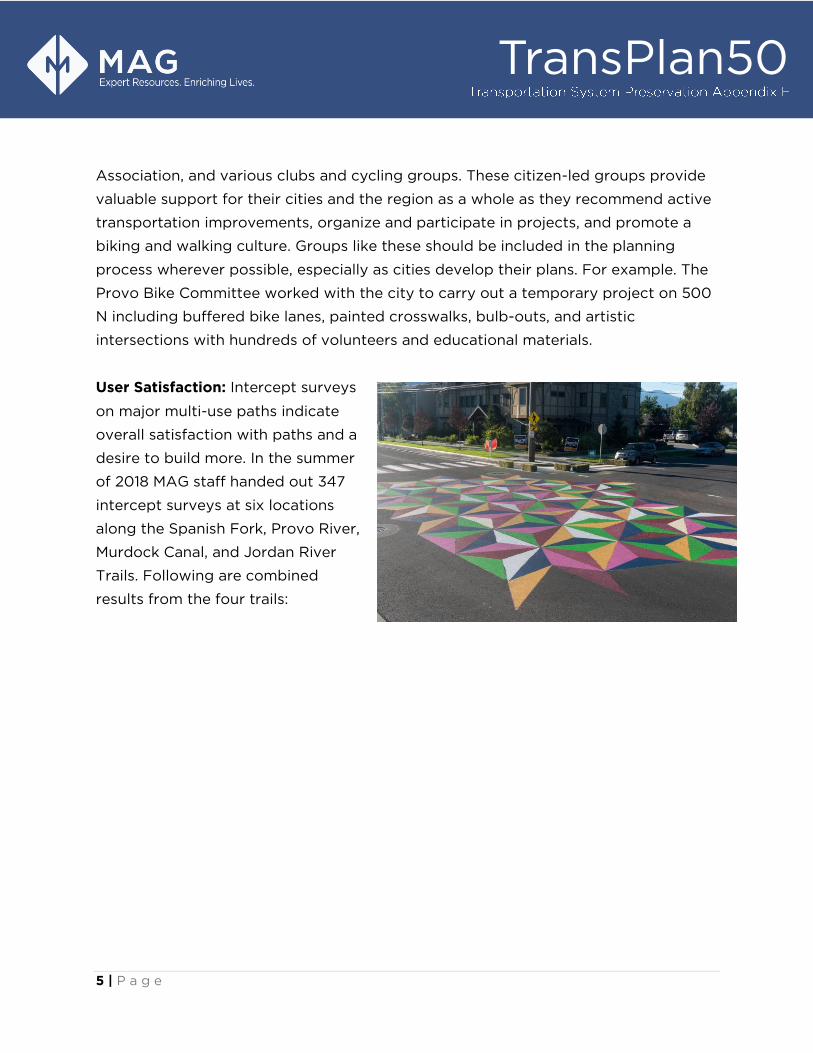
Association, and various clubs and cycling groups. These citizen-led groups provide
valuable support for their cities and the region as a whole as they recommend active
transportation improvements, organize and participate in projects, and promote a
biking and walking culture. Groups like these should be included in the planning
process wherever possible, especially as cities develop their plans. For example. The
Provo Bike Committee worked with the city to carry out a temporary project on 500
N including buffered bike lanes, painted crosswalks, bulb-outs, and artistic
intersections with hundreds of volunteers and educational materials.
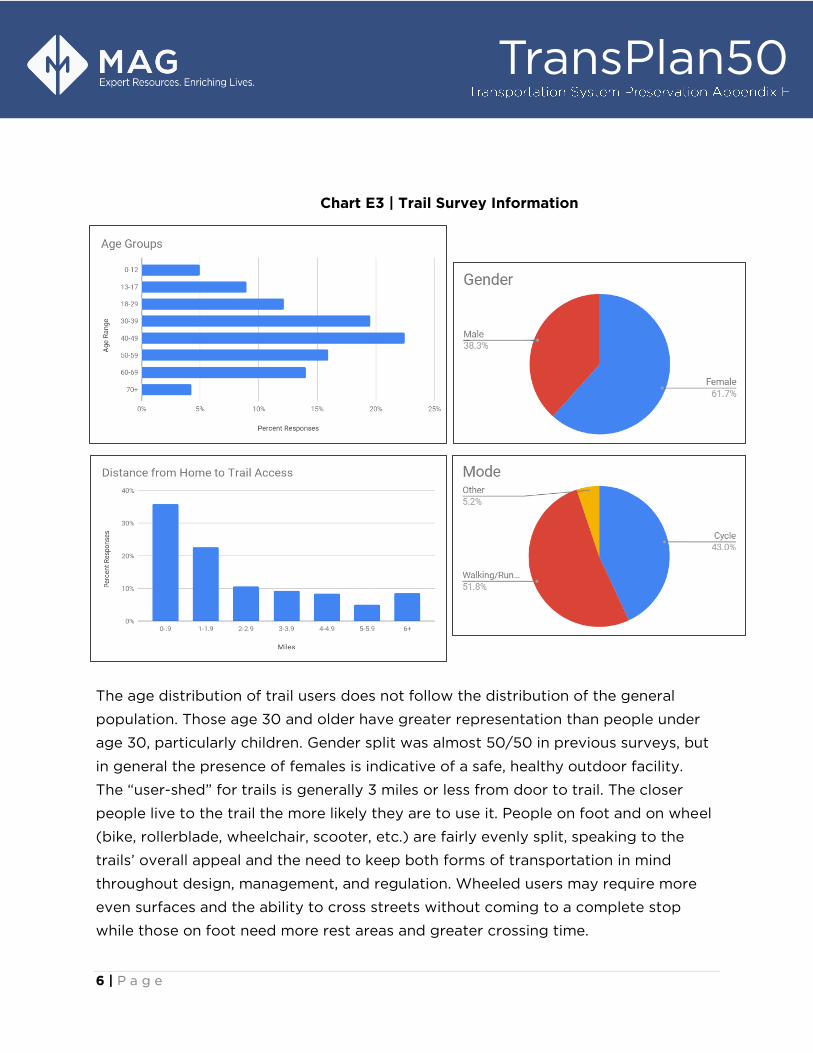
User Satisfaction: Intercept surveys
on major multi-use paths indicate
overall satisfaction with paths and a
desire to build more. In the summer
of 2018 MAG staff handed out 347
intercept surveys at six locations
along the Spanish Fork, Provo River,
Murdock Canal, and Jordan River
Trails. Following are combined
results from the four trails:
6 | P a g e
TransPlan50
The age distribution of trail users does not follow the distribution of the general
population. Those age 30 and older have greater representation than people under
age 30, particularly children. Gender split was almost 50/50 in previous surveys, but
in general the presence of females is indicative of a safe, healthy outdoor facility.
The “user-shed” for trails is generally 3 miles or less from door to trail. The closer
people live to the trail the more likely they are to use it. People on foot and on wheel
(bike, rollerblade, wheelchair, scooter, etc.) are fairly evenly split, speaking to the
trails’ overall appeal and the need to keep both forms of transportation in mind
throughout design, management, and regulation. Wheeled users may require more
even surfaces and the ability to cross streets without coming to a complete stop
while those on foot need more rest areas and greater crossing time.
Chart E3 | Trail Survey Information
7 | P a g e
TransPlan50
Notable exceptions: Spanish Fork users were
88% female and more of those surveyed lived 1-
1.9 miles from the trail than 0-0.9 miles, perhaps
due to the survey location near an informal
trailhead in farmlands where homes are more
than a mile away, illustrating the need for AT
connection from neighborhoods to trails.
The Murdock Trail’s user demographic is significantly older than other trails, with 21%
age 50 and over. Many retirees living on the mountainside prefer lower-impact sports
like biking. 17% of Murdock and 15% of Jordan River Trail users were commuters. The
survey location on the Jordan River Trail in particular was relatively close to
employment centers at the Point of the Mountain. Two people surveyed on the Provo
River Trail commute daily via wheelchair to get to the hospital, emphasizing the need
for trails to accommodate those who cannot drive themselves.
Though not surveyed, a group of minors with disabilities and others who cannot
drive frequent the trail as well.
Utah County also boasts regionally renowned trails such as the Murdock Canal Trail
to be emulated. The Economic Impacts of Active Transportation: Utah Active
Transportation Benefits Study prepared for UTA in 2017 by Urban Design 4 Health,
Inc. and Fehr and Peers performed an analysis of the Murdock Trail. They found that,
“Spending on equipment and service by more than 848,000 users results in an
additional $2.22 million in output every year. Health impacts for nearly 170,000 users
(20% of total) who are assumed to be newly active generate $700,000 in output
from diverted healthcare spending and $500,000 in total economic impacts from
increased productivity (due to fewer sick days). “Trail facilities are not only part of
the transportation system, but also contribute positively to economic and health
outcomes.
95% Feel safe while using the trail
9% Use the trail to commute
8 | P a g e
TransPlan50
SYSTEM WEAKNESSES
Active Transportation has great
potential to serve not only those
desiring a more active lifestyle, but also
those who cannot drive or do not have
access to a vehicle; in particular the
young, the elderly, minority and low-
income residents. Currently, most on-
road infrastructure consists of bike lanes, which appeal to less than 10% of riders
according to various studies, due to the high level of user discomfort. Designing with
the comfort and safety of people walking and biking as a priority will make active
transportation more appealing and therefore more effective as a travel mode. Safe,
convenient, and well-designed facilities are MAG’s highest priority.
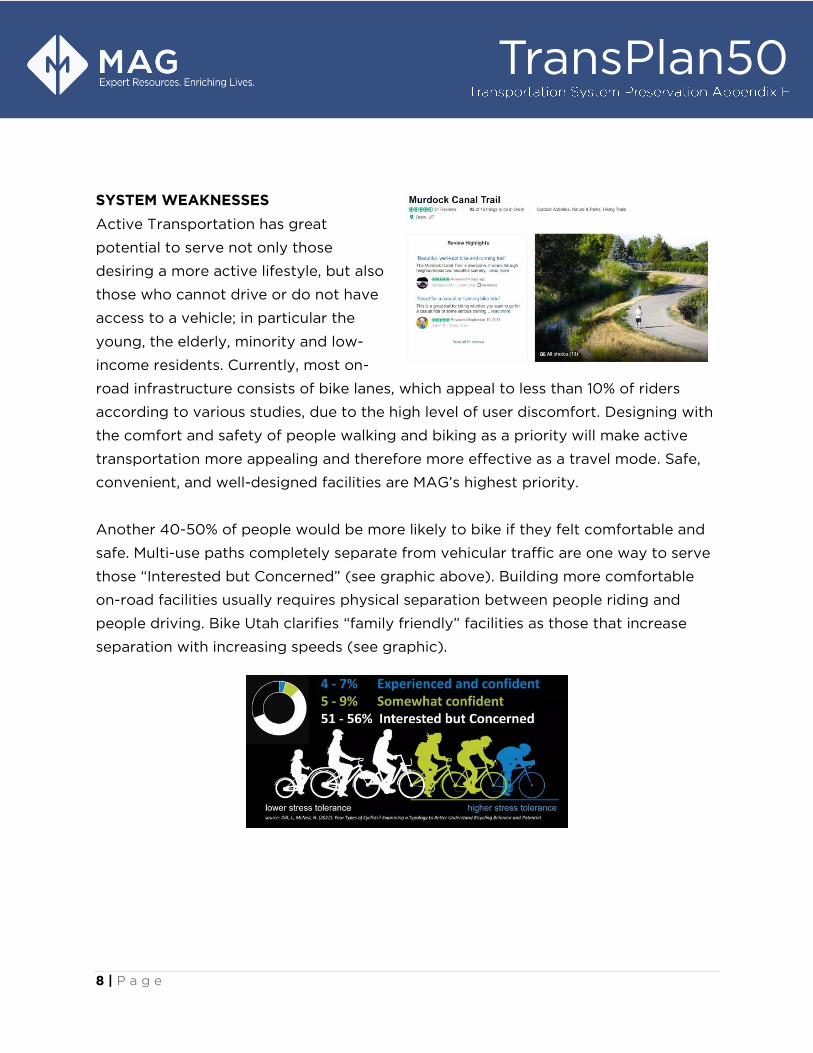
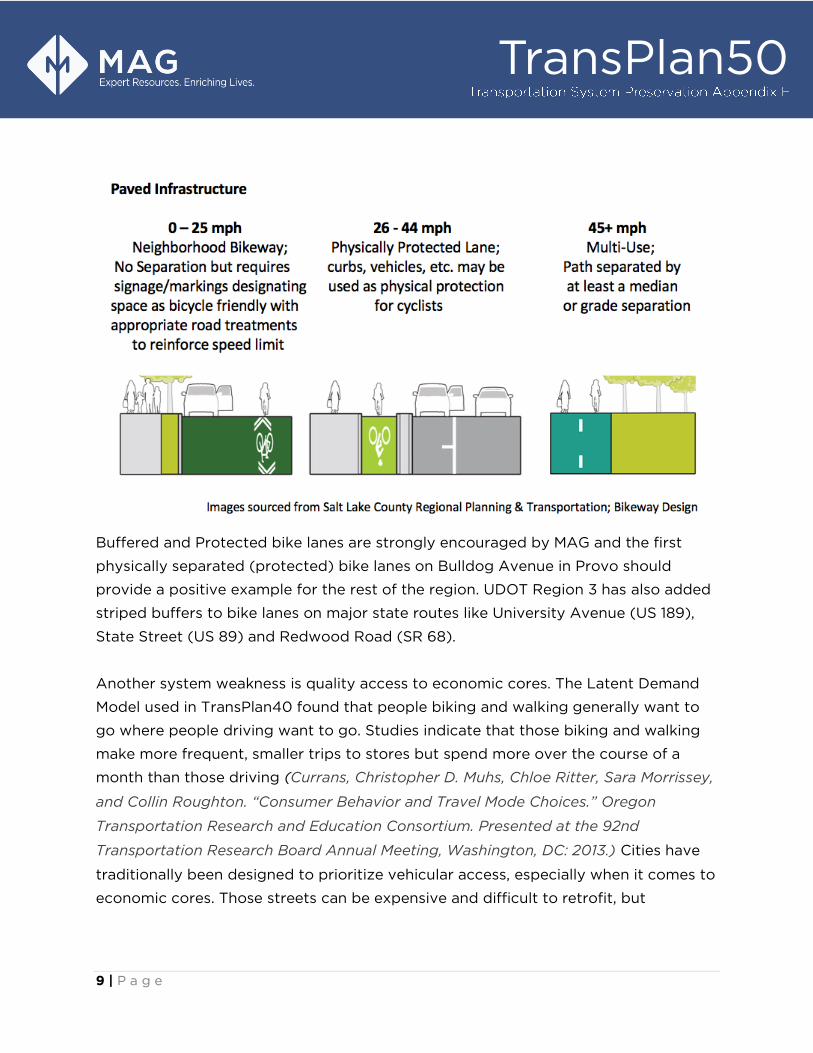
Another 40-50% of people would be more likely to bike if they felt comfortable and
safe. Multi-use paths completely separate from vehicular traffic are one way to serve
those “Interested but Concerned” (see graphic above). Building more comfortable
on-road facilities usually requires physical separation between people riding and
people driving. Bike Utah clarifies “family friendly” facilities as those that increase
separation with increasing speeds (see graphic).
9 | P a g e
TransPlan50
Buffered and Protected bike lanes are strongly encouraged by MAG and the first
physically separated (protected) bike lanes on Bulldog Avenue in Provo should
provide a positive example for the rest of the region. UDOT Region 3 has also added
striped buffers to bike lanes on major state routes like University Avenue (US 189),
State Street (US 89) and Redwood Road (SR 68).
Another system weakness is quality access to economic cores. The Latent Demand
Model used in TransPlan40 found that people biking and walking generally want to
go where people driving want to go. Studies indicate that those biking and walking
make more frequent, smaller trips to stores but spend more over the course of a
month than those driving (Currans, Christopher D. Muhs, Chloe Ritter, Sara Morrissey,
and Collin Roughton. “Consumer Behavior and Travel Mode Choices.” Oregon
Transportation Research and Education Consortium. Presented at the 92nd
Transportation Research Board Annual Meeting, Washington, DC: 2013.) Cities have
traditionally been designed to prioritize vehicular access, especially when it comes to
economic cores. Those streets can be expensive and difficult to retrofit, but
10 | P a g e
TransPlan50
improved access for non-vehicular traffic is necessary to accommodate the growth
coming to Utah County and create sustainable, multi-modal systems.
PROJECT SELECTION PROCESS
MAG staff consults with the MPO municipalities, Utah County, UDOT, and UTA in
creating a list of proposed AT projects and associated project cost estimates. A final
project list is forwarded to the Technical Advisory Committee for vetting and
submission to the Regional Planning Committee for final approval.
FUTURE CONSIDERATIONS
Growth at the Point of the Mountain and redevelopment of the Draper prison site are
opportunities to improve regional connectivity along the Wasatch Front. MAG and
WFRC coordinate to create AT corridors through that narrow space, including
facilities along Mountain View Corridor, Redwood Road, the existing Jordan River
Parkway Trail, and an extension of the Porter Rockwell Trail on the east side of I-15.
11 | P a g e
TransPlan50
Emerging Systems: New technologies and systems have the potential to benefit
Active Transportation. MAG should be aware of emerging issues and plan flexibly to
allow those with staying power to be integrated into the planning process. MAG
works with cities to create AT-friendly policies for Electric Assist bicycles and other
micro-transit. MAG participates in discussions on bike-share programs, though no
city in Utah County has adopted one yet.
USE OF STRAVA AND ECO-
COUNTER DATA TO MODEL
NETWORK
Performance-based planning and
programming have a foundation in
high quality data. Ongoing data
collection, and processes for
analyzing and managing
transportation data, can support
planning and prioritization,
programming and future funding
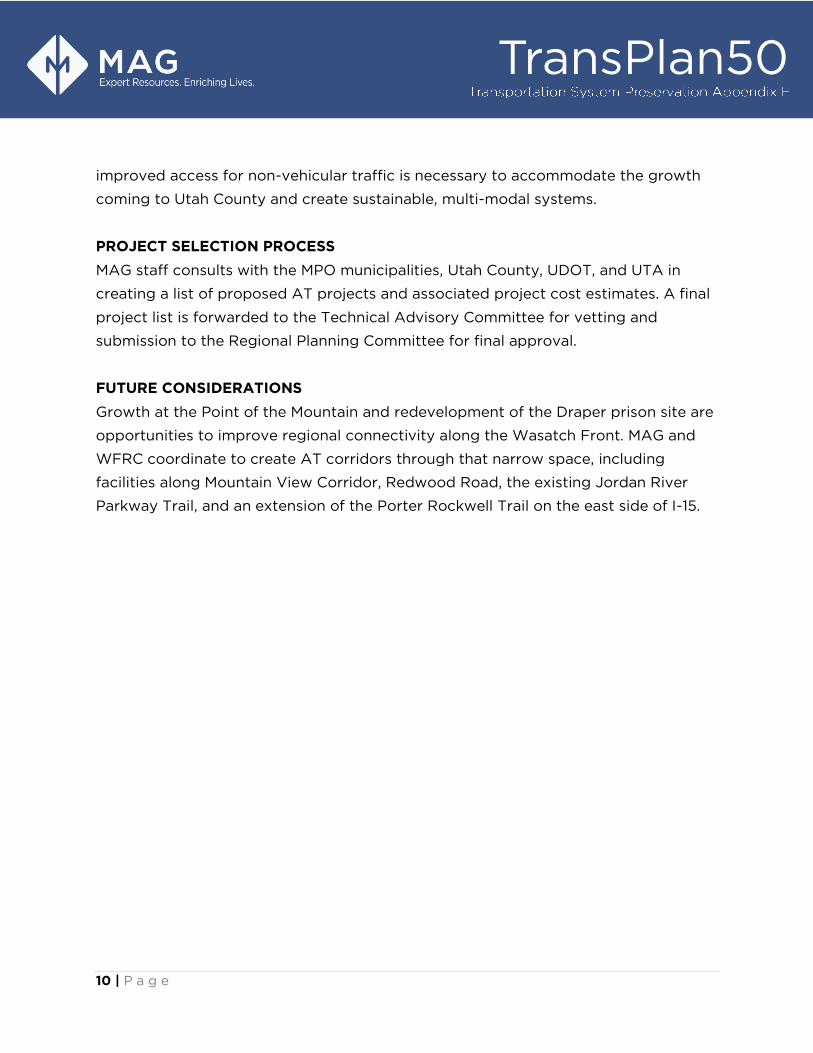
decisions. MAG has 18 continuous
counters on multi-use paths
throughout the county as well as 2
in-road counters on University Ave
in Provo.
MAG, with WFRC, UDOT, and UTA, has acquired STRAVA data for the past two
years. STRAVA is a social media/training app that records physical activity (both
cycling and on foot) while connecting users. STRAVA counts with in-field counts
(including the eco-counters) are the basis for developing an AT data management
program and create a system for collecting and publishing data that can be used by
the public and by public agencies. This program should inform an Active
Transportation model that will be in use by next plan.
MAP E3 | Counter Locations with 2018 Totals
12 | P a g e
TransPlan50
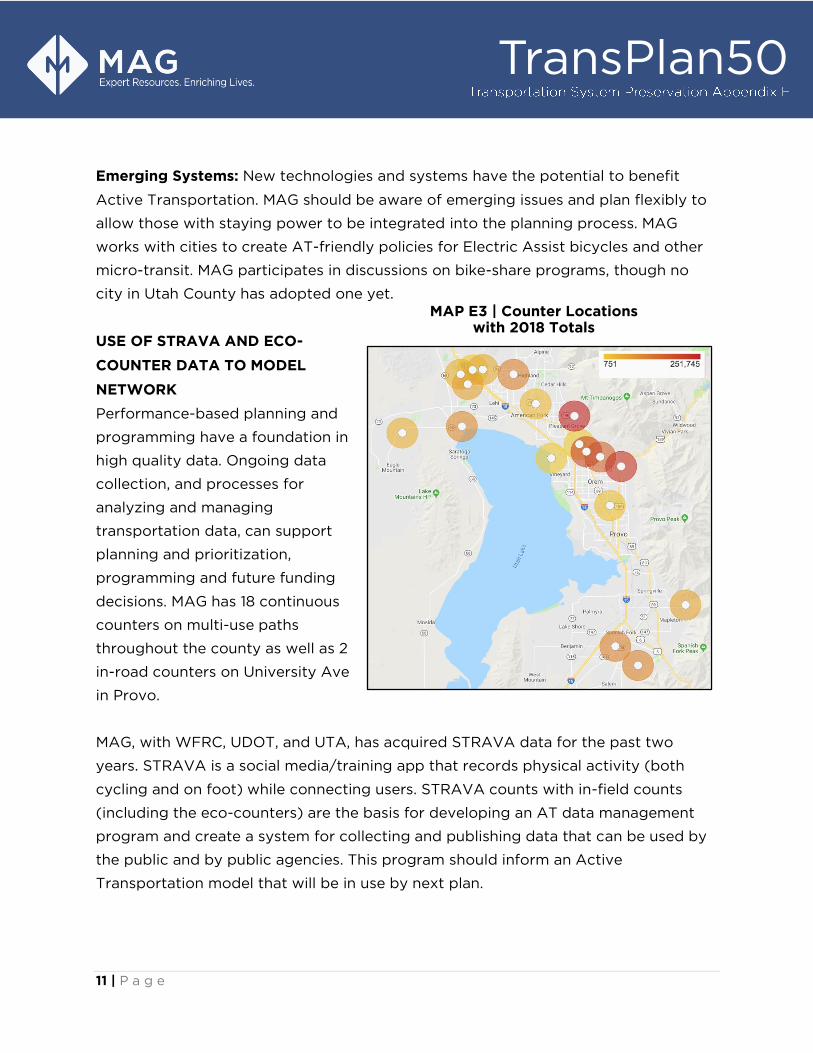
Site Year Total Daily
Average Peak Month
Peak Count
(Day)
Murdock - Wade Springs 251,745 690 June 2,072
Provo River - Cyn Mouth 225,536 618 June 2,733
Murdock - Lindon 194,545 533 June 1,682
Murdock - Orem 1600 N 156,478 429 August 3,507
Murdock - Highland 110,054 302 May 1,269
Spanish Fork - Sports Park 109,770 392 June 987
Spanish Fork - Poplar Ln 108,499 387 June 1,273
Jordan River - Model
Airplane Park 96,872 265 June 2,997
Jordan River - Lehi 2100 N 61,019 167 June 1,850
Provo River - 1300 W 59,415 371 May 838
Mapleton Canal -
Bartholomew Park 57,987 165 June 1,277
Murdock - Lehi 1200 W 50,222 195 June 531
Murdock/Jordan River
Connector 37,621 103 June 2,787
Eagle Mountain - Hidden
Hollow Elem 35,878 122 May 828
American Fork River Trail 26,368 72 June 1,138
College Connector Trail 17,485 51 June 399
Table E1 | Counter Location Data