actively shaping the new energy concept - enbw€¦ · generation capacity, thereof 2,538 mw from...
TRANSCRIPT

EnBW Energie Baden-Württemberg AG
Annual Report 2011 Actively shaping the new energy concept
p
At a glance
With revenue in excess of € 18 billion in 2011 and some 20,000 employees, EnBW Energie Baden- Württemberg AG is one of the largest energy companies in Germany and Europe.
We generate, trade in, transport and sell energy and operate in the fields of electricity and gas as well as energy and environ-mental services. We want to achieve sustainable and profitable growth with a balanced business portfolio and smart energy solutions – to the benefit of our partners, customers, employees and owners. Our home market is Baden-Württemberg and Germany, but we also operate in other European markets.
Even in a changing energy market, our primary objectives remain the same: supply reliability, environmental protection and profit-ability. This is the basis for the optimum energy mix that we strive for. In addition to the use of conventional energies, the increase in energy efficiency and expansion of renewable energies play an important role here.
p

Time to act
We are determined to play an active role in shaping the new energy concept. And renewable energies are of key importance here. We started investing in renewable energies at an early stage. EnBW has a long tradition of generating electricity from hydro-electric power. We have been operating photovoltaic facilities and onshore wind farms since the 1980s and EnBW’s wind turbines have been exploiting wind power at sea since 2011. We are focusing on these activities as well as the generation of electricity with low CO2 emissions and local solution offers and will continue to do so in future. We are aware of the responsibility that we have as an energy provider. In a world of energy that is becoming ever more complex, we tackle and master challenges together with our partners.
_ 1

EnBW group
€ millions 2011 2010 Variance %
Revenue
Electricity generation and trading 5,449.0 4,817.0 13.1
Electricity grid and sales 10,742.6 10,192.7 5.4
Gas 1,817.7 1,788.1 1.7
Energy and environmental services 780.4 711.2 9.7
External revenue, total 18,789.7 17,509.0 7.3
Adjusted EBITDA 1 2,453.0 2,858.7 -14.2
EBITDA 1 1,808.7 3,315.0 -45.4
Adjusted EBIT 1 1,598.1 1,926.1 -17.0
EBIT1 670.9 2,124.8 -68.4
Adjusted group net profit 1, 2 647.7 964.3 -32.8
Group net loss / profit 1, 2 -867.3 1,157.2 –
Earnings per share from adjusted group net profit 1, 2 in € 2.65 3.95 -32.9
Earnings per share from adjusted group net loss / profit 1, 2 in € -3.55 4.74 –
Cash flow from operating activities 1,740.1 2,560.9 -32.1
Free cash flow 3 690.8 1,060.1 -34.8
Recognised net financial liabilities 4 5,353.5 5,641.3 -5.1
Capital expenditure 1,319.0 2,327.9 -43.3
Return on capital employed (ROCE) 1 (%) 11.7 14.2 -17.6
Weighted average cost of capital (WACC) before tax (%) 8.7 9.0 -3.3
Average capital employed 1 15,720.5 15,404.2 2.1
Value added 1 471.6 801.0 -41.1
Energy sales of the EnBW group
billions of kWh 2011 2010 Variance %
Electricity 155.7 146.9 6.0
Gas 57.4 53.6 7.1
Employees of the EnBW group 5
Number 2011 2010 Variance %
Employees (annual average) 20,959 20,450 2.5
1 Prior-year figures restated. 2 In relation to the loss /profit shares attributable to the equity holders of EnBW AG. 3 Free cash flow before financing. 4 Without cash and cash equivalents of the special funds and short-term investments to cover the pension and nuclear power provisions. 5 Number of employees without apprentices and without inactive employees.
Key figures

The EnBW group
v
Key
figu
res
and
the
EnB
W g
roup
Generation / trading / optimisation
13,402 MWGeneration capacity, thereof 2,538 MW from renewable energies
59.5 billion kWh Own generation 1
Thermal waste disposal
1.3 million t Thermal waste disposal capacity
Contracting
1,290 MW Installed thermal output
Water supply
89.5 million m3
Water sold
Procurement
56.7 billion kWh Gas purchased excluding gas purchased for power stations
Storage facilities
269.0 million m3
Storage capacity including Etzel gas storage facility (under construction)
Transmission and distribution
15,967 km Gas grid
Sales
54.9 billion kWh Gas sold
Share in adjusted EBIT 2
13%
Share in adjusted EBIT 2
80%
Share in adjusted EBIT 2
3%Share in adjusted EBIT 2
12%
1 Own generation includes long-term procurement agreements and generation from partly owned power stations. 2 Holding / consolidation (share of -8%) not listed in the table.
Transmission and distribution
153,166 km Electricity grid
Sales
64.5 billion kWhElectricity sold
Electricity grid and sales
Electricity generation and trading
Energy and environmental services
Gas

Contents
26 Securing low-carbon energy: efficient, safe, sustainable
Today, we already generate some 11% of our electricity from renew-able energy sources. By 2020, we aim to have expanded renewable energy capacities by 3,000 MW.
28 Offering local energy solutions: based on partnership, smart and environmentally friendly
By offering local energy concepts and new partner models, we can cater to the needs of municipalities and municipal utilities even better.
30 Encouraging dialogue, public participation and partnerships:
committed, cooperative, proactive
Not only municipalities and municipal utilities have the opportunity to participate in our energy projects, but also the citizens in their municipalities.
32 Assuming responsibility: reliable, motivated, forward-looking
We are responsible for providing energy safely, affordably and reliably for our employees, the environment and society.
34 Creating a new energy world for our customers: transparent, individual, innovative
We support our customers with our expertise and innovative energy solutions, thereby tapping potential for new business segments.
26
3028
Actively shaping the new energy concept
2 _

NOTE: The content of this report is intended for information purposes only and does not constitute an offer or investment recommendation. For more information, please turn to page 232.
32 34
4 Interview with the CEO
8 The Board of Management
10 Report of the Supervisory Board
16 Time to act
36 Combined management report of the EnBW group and EnBW AG
115 Financial statements of the EnBW group
207 Corporate governance
225 Service
If you have a smartphone that can recognise QR codes, take a photo of these symbols to get more information.
‹
_ 3

› Mr. Villis, 2011 was an eventful year for the German energy industry and EnBW. With hindsight, how would you describe the fiscal year 2011?Hans-Peter Villis: The dramatic energy policy changes in Germany not only placed a burden on the development of business and, primarily, of earnings but have also had a general impact on the business models of
the major energy companies. As a result, there are major challenges to be surmounted, but it also opens up new opportunities that we intend to use. To summarise, EnBW is active in shaping the new energy concept and wishes to play an even more active role in future. The change in our major shareholders underlines this objective just as much as our strong roots in Baden-Württemberg. And it is conducive to our partnerships with municipalities and municipal utilities.
› How do you assess the situation of the energy industry?Hans-Peter Villis: The industry must align its business models faster than ever before to the new energy policy requirements. The course is set in the direction of local energy generation, preferably on the basis of renewable energies. However, we must not forget the associated, urgently needed expansion of the grids. This restructuring will be shouldered by the energy companies. An immense amount of capital expenditure is required, and it will take a lot of time. The great financial burdens that we face over the next few years do not make the situation any easier.
› How did the events in Japan in spring 2011 impact EnBW and also your work?Hans-Peter Villis: Energy policy was suddenly even more the focal point of public interest and therefore automatically the focal point
“ EnBW is not only actively responding to the intended change but is shaping it in a responsible manner.”
Interview with the CEO Hans-Peter Villis
4 _
of communications work. Never before in my working life so far have I spent so much time in talk shows, at public forums and exchanging ideas with various groups of people. This is one important factor, however: the general public want to be, and should be, involved in deci-sion-making, in the opportunities and also in the risks of future energy supplies.
› What are the consequences for the EnBW group arising from the energy policy changes?Hans-Peter Villis: The four nuclear power plants operated by EnBW accounted for just under one third of our generation capacity in 2010. We shut down two of them in spring 2011, permanently as we now know. The residual working lives of the remaining two plants were redefined. This had a direct effect on earnings through the loss of electricity genera-tion volumes and revenue as well as through the nuclear fuel rod tax. Indirect effects were caused by a higher level of provisions and write-downs of nuclear fuel rods. In light of these negative influences, we were forced to rework our planning, sharpen the focus of our strategy and take action quickly.
› What does this adjusted strategy look like?Hans-Peter Villis: EnBW is not only actively responding to the intended change but is shaping it in a responsible manner. In this way, we are safeguarding the company’s future sustainability. But, in doing so, EnBW’s profile will change over the coming years. We are putting even more emphasis than in the past on expanding renewable energies. Securing our position as a low-carbon generator is one of our key strategic moves. The second strategic move is to establish local solution offers. Models of participation of the general public and even closer partnerships with munici palities and municipal utilities play a key role in both strategic moves. At the same time, we will ensure the financial stability of the company with a comprehensive package of measures.
› Please tell us some more about this package of measures. What has already been achieved in this respect?Hans-Peter Villis: The package includes the elements of increasing efficiency, divestitures and capital measures. In 2011, we implemented efficiency measures of € 190 million within the framework of the “Fokus” project; when the programme comes into full effect as of
the end of 2014, we anticipate sustainable improvements in EBIT of € 750 million per year. Secondly, EnBW has increased the vol-ume of planned divestitures. At the end of 2011, we disposed of a shareholding of around 15% in Energiedienst Holding AG (EDH) and concluded an agreement on the disposal of our non-controlling interests in Poland, which will come into effect in 2012. In the third area, capital measures, EnBW issued a hybrid bond on the capital market in October 2011, with a volume of € 750 million. Further moves to strengthen equity are in preparation. We are acting quickly and consistently. And this
is being rewarded by the capital market, our shareholders and also the rating agencies.
› Efficiency improvements with an effect on EBIT of € 750 million per year are quite ambitious. What does this mean for EnBW’s employees?Hans-Peter Villis: This total volume includes a sustained contribution by employees of € 250 million per year. The first immediate measure was a temporary freeze on hiring imposed in July 2011. We anticipate great potential for savings from reducing the com-plexity of the group. The central management of essential functions is to be strengthened and transparency increased throughout the group. EnBW is changing. This environment places demands on employees to demonstrate willingness to accept change.
“ The general public want to be, and should be, involved in decision-making, in the opportunities and also in the risks of future energy supplies.”
Interview with the CEO
Time to act
Management report
Financial statements
Corporate governance
Service
‹
_ 5

› Where is the focal point of investments and divestitures?Hans-Peter Villis: We have increased the volume of the planned divestitures relating to non-strategic investments and optimi-sation of shareholdings by € 0.5 billion to € 1.5 billion. The participation of munici-palities and munici pal utilities, for example, in offshore and onshore wind farms, will provide additional headroom. The invest-ments focus is on expanding power generation from renewable energy sources: offshore and onshore wind farms, hydro-electric power, solar and bioenergy. Plans also include capital expenditure on flexible gas power stations. In this context, I am very pleased that the decision was made at the end of last year to build a new highly efficient gas and steam tur-bine power station through our subsi diary, Stadtwerke Düsseldorf, and in cooperation with the state capital Düsseldorf, despite the difficult economic conditions. Such environ-mentally friendly facilities that can respond quickly to demand are an ideal bridging tech-nology for restructuring the energy system and make an important contribution to the new energy concept. EnBW will invest around € 8 to € 10 billion in the new energy concept by 2020. The objectives include a low-carbon generation position and additional generation from renewable sources.
› So this means that renewable energies will play an important role as a source of energy generation at EnBW in the long term?Hans-Peter Villis: Yes, in the planning period from 2012 to 2014 just under 30% of our capital expenditure will be in this area. The plans are for more than half of the electricity generation to be from facilities that use renewable ener-gies by 2030. Despite all the enthusiasm for renewable energies, Germany as an industrial location not only needs energy supplies that are sustainable but also reliable. We must not lose sight of this in our generation portfolio, either. It must be made clear that the restruc-turing of the energy system will take time and cost money. This applies equally to the com-pany and society at large.
› Keyword sustainability: What does that mean at the EnBW group?Hans-Peter Villis: Acting responsibly and in a sustainable manner has always been a core principle at EnBW. The Energy Industry Act, for example, has always obliged us to ensure safe, economically viable and environmentally friendly generation of energy. Today’s under-standing of sustainability goes beyond that, however, and it has taken on a new quality. EnBW is increasingly interlinking its cor-porate and sustainability strategy. For us, sustainability specifically means focusing innovation and growth on expanding renew-able energies, energy efficiency services and
sustainable towns, structuring internal pro-cesses with a view to ecological and social responsibility and to involve employees and the general public to an even greater degree.
› How do you assess the group’s 2011 results?Hans-Peter Villis: As expected, 2011 was a diffi-cult fiscal year for the EnBW group. While, seen as a whole, unit sales of electricity and gas remained unchanged, revenue increased by 7.3% to just under € 19 billion. The earnings development was unsatisfactory, nevertheless. The newly introduced nuclear fuel rod tax and the consequences stemming from the new
“ It must be made clear that the restruc-turing of the energy system will take time and cost money.”
6 _

energy concept impaired EBIT. Adjusted EBIT fell by 17% in comparison to the prior year to around € 1.6 billion. In addition, there were extraordinary expenses that caused a non-operating group net loss of € 1.5 billion. All in all, this produced a group net loss for 2011 of € 816 million as opposed to a group net profit of € 1.2 billion in the previous year. In light of these developments, we consistently started taking measures already in the course of 2011 to counter this negative development and to maintain the financial stability of the com-pany and its ability to prepare for the future.
› What were the effects of this earnings development on the financial position of the company?Hans-Peter Villis: A group net loss impacts equity and credit standing. For this reason, it was important for us that the hybrid bond with a volume of € 750 million was success-fully issued on the capital market in Octo-ber 2011. On account of its structure, half of the volume will be treated as equity by the rating agencies over the next few years. In addition to this, we are preparing, in consultation with our two major share holders, further measures to strengthen equity reporting purposes. In conjunction with the measures we have consistently introduced to improve earnings and that are already taking effect, this is the basis for maintaining the trust of the capital market. Such trust is also reflected in the A rating, which has been confirmed.
› Why is an A rating of such importance for EnBW?Hans-Peter Villis: Ratings are a measure of a debtor’s creditworthiness. The better such credit standing is deemed to be, the more favourable the refinancing terms that can be obtained on the capital market. Interest expenses are an important factor in the income statement. While EnBW has a high level of current cash inflow and sound liquidity on account of its operational strength, this cash flow from operating activities will, how-ever, not be sufficient over the next few years to fully finance the considerable capital expenditure to expand renewable energies. An A rating safeguards access to the capital market at favourable interest rates and forms the basis for the future-orientated restruc-turing of EnBW.
› What are your specific expectations for the fiscal year 2012?Hans-Peter Villis: The changes in gen-eral energy policy and a difficult market environment will continue to have a consid-erable impact on EnBW’s business in 2012. We will not meet our original growth and earnings targets for 2012 or 2013. The nuclear fuel rod tax and the shutdown of two of our nuclear power plants will place an enormous burden on EnBW’s earnings over the coming years. The group’s adjusted EBITDA for 2012 is
expected to fall by 10% to 15% in comparison to the prior year. This trend will continue in 2013, especially as the full auctioning of CO2 allowances entails additional cost for us. Our comprehensive package of countermeasures will be able to mitigate but not reverse such negative development. In light of these facts, we – the company’s boards and committees, the Board of Management and employees – are committed to pressing forward with our new strategy. The day-to-day business remains tricky but the prospects are good.
› Mr. Villis, thank you for your time.
“ In light of these developments, we consistently star- ted taking measures already in the course of 2011 to counter this negative development and to maintain the financial stability of the company and its ability to prepare for the future.”
Interview with the CEO
Time to act
Management report
Financial statements
Corporate governance
Service
‹
_ 7

Hans-Peter Villis born 1958 in Castrop-Rauxel Chief Executive Officer since 1 October 2007 Appointed until 30 September 2012 Castrop-Rauxel / Karlsruhe
Dr. Bernhard Beck, LL.M. born 1954 in Tuttlingen Member of the Board of Management Chief Personnel Officer since 1 October 2002 Appointed until 30 September 2017 Stuttgart
Christian Buchel, born 1963 in Strasbourg, Member of the Board of Management, Chief Operating Officer, 1 February 2009 until 31 May 2011 (no longer member, without photo)
Board of Management
8 _

Thomas Kusterer born 1968 in Pforzheim Member of the Board of Management Chief Financial Officer since 1 April 2011 Appointed until 31 March 2014 Ettlingen
Dr. Dirk Mausbeck born 1962 in Bensberg Member of the Board of Management Chief Commercial Officer since 1 October 2011 Appointed until 30 September 2014 Karlsruhe
As of 15 February 2012
Dr. Hans-Josef Zimmer born 1958 in Merzig Member of the Board of Management Chief Technical Officer since 1 January 2012 Appointed until 31 December 2016 Steinfeld (Rhineland-Palatinate)
Board of Management
Time to act
Management report
Financial statements
Corporate governance
Service
‹
_ 9

Report of the Supervisory Board
The Supervisory Board performed the tasks required of it by law and the articles of incorporation and bylaws in the fiscal year 2011. It monitored the company’s management, advised the Board of Management on corpo-rate governance and was involved in all major decisions. The Board of Management kept the Supervisory Board informed regularly, without delay and comprehensively of all significant aspects of business development and policy, corporate strategy and planning, the economic position of the company and the group as well as of the risk situation, risk management, the internal control system and compliance. Variances between the actual busi-ness development and previously formulated plans and targets were described and explained to the Supervisory Board in detail in each case.
Key topics of the board meetings
At seven ordinary meetings held on 23 February 2011, 18 April 2011, 19 April 2011, 9 June 2011, 7 July 2011, 22 Sep-tember 2011 and 8 December 2011, six extraordinary meetings on 17 January 2011, 17 March 2011, 13 April 2011, 28 July 2011, 12 September 2011 and 25 October 2011 as well as in four circular resolutions, the Supervisory Board dealt in depth with oral and written reports and draft resolutions of the Board of Management. In addition, it requested reports and details from the Board of Management on specific topics. These were provided imme-diately and comprehensively in each case. Discussions and the resolutions focused on the following issues:
› Regular in-depth reports of the Board of Management on the development of business and the profitability of the company and the group, including in particular the development of revenue and earnings as well as the financial position
› Intensive consultations and discussions with the Board of Management on EnBW’s strategic alignment
› Extensive examination of the consequences resulting from events at the Japanese nuclear power plant Fukushima Daiichi, the subsequent energy policy decisions taken by the federal government and the lower house of the German parliament as well as their impact on EnBW
› Detailed examination of the financial burdens caused by the above-mentioned changes in economic condi-tions, the nuclear fuel rod tax and impairment losses recognised on investments as well as the package of measures prepared by the Board of Management to improve the company’s results of operations and ability to invest, in particular by means of the “Fokus” efficiency programme, divestitures and capital measures
› Extensive and regular reporting on and intensive examination of the issues surrounding EWE Aktiengesell-schaft / VNG-Verbundnetz Gas Aktiengesellschaft
› Resolution regarding the issue of a hybrid bond with a volume of up to € 1 billion and a maximum coupon of 7.75%, of which € 750 million has been issued to date
› Fundamental decision on approval of the construction of a highly efficient gas and steam turbine plant enabling Stadtwerke Düsseldorf AG to generate electricity and heating by means of combined heat and power generation at the Lausward location
› Resolution on the joint statement by the Board of Management and Supervisory Board pursuant to Sec. 27 German Securities Acquisition and Takeover Act (WpÜG) on the voluntary public takeover offer by NECKARPRI GmbH, an entity wholly owned by the federal state of Baden-Württemberg
› Approval of the sale of 4,987,269 shares (15.05%) held in the Swiss entity Energiedienst Holding AG (EDH) to Services Industriels de Genève (SIG) as well as of the conclusion of an electricity supply agreement between EnBW Trading GmbH (ETG) and SIG for a period of ten years
› Approval of the sale of three Polish investments (32.45% in Elektrownia Rybnik S.A., 15.59% in Zespol Elektro-cieplowni Wroclawskich Kogeneracja S.A. and 25% in EDF Polska CUW Sp. z.o.o.) to Electricité de France S.A.
› Intensive examination of the investment in Turkey (Borusan EnBW Enerji A.S. joint venture)
› Approval of the conclusion of a new agency and management for Bexbach power station with Evonik Power Saar GmbH for a period of six years until 31 December 2016
› Proposals to the annual general meeting on 19 April 2011, in particular for the re-election of the shareholder representatives on the company’s Supervisory Board
10 _

› Regular reports on the progress made in the construction of the new RDK 8 hard coal power station in Karlsruhe and the EnBW Windpark Baltic 1 and EnBW Wind-park Baltic 2 offshore wind farms off the German coast of the Baltic Sea as well as other projects initiated as part of the energy generation strategy
› Examination of the decommissioning of Obrigheim nuclear power plant
› Examination of the situation concerning transmissions grids, in particular the issues of system security and EnBW’s fundamen-tal approach
› Examination of the issue of franchises in Baden-Württemberg
› Approval of the budget for the 2012 fiscal year and acknowledgement of the mid-term planning for the period from 2012 to 2014 consisting of income statement, balance sheet and cash flow statement
Between the meetings, the Supervisory Board was informed in writing by the Board of Management about all business events of par-ticular importance for the company or the group. In addition, there was constant com-munication between the Supervisory Board chairman and the Board of Management, in particular the CEO, to discuss issues relating to the strategic orien-tation, business development, risk management and important individual transactions.
The Supervisory Board meetings were all well attended. The only Supervisory Board members unable to attend more than half of the Supervisory Board meetings in fiscal year 2011 before they left the Supervisory Board on 17 February 2011 were Marianne Laigneau, Pierre Lederer, Serge Massart and Thomas Piquemal.
Work of the committees
The committees established by the Supervisory Board met regularly in the fiscal year 2011, assisting it in the efficient performance of its duties. The members of the committees are presented on page 221 of the annual report. Reports on the discussions and resolutions of the committees were made at the start of each Super-visory Board meeting.
The personnel committee met nine times in the past fiscal year, where it primarily discussed changes on the Board of Management and prepared a basis for the Supervisory Board’s appointment decisions. The personnel committee also reviewed the remuneration of the members of the Board of Management and prepared resolu-tions on these matters for the Supervisory Board. In addition, it discussed the principles of leadership develop-ment and long-term successor planning with the Board of Management.
At its five meetings the finance and investment committee took a detailed look at EnBW’s financial, liquidity and earnings situation as well as the budget for the fiscal year 2012 and mid-term planning for the period from 2012 to 2014. It also reviewed current investment plans and prepared decisions on these matters for the Supervisory Board. In addition, the finance and investment committee approved the projects transferred to it for decision-making on behalf of the entire Supervisory Board in accordance with the rules of procedure of the Supervisory Board, in particular the acquisition of shares in Windpark Eisenach II GmbH.
Dr. Claus Dieter Hoffmann, Chairman of the Supervisory Board
Report of the Supervisory Board
Time to act
Management report
Financial statements
Corporate governance
Service
‹
_ 11

The audit committee discussed issues relating to financial reporting, risk management and compliance as well as monitoring the accounting process, the statutory audit, additional services rendered by the independent audi-tor, the effectiveness of the internal control system, the internal risk management system and the internal audit system at its four ordinary meetings. After obtaining the independence declaration required by No. 7.2.1 of the German Corporate Governance Code from the auditor, it engaged the auditor to audit the financial statements, negotiated the fees and determined the focal points of the audit. The audit committee took an in-depth look at the quarterly financial report as of 31 March 2011, examined the six-monthly financial report as of 30 June 2011 in the presence of the auditor and discussed them – as well as the nine-monthly financial report as of 30 Septem-ber 2011 – in detail with the Board of Management. In preparation for the Supervisory Board’s closing meeting, it also reviewed the separate and consolidated financial statements as of 31 December 2011 and the combined management report for fiscal 2011.
The nomination committee prepared the Supervisory Board’s nomination proposals to the annual general meeting on 19 April 2011 and passed various resolutions at three meetings and in one circular resolution on the exercising of ownership rights within in the EnBW group as part of the duties assigned to it by the share-holder representatives on the Supervisory Board pursuant to Sec. 32 German Co-determination Act (MitbestG).
The ad hoc committee set up in fiscal year 2010 met six times and passed one resolution by written circula-tion in the fiscal year. It is tasked with monitoring investigations and the filing of claims for damages relating to potential irregularities in the business relations with certain Russian business partners.
The mediation committee created in accordance with Sec. 27 (3) German Co-determination Act (MitbestG) did not have to be convened in the reporting period.
Corporate governance
The Supervisory Board once again scrutinised corporate governance issues in fiscal year 2011. The corporate governance report details these issues on pages 208 to 218 of the annual report.
The annual efficiency inspection of the Supervisory Board was held at its meeting on 7 July 2011. This inspection identified ways of further optimising the board and committee work which were then implemented. The amended German Corporate Governance Code dated 26 May 2010 and its implementation at EnBW was the subject of the Supervisory Board’s meeting on 8 December 2011. At the meeting, the Supervisory Board also received the report of the corporate governance officer and issued the declaration of compliance with the German Corporate Governance Code in accordance with Sec. 161 German Stock Corporations Act (AktG). The Board of Management had previously issued an identical declaration at its meeting on 29 November 2011. EnBW complied with the recommendations of the amended Code dated 26 May 2010 with the exception of the recommendations pursuant to No. 5.4.1. (2) and (3) (specification of concrete objectives regarding the composition of the Supervisory Board) and intends to comply with all recommendations of the Code in future without exception. The most recent declaration of compliance is made available permanently to the shareholders on EnBW’s internet pages together with the declarations of prior years and is reprinted in full in the corporate governance report on pages 217 to 218 of the annual report.
Audit of the separate and consolidated financial statements
KPMG AG Wirtschaftsprüfungsgesellschaft (KPMG), Berlin, was elected by the annual general meeting held on 19 April 2011 as auditor for the separate financial statements and the consolidated financial statements and as independent auditor for the review of the condensed financial statements contained in the six-monthly financial report. The audit committee engaged KPMG for the audits and determined the focal points for the audit of the separate financial statements and the consolidated financial statements.
As requested, KPMG reviewed the condensed financial statements and interim management report contained in the six-monthly financial report as of 30 June 2011, and issued an unqualified review report thereon in accordance with the provisions of the German Securities Trading Act (WpHG). The auditor reported on the audit work and
12 _

the results of the audit to the members of the audit committee at their meeting on 28 July 2011 and was available to answer questions. No objections to the six-monthly financial report were raised by the committee members.
Based on the audit focus defined by the audit committee and including the accounting records, KPMG audited the financial statements of EnBW Energie Baden-Württemberg AG as of 31 December 2011 prepared by the Board of Management in accordance with the German Commercial Code (HGB) and the consolidated financial state-ments prepared in accordance with International Financial Reporting Standards (IFRSs) as well as the combined management report for fiscal 2011. The audits did not give rise to any objections and an unqualified opinion was rendered in each case. The auditor also subjected the monitoring system for the early detection of risks estab-lished by the Board of Management in accordance with Sec. 91 (2) German Stock Corporations Act (AktG) to a thorough review and confirmed that it is capable of fulfilling its purpose.
The draft audit reports issued by the independent auditor on the separate financial statements and on the consolidated financial statements (including the combined management report) were sent to the members of the audit committee well in advance of the committee meeting on 10 February 2012. Each of these contained a draft of the financial statements as well as the proposal put forward by the Board of Management for the appro-priation of profits. At that meeting, the auditor reported on the main results of its audit and was available to answer questions from committee members. The auditor reported to the committee members that no material weaknesses had been identified in the financial reporting internal control system and informed the committee members of the services it had rendered in addition to the audit and that there were no circumstances which could raise independence issues. The audit committee examined in detail the financial statements and drafts of the audit reports. Having conducted its own review, the audit committee did not raise any objections against the separate and consolidated financial statements, the combined management report or the proposal for the appropriation of profits. It recommended the Supervisory Board to approve the financial statements and the combined management report and the proposal from the Board of Management for the appropriation of profits.
Following the detailed examination by the audit committee, the audit reports and financial statements as well as the proposal for the appropriation of profits were made available to all Supervisory Board members in good time before the Supervisory Board’s closing meeting on 6 March 2012. At the meeting, the auditor reported on the main results of its audit and that no material weaknesses in the financial reporting internal control system had come to their attention during the audit and was available to answer questions from board members. The auditor also informed the Supervisory Board of the services it had rendered in addition to the audit and that there were no circumstances which could raise independence issues. In addition, the chair of the audit committee gave a detailed report on the deliberations and outcome of the audit committee meeting. She was also available to answer any questions of the other board members. The Supervisory Board took the findings of the auditor and the audit committee into account in its subsequent work.
The Supervisory Board then in turn reviewed in depth the separate and consolidated financial statements as of 31 December 2011, the combined management report for fiscal 2011 and the Board of Management’s proposal for the appropriation of profits for fiscal 2011. The Supervisory Board did not have any reservations following its own review. It agreed with the audit results presented by the independent auditor, approved the separate financial statements prepared by the Board of Management as of 31 December 2011 – which have thus been ratified – and the consolidated financial statements as of 31 December 2011 and the combined management report for fiscal 2011 and agreed with the Board of Management’s proposal for the appropriation of profits for the fiscal year 2011.
The report prepared by the Board of Management pursuant to Sec. 312 German Stock Corporations Act (AktG) on the relations of the company to affiliated entities (dependent company report) was reviewed by KPMG. The independent auditor issued the following opinion on 15 February 2012:
“Based on our audit and assessment in accordance with professional standards, we confirm that1. the actual disclosures contained in the report are correct,2. the payments made by the company in connection with transactions detailed in the report were not unreason-
ably high, nor were disadvantages offset,3. there are no circumstances that would require a materially different assessment of the measures listed in the
report than that of the Board of Management.”
Report of the Supervisory Board
Time to act
Management report
Financial statements
Corporate governance
Service
‹
_ 13

The draft dependent company report was sent to the members of the audit committee together with the other audit documents and drafts of the audit report well before their meeting on 10 February 2012. At that meeting, the audit committee discussed the draft dependent company report in detail. The independent auditor provided information on the main results of the audit and was available to answer questions of committee members. Having conducted its own careful review, the audit committee did not raise any objections to the dependent com-pany report. The dependent company report was then made available for inspection by the Supervisory Board members in good time ahead of the closing meeting on 6 March 2012. The auditor also participated in the dis-cussion of the report at the closing meeting and reported on any significant audit findings. In addition, the chair of the audit committee gave a report on the review of the dependent company report by the audit committee.
Based on the auditor’s and the audit committee’s findings, the Supervisory Board reviewed in depth the dependent company report for completeness and accuracy, approved the result of the audit and came to the con clusion that no objections have to be made to the declaration of the Board of Management made at the end of the dependent company report.
Personnel changes on the Board of Management and the Supervisory Board
Board of ManagementThere were various personnel changes on the Board of Management in the course of the past fiscal year.
At its meeting on 17 January 2011, the Supervisory Board appointed Thomas Kusterer to EnBW’s Board of Management, at the recommendation of the personnel committee, for a term of three years commencing 1 April 2011. Thomas Kusterer had previously been CFO at EDF Energy plc, London, and assumed the position of CFO on EnBW’s Board of Management. Until then, the functions and group entities assigned to the finance portfolio had been assigned temporarily to the other members of the Board of Management since the extended health-related absence and subsequent departure of the previous CFO, Dr. Rudolf Schulten.
Christian Buchel, who had been a member of the Board of Management since 1 February 2009, resigned from his office on 31 May 2011 with immediate effect. Responsibility for the functions and group entities assigned to the operations portfolio were subsequently assigned temporarily to the other members of the Board of Management. At its meeting on 12 September 2011, the Supervisory Board appointed Dr. Dirk Mausbeck to the Board of Management, at the recommendation of the personnel committee, for a term of three years commencing 1 October 2011. Dr. Dirk Mausbeck had previously been general manager at EnBW Trading GmbH responsible for energy economics and assumed the position of Chief Commercial Officer on EnBW’s Board of Management. At its meeting on 8 December 2011, the Supervisory Board appointed Dr. Hans-Josef Zimmer to the Board of Management, at the recommendation of the personnel committee, for a term of five years commencing 1 January 2012, who assumed the position of Chief Technical Officer on EnBW’s Board of Management. Dr. Hans-Josef Zimmer was EnBW’s Chief Technology Officer between 2007 and 2010 and had resigned of his own volition in 2010 in order to pave the way for a fully independent review of the business relationships between EnBW and Russian business partners. He was reappointed to the Board of Management after the review of these matters had been completed.
Supervisory BoardThere were also several personnel changes to the Supervisory Board in the course of the fiscal year 2011.
Dr. Daniel Camus and Marc Boudier retired from their offices, leaving the Supervisory Board effective as of the end of the day on 9 January 2011 and 16 January 2011, respectively. By resolution of the Mannheim district court, Marianne Laigneau, (Group Senior Executive Vice President, Human Resources) at Electricité de France, S.A., and Serge Massart, (Senior Vice-President reporting to the Group Senior Executive Vice President in charge of Generation and Engineering) at Electricité de France, S.A., were both appointed to the Supervisory Board effec-tive 12 January 2011 and 17 January 2011, respectively.
14 _

Following execution of the share purchase agreement between NECKARPRI GmbH, an entity wholly owned by the federal state of Baden-Württemberg, and Electricité de France International S.A., Marianne Laigneau, Pierre Lederer, Serge Massart, Thomas Piquemal and Gérard Roth each resigned from the Supervisory Board and ceased to be members of the Supervisory Board at the end of the day on 17 February 2011. By resolution of the Mannheim district court, Dr.-Ing. Rainer Dulger (Executive Vice President of ProMinent Dosiertechnik GmbH), Prof. Dr. Dr. h.c. mult. Wolfgang Franz (President of Zentrum für Europäische Wirtschaftsforschung GmbH) and Dr. Hubert Lienhard (CEO of Voith GmbH) were appointed to the Supervisory Board effective 21 Febru-ary 2011, as nominated by NECKARPRI GmbH. Further nominations were Prof. Dr. Ulrich Goll (member of the state parliament of Baden-Württemberg, minister of justice and deputy prime minister of the federal state of Baden-Württemberg) and Helmut Rau (member of the state parliament of Baden-Württemberg, minister at the state ministry of the federal state of Baden-Württemberg) were appointed to the Supervisory Board effective 10 March 2011 and 8 March 2011, respectively.
The term of office of all members of the Supervisory Board ended with the annual general meeting held on 19 April 2011. The employees of the EnBW group elected their representatives on the Supervisory Board effective as of the close of the annual general meeting on 19 April, 2011 at the general assembly on 14 April 2011. Dietrich Herd, Wolfgang Lang, Klaus Schörnich and Dietmar Weber were re-elected as representatives of the company’s employees, Dr. Michael Zinow as management representative and Marianne Kugler-Wendt, Reiner Koch and Bodo Moray as representatives of the ver.di trade union. Arnold Messner and Bernd Munding were newly appointed to the Supervisory Board. Josef Götz and Christoph Walther did not stand for election again. The shareholder representatives on the Supervisory Board were elected during the annual general meeting on 19 April 2011, with Dr.-Ing. Rainer Dulger, Dirk Gaerte, Prof. Dr. Ulrich Goll, Dr. Claus Dieter Hoffmann, Dr. Hubert Lienhard, Helmut Rau, Heinz Seiffert, Gerhard Stratthaus and Kurt Widmaier being re-elected to the Supervisory Board. Gunda Röstel, managing director of Stadtentwässerung Dresden GmbH and authorised signatory at Gelsenwasser AG, was newly elected to the Supervisory Board.
At the founding meeting of the Supervisory Board on 19 April 2011, Dr. Claus Dieter Hoffmann was re-elected chairman of the Supervisory Board and Dietrich Herd was re-elected deputy chairman of the Supervisory Board.
Dr.-Ing. Rainer Dulger retired from his office, leaving the Supervisory Board effective as of the end of the day on 30 June 2011. By resolution of the Mannheim district court, Dr. Nils Schmid, deputy prime minister of the federal state of Baden-Württemberg, minister of finance and economy of Baden-Württemberg and member of the state parliament of Baden-Württemberg, was appointed to the Supervisory Board effective 1 July 2011.
Prof. Dr. Ulrich Goll and Helmut Rau also retired from their offices, leaving the Supervisory Board effective as of the end of the day on 9 July 2011. By resolution of the Mannheim district court, Silke Krebs, minister at the state ministry of Baden-Württemberg, and Günther Cramer, supervisory board chairman of SMA Solar Technology AG, were appointed to the Supervisory Board effective 10 July 2011.
The Supervisory Board would like to thank all members who have left the board for their commitment to the company and the trusting and constructive working relationship.
The Supervisory Board would like to thank the members of the Board of Management and all employees in acknowledgement of their personal commitment and dedicated work in fiscal 2011.
Karlsruhe, 6 March 2012The Supervisory Board
Dr. Claus Dieter HoffmannChairman
Report of the Supervisory Board
Time to act
Management report
Financial statements
Corporate governance
Service
‹
_ 15

16 _
Time to act
17 Values, goals, strategy
18 Safeguarding low-carbon generation capacity
19 Establishing local solution offers
20 Developing a forward-looking business model
22 EnBW on the capital market
22 Active on the debt market
22 EnBW’s bonds and share
24 Investor relations
24 Change in the shareholder composition
26 Actively shaping the new energy concept
26 Safeguarding low-carbon generation capacity: efficient, safe, sustainable
28 Offering local energy solutions: based on partnership, smart and environmentally friendly
30 Encouraging dialogue, public participation and partnerships: committed, cooperative, proactive
32 Assuming responsibility: reliable, motivated, forward-looking
34 Creating a new energy world for our customers: transparent, individual, innovative

Time to act
Values, goals, strategy ‹
Management report
Financial statements
Corporate governance
Service
_ 17
EnBW continues to develop its business model with a view to safeguarding the company’s future
sustainability. Investment in renewable energies keeps CO2 emissions at a low level. Extending EnBW’s
portfolio of local energy services increases the group’s value as a partner in energy issues. Measures in
three areas – increasing efficiency, divestitures, capital measures – ensure that the strategy is underpinned
by sound financing.
Safeguarding future sustainability
With just under 13,500 MW of generation capacity and around 5.5 million customers, EnBW is one of the most important energy supply companies and energy service providers in Germany and Europe. We intend to reinforce and expand this position. The environment for our business activities is currently changing more quickly and radically than ever before. Consequently, EnBW has made its objective to actively address and influence this change with a view to safeguarding the company’s future sustainability. In doing so, we will stand by the fundamental values and goals that we defined as the company’s mission and vision in 2009.
Our mission We stand for progress and competition in the energy market to the benefit of our customers.
Our vision Our deep roots in Baden-Württemberg and our exceptional performance combined with a well-balanced business portfolio make us one of the leading European energy groups.
At the same time, we have sharpened the focus of our strategy and adjusted it to two central strategic moves:
Values, goals, strategy
18 _
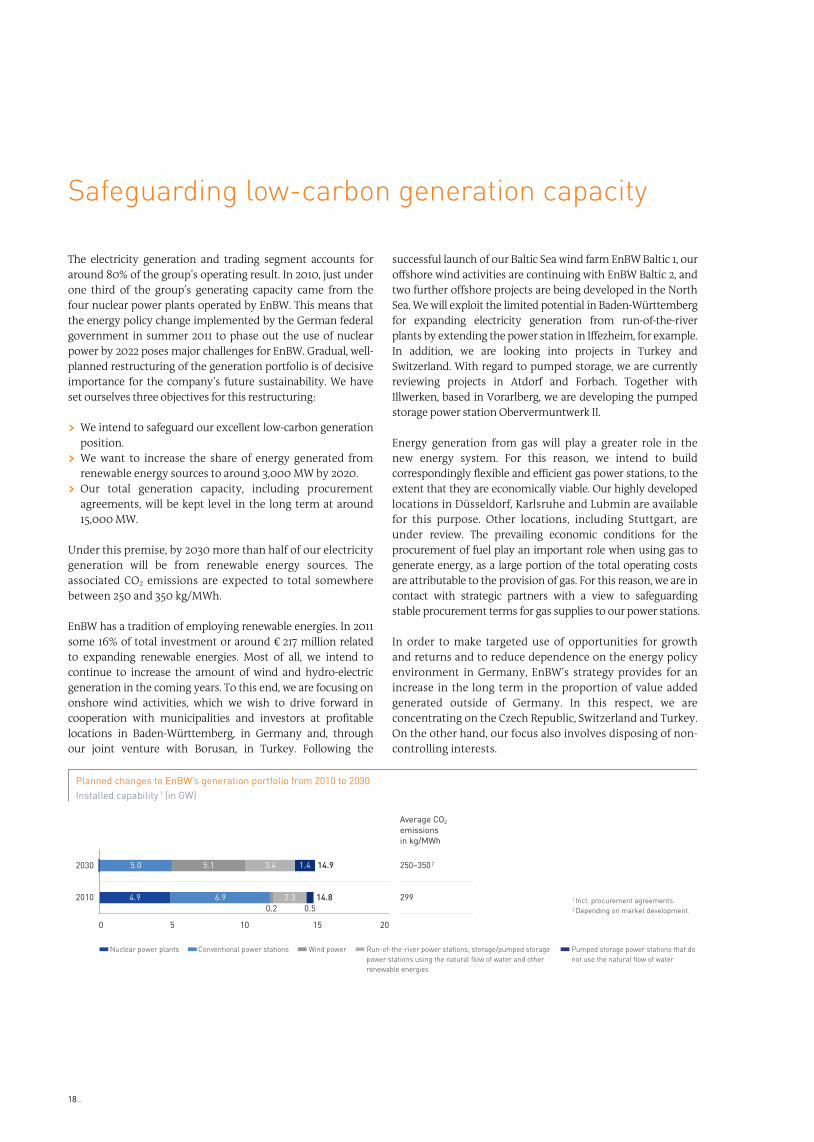
The electricity generation and trading segment accounts for around 80% of the group’s operating result. In 2010, just under one third of the group’s generating capacity came from the four nuclear power plants operated by EnBW. This means that the energy policy change implemented by the German federal government in summer 2011 to phase out the use of nuclear power by 2022 poses major challenges for EnBW. Gradual, well-planned restructuring of the generation portfolio is of decisive importance for the company’s future sustainability. We have set ourselves three objectives for this restructuring:
› We intend to safeguard our excellent low-carbon generation position.
› We want to increase the share of energy generated from renewable energy sources to around 3,000 MW by 2020.
› Our total generation capacity, including procurement agreements, will be kept level in the long term at around 15,000 MW.
Under this premise, by 2030 more than half of our electricity generation will be from renewable energy sources. The associated CO2 emissions are expected to total somewhere between 250 and 350 kg/MWh.
EnBW has a tradition of employing renewable energies. In 2011 some 16% of total investment or around € 217 million related to expanding renewable energies. Most of all, we intend to continue to increase the amount of wind and hydro-electric generation in the coming years. To this end, we are focusing on onshore wind activities, which we wish to drive forward in cooperation with municipalities and investors at profitable locations in Baden-Württemberg, in Germany and, through our joint venture with Borusan, in Turkey. Following the
successful launch of our Baltic Sea wind farm EnBW Baltic 1, our offshore wind activities are continuing with EnBW Baltic 2, and two further offshore projects are being developed in the North Sea. We will exploit the limited potential in Baden-Württemberg for expanding electricity generation from run-of-the-river plants by extending the power station in Iffezheim, for example. In addition, we are looking into projects in Turkey and Switzerland. With regard to pumped storage, we are currently reviewing projects in Atdorf and Forbach. Together with Illwerken, based in Vorarlberg, we are developing the pumped storage power station Obervermuntwerk II.
Energy generation from gas will play a greater role in the new energy system. For this reason, we intend to build correspondingly flexible and efficient gas power stations, to the extent that they are economically viable. Our highly developed locations in Düsseldorf, Karlsruhe and Lubmin are available for this purpose. Other locations, including Stuttgart, are under review. The prevailing economic conditions for the procurement of fuel play an important role when using gas to generate energy, as a large portion of the total operating costs are attributable to the provision of gas. For this reason, we are in contact with strategic partners with a view to safeguarding stable procurement terms for gas supplies to our power stations.
In order to make targeted use of opportunities for growth and returns and to reduce dependence on the energy policy environment in Germany, EnBW’s strategy provides for an increase in the long term in the proportion of value added generated outside of Germany. In this respect, we are concentrating on the Czech Republic, Switzerland and Turkey. On the other hand, our focus also involves disposing of non-controlling interests.
Safeguarding low-carbon generation capacity
1 Incl. procurement agreements.2 Depending on market development.
Planned changes to EnBW’s generation portfolio from 2010 to 2030Installed capability 1 (in GW)
Pumped storage power stations that do not use the natural flow of water
Run-of-the-river power stations, storage/pumped storage power stations using the natural flow of water and other renewable energies
Wind powerConventional power stationsNuclear power plants
20
2030
2010
0 5 10 15
4.9 6.90.2 0.5
2.3 14.8
14.95.0 5.1 3.4 1.4
299
Average CO2 emissions in kg/MWh
250–350 2

Time to act
Values, goals, strategy ‹
Management report
Financial statements
Corporate governance
Service
_ 19
At EnBW, customers are at the focal point of all considerations. Retail, business and industrial customers as well as municipal utilities and municipalities are increasingly requesting energy solutions and concepts that go beyond simple supplies of electricity and gas. These have to be implemented at a local level with the involvement of our customers and partners, as well as in dialogue with the general public. EnBW is pressing ahead with the expansion of local energy generation, primarily in the area of renewable energies, it is setting up holistic products – for example the “sustainable town” approach – and provides operating functions, such as invoicing and settlement systems, as services to third parties.
For decades, the entire energy infrastructure in Germany has been geared to generating electricity and heat in large-scale plants and transporting the same through transmission and distribution grids. With the decision to implement the new energy concept, energy supplies in future will move in the direction of energy consumption, preferably on the basis of renewable energy sources. The idea is to organise this development with the involvement of customers, municipalities and municipal utilities. In this respect, acceptance among the general public and municipalities is of decisive importance. EnBW is responding to the efforts on the part of municipalities to achieve a greater level of decentralisation and independence in supplies and is establishing itself as a provider of local solutions.
By offering local solutions such as the “sustainable town”, EnBW supports municipalities in the development and economic implementation of individual energy services. In Leutkirch, for example, EnBW is cooperating with partners and the municipal authorities to develop a concept for sustainable town development (> www.nachhaltige-stadt-leutkirch.de).
Our sales department is developing a wide range of new products in order to meet the change in demand. We are responding to these changes primarily with local energy services such as nationwide provision of services in the field of photovoltaics, e-mobility and smart home as well as energy services for retail, business and industrial customers, municipal utilities and municipalities.
Another field of cooperation as partners at a local level are models involving participation in our grids. We contribute our strengths in grid management to the cooperation with municipal utilities and municipalities. Together, we address the challenges of managing renewable and local generation in the context of building up smart grids. In addition, we offer participation models for large-scale projects such as our offshore wind farms EnBW Baltic 1 and EnBW Baltic 2, which individual municipal utilities and municipalities would not be able to implement. Development partnerships are also conceivable, in the context of onshore wind projects, for example.
Furthermore, the existing operating functions such as invoicing and settlement systems provide considerable opportunities to generate earnings and synergies for EnBW and potential partners. In a similar way to what has already proven itself in practice in other industries, we intend to achieve economies of scale for administrative functions by making EnBW’s internal services accessible to third parties. These arise primarily from fixed IT costs leverage. It is our long-term goal to become the leading provider of energy industry back-office solutions in Germany.
Structure
Commodity
electricity, gas, heat, distribution
Customers
households/businesses, industry/municipal utilities, municipalities
Analysis and consulting
for example, energy concepts, DIN 16001, load analyses,
thermography, energy report, building energy pass
Own generation/supply (grids)/sales
for example, contracting, back-office platform, asset service
New applications for electricity
smart meter, smart home, e-mobility
Establishing local solution offers

20 _
Sound financing of the realignment EnBW’s realignment – that can be identified by the two strategic moves “safeguarding low-carbon generation capacity” and “establishing local solution offers” – will require considerable investments in coming years. At the same time, our financial headroom has come under severe constrictions on account of the energy policy decisions made in the recent past: the shutdown of two units of our nuclear power plants, GKN I and KKP 1, the introduction of the nuclear fuel rod tax and the need to recognise a higher level of impairment losses and provisions on account of the final phase-out of nuclear power in Germany. Similarly, the delay in the commissioning of the RDK 8 and GKM 9 power stations on account of manufacturing and quality problems at suppliers have reduced earnings. Falling margins on the wholesale market and the full auctioning of CO2 allowances as of 2013 will place an additional burden on EnBW’s earnings power over the next few years. In order to counter such negative developments and to address the forward-looking restructuring of the company without jeopardising our good financial standing, EnBW has put together a comprehensive package of measures. It consists of the three levers of increasing efficiency, divestitures and capital measures.
EnBW is implementing the necessary measures to increase efficiency under the umbrella of the “Fokus” project. This project has been in place since autumn 2010 and was initially designed to achieve a sustainable volume of improvements totalling € 300 million p.a. In light of the more restrictive operating environment, we raised the target volume affecting EBIT to € 750 million p.a. in September 2011. The measures are scheduled to be fully developed by the end of 2014 and thereafter to take full effect in the long term. The total volume includes a sustained contribution by employees of € 250 million p.a. The first measures to reduce personnel costs were agreed between EnBW and the trade union under the “Fokus” collective agreement in December 2011. EnBW anticipates great potential for improvement from reducing the complexity of the group. The central management of essential functions is to be strengthened and efficiency boosted by reducing the number of interfaces throughout the group.
The plans are to increase the volume of divestitures relating to the sale of non-strategic investments and optimisation of shareholdings by € 0.5 billion to € 1.5 billion. These include the contractually agreed sale of our non-controlling interests in power stations in Poland and reducing our investment in Energiedienst Holding AG in Switzerland; there are plans to divest our investment in the Austrian energy supplier EVN. Together with other effects, for example those in conjunction with the participation of municipalities and municipal utilities in new offshore and onshore wind turbines, these transactions will give rise to a total divestiture volume of € 2.6 billion.
Capital measures are the third lever to ensure EnBW’s future sustainability. At the end of October 2011, EnBW successfully placed a hybrid bond with a volume of € 750 million on the capital market. Based on its terms and conditions, half of the amount of the bond will be recognised as equity by rating agencies until the first possible date of repayment in 2017. Furthermore, a general meeting of Zweckverband Ober-schwäbische Elektrizitätswerke (OEW) held mid-October 2011 declared its general willingness to support EnBW with further capital. With regard to a capital increase intended to be performed by EnBW in 2012, the general meeting of OEW passed a unanimous resolution on 27 January 2012 to participate in a capital increase at EnBW through its subsidiary OEW Energie-Beteiligungs GmbH with up to € 400 million. At the beginning of December, the state of Baden-Württemberg announced that it is likewise willing to subscribe to a capital increase at EnBW. On 15 February 2012, the state parliament decided on authorisation to grant the corresponding guarantees for the subsidiary wholly owned by the federal state, NECKARPRI GmbH, being included in the state’s 2012 budget legislation. This means that the requirements for NECKARPRI GmbH or an entity affiliated with it as defined by Sec. 15 German Stock Corporations Act (AktG) to participate in the intended capital increase, likewise with up to € 400 million, have been met.
Developing a forward-looking business model

Time to act
Values, goals, strategy ‹
Management report
Financial statements
Corporate governance
Service
_ 21
Employees shape change
Realigning a long-established company such as EnBW places demands on employees’ commitment, their expertise and their willingness to embrace change. A period of transition, such as we are experiencing with the new energy concept, has an impact on the working environment throughout the energy industry. It involves changes to the skills required of employees. With the introduction of a strategic competence management system, EnBW has prepared the group and its workforce for the challenges of a transition of this kind. Developing skills as needed not only ensures that our employees maintain their workplace and employment value but also promotes motivation and employee loyalty.
In order to ensure sufficient numbers of new hires and to retain the skills essential to the company’s success, it is important for EnBW to be perceived as an attractive employer. Alongside a wide range of tasks, we also offer our employees a range of measures aimed at striking a balance between their professional and private lives, for example flexible working hours, company health promotion and assistance with childcare services or support with family members in need of care.
The second employee survey conducted last year most recently revealed that the workforce identifies with their company. On the basis of this feedback, the focal point in 2011 was placed on determining and implementing the corresponding measures. This way the employee survey makes an important contribution to achieving improvements within the company. Also within the scope of our improvement programmes “!mpuls”, “WIN” and “KVP” (continuous improvement process), we strive, together with our employees, to make EnBW a little better each day. In 2011, our employees submitted a total of 3,561 suggestions for improvement to our work processes; 2,114 of these ideas related to improving efficiency in the employee’s own working area, the other suggestions related to general processes within the group.
A strong management team is especially important for a company in times of change. “In the lead” is a process launched by EnBW in 2010 to strengthen leadership performance within the group, focusing on nine predefined fields of action. “In the lead” provides the companies and individual executives with the freedom to set their own individual priorities and to further develop those strategic success factors for leadership they consider decisive.
Acting responsibly in a sustainable
manner
Acting responsibly in a sustainable manner is a core principle at EnBW. We strive towards linking sustainability strategy and company strategy in a targeted manner. Secure and reliable supplies of energy at competitive prices, the long-term growth of business value, sparing use of natural resources, climate protection, relationships between company and employees based on reconciliation of interests and a high degree of social responsibility form the basis of our business operations. For us, sustainability specifically means focusing innovation and growth on expanding renewable energies, energy efficiency services and sustainable towns, efficiently structuring internal processes with a view to ecological and social responsibility and involving employees and the general public to a greater degree.
With the increasing interlinking of corporate strategy and sustainability strategy, we are pursuing a number of objectives that benefit the company and its stakeholders and generate value added that is measurable not only in terms of finance. By acting in a sustainable manner, we intend to build up people’s trust in EnBW. By reacting to the demand on the part of customers and municipalities for sustainable energy services, we are opening up new areas of business for EnBW. A corporate strategy and management aligned to sustainability aspects furthermore promotes employee motivation and strengthens EnBW’s position on the capital market.
Energy supplies are a central pillar of the infrastructure of a society and its economy. The implementation of large-scale energy projects and the development and implementation of new energy solutions are, however, dependent to a significant extent on acceptance by the general public. Important mechanisms suitable to attain such acceptance are public dialogue and a culture of communication. These aspects are part of EnBW’s corporate image. In the fiscal year 2011, EnBW held a large number of informal talks with associations, trade unions, NGOs, churches and action groups and appeared in public forums. At the same time, we held three citizens’ workshops within the framework of the citizens’ dialogue: energy technology for the future project of the Federal Ministry of Education and Research. We wish to further intensify dialogue with the relevant stakeholder groups.
22 _
The price and returns of EnBW’s share and bonds were negatively impacted in 2011 by the changes in
energy policy and the euro debt crisis. Our A rating was confirmed at the end of 2011. With prompt and
transparent investor relations activities, we intend to retain and strengthen capital market players’ trust in
EnBW on an ongoing basis.
Active on the debt market
In order to finance business developments, EnBW draws not only on internal financing means but also on international markets for debt capital. A wide range of short- to long-term debt financing instruments ensures that we have flexible access to the capital market (> Management report > Financial position > p. 63ff). The constant basic criterion for all business decisions at EnBW is maintaining financial stability.
There were major changes in the energy policy environment in 2011. The resulting difficult operating market environment and the short- to medium-term effects will have a negative impact on EnBW’s earnings situation. EnBW has therefore concluded an extensive range of measures to meet the conditions for being awarded an A rating in the future. Expansion of the divestiture programme, implementation of capital measures and stepping up the “Fokus” efficiency programme with a view to maintaining the stable financial policy are the central pillars of the package of measures. The dynamic leverage ratio (adjusted net debt divided by adjusted EBITDA) is one of EnBW’s key financial performance indicators. The internal target figure is chosen in such a way that the performance figures necessary for maintaining an A rating are achieved. In their most recent updates, the rating agencies indicated that they are more critical in their assessment of the environment and earnings prospects for German energy supply companies. As in previous years we will review the appropriateness of the target figure and the management concept and adapt the same according to the expectations of the rating agencies where necessary.
Standard & Poor’s and Moody’s updated their assessments at the end of 2011. The rating agencies confirmed EnBW’s A rating (Fitch: A-/outlook stable, Moody’s: A3/outlook negative, Standard & Poor’s: A-/outlook stable). In order to further strengthen the capital structure, a hybrid bond for € 750 million was issued in October 2011, to which investors responded positively. All in all the maturity profile of the shares is well balanced. (> Management report > Financial position > p. 63ff)
EnBW’s bonds and share
In 2011, the concerns as to the budgetary and financial stability of some peripheral euro countries, that increased in the course of the year, had a negative impact on the price development of government bonds. The iBoxx € Eurozone index, which tracks the return on government bonds of a number of European countries, revealed extreme levels of volatility until August 2011. From the beginning of August to the end of September 2011, the index saw a significant rise in returns on account of Greece’s debt crisis coming to a head. Over the rest of the year, returns remained at a high level.
EnBW on the capital market
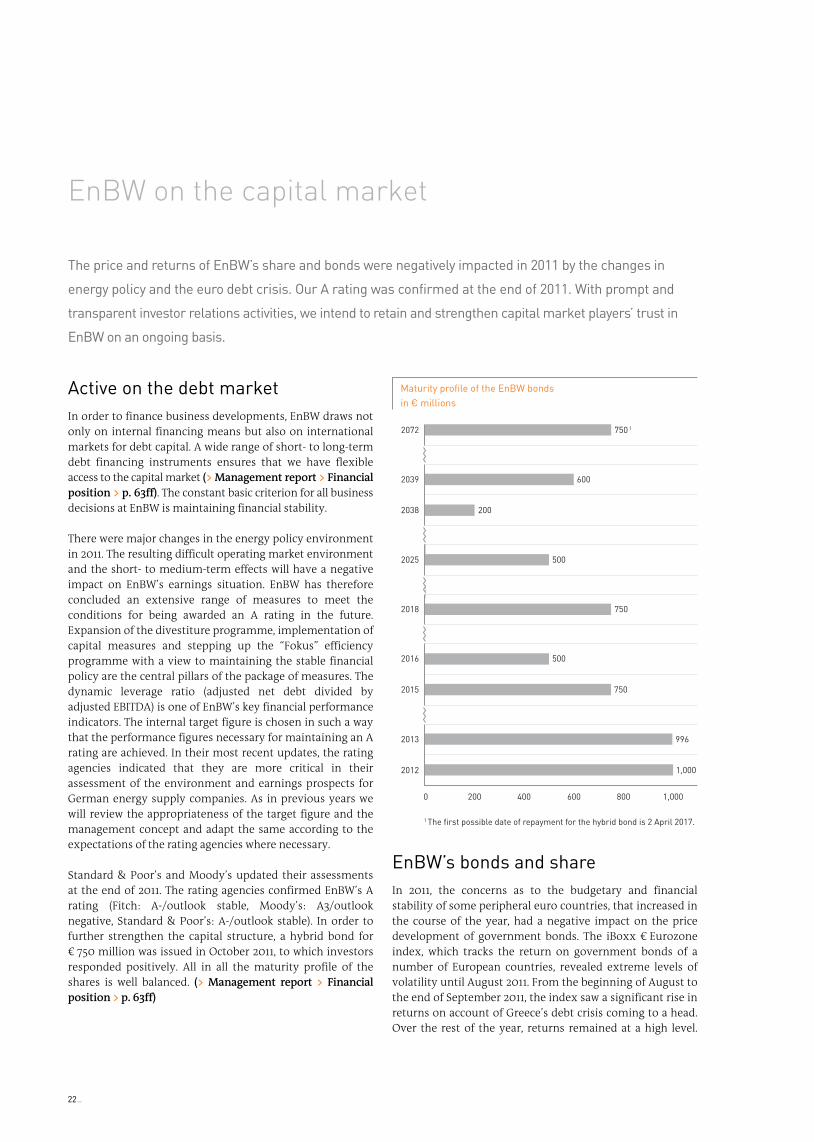
Maturity profile of the EnBW bonds in € millions
2039 600
2038 200
2025 500
2018 750
2016 500
2015 750
2013 996
2012 1,000
0 200 400 600 800 1,000
2072 750 1
1 The first possible date of repayment for the hybrid bond is 2 April 2017.

Time to act
EnBW on the capital market ‹
Management report
Financial statements
Corporate governance
Service
_ 23
The level of returns of the bonds issued by European utility companies listed in the iBoxx € Utilities index was similarly marked by a volatile market environment. Returns rose continually over 2011, from 3.92% to 4.01%. In the first half of the year EnBW’s bonds faced a rise in returns associated with
a fall in prices. The main reason for these developments was the uncertainty prevailing in the energy policy environment. Bond prices recovered again somewhat in the second half of the year.
EnBW Intl Finance BV | Coupon: 6.125% | Maturity: 7 July 2039
EnBW Intl Finance BV | Coupon: 4.125% | Maturity: 7 July 2015
July 2010 Sep. 2010
120
110
100
Nov. 2010 Jan. 2011 Mar. 2011 May 2011 July 2011 Nov. 2011Sep. 2011
Performance of the EnBW bonds in 2010/2011 (%)
140
130
The leading share index, the DAX, saw a significant rise at the beginning of 2011. It reached its high for the year of 7,600.41 points on 2 May 2011. The downturn in the global economy, negative economic indicators for the US economy and the intensification of the national debt crisis in the euro area resulted, as of August 2011, in dramatic falls in share prices at trading places. As of 30 December 2011, the DAX stood at 5,898.35 points, having fallen around 14.7% in comparison to year-end 2010 and 21.6% in comparison to the high for the year 2011. The general downward movement
also put pressure on the price of the EnBW share. Furthermore, the decision taken by the German federal government in July 2011 to phase out nuclear power led to significant declines in share prices on the part of all listed energy supply companies in Germany. At the end of 2011, the EnBW share stood at € 39.00, after € 40.99 seen at the beginning of the year. In the European context, the DJ EURO STOXX UTILITY index, which reflects the share price of European utilities, saw a significant drop of 25.3% over the year.
DAX 30
EnBW
90
80
70
Performance of the EnBW share in 2011 (%)
110
100
DJ EURO STOXX UTILITY
Jan. Mar.Feb. Apr. May June July Aug. Sep. Oct. Nov. Dec.

24 _
The EnBW share, which has been admitted for stock exchange trading since October 1997, is listed on the General Standard market of Frankfurt stock exchange and on the regulated market of Stuttgart stock exchange. Since December 2011, Commerzbank has been EnBW’s new designated sponsor.
Investor relations
The aim of our capital markets communication is to establish an open and continuous dialogue with investors, analysts and banks. We wish to serve the information needs of capital market participants promptly with transparent communications and strengthen their trust in EnBW as a company. In this respect, the main focus is on strategy, the associated prospects for the group’s future and also its operational development. (> www.enbw.com > Investors)
In 2011, the regular quarterly and annual financial reports were supplemented by conference calls and numerous investor relations communications throughout the year. Furthermore, we provide platforms for face-to-face communication by participating in investor conferences and organising our own events. In January 2011, we took part in two investor conferences, in Paris and New York. We postponed the traditional investor update in 2011 following the publication of the annual report 2010 in light of the events in Japan and the federal government’s suspension of the decision to extend the working lives of nuclear power plants. In 2012, we will resume our long tradition of the spring road shows. At the end of March, we visited a European Utilities Conference in London. At the beginning of April, we held our annual Bankers’ Day at the Neckarwestheim location, which was attended by around 60 representatives of banks. We met up with around 100 investors as part of an international road show at the beginning of September. The road show took place over three days with two teams at the financial centres in London, Frankfurt, Zurich, and Paris, as well as in Amsterdam and Munich. Important topics included the current situation of the company and the industry, the changes in the shareholder structure and details of the hybrid bond. The road show met with a positive response from investors. In light of the dramatic political and economic developments, we also arranged numerous face-to-face meetings with analysts and investors throughout the year to discuss current events and the implications for the energy industry and EnBW.
The trust placed in EnBW by capital market players also arises from the value generated by the company and in which our investors participate. The amount of the dividend is based on the performance of the company, the scope of
the investment programme, the volume of net financial liabilities and the dynamic leverage ratio. In principle, EnBW’s objective is to pay out 40% to 60% of adjusted group net profit as dividend. With regard to the financial burdens prevailing this year and with a view to the “Fokus” efficiency programme, the Board of Management will, in consultation with the Supervisory Board, propose to the 2011 annual general meeting that a dividend of € 0.85 per share be distributed. This would give rise to a total distribution volume of € 207.6 million and a distribution level of 32%.
In addition to new risks, the new energy policy framework also gives rise to new opportunities for EnBW. We will continue to actively communicate the strategic development of EnBW to the capital market in an ongoing dialogue in 2012. We are gradually expanding our communication activities in order to reflect EnBW’s position as a leading energy company in Europe and as an issuer on the capital market.
Change in the shareholder
composition
On 6 December 2010, the federal state of Baden-Württemberg announced that it intended to acquire the 45.01% shareholding in EnBW AG held by Electricité de France S.A. (EDF). On 17 February 2011, NECKARPRI GmbH, an entity wholly owned by the federal state of Baden-Württemberg, assumed the shareholding in EnBW AG held by EDF and, together with the federal state, entered into the already existing shareholder agreement with Zweckverband Oberschwäbische Elektrizitätswerke (OEW) and its wholly owned subsidiary OEW Energie-Beteiligungs GmbH (OEW GmbH). On 7 January 2011, NECKARPRI GmbH made a voluntary public takeover offer to all EnBW AG shareholders for a price of € 41.50 per EnBW share. The last bid deadline expired on 6 April 2011. The takeover offer was accepted for 7,704,472 EnBW shares (equivalent to 3.08% of the share capital of EnBW AG). On 5 April 2011, NECKARPRI GmbH formed the wholly owned subsidiary NECKARPRI-Beteiligungsgesellschaft mbH, to which it transferred the entire equity interest in EnBW AG it held as of this date and shortly afterwards the EnBW shares purchased under the takeover offer. NECKARPRI-Beteiligungsgesellschaft mbH entered into the shareholder agreement with OEW. In accordance with an agreement disclosed in the tender documents for the aforementioned voluntary takeover offer, NECKARPRI-Beteiligungsgesellschaft mbH transferred to OEW GmbH half of the shares transferred as part of the takeover process. This transaction performed on 11 April 2011 at the offer price was not part of the tender procedure and was aimed at restoring the parity of the shareholdings of the two major shareholders.

Time to act
EnBW on the capital market ‹
Management report
Financial statements
Corporate governance
Service
_ 25
EnBW share in figures 2011 2010 2009 2008 2007
Annual high € 43.00 43.00 41.10 61.00 60.84
Annual low € 31.90 35.00 34.00 33.02 48.01
Closing price € 39.00 40.92 40.00 37.7 60.16
Number of shares outstanding as of 31 December1 million shares 244.257 244.257 244.257 244.257 244.257
Market capitalisation as of 31 December2 € billions 9.5 10.00 9.8 9.2 14.7
Stock exchange trade (total) Number of shares 510,393 791,179 676,205 835,367 1,112,602
Stock exchange trade (daily average)
Number of shares 1,986 3,091 2,662 3,289 4,769
Earnings per share from group net profit3 € – 3.55 4.74 3.15 3.60 5.58
Operating cash flow per share € 7.12 10.48 10.00 6.24 6.38
Distribution € millions 207.64, 5 373.7 373.7 491.0 368.8
Dividends per share € 0.855 1.53 1.53 2.01 1.51
Number of shares outstanding (weighted average) million shares 244.257 244.257 244.257 244.257 244.257
1 Total number of shares: 250.006 million shares. 2 Number of shares outstanding at the end of the fiscal year multiplied by the closing price. 3 Prior-year figures restated. In relation to the loss/profit shares attributable to the equity holders of EnBW AG. 4 Distribution in terms of the shares entitled as of 31 December 2011. 5 Dividend proposal for the fiscal year 2011, subject to the approval of the annual general meeting on 26 April 2012.
Shareholder composition as of 31 December 20111
OEW Energie-Beteiligungs GmbH 46.55%
NECKARPRI-Beteiligungsgesellschaft mbH2 46.55%
Badische Energieaktionärs-Vereinigung 2.45%
EnBW Energie Baden-Württemberg AG 2.3%
Gemeindeelektrizitätsverband Schwarzwald-Donau 0.95%
Neckar-Elektrizitätsverband 0.69%
Landeselektrizitätsverband Württemberg 0.11%
Free float 0.4%
1 Figures rounded to two decimal places. 2 100% subsidiary of the federal state of Baden-Württemberg.
Stock exchange information
ISIN/security ident. no. DE0005220008/522000
Stock exchange abbreviation Bloomberg EBK GY/reutersEBK/EBKG.DE
Stock markets Regulated market: Frankfurt and Stuttgart; over-the-counter trading: Berlin, Munich
Transparency level General Standard
Indices General All Share, DAXsector All Utilities, CDAX
Share capital in number of shares 250,006,200
Class of share Ordinary no-par value bearer shares
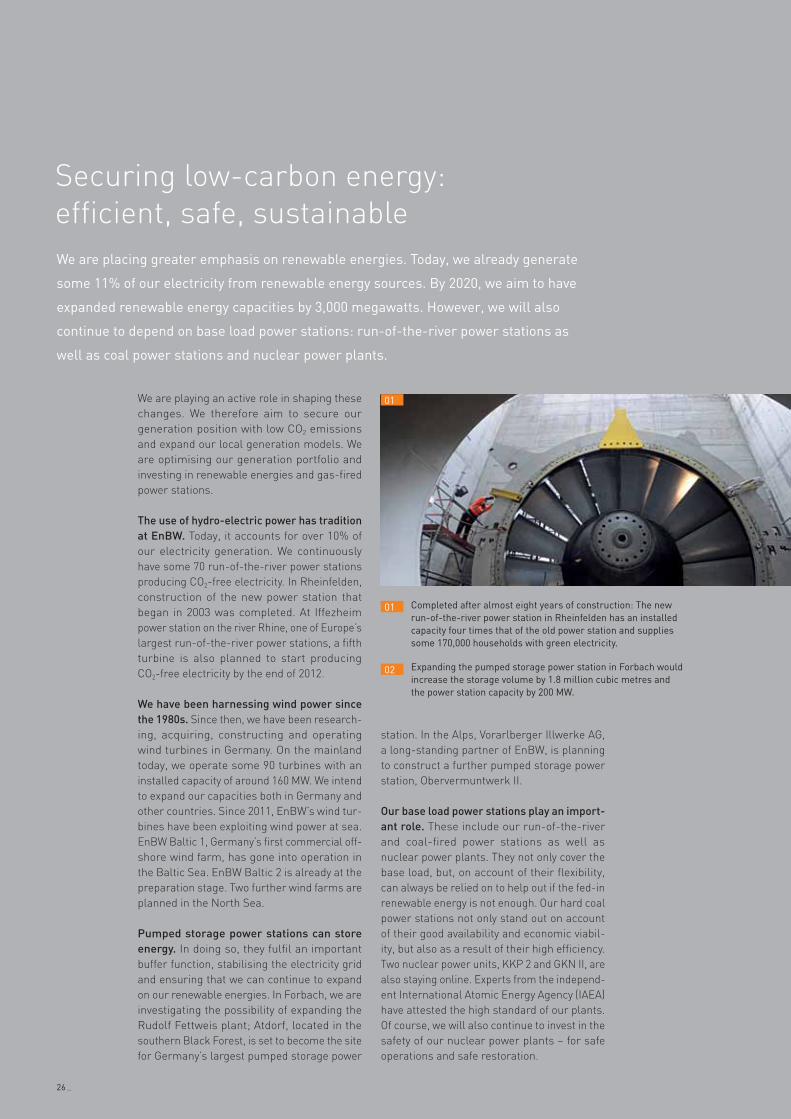
We are placing greater emphasis on renewable energies. Today, we already generate
some 11% of our electricity from renewable energy sources. By 2020, we aim to have
expanded renewable energy capacities by 3,000 megawatts. However, we will also
continue to depend on base load power stations: run-of-the-river power stations as
well as coal power stations and nuclear power plants.
Securing low-carbon energy:efficient, safe, sustainable
Completed after almost eight years of construction: The new run-of-the-river power station in Rheinfelden has an installed capacity four times that of the old power station and supplies some 170,000 households with green electricity.
Expanding the pumped storage power station in Forbach would increase the storage volume by 1.8 million cubic metres and the power station capacity by 200 MW.
01
02
station. In the Alps, Vorarlberger Illwerke AG, a long-standing partner of EnBW, is planning to construct a further pumped storage power station, Obervermuntwerk II.
Our base load power stations play an import-ant role. These include our run-of-the-river and coal-fired power stations as well as nuclear power plants. They not only cover the base load, but, on account of their flexibility, can always be relied on to help out if the fed-in renewable energy is not enough. Our hard coal power stations not only stand out on account of their good availability and economic viabil-ity, but also as a result of their high efficiency. Two nuclear power units, KKP 2 and GKN II, are also staying online. Experts from the independ-ent International Atomic Energy Agency (IAEA) have attested the high standard of our plants. Of course, we will also continue to invest in the safety of our nuclear power plants – for safe operations and safe restoration.
We are playing an active role in shaping these changes. We therefore aim to secure our generation position with low CO2 emissions and expand our local generation models. We are optimising our generation portfolio and investing in renewable energies and gas-fired power stations.
The use of hydro-electric power has tradition at EnBW. Today, it accounts for over 10% of our electricity generation. We continuously have some 70 run-of-the-river power stations producing CO2-free electricity. In Rheinfelden, construction of the new power station that began in 2003 was completed. At Iffezheim power station on the river Rhine, one of Europe’s largest run-of-the-river power stations, a fifth turbine is also planned to start producing CO2-free electricity by the end of 2012.
We have been harnessing wind power since the 1980s. Since then, we have been research-ing, acquiring, constructing and operating wind turbines in Germany. On the mainland today, we operate some 90 turbines with an installed capacity of around 160 MW. We intend to expand our capacities both in Germany and other countries. Since 2011, EnBW’s wind tur-bines have been exploiting wind power at sea. EnBW Baltic 1, Germany’s first commercial off-shore wind farm, has gone into operation in the Baltic Sea. EnBW Baltic 2 is already at the preparation stage. Two further wind farms are planned in the North Sea.
Pumped storage power stations can store energy. In doing so, they fulfil an important buffer function, stabilising the electricity grid and ensuring that we can continue to expand on our renewable energies. In Forbach, we are investigating the possibility of expanding the Rudolf Fettweis plant; Atdorf, located in the southern Black Forest, is set to become the site for Germany’s largest pumped storage power
01
26 _

02
Continuing a tradition of CO2 efficiency using wind energy and hydro-electric power as an example
1890 1900 1910 20001920 1930 2010 2020
1898: The hydro-electric power station in Rheinfelden ge nerates electricity for the first time.
1923: In Tannheim, the first of three Iller power stations goes into operation.
By 1926: The Rudolf Fett-weis plant in Forbach is built in two construction stages.
1930: The Vermuntwerk plant at Vorarlberger Illwerke becomes the largest hydro-electric power station in Austria.
2003: EnBW commences construction of the weir at the hydro-electric power station in Rheinfelden.
2005: EnBW decides to ex-pand its Iffezheim power station.
2006: During its “year of hydro-electric power”, EnBW commences construction of two new hydro-electric power sta-tions in Kehl and Breisach.
A fish passage facility is put into operation at the hydro-electric power station in Gambsheim.
2008: EnBW decides to con-struct four offshore wind farms with a total output of 1,200 MW.
2009: EnBW purchases a total of ten onshore wind farms.
2010: The area of onshore wind energy continues to expand. EnBW already operates around 70 wind turbines with a total output of some 120 MW.
2011: EnBW Baltic 1, Germany’s first commercial offshore wind farm, goes into operation in the Baltic Sea.
Completion of the hydro-electric power station in Esslingen brings EnBW’s total number of electricity-generating facil-ities on the Neckar to 26. After more than 80 years of gradual expansion, the final Neckar river barrage is completed.
The new Rheinfelden hydro-electric power station is of-ficially commissioned.
2012: At Iffezheim power station on the river Rhine, a fifth machine is due to be producing CO2-free electricity by the end of 2012.
2013/2014: EnBW Baltic 2 in the Baltic Sea is expected to go online.
Looking further ahead, with the addition of a fifth machine at the hydro-electric power station in Gambsheim, EnBW aims to generate more electricity from hydro-electric power.
EnBW is planning to expand the area of onshore wind energy in Germany significantly, especially in Baden-Württemberg.
The Hohe See and He Dreith off-shore wind farms are planned for construction in the North Sea.
2020: The share of energy generated from renewable energy sources is to be increased by some 3,000 MW by 2020.
a b c d
g
o
n
e
i
m
n
k
l
l
o
ka
b
c
d
e
f
mjf h
g
i
h
j
_ 27

We are increasing proximity to our custom-ers – not just retail, commercial and indus-trial customers but also to municipalities and municipal utilities – by providing local energy solutions tailored to our customers’ individual needs. In doing so, we will expand and manage our local and climate-friendly energy gener-ation activities as well as establish new, holis-tic solutions such as the “sustainable town” concept.
The “Sustainable town of Leutkirch” project is the first of its kind. We are developing this concept together with the town of Leutkirch, Biberach University and Oberschwäbische Elek trizitätswerke. The central aim of the project is to provide an environmentally compatible supply of energy for Leutkirch. The town aims to optimise its CO2 footprint – thus ensuring energy prices remain affordable and energy supplies reliable. EnBW’s function in this process is that of partner for munici palities and energy expert. The fundamental idea of an energy-efficient, low-emission and locally supplied municipality, such as the one we are de veloping in Leutkirch, also meets the wish that many municipalities have of being more independent in terms of their energy supply. Success in Leutkirch would therefore mean other municipalities would follow, developing their own individual energy concepts with the help of EnBW’s specialist support. We believe that such projects will accelerate the move of electricity supply towards local and more environmentally compatible technologies.
Customers choose our contracting offers. We provide our customers with energy services and measures for increasing efficiency and develop energy supply projects that both optimise costs and are environmentally friendly. Once the facilities have been designed and constructed, we look after operation and
maintenance. Last year we won the Contacting Award, which makes us very proud.
Our “MeRegio” research project is unpar-alleled. Seizing the opportunities the new energy world has to offer is a major challenge the future presents us with. This involves us improving the way in which we manage our grids at both the consumer and generation ends. We wish to integrate local sources of energy into the grid as best we can and make the energy available locally. Together with project partners and pilot customers, we have been breaking entirely new ground in the “Minimum Emission Region” since 2009. By linking up local energy producers and con-sumers in a smart system using modern infor-mation and communication technology, we aim to develop solutions for shaping the future of the energy market and, above all, supporting renewable energies. A constant exchange of data ensures that electricity is generated, fed into the grid and used as needed. Above all, this means that for the first time regional diffe-rences can also be taken into account when supplying electricity. A dynamic electricity tariff accommodates market fluctuations and provides incentives for customers to manage their consumption or generation, thus also allowing households to make a contribution to the smart grids of the future.
We are placing greater emphasis on local energy generation concepts as they allow us to
cater even better to the needs of our customers locally. To this end, we are also developing
new partnership models for municipalities and municipal utilities.
Offering local energy solutions: based on partnership, smart and environmentally friendly
Some 80% of the heating at the secondary school with a sports hall and community centre in Römerstein in the Reutlingen district is now generated using the modern and ecological method of burning wood chips using wood from the region.
A new CHP station in Leutkirch has helped to reduce the annual CO2 emissions by some 25%. Customers are happy, the environment benefits, and EnBW takes care of the operation and maintenance.
01
02
28 _

01
02
2,800 t of CO2
are saved annually with the new 5 MW solar farm at Leutkirch-Haid.
1,000 test customers have participated in our “MeRegio” research
project since 2009.
1,050 MW of installed thermal output is supplied by the
plants of EnBW Energy Solutions GmbH. This puts us among the top five in the German market in the area of industrial contracting.
Success in figures
_ 29

We provide support to municipalities with elec-tricity, gas and heating products, water sup-plies and numerous other services. Together, we implement energy and infrastructure solu-tions, analyse consumption data from public entities and develop concepts to increase energy efficiency. We also provide support to munici-palities in the formation of community energy cooperatives and other participation models.
The first community energy cooperatives in Baden-Württemberg were created in 2008. They offer the members of the community the opportunity to play an active role in shaping their energy future. This includes a safe and environmentally and climate-friendly way of generating energy with a stronger focus on the use of renewable energies. Here, we offer our expertise and services and assist interested municipalities from the idea phase through to the stage of implementation. Together with citizens, municipalities, companies and insti-tutions, we realise local and regional energy projects. As part of the “Solar BürgerAktiv” project, for example, we are working together with the regional professional tradesmen to construct photovoltaic systems on top of municipal buildings. If needed, we also take care of selecting the location and financing model. An extensive community participation process was initiated in the “Sustainable town of Leutkirch” project. The energy cooperative Energiegenossenschaft Leutkirch eG has the opportunity to participate financially in a new on-site solar farm.
Towns and municipal utilities can participate in energy concepts. For our offshore wind farm EnBW Baltic 1, demand exceeded supply by
far: 19 municipal utilities have got on board via an investment company. The partici pation model for EnBW Baltic 2 is in place. For the investment partner it is a sure thing: the fixed purchase price guarantees a high level of planning certainty for the investors. Only the first instalment is due before commissioning, the rest afterwards. EnBW bears the risks during the deployment phase. Further expan-sion projects such as the pumped storage power station in Forbach or the power station on the river Rhine in Gambsheim are also open for investments and cooperation projects. Several towns and municipal utilities have already expressed interest. Plans were shown to the local population at an early stage. We inform and involve the residents by holding regular information events and through active public relations.
Developing the new energy concept together. Following the events in Japan and the new energy concept introduced in Germany, we have intensified our dialogue with govern-ments, businesses and society. At a broad level, there have been talks with citizens and at a management board level talks with busi-ness organisations, trade unions, civil society organisations and churches. Over the course of intensive discussions, the requirements for a viable energy concept were presented and a better understanding was reached on both sides and solutions sought.
By developing new concepts, we are intensifying dialogue with all groups of society and
entering into partnerships with municipalities and municipal utilities. Innovative partici-
pation models will permit municipalities to increasingly participate in EnBW’s new con-
struction projects in the future, including those outside of Baden-Württemberg. Citizens
will have the opportunity to get involved in energy projects in their municipalities.
Encouraging dialogue, public participation and partnerships: committed, cooperative, proactive
For more information, please visit www.enbw.com/annualreport
30 _

02 “ Businesses and politics alike are called upon to implement the federal government’s energy con-cept together with the company in a way that is both forward-looking and sustainable.“
Hans-Peter Villis
01
19 municipal utilities have invested in EnBW Baltic 1, Germany’s first commercial offshore wind farm, via an investment company.
In October, some 200 interested members of the public took the town of Leutkirch up on its invitation to attend the official meeting presenting a concept for public participation in the “Sustainable town of Leutkirch” project.
01
02
0 5 10 15 20 25 30 35 40 45 50
0 5 10 15 20 25 30 35 40 45 50
2007
2008
2009
2010
2011
7
21
16
21
45
0 10 20 30 40 50
Number of public events on sustainability and climate protection
_ 31

We are responsible for providing energy safely, affordably and reliably for our employees,
the environment and society. Our customers know us as a service-oriented and reliable
company that provides them with more than “just” energy.
Assuming responsibility:reliable, motivated, forward-looking
Ideas, innovations and investments are essen-tial for us to continue supplying our customers with energy safely, affordably and reliably in the future. Existing grids and facilities require expansion and optimisation. New technol-ogies must be tested and applied. We are fully committed to fulfilling these tasks and accept-ing this responsibility.
Supply reliability, environmental protection and economic viability: Even in a changing energy market, these remain our primarily goals. This is the basis for the optimum energy mix that we strive for, combining a range of fuels in an economically and eco-logically efficient way. In addition to the use of conventional energies, the increase in energy efficiency and expansion of renewable energies play an important role here, and we are fully aware of our environ mental and social responsibility. We therefore see our customers’ rising environmental awareness as an opportunity and offer them a wide range of green electricity products. Climate and environmental protection are a fixed part of our corporate philosophy.
Our employees are qualified and motivated. To ensure that that stays this way, we require and promote their flexibility, creativity and the development of their skills. Our targeted personnel development measures provide sup-port and help to identify potential for specific further training while they continue to work for us, thereby preparing them for change.
EnBW’s grids are key to a stable energy supply. For this reason, we have our own networks, which we continue to develop and expand on an ongoing basis. Our 220 kV lines are gradually being converted to 380 kV lines. This measure, together with the associated expansion of network capacity, will help to increase performance in our transmission grid. We also continue to expand our regional distri-bution grids at a rapid rate. This will allow us to manage changed and constantly changing load flows attributable, among other things, to the free electricity trading throughout Europe and the volume of renewable energies fed into the system.
Baden-Württemberg is our home. This is where our roots are and where we support mass and professional sports and young athletes, as well as art, culture and voluntary work. We play an active role in society as a whole and as a partner to associations, insti-tutions and private initiatives. Proximity to our customers and business partners is vital. We are committed to Baden-Württemberg and Germany as locations and these are the focal points of our activities.
32 _
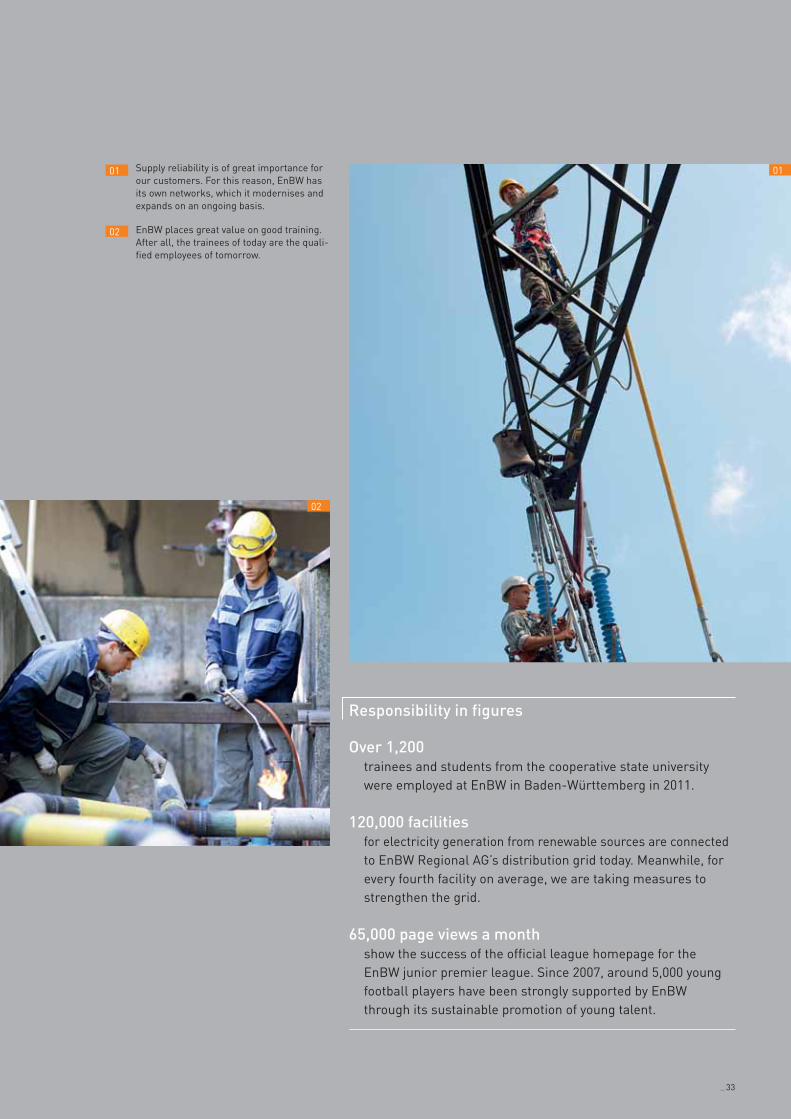
02
Supply reliability is of great importance for our customers. For this reason, EnBW has its own networks, which it modernises and expands on an ongoing basis.
EnBW places great value on good training. After all, the trainees of today are the quali-fied employees of tomorrow.
01
02
01
Over 1,200 trainees and students from the cooperative state university
were employed at EnBW in Baden-Württemberg in 2011.
120,000 facilities for electricity generation from renewable sources are connected
to EnBW Regional AG’s distribution grid today. Meanwhile, for every fourth facility on average, we are taking measures to strengthen the grid.
65,000 page views a month show the success of the official league homepage for the
EnBW junior premier league. Since 2007, around 5,000 young football players have been strongly supported by EnBW through its sustainable promotion of young talent.
Responsibility in figures
_ 33

Local generation, smart home products, elec-tromobility and energy efficiency are gaining importance. As a competent contact and service provider, we advise and support our customers and help them through these complex issues.
Smart home stands for intelligent and user-friendly solutions. Our smart electricity meter already makes domestic energy consump-tion transparent today. Just one more step is needed to make the leap from smart meters to smart homes. This will link electrical appli-ances and energy applications together, pro-vide easy control and offer the possibility to incorporate local generation facilities and e-mobility. In this regard, EnBW sees energy management as one of several key compo-nents of a smart home. Other components include, for example, home entertainment or security systems. We are therefore focusing on open system platforms in cooperation with renowned cooperation partners.
Both the environment and consumer bene-fit from an efficient use of energy. Within the EnBW energy efficiency networks, we work with our industrial customers to optimise their energy consumption on a long-term basis. Our solution packages for solar power plants and heat pumps, or for building analyses, are most interesting for home owners. With the help of clever energy management concepts, we sup-port them in optimising their buildings with regard to economic and ecological aspects. Based on an individual needs analysis, we also plan, finance and build facilities directly on site as a contracting model. This includes photovoltaic, heating, cooling and CHP systems and mini power stations. In this way, our cus-tomers are supplied with energy efficiently on a long-term basis and at fixed, budgetable price conditions. After the installation, we look after plant operations and ongoing maintenance.
We aim to push ahead with electromobility. EnBW is cooperating with partners in a num-ber of model and pilot projects to research and test ways of providing energy as well as invoicing models and the charging infra-structure for the emission-free mobility of tomorrow. In field tests, we are examining how electric vehicles can be used as mobile storage facilities in transportation to sup-port the energy system in absorbing greater quantities of renewable energy. The aim of the “MeRegioMobil” research project sponsored by the German Federal Ministry of Economics and Techno logy is to create a smart charging and feedback infrastructure for electric vehicles. Further more, it is also intended for each private household to be able to manage their charging and feedback comfortably sitting at their PC from home. In addition, we are investi-gating the possi bilities of storing hydrogen from renewable energies and using it for transport purposes.
The energy world is becoming ever more complex. We help our customers to seize the
opportunities it has to offer. We support them with our expertise and innovative, holistic
energy solutions, thereby creating potential for new business segments.
Creating a new energy world for our customers: transparent, individual, innovative
01
34 _

02
The “smart home” on the campus of the Karlsruhe Institute of Technology (KIT) is being used as a testing laboratory as part of the “MeRegioMobil” research initiative. This prototype of an energy-efficient household of the future links, for example, elec-tric vehicles as an electricity storage facility and electricity con-sumption points via the smart management of the household.
The Doll family has decided on a heat pump. EnBW has pro-vided them with advice and support. Local workers take care of the installation and its maintenance is performed by one of EnBW’s partner companies.
01 02
For more information, please visit www.enbw.com/annualreport
Over 200 companies to date have participated in our
energy efficiency projects. With our product “EnBW energy efficiency network” we are the market leaders in Germany.
Around 859 million kWh have been saved since 2007 as a result of energy
efficiency projects. This has saved some 342,000 metric tons of CO2 emissions being produced.
17 EnBW efficiency ambassadors today provide our retail customers with advice
and support. In 2011, they participated in some 400 events on the issue of energy efficiency.
11,000 thermographic checks as well as 8,000 building
analyses and 2,000 energy consultation meetings on the topic of modernising buildings alone were performed in 2011.
Customer proximity in figures
_ 35

36 _
Combined management report of the EnBW group and EnBW AG
37 Summary
37 High-performing partner
37 Economic environment puts pressure on earnings
38 Sound financial position and net assets support A rating
38 Proposed dividend: € 0.85 per share
38 Refining the strategy
38 Outlook modest
39 Group structure and business activity
39 Structure and key business processes
44 Management and supervision
45 Products, market and competition
48 Corporate strategy and value-based management
48 Objectives and strategy
50 Value-based management system
51 Economic and political environment
51 General conditions
51 Economic environment
55 Political and regulatory environment
57 The EnBW group
57 Overall assessment of the business development
58 Results of operations
63 Financial position
69 Net assets
74 Unrecognised intangible assets
77 EnBW AG
77 EnBW AG
77 Net assets of EnBW AG
79 Net profit of EnBW AG and dividend
79 Comments on reporting
79 Dependent company declaration
80 Sustainability
83 Employees
83 Headcount development and personnel composition
84 Personnel strategy
86 Assessment of our intellectual capital: human capital
87 Research and development
87 Research and development objectives and guidelines
87 Efficient research and development structure
87 Expenditure and personnel
88 Incorporating external know-how
88 Selected research and development results
91 Subsequent events
92 Key features of the financial reporting internal control system
92 Principles
92 Structure
92 Process
93 Risk and opportunities report
93 Principles of risk management
93 Structure and process of risk management
94 Systemic and industry risks
97 Strategic risks
98 Operating risks
98 Financial risks
99 Other risks
100 Overall assessment
100 Risk management system
101 Principles of opportunity management
101 Company-specific opportunities
102 Overall assessment of the economic situation of the group
103 Remuneration report
104 Disclosures pursuant to Secs. 289 (4), 315 (4) German Commercial Code (HGB) and explanatory report of the Board of Management
107 Forecast
107 Anticipated economic environment
108 Future political and regulatory environment
109 Future industry development
109 Corporate strategy and future development of the company
110 Anticipated business development
113 Significant opportunities and risks of the next two years
113 Developments in human resources and welfare
114 Research and development
114 Overall assessment of the anticipated development
114 Future-oriented statements
The cross-references in bold marked with orange arrows in brackets and the orange separator sheets are not part of the audited management report.

Time to act
Management report
Summary ‹
Financial statements
Corporate governance
Service
_ 37
The year 2011 was a difficult fiscal year for the EnBW group. In terms of sales of electricity and gas, we
maintained our position as one of the largest energy suppliers in Germany and Europe. Earnings did not
develop satisfactorily, however, which was essentially due to the impact of the new energy concept decided
upon in Germany in 2011 and non-operating expenses within the investment result. We consistently took
measures to safeguard the financial stability of the company and its ability to prepare for the future.
High-performing partner
EnBW is one of the most important energy supply companies and energy service providers in Germany and Europe. On the basis of our vertically integrated business model, we supply and provide advice to around 5.5 million customers − businesses, municipalities as well as municipal utilities and private households. EnBW has around 20,000 employees. Our deep roots in Baden-Württemberg have allowed us to grow our business throughout Germany and on selected foreign markets: the Czech Republic, Switzerland, Turkey. The electricity generation and trading as well as the electricity grid and sales segments enable the EnBW group to cover all stages in the value added chain of electricity. EnBW’s generation portfolio comes to around 13,500 MW. With regard to sales, EnBW has positioned itself with customer-centric energy consultation and services relating to the efficient use of energy. The gas segment comprises the downstream area, consisting of gas transmission, distribution and sales, as well as the midstream business, which brings together import agreements and import infrastructure, gas storage and trading, as well as portfolio management. With regard to the energy and environmental services segment, the EnBW group provides grid and energy-related services, thermal and non-thermal waste disposal as well as water supply services.
Economic environment puts pressure
on earnings
In 2011, the electricity sales of the EnBW group increased by 6.0% to 155.7 billion kWh. In addition to a rise in the trading figures, we also increased unit sales to business customers. In contrast, sales to retail customers fell below the prior-year figure due to the fierce competition. Unit sales of gas grew by 7.1% to 57.4 billion kWh. There was, however, also a decline in the B2C business in this area, which was among other things attributable to the warmer weather compared to the prior year. After deducting electricity and natural gas tax, external revenue reached € 18,789.7 million in the fiscal year 2011, which is equivalent to growth of 7.3% on the prior year.
The energy policy environment changed dramatically in Germany in the course of 2011. Whereas only in autumn 2010 the federal government had passed legislation to extend the working lives of German nuclear power plants, following the events in Japan, the decision was made in June 2011 to gradually phase out nuclear power by 2022, thereby introducing the new energy concept. The permanent shutdown of eight reactors in this context, the decision to shorten the working lives of the other plants and supplementary measures pose great challenges for EnBW that were directly reflected in how earnings developed in 2011. The EnBW group’s adjusted EBIT fell by 17.0% to € 1,598.1 million in 2011. The newly introduced nuclear fuel rod tax and the consequences stemming from the new energy concept reduced the electricity generation and trading segment’s adjusted EBIT. In this segment, adjusted EBIT fell by 20.9% to € 1,283.1 million. Adjusted EBIT in the electricity grid and sales segment decreased by 24.5% to € 199.2 million. Consolidation effects and the milder weather compared to the prior year had a negative impact on the gas business and caused a fall in adjusted EBIT of 36.0% to € 51.3 million. In the energy and environmental services segment, adjusted EBIT saw significant growth of 71.2% to € 190.5 million. The adjusted investment result fell by 8.9% on the prior year to € 175.2 million. The loss in the adjusted financial result increased to € 735.3 million on account of a higher level of interest expenses. Adjusted group net profit in terms of the loss/profit shares attributable to the equity holders of EnBW AG came to € 647.7 million, a fall of 32.8% in comparison to 2010.
Summary

38 _
In the past fiscal year, extraordinary expenses caused a non-operating group net loss in terms of the loss/profit shares attributable to the equity holders of EnBW AG of € 1,515.0 million. The significant decrease in comparison to the prior year (2010: non-operating group net profit of € 192.9 million) is primarily attributable to the higher level of expenses in the area of nuclear power, expenses arising from additions to restructuring provisions and impairment losses recognised on entities accounted for using the equity method. In addition, extraordinary income had had a positive effect on the non-operating result in 2010.
In total, a group net loss in terms of the loss/profit shares attributable to the equity holders of EnBW AG of € 867.3 million arose for the reporting year 2011, in contrast to group net profit of € 1,157.2 million the year before. Earnings per share from the group net loss came to € -3.55 in 2011. Positive earnings of € 4.74 per share had been generated the year before.
Sound financial position and net
assets support A rating
In the fiscal year 2011, the cash flow from operating activities decreased by 32.1% to € 1,740.1 million, primarily on account of the lower EBITDA. The cash flow from investing activities fell by € 602.2 million to € 670.4 million in the reporting year 2011. Cash flow from financing activities reported a significantly reduced cash outflow of € 170.9 million in 2011. This fall is mainly due to the cash inflow from the issue of a hybrid bond in October 2011. Cash and cash equivalents in the group increased by € 898.3 million in 2011.
The negative earnings development in the reporting period caused the equity ratio to fall to 17.1% as of 31 December 2011. The value added of the EnBW group dropped significantly in the fiscal year 2011 by 41.1% to € 471.6 million. The average capital employed saw a slight rise of 2.1% to € 15,720.5 million. In 2011, ROCE fell to 11.7% following 14.2% in the prior year. As of the reporting date 31 December 2011, adjusted net debt stood at € 8,809.4 million, up slightly on the prior-year figure. On account of the drop in adjusted EBITDA, the dynamic leverage ratio rose from 3.04 at the end of 2010 to 3.59 as of the end of the reporting year.
At the end of 2011, the rating agencies Standard & Poor’s and Moody’s confirmed EnBW’s A rating. The ratings at the end of 2011 were as follows: Fitch: A-/outlook stable, Moody’s: A3/outlook negative, Standard & Poor’s: A-/outlook stable.
Proposed dividend: € 0.85 per share
In principle, EnBW aims to pay a dividend in the vicinity of 40% to 60% of adjusted group net profit. On account of the deterioration in the earnings situation and the impending financial burdens on the group, the Board of Management will, in consultation with the Supervisory Board, propose to the annual general meeting on 26 April 2012 that a dividend of € 0.85 per share be distributed. This would give rise to a total distribution volume of € 207.6 million and a distribution level of 32% in relation to the adjusted group net profit.
Refining the strategy
The environment for EnBW’s business activities is changing quickly and radically. We are actively addressing this change in order to contribute to shaping it with a view to safeguarding the company’s future sustainability. In doing so, EnBW’s profile will be subject to significant changes in coming years. EnBW is putting even more emphasis on expanding renewable energies. We will increase the share of energy generated from renewable energy sources by around 3,000 MW by 2020. Securing our position as a low-carbon generator is one of the key strategic moves. The second strategic move is to establish local solution offers in the field of energy. We are pressing ahead with the expansion of local energy generation, are setting up holistic products − for example the “sustainable town” approach − and are offering our invoicing and settlement systems as services to third parties. In order to create financial headroom for the future-orientated further development of the company, we have launched an extensive package of measures, which stands on the pillars of efficiency enhancement, divestitures and capital measures. We successfully implemented the first measures in 2011.
Outlook modest
The effects of the new energy concept, the realignment of the company and a market environment that is becoming more difficult will give rise to great challenges for EnBW over the next few years. EnBW expects its adjusted EBITDA to fall in 2012 by between 10% and 15% on the prior year. We expect this trend to continue in 2013, although we will counter it by implementing extensive efficiency measures. We attach special importance to maintaining EnBW’s sound financial position. We will therefore reduce adjusted net debt in order to maintain our A rating.

Time to act
Management report
Group structure and business activity ‹
Financial statements
Corporate governance
Service
_ 39
EnBW is one of the largest energy supply companies and service providers in Germany and Europe. Our
vertically integrated business portfolio enables us to safeguard supplies to our customers. In a market
characterised by fierce competition EnBW is defending its position as a partner for energy-related
questions – with innovative and efficiency-enhancing holistic solutions, green energy offerings and award-
winning customer service.
Structure and key business processes
EnBW group As a vertically integrated energy company, the EnBW group operates along the entire value added chain. The business area of electricity is covered by the two segments electricity generation and trading as well as electricity grid and sales. The electricity generation and trading segment is vital to the results of operation of the group. The gas segment comprises the midstream and downstream areas. In addition, EnBW operates in the energy and environmental services segment. (> Financial statements > Segment reporting > p. 194ff)
As one of the largest energy companies in Germany, with strong roots in Baden-Württemberg, EnBW generated energy sales of 213.1 billion kWh in 2011. Some 5.5 million customers are supplied and advised by EnBW. The company has around 20,000 employees. In the reporting year, around 86% of the group’s revenue was attributable to Germany. The foreign share came to around 14%.
In addition to a strategic equity investment of 26% in the fifth largest energy company in Germany, EWE Aktiengesellschaft, EnBW also holds further equity investments in Germany. In North Rhine-Westphalia, for example, it has a majority shareholding in Stadtwerke Düsseldorf. EnBW has invested in carefully chosen European countries, primarily in the field of electricity. There are equity investments in Switzerland and Austria as well as central European countries such as the Czech Republic and Hungary. On the Czech market, EnBW assumed the majority shareholding in the energy supply company Pražská energetika, a.s. (PRE) in 2010, thus assuming economic and industrial control. The EnBW group is represented on the Turkish market through a joint venture with the industrial group Borusan. Here we are building up and expanding generation capacities in the field of renewable energies. (> Financial statements > List of shareholdings > p. 201ff)
The head office of the EnBW group is in Karlsruhe; there are major offices in Stuttgart, Biberach and Esslingen. The company has further regional and sales centres in Baden-Württemberg. In addition, there are sales offices throughout Germany. The company’s main tangible assets include a large number of power stations and energy generation facilities, electricity and gas grids, distribution plants and gas storage facilities, most of which are located in Germany.
As the holding company, EnBW Energie Baden-Württemberg AG (EnBW AG) exercises the management function in the EnBW group. It is responsible for the strategic management and control of the group at all key stages of the value added chain in the segments. The holding company likewise brings together the corporate functions of finance and liquidity management, HR management, corporate communications and group development. The fields of compliance, corporate governance and risk management are similarly located at holding level. EnBW AG has concluded domination and profit and loss transfer agreements with all major subsidiaries.
Electricity segments The electricity generation and trading as well as the electricity grid and sales segments enable the EnBW group to cover all stages of the electricity value added chain.
EnBW Kraftwerke AG operates most of EnBW’s portfolio of power stations. Electricity and district heating are generated in facilities fired by a range of fuels. Most of the conventional facilities are combined heat and power plants which have a lesser environmental impact. EnBW Kernkraft GmbH is responsible for operating the group’s nuclear power plants KKP 2 and GKN II, managing the post-operation phase of the units KKP 1 and GKN I, which have been shut down since March 2011, and decommissioning Obrigheim nuclear power plant. The more than 4,000 employees of these two companies bundle their expertise in the fields of planning, construction, operation, maintenance and optimisation of EnBW’s power stations. EnBW Erneuerbare Energien GmbH is mainly responsible for expanding and operating generation capacity on the basis of renewable energies.
Group structure and business activity

40 _
As of 31 December 2011, EnBW’s generation portfolio, which includes partly owned power stations and long-term procurement agreements, totalled 13,402 MW (prior year: 14,774 MW).
The generation capacities are composed of nuclear power plants, coal, oil, gas and pumped storage power stations that do not use the natural flow of water as well as facilities designed to generate electricity from renewable energies.
These include run-of-the-river power stations, storage power stations and pumped storage power stations that use the natural flow of water, photovoltaic plants, wind turbines and biomass plants. EnBW’s generation portfolio is wellbalanced as regards the mix of fuels and the age structure of the facilities.
Breakdown of the generation portfolio of the EnBW group1, 2
Electrical output3 in MW (as of 31 December)
2011 2010
Nuclear power plants 3,333 4,856
Conventional power stations 6,986 6,895
Storage/pumped storage power stations using the natural flow of water 1,299 1,298
Pumped storage power stations that do not use the natural flow of water 545 545
Run-of-the-river power stations 926 910
Other renewable energies 313 270
Installed capacity (without standby reserve) 13,402 14,774
1 The generation portfolio includes long-term procurement agreements and generation from partly owned power stations. 2 Prior-year figures restated. Generation capacities in the 2010 annual report had included standby reserve. 3 Capacity values irrespective of marketing channel, for storage: generation capacity.
Apart from the decision by the federal government (13th amendment to the German Atomic Energy Act (AtG)) to permanently shut down the seven oldest nuclear power plants in Germany (including GKN I and KKP 1) and Krümmel, the change in generation capacities is due to the commissioning of generation facilities that use renewable energies.
At 59%, the portion of CO2-free electricity generation in the fiscal year 2011 was below the prior-year figure of 61%. The CO2 emissions from EnBW’s own generation portfolio stand at 346 g CO2/kWh (prior year: 299 g CO2/kWh), which still is significantly below the German national average in 2010 of 494 g CO2/kWh.
Generation in the EnBW group1 according to primary energy source in % 2011 2010
Fossil energies 38.1 34.5
Nuclear power 47.7 51.0
Renewable energies2 10.8 10.5
of which subsidised under the German Renewable Energies Act (EEG) 1.4 1.2
Other 3.4 4.0
1 Own generation includes long-term procurement agreements and generation from partly owned power stations. 2 By analogy to the disclosure pursuant to Sec. 42 German Energy Industry Act (EnWG).
EnBW Trading GmbH (ETG) operates at the next stage of the value added chain, the area of trading and procurement. It forms an interface between generation and sales. This company is responsible for trading with physical and financial products for electricity, primary energy sources (gas, coal, oil) and CO2 allowances on the wholesale market. This means that ETG is responsible for the fuel procurement and logistics, emission allowance management as well as power station deployment planning and management with regard to EnBW’s generation portfolio. In addition, ETG is tasked with the commercial optimisation of our gas assets and agreements. For the sales function, it ensures that
energy needs are covered. It trades on major regulated exchanges such as the EEX in Leipzig, Powernext in Paris and the International Commodity Exchange and the European Climate Exchange in London. Alongside pure stock exchange activities, ETG participates in over-the-counter trading with around 170 national and international contractual partners. As part of its activities, it also assumes the risk management function for market-related risks along the value added chain. These are, in particular, price and quantity risks relating to procurement and sales. In addition to supporting the operating business, ETG also trades on its own account, subject to strict regulations and limits.

Time to act
Management report
Group structure and business activity ‹
Financial statements
Corporate governance
Service
_ 41
EnBW Transportnetze AG (TNG) is one of the four transmission system operators in Germany. It offers all market participants transparent and non-discriminatory terms for grid access and use. Its customers and partners include more than 200 electricity dealers, power station operators and distribution system operators. TNG monitors and controls the grid within the scope of grid management, reviews grid security and balances capacity fluctuations. Where necessary, it eliminates any disruptions. It is furthermore responsible for expanding grids and their maintenance. TNG’s extra-high-voltage grid (380 kV and 220 kV), the transmission grid, serves to transmit electricity over long distances. Numerous connection points are used to integrate the extra-high-voltage grid in the national and international network system and to connect it to large-scale power stations. The new switchgear installed in the Grossgartach transformer substation after a three-year construction period will in future form one of the most important connection points in TNG’s grid. Electricity transits from electricity trading across Europe and wind power in the north of Germany will flow through this transformer substation. Following implementation of the third energy liberalisation package with the amendment to the German Energy Industry Act (EnWG), transmission system operators have three possibilities for unbundling. EnBW decided to implement the independent transmission operator (ITO) model at TNG.
With this model, the transmission grid remains within the group, but stricter unbundling provisions apply between TNG as ITO and EnBW.
EnBW Regional AG (REG) is the largest distribution network operator in Baden-Württemberg where it distributes electricity through its own distribution grids. In the same way as TNG, REG is responsible for granting transparent and non-discriminatory access to the grids and for reliable distribution of electricity. In addition, REG is tasked with operating all grids and facilities of the network operator EnBW Gasnetz GmbH and the gas-related facilities of EnBW Gas GmbH and is responsible for relations to municipalities as well as managing EnBW’s franchise agreements and its business relations to municipal utilities in Baden-Württemberg. REG also provides grid-related services to municipalities and municipal utilities in Baden-Württemberg. In addition to REG, there are other important distribution system operators within the EnBW group such as Netzgesellschaft Ostwürttemberg GmbH and Stadtwerke Düsseldorf Netz GmbH.
In total, EnBW’s transmission and distribution grids are around 153,000 km in length. Municipal utilities and industrial plants are supplied using 110 kV lines in the distribution grid, and the 30, 20 and 10 kV lines in the regional distribution grid are available to medium-sized customers. Domestic households, agricultural and commercial customers are supplied through the 0.4 kV network.
Electricity grid lengths of the EnBW group in km 2011 2010
Transmission grid
Extra-high voltage 380 kV 1,993 1,993
Extra-high voltage 220 kV 1,655 1,681
Distribution grid
High voltage 110 kV 8,552 8,542
Medium voltage 30/20/10 kV 45,876 44,555
Low voltage 0.4 kV 95,090 95,757
Consistent restructuring of the sales function within the EnBW group continued in the fiscal year 2011. In 2010, two separate companies were formed, EnBW Vertrieb GmbH and EnBW Operations GmbH (EOG), to handle sales and processing activities. In this context, EnBW Vertrieb GmbH manages the group’s sales activities for all brands. The sales-related processes such as invoicing or metering services are provided by EOG. (> Management report > Energy and environmental services segment > p. 43)
EnBW Vertrieb GmbH sells electricity, gas, district heating, water and, increasingly, energy services for industrial, commercial and retail customers, municipal utilities and municipalities under the EnBW brand. The offering of services to retail and business customers as well as municipalities concentrates on Baden-Württemberg.
In addition to EnBW Vertrieb GmbH, there are further local sales units within the EnBW group. Furthermore, EnBW Ostwürttemberg DonauRies AG (ODR) supplies electricity and gas to customers in eastern Württemberg. ZEAG Energie AG supplies electricity customers and Gasversorgung Unterland GmbH supplies gas customers in Heilbronn
42 _
region. Energiedienst Holding AG (ED) is responsible for electricity sales in south Baden and in Switzerland. All retail and business customers in its home region of south Baden have been supplied with green electricity from 100% hydro-electric power for more than ten years.
Watt Deutschland GmbH specialises in sales to the customer groups of SMEs and chains throughout Germany under the Watt brand. Its portfolio of services also extends to energy and system services. Under the Yello Strom brand, Yello Strom GmbH is responsible for national sales of electricity and other products (such as Yello Sparzähler online, an intelligent metering product) to retail and business customers. With the NaturEnergiePlus brand, NaturEnergie+ Deutschland GmbH targets ecologically minded customers with products available throughout Germany. A range of products extending beyond the supply of green electricity enable customers to manage their energy consumption themselves, taking account of ecological aspects. Through its shareholding in Stadtwerke Düsseldorf AG, EnBW also has electricity sales operations throughout North Rhine-Westphalia.
Gas segment The midstream business in the gas segment includes import agreements, import infrastructure, gas storage, and trading and portfolio management. In contrast, the downstream business covers gas transmission, distribution and sales.
EnBW Gas Midstream GmbH employs import agreements and investments in the necessary infrastructure to safeguard the EnBW group’s access to gas in the medium to long term. In the Etzel region, EnBW secured long-term rights to use salt caverns back in 2007. Commercial operations at the gas storage facilities in Etzel are scheduled to begin in February 2012. In order to exploit synergies, EnBW and Electricité de France (EDF), which also controls storage caverns in the Etzel region, have formed a 50:50 joint venture. The joint venture is tasked with the construction and commercial operation of the above-ground facility.
GasVersorgung Süddeutschland GmbH (GVS) was reorganised as of 1 July 2011. The shareholders of GVS are EnBW and the Italian energy group Eni. Two separate companies operate under the umbrella of the parent company EnBW Eni Verwaltungsesellschaft mbH: the natural gas trading and sales entity GasVersorgung Süddeutschland GmbH (GVS) and the grid operator GVS Netz GmbH. The gas sales function of the company supplies natural gas to municipal utilities, regional gas suppliers, industrial customers and power stations both in Germany and abroad. Its range of services is rounded off by additional services in the area of consulting, support and gas systems management. In addition to the secure, economically viable and non-discriminatory transmission of natural gas, the main tasks of GVS Netz GmbH include the provision of technology and telecommunications services. Energy suppliers and industrial plants are provided with support in the form of a large number of technical services ranging from planning and construction, operations and maintenance through to the monitoring and control of grids.
Effective as of 1 July 2011, the integrated sales approach continued as planned through the transfer of the sales units of EnBW Gas GmbH to EnBW Vertrieb GmbH. The range of gas services is mainly aimed at retail customers in Baden-Württemberg and industrial customers throughout Germany. Furthermore, EnBW Gas GmbH operates its own storage facilities. The wholly owned subsidiary of EnBW Gas GmbH, EnBW Gasnetz GmbH, assumes the network operator function for the gas distribution networks and LNG storage operations. Effective as of 1 January 2012, EnBW Gasnetz GmbH was merged into REG. The gas supply territories of the EnBW group in Baden-Württemberg include the Stuttgart region, the Black Forest, the Swabian Alb, Lake Constance, north Baden and east Württemberg, among others. Our gas sales operations in the Düsseldorf region are performed through our shareholding in Stadtwerke Düsseldorf. The EnBW group’s grids have a total length of around 16,000 km.
Gas network lengths of the EnBW group in km 2011 2010
Long-distance transmission network
High pressure 1,964 1,949
Distribution grid
High pressure 2,142 2,133
Medium pressure 6,872 6,768
Low pressure 4,989 4,959

Time to act
Management report
Group structure and business activity ‹
Financial statements
Corporate governance
Service
_ 43
Energy and environmental services segment With regard to the energy and environmental services segment, the EnBW group provides grid and energy-related services (essentially contracting solutions), thermal and non-thermal waste disposal as well as water supply services.
EnBW Energy Solutions GmbH (ESG) provides energy efficiency solutions as contracting services along the entire value added chain: from the initial needs analysis, through planning, financing and implementation to the operation, servicing and maintenance of facilities at the customer. In addition to energy plants and (combined power and) heating plants, the media infrastructure for supplying various usable energies such as heat, steam, cooling and compressed air are employed for this purpose. ESG’s range of services includes modular plants such as combined heat and power plants or cooling and compressed air systems and extends to complex systems for combined heat and power generation and overall solutions for industrial locations. With technically and economically optimised as well as needs-oriented solutions, ESG wishes to safeguard the long-term energy supplies to its industrial, business, municipal and housing industry customers and to optimise the overall energy situation. Its portfolio of services extends to a wide range of different technologies, fuels and facility sizes. ESG’s contracting solutions contribute to its customers’ competitiveness and a reduction in CO2 emissions by means of efficient generation technology.
As an internal services provider, EnBW Systeme Infrastruktur Support GmbH performs extensive consulting and support services within the EnBW group. These include, for example, the areas of purchasing, human resources or accounting, legal advice and insurance as well as tax.
It is planned for the central service providing entity, formed on 1 October 2010, EnBW Operations GmbH (EOG) to create competitive structures in the area of operating functions and successfully position itself in a growing market. For its customers, primarily from the energy industry, it acts both as an independent full service provider for services ranging from metering through to invoicing and as a provider of individual service components, for example an invoicing platform or an energy data management system. At its Biberach, Esslingen, Karlsruhe and Stuttgart locations, EOG handles more than four million metering points. Apart from the group companies (EnBW Vertrieb GmbH, REG, Yello, Watt, GAS/GNG, ESW, ED and ODR), EOG’s customers include the city of Stuttgart and other external entities. Its platform strategy, where all functions are modular and can be used by
all customers, permits EOG to operate on the market for third parties. It is pursuing a consistent growth strategy with internal and, increasingly, external customers.
The EnBW group’s activities in the field of waste disposal are operated by EnBW Kraftwerke AG and Stadtwerke Düsseldorf AG and their subsidiaries. The EnBW group’s thermal waste treatment plants process around 1.3 million t of waste per year. As one of the leading companies in Baden-Württemberg and in the Düsseldorf region, we provide reliable residual waste disposal services in the long term for our municipal partners. The residual waste CHP station in Stuttgart-Münster and the waste incineration plant in Düsseldorf play a key role here. Both plants are equipped with state-of-the-art boiler and furnace technology and offer effective and efficient flue gas cleaning. Thanks to the combined generation of heat and power at both plants, they are also cornerstones of the environmentally and climate-friendly district heating supply in the two state capitals, Stuttgart and Düsseldorf. Zurich’s Josefstrasse domestic waste CHP, which has been operated by Fernwärme Zürich AG (in which EnBW Kraftwerke AG has a 40% shareholding) since 2011, also generates district heating with waste from Baden-Württemberg. Within the energy and environmental services segment, EnBW Regional AG (REG) is responsible for the area of water, which also includes water supplies to the state capital Stuttgart. In addition to water and waste water operations, it offers water loss monitoring services with the “EnBW LeakControl” product throughout Baden-Württemberg.
The segment’s grid-related and other services in the area of electricity include, for example, maintenance work, renewal measures and the installation of new operating resources of all kinds and at all voltage and pressure levels. REG further provides all services for proper street lighting and complete solutions for the installation and operation of photovoltaic facilities at a municipal level. The range of products further extends to services in the area of telecommunications, media and security technology as well as radio transmission services.
EnBW AG EnBW AG is listed on the General Standard segment of the Deutsche Börse stock exchange. The two major shareholders, the federal state of Baden-Württemberg (indirectly through NECKARPRI-Beteiligungsgesellschaft mbH) and OEW Energie-Beteiligungs GmbH, each hold 46.55% of EnBW AG’s share capital (> EnBW on the capital market > Shareholder composition > p. 24f). As the business development, the economic situation and the opportunities and risks relating to the future development of EnBW AG do not differ from the business development, economic situation and the opportunities and risks relating to the future development of the EnBW group, the management report of EnBW AG is combined with that of the EnBW group.

44 _
Management and supervision
Board of Management As of 31 December 2011 the Board of Management of EnBW AG consisted of four members, as of 1 January 2012 it will consist of five members. The Board of Management conducts the business of the group with joint responsibility. Besides the remit of the CEO, the tasks of the Board of Management are structured into the “sales and grids”, “personnel, law and IT”, “finance” and “technology” portfolios. Thomas Kusterer has held the position of CFO since 1 April 2011; previously, the functions and group companies assigned to the finance portfolio were under the temporary management of the other members of the Board of Management. The sales and grids portfolio has been under the management of Dr. Dirk Mausbeck since 1 October 2011. As a new member of the Board of Management, he replaces Christian Buchel, who left EnBW of his own volition as of 31 May 2011 to take up new challenges at EDF. Effective as of 1 January 2012, Dr. Hans-Josef Zimmer was reappointed Chief Technical Officer. This portfolio had been temporarily assigned to the CEO’s portfolio after Dr. Hans-Josef Zimmer decided to resign from his office in July 2010 in order to permit an independent review of business activities in Russia.
The CEO’s tasks primarily pertain to strategic, investor relations, corporate policy and group-wide issues as well as any high-profile functions. The CEO is responsible for the management and development of the group, top management issues, the development of the gas segment, internal auditing, corporate communications, the topics of corporate responsibility and sustainability as well as representing the group’s interests with regard to the industry, technology and energy legislation. The group’s interests are promoted by representative offices in Brussels, Berlin and Stuttgart and through the coordination of association activities. The areas of media, group press activities and internal communications are the responsibility of corporate communications. Group development covers the areas of group strategy and mergers and acquisitions.
The finance portfolio is responsible for managing and coordinating group-wide treasury activities and the associated central functions. The duties of this portfolio include group controlling, group finance and investor relations, accounting and taxes, group risk management as well as the management and optimisation of upstream and downstream activities. In addition to the focal points of group planning and reporting, and controlling of the segments, companies and equity investments, group controlling is tasked with group-wide monitoring and implementation of the internal control system (ICS). Furthermore, this portfolio is responsible for energy industry issues in the areas of portfolio management and market environment, the policy on regulatory aspects and the management of equity investments.
The areas of marketing and sales as well as operations are assigned to the member of the Board of Management
responsible for sales and grids. The portfolio manages the central marketing function and brand management as well as, among other things, the sales strategy and coordinates activities in the areas of innovations, energy services and electromobility. With respect to distribution networks, the topics of grids and regulation are also assigned to the area of responsibility of this member of the Board of Management.
The personnel, law and IT portfolio is in charge of the respective central functions as well as the pertinent strategic issues. In addition to responsibility for dealing with the topics of compliance, materials management, industrial health and safety, data protection, real property and knowledge management, the Chief Personnel Officer is also responsible for labour relations.
The Chief Technical Officer assumes responsibility for the generation of energy as well as the development and construction of new facilities. The transmission grid is also allocated to this portfolio. The technology portfolio has been tasked with the management of the relevant entities in order to fulfil these duties. Over and beyond this, this portfolio manages and coordinates the disposal segment, regulatory management of transmissions grids, technical issues at all grid levels, group environmental protection and the areas of research and innovation and group crisis management.
Supervisory Board The Supervisory Board of EnBW AG has 20 members. In accordance with the German Co-determination Act (MitbestG), an equal number of members represent shareholders and employees. Three employee representatives are nominated by the ver.di trade union.
The Supervisory Board appoints the members of the Board of Management, and also advises them in their managerial activities. It analyses the business development and planning as well as the strategy of the company with the Board of Management at regular intervals and is responsible for approving the financial statements. The Supervisory Board is always involved in all decisions of fundamental importance for the company. Transactions and measures subject to the approval of the Supervisory Board are listed in its rules of procedure. To be able to assume its function in the best possible way, the Supervisory Board has the following committees: a personnel committee, a finance and investment committee, an audit committee, a nomination committee and a mediation committee in accordance with Sec. 27 (3) MitbestG as well as an ad hoc committee. (> Corporate governance > Supervisory Board > p. 219ff)
Further details can be found in the declaration of compliance and corporate governance report which are available in the Investors section of our homepage (http://www.enbw.com/content/en/investors/corporate_governance/cg-report/index.jsp).

Time to act
Management report
Group structure and business activity ‹
Financial statements
Corporate governance
Service
_ 45
Products, market and competition
The market and structure of competition In Europe energy suppliers can be divided into three main groups. The companies in the first group have business operations throughout Europe and in some cases operate globally. These include companies such as EDF, Enel, E.ON or RWE, whose operations are extremely diversified in a number of markets. Alongside EnBW, the companies in the second group include CEZ, DONG, EVN, Vattenfall or Verbund. These companies aim to achieve growth in selected European markets by building on their already strong position in their home markets. In contrast, the third group consists of a number of regional and local companies that have a strong position on their limited markets (for example, Hera in Italy, MVV and Thüga in Germany).
Market position of EnBW Electricity generation: In terms of electricity generation EnBW is one of the ten largest companies in Europe. In Germany, EnBW is one of the largest electricity generators alongside RWE, E.ON and Vattenfall. Our aim is to expand our generation capacities in accordance with our corporate strategy and safeguard low-carbon generation. The Rheinfelden hydro-electric power station of our subsidiary, Energiedienst Holding AG, which was officially put into operation in 2011, and the EnBW Baltic 1 wind farm are milestones in the generation of electricity from renewable energies. The facilities in Rheinfelden have an installed capacity of 100 MW and will in future generate around 600 million kWh of electricity from the energy of the Rhine. In cooperation with Stadtwerke Düsseldorf, we want to build a combined gas and steam power station at the Lausward location. Here, a combined heat and power plant is planned to generate electricity and heat as of 2016, with an output of up to 600 MW and a maximum of 270 MW of district heating. Since 2009, EnBW has been pursuing its objective of expanding its generation capacity in the area of renewable energies in Turkey as part of a joint venture. At the end of 2011, the generation portfolio, comprising wind and hydro-electric projects in operation, under construction or at the licensing stage, came to a total of 670 MW. Bandirma wind farm was put into operation in stages as of 2009 to arrive at a capacity of 60 MW and since then has generated just under 400 million kWh of electricity. The first section of the Yedigöl/Aksu hydro-electric power station was put into operation in October 2011, the second section is scheduled to start operations at the beginning of 2012. Further growth projects with a planned total output of around 330 MW are to be acquired and developed.
Regulatory area of the networks: With EnBW Transportnetze AG, EnBW owns one of the four transmission system operators in Germany. It also has various distribution networks in Baden-Württemberg. Around two thirds of the towns and municipalities in Baden-Württemberg are supplied with natural gas through GVS Netz GmbH’s high-pressure grid.
Electricity sales: The EnBW group is one of the largest electricity supply companies in Germany. In its home market of Baden-Württemberg, EnBW leads the market in the B2B and B2C customer groups. Stadtwerke Düsseldorf, in which EnBW has a shareholding, has a large share of the market in the Düsseldorf region. With an average brand awareness of 96%, Yello leads the field among energy suppliers on the German electricity market. PRE, in which EnBW holds an overall equity interest of just under 70%, is the third largest electricity supply company on the Czech market. Energiedienst Holding, in which EnBW has a shareholding of around 67%, supplies people in Switzerland and south Baden with electricity and grid-related services.
Gas: In the course of extending the value added chain, we are planning to reinforce the market position of the gas segment on an ongoing basis. In the area of gas sales, EnBW operates throughout Germany. We have an established position in our home market of Baden-Württemberg. Stadtwerke Düsseldorf achieves a large market share in the Düsseldorf region with both electricity and gas sales.
Energy and environmental services: With a view to installed thermal capacity, EnBW is one of the largest companies in Germany operating in the area of energy and environmental services. This makes the group one of the leading providers of contracting services. ESG is one of the leaders on the German industrial contracting market. EnBW Kraftwerke AG is one of the most important companies in Baden-Württemberg in the field of thermal waste disposal. Stadtwerke Düsseldorf is one of the market leaders in this segment in the Düsseldorf region. With a market share of 6.7%, REG is the largest water supplier in the federal state of Baden-Württemberg. In addition, it is one of the leading providers of grid-related services in this federal state, with a focus on the electricity sector.
Products and competition EnBW pursues a multi-brand strategy with regard to the sale of its products and services. In this respect, the central sales company, EnBW Vertrieb GmbH, manages the market activities for all brands.
Electricity Competition on the retail customer market was marked by the events in Japan, in particular in the first half of the year. According to calculations by the German Energy and Water Association (BDEW), the number of retail customers who changed their electricity supplier at least once increased between October 2010 and September 2011 by around three percentage points to 25.2%. Due to the fiercer competition, EnBW faced losses in the retail customer segment in Baden-Württemberg. However, the company succeeded in defending its good market position with a significantly higher number of new customers won and offers adapted to specific regions.

46 _
In February 2011, the “Verivox” consumer portal named EnBW as one of the electricity supply companies in Germany that offer the “the lowest prices with good service”. This means that EnBW took third place in a comparison of the 200 most important electricity suppliers throughout Germany. The high quality of EnBW’s customer service was acknowledged by TÜV Süd for the sixth time in succession in 2011 with the prestigious “quality of service” seal of approval. In April, the customer service provided for Yello was rated as the best in a test performed by the “Check24” consumer portal, and EnBW came in second. In an analysis of the 26 largest electricity companies in Germany, the business magazine “Focus Money” gave Yello “excellent” marks for fair value for money and for very good service and consulting services. The EnBW brand was given the grade “good”.
By providing consumer-oriented products and solutions, we wish to give our customers the opportunity to make active use of the new world of energy. The high level of demand in the areas of energy efficiency in buildings and complete local energy generation or smart home packages confirm that we are on the right track. Yello countered the extremely aggressive price competition in 2011 by concentrating on high-value customers. The new brand NaturEnergiePlus launched in autumn 2010 as a joint venture between EnBW Vertrieb GmbH and Energiedienst Holding AG succeeded in reaching its targets, despite the fierce and highly visible competition in the green electricity segment. According to an analysis of the switch-over process performed by “Check24”, the NaturEnergiePlus brand came in second place in the whole of Germany.
Competition for B2B electricity customers became even fiercer in the course of the fiscal year 2011. Energy consultants operating throughout Germany contributed to this development. In addition, large German energy suppliers and foreign providers are similarly working the market. In this environment, it was unavoidable that EnBW would lose customers in Baden-Württemberg and Germany. In the face of aggressive price competition, EnBW continues to rely on high-quality advice and service as well as an increasing range of efficient and sustainable solutions and services. The non-controlling shareholding in Ökotec Energiemanagement GmbH in Berlin entered into by EnBW Vertrieb GmbH in September will serve in particular to expand the range of energy efficiency services on offer.
In April 2011, EnBW Vertrieb GmbH and Energiedienst Holding AG were awarded the contract to supply a total of 262 million kWh of electricity in 2012 and 2013 in a tender process of the Association of Municipalities of Baden-Württemberg. This is equivalent to around 80% of the volume under the tender.
Gas The competition for retail and industrial customers in the gas segment also continued to gain momentum in 2011.
According to the German Energy and Water association (BDEW) the percentage of private households changing provider rose from 12.3% to 14.1% between October 2010 and September 2011. Furthermore, gas as a source of energy faces competition from other sources of energy in the retail customer segment. We aim to win over the market primarily through a high-level of service quality.
The sales function of EnBW Gas GmbH and, since 1 July 2011, EnBW Vertrieb GmbH essentially held its market position with industrial and household customers in the Stuttgart region in the course of 2011. At the same time, the sales function was expanded to cover all of Germany in the industrial segment and all of Baden-Württemberg in the household customer segment. The fact that our customer service for gas customers was once again selected as the best in its category in two competitions confirms the direction we are taking. In September 2011, “Verivox” once again awarded EnBW the best mark of “excellent”. For “Check24”, EnBW even is the only gas company that has “excellent” customer service. With its biogas charging rates or the newly introduced “EnBW HeizungRundum” small contracting model, EnBW succeeded in addressing new customer groups. The market-orientated activities relating to the introduction of local generation technologies – for example on the basis of fuel cells or combined heat and power micro-plants – continued to be driven forward. In the autumn, the 75th fuel cell plant was put into operation. The “espot” platform is a new type of cooperation between EnBW Vertrieb GmbH and five municipal utilities in Baden-Württemberg. It was formed in October 2011 and provides benefits for the participants both in terms of gas purchasing and settlement costs. The municipal utilities bundle their gas purchasing activities; EnBW assumes the advisory, settlement and balancing management services.
The current market environment in which GasVersorgung Süddeutschland GmbH (GVS) operates is characterised by intense price competition in conjunction with palpable pressure on prices and margins. This results from an extraordinarily high level of liquidity on the wholesale markets, caused by aggressive marketing of take-or-pay quantities. It was not possible to sell these quantities on account of the fall in demand in the course of the economic and financial crisis. In addition, the increasing exploration of non-conventional gas meant that supplies of liquefied natural gas (LNG) were redirected to Europe. This increased the supply side and impacted competition. This has resulted in, among other things, a significant difference between the prices prevailing at liquid trading places for spot quantities and prices stipulated in long-term oil-linked procurement agreements. This has encouraged the tendency among customers to use more than one supplier, which has caused wholesalers such as GVS to redesign their business models. GVS is positioning itself on the market as a reliable and high-performing supplier of natural gas with flexible supply models. The use of a wide range of procurement options,
Time to act
Management report
Group structure and business activity ‹
Financial statements
Corporate governance
Service
_ 47
innovative product options and active portfolio management as well as good customer relations provide a competitive edge. In the field of renewable energies, GVS has successfully established itself in the field of bio natural gas throughout Germany.
In Baden-Württemberg, GVS Netz GmbH is the market leader in the maintenance of natural gas filling stations. Its business operations are characterised by implementation of the provisions contained in the third energy liberalisation package. Under this legislation, energy companies are obliged to implement even more stringent unbundling of the trading business from grid operations. In order to meet these requirements, GVS Netz GmbH will position itself as an independent transmission system operator (ITO).
In North Rhine-Westphalia, the price competition for Stadtwerke Düsseldorf has continued to intensify on account of the increasing number of gas competitors – not only in its home area but also in the market territories outside of Düsseldorf. We are countering this competitive pressure with a new customer-centric sales strategy, optimised customer care and increased regional sales activities. The introduction of new products, such as innovative heating products and biomass projects in the area of contracting made it possible to maintain the large market share in the home market. Slight losses of customers in the retail customer segment were seen in the market territory outside of Düsseldorf as a consequence of the fierce competition.
Watt Deutschland GmbH focuses on sales to the customer groups of SMEs and chains throughout Germany also in the gas segment. In its function as gas supplier, it is able to supply customers in all H and L gas market territories throughout Germany. Following its successful launch on the gas market in 2010, Watt Deutschland GmbH significantly increased its gas sales for supplies in the years 2011 to 2014.
Energy and environmental services The market for contracting services continued to develop in the fiscal year 2011. One influencing factor was the new energy concept and the associated growing importance of the topics of energy efficiency and local energy generation. Accordingly, the offering of local energy services was expanded. In addition, the debate by market participants and associations was dominated at the beginning of the year 2012 by the amendment to the German Renewable Energies Act (EEG) and the Energy Efficiency Directive planned by the EU and their impact. The corresponding products are being developed but are not yet marketable. The continuing move towards market consolidation is reflected in the intensifying M&A activities and cooperation.
The area of disposal is focusing on the disposal of waste in thermal waste treatment plants with a high rate of fixed assets to total assets and the related materials flow management (waste to energy). In this way, EnBW offers its municipal partners reliable waste disposal services. The activities relating to thermal waste management are based on long-term contracts with districts and towns in Baden-Württemberg and North Rhine-Westphalia. The market position remained stable in both regions over 2011.
With REG, EnBW succeeded in further strengthening its position on the market for water and waste water operations in Baden-Württemberg in 2011. Within the Stuttgart network territory, unit sales of potable water to customers totalled 38 million cubic metres as in the prior year. Providing a virtually interruption-free supply as well as operating expenses and investments into the network and facilities in excess of € 10 million, EnBW demonstrated in 2011 that it is a strong partner for the capital city in providing water supplies. As an example, we pressed forward with the construction of the new Stuttgart pipeline and put the Mühlbachhof overhead storage basin into operation. Furthermore, REG is a reliable service partner for municipalities and special purpose associations outside of Stuttgart. Our research and development activities focus on increasing energy efficiency in local water supplies. From this, we derive measures to reduce CO2 emissions and to lower operating costs and implement the same. Our “EnBW LeakControl” water loss monitoring system is firmly established on the market with more than 160 units installed in Baden-Württemberg. The advantages of the system that can be used to identify and locate leaks more quickly and significantly lower water losses can be seen from the annual consumption of individual users. In addition, energy efficiency measures are of great importance for REG, such as extracting heat from waste water and optimising sewage treatment plants.
The business with grid-related services saw positive developments in 2011 as was already the case in the prior year. REG is a renowned partner on the market and is firmly anchored on the market for grid services for all voltage levels. REG is continually developing its portfolio of grid-related services and in the reporting year saw growth especially in the area of street lighting.

48 _
In order to ensure EnBW’s future sustainability, we are focusing on low-carbon generation and local
solution offers. An extensive package of measures safeguards a sound financial foundation for our
further development. The value added concept is an important instrument in the company’s
management.
Objectives and strategy
EnBW stands for progress and competition on the energy market to the benefit of the customer. With its deep roots in Baden-Württemberg, our company is one of the most important energy supply companies and energy service providers in Germany and Europe. We intend to reinforce and expand this position. In this respect, we attach great value to the financial stability of the company, which is expressed for example by an A rating.
The energy policy and energy industry environment for the business operations of EnBW have changed dramatically in recent years. In order to safeguard the company’s competitiveness and consequently its future sustainability, we are actively addressing this change and are fully committed to playing an active role in shaping the future energy landscape in Germany. In doing so, EnBW’s profile will be subject to significant changes in coming years.
Safeguarding low-carbon generation capacity: Energy generation is of fundamental importance to EnBW’s business portfolio. As of the end of 2011 the company had generation capacities of around 13,500 MW. We intend to maintain this level in the long term. EnBW’s generation portfolio is characterised by relatively low CO2 emissions. In 2011, the CO2 emissions of EnBW’s generation facilities averaged 346 kg/MWh in comparison to a mean value of 494 kg/MWh in 2010 for the German energy sector seen as a whole. While in the past this favourable comparison for EnBW was the result of a large share of energy generated from nuclear power, we will increasingly rely on the expansion of renewable energies in the future. Securing our position as a low-carbon generator is one of the key strategic moves of EnBW. To this end, we will invest in central and local facilities in the area of renewable energies – primarily in the field of wind and hydro-electric power stations. In addition, we are expanding electricity generation from gas and storage systems. This way, we will increase the flexibility of our generation portfolio and promote the integration of the renewable energies. As a supplementary measure, we are optimising
the existing power station portfolio. In the field of nuclear power, we ensure safe operations over the remaining life of the plants as well as safe decommissioning of the facilities by observing highest safety standards. (> Management report > Generation portfolio > p. 40)
EnBW has made its objective to increase the share of generation from renewable energy sources by 3,000 MW by 2020. The plans are for more than half of the electricity generation of around 50 billion kWh to be from facilities that use renewable energies by 2030. The associated CO2 emissions are expected to total somewhere between 250 and 350 g/kWh. In 2011 some 16% of EnBW’s total investment or around € 217 million went into expanding renewable energies.
One of the focal points of our activities in this area are onshore wind turbines in Baden-Württemberg, in the rest of Germany and, through our joint venture with Borusan, in Turkey. With onshore projects, we also see great potential for cooperation with municipalities and external investors. Current planning until 2015 includes projects with a capacity totalling 1,100 MW. One of EnBW’s offshore wind farms has already gone online, namely EnBW Baltic 1, which is located in the Baltic Sea (generation capacity of 48 MW). Construction work on the EnBW Baltic 2 project, with a generation capacity of 288 MW, is progressing. Municipalities and municipal utilities are invited to participate in this project, as was already the case with EnBW Baltic 1. The next stage in our offshore wind strategy will be projects in the North Sea with an anticipated total capacity of 1,200 MW, which will be implemented on the basis of innovative financing from third parties.
The possibilities for expanding electricity generation from run-of-the-river plants in Baden-Württemberg are limited on account of physical geography. In Iffezheim we will expand the capacity of the power station to 146 MW and there is an additional possibility for expansion at Rheinau-Gambsheim weir. Further projects in Turkey and Switzerland are under review. With respect to pumped storage capacities, we are
Corporate strategy and value-based management

Time to act
Management report
Corporate strategy and value-based management ‹
Financial statements
Corporate governance
Service
_ 49
developing projects in Atdorf, Forbach and, in conjunction with Illwerke, in Vorarlberg. These have a total capacity of around 2,000 MW.
We are reviewing specific projects for gas power stations at the Karlsruhe, Lubmin and Stuttgart locations. One prerequisite for economically viable operation of gas power stations is, however, the conclusion of long-term procurement agreements at attractive terms. We are negotiating strategic alliances in this context.
Establishing local solution offers: EnBW’s second strategic move is to establish localised solution offers in the field of energy. The general public, industry and business customers as well as municipalities want to have a greater say in energy-related decisions in their localities than has been the case in the past. EnBW is responding to the efforts to achieve a greater level of decentralisation and independence in supplies and intends to be the first point of contact for energy issues.
In many cases, local energy services relate to complex concepts for sustainable energy supplies. They bring together local energy generation, for example, from renewable energies, with measures to boost energy efficiency and create flexibility in demand as well as measures relating to private energy management systems and increased comfort. In the case of the “sustainable town” concept, the range of services provided by EnBW extends, for example, to identifying viable locations for wind turbines, the construction and operation of generation facilities or the development of individual e-mobility concepts or energy efficiency services (> www.nachhaltige-stadt-leutkirch.de). In this context, EnBW’s relations to municipalities and municipal utilities are taking on a new quality. The expansion of EnBW’s product ranges for municipalities reinforces unit sales in the regions. Participation in large-scale projects such as EnBW Baltic 1 and EnBW Baltic 2 or in regional distribution grids opens up new investment possibilities. EnBW’s operating functions, such as invoicing and settlement systems, are another area for action where synergy effects can be generated by opening them up to third parties. It is our long-term goal to become the leading provider of energy industry back-office solutions in Germany.
EnBW’s future development requires significant investment. At the same time, the financial headroom of the company will be restricted to a great extent by energy policy decisions within the scope of the new energy concept, delays in the completion of large-scale projects, falling margins on the wholesale market and the full auctioning of CO2 allowances in the future. In order to create financial headroom for the future-orientated restructuring of the company, without jeopardising our good financial standing, EnBW launched an
extensive package of measures, which stands on the three pillars of efficiency enhancement, divestitures and capital measures.
› The target figure for the “Fokus” efficiency programme, which was launched in autumn 2010, was stepped up by € 450 million to a volume of € 750 million affecting EBIT p.a. This total volume includes a contribution by employees of € 250 million p.a. We anticipate great potential for boosting efficiency from reducing the complexity of the group. The programme should take full effect as of the end of 2014.
› The planned volume of divestitures of equity investments in energy supply companies was raised by € 0.5 billion to € 1.5 billion. The sale of non-strategic equity investments and a reduction in shareholdings are expected to generate gains on sale. These include the sale of our equity investments in Poland to EDF as contractually agreed at the end of December 2011 and the reduction in our shareholding in Energiedienst Holding AG in Switzerland by around 15%, similarly in December 2011. Furthermore, we are planning to sell our shareholding in the Austrian energy supply company EVN. In conjunction with other effects, such as from the sale of assets, the total volume will come to € 2.6 billion. (> Management report > Investment analysis > p. 66f)
› EnBW’s first capital measure was to issue a hybrid bond with a volume of € 750 million on the capital market at the end of October 2011. The rating agencies have recognised half of this amount as equity until 2017 (> Management report > Financial position > p. 63ff). The general meeting of Zweckverband Oberschwäbische Elektrizitätswerke (OEW) held on 17 October 2011 declared its general willingness to support EnBW with further capital. With regard to a capital increase intended to be performed by EnBW in 2012, the general meeting of OEW passed a unanimous resolution on 27 January 2012 to participate in a capital increase at EnBW through its subsidiary OEW Energie-Beteiligungs GmbH with up to € 400 million. On 9 December 2011, the state of Baden-Württemberg also announced its willingness to participate in a capital increase. On 15 February 2012, the state parliament decided on authorisation to grant the corresponding guarantees for the subsidiary wholly owned by the federal state, NECKARPRI GmbH, being included in the state’s 2012 budget legislation. This means that the requirements for NECKARPRI GmbH or an entity affiliated with it as defined by Sec. 15 German Stock Corporations Act (AktG) to participate in the intended capital increase, likewise in the amount of no more than € 400 million, have been met.
In order to reduce dependency on the energy policy environment in Germany and to make targeted use of opportunities for growth and returns, we want to increase

50 _
the portion of value added generated outside of Germany in the long term. Currently, around 10% of EnBW’s income is generated from business outside of Germany. In this context, our activities focus on the Czech Republic, Switzerland and Turkey. On the other hand, we are preparing to reduce our non-controlling interests in Hungary and Austria. (> Values, goals, strategy > p. 20)
Value-based management system
One of the core elements of EnBW’s value-based management is the value added, which reflects the development of the value of the company from a financial perspective. In order to calculate the value added, the difference between the return on capital employed (ROCE) and the interest required on this capital (weighted average cost of capital, WACC) is multiplied by the capital employed, which consists of the assets from the operating business. If ROCE is above WACC, which is based on the weighted interest on equity and debt, value added is positive. An increase in this difference increases the value of the company. (> Management report > Value added 2011 > p. 72f)
Value added = ROCE – WACC x Capital employed
and ROCE = Adjusted EBIT including investment result
Capital employed
The ratio of adjusted EBIT, including investment result, to capital employed is decisive for calculating ROCE. After eliminating non-operating items, adjusted EBIT measures EnBW’s operating and sustainable performance. Strategic investments constitute a core component of EnBW’s business model, which is why the investment result is included. Since adjusted EBIT is a pre-tax figure, investment is likewise converted to a pre-tax figure. Capital employed includes all assets from the operating business less non-interest-bearing capital, for example trade payables. While adjusted EBIT including investment result is a figure that relates to a period of time, capital employed relates to the
end of the reporting period. For this reason, capital employed is calculated as the average of the opening value and closing value for the year as well as the three quarters between them. Value added acts as the basis for strategic decisions and operational measures at EnBW. A positive value added contribution by the respective project over the entire period under review is the key factor in investment and business decisions. On account of the differing risk profiles of the EnBW group’s business activities, each of the projects is based on risk-adjusted costs of capital.
A number of variables affect the value added. The level of ROCE and value added depends not only on the development of the operating business but primarily on the volume of investment. Large-scale investments typically result in a significant rise in the amount of capital employed in early years. The effect on income that boosts value, however, only arises over a protracted period some time after the investment is initially made. This is especially true of investments in property, plant and equipment relating to the construction of new power stations which do not have any positive effect on the group’s operating results until after they are put into operation. Investments in generation facilities, on the other hand, are taken into account in the capital employed already in the construction phase. In a comparison of individual years, the development of ROCE and value added is to a certain extent of a cyclical nature, depending on investment volume. This effect was already apparent in 2010 and continued in 2011. EnBW has not changed the method used to establish value added; investments are immediately allocated to capital employed. We pursue the objective of sustainably increasing the value of the company in the long term. Annual fluctuations within the investment cycle are of secondary importance.

Time to act
Management report
Economic and political environment ‹
Financial statements
Corporate governance
Service
_ 51
In 2011, the price level of primary energy sources was at times significantly higher than in the prior
year, but fell in the course of the year. Electricity prices were higher than in 2010. The energy policy
decision to phase out nuclear power presents major challenges for EnBW.
General conditions
There are various external factors that will influence the development of EnBW’s business. The most important variables include developments in the general economic, political and regulatory environment in addition to the price situation on the markets for electricity, fuels and CO2 allowances.
While energy consumption by private households is generally independent of the economic cycle, phases of strong growth or contraction in the economy are clearly reflected in industrial demand for electricity and gas. Gas sales are additionally highly dependent on prevailing weather conditions.
Political decisions at European and national level – in particular market- and competition-related regulations – impact the energy industry to a great extent. One of the main factors for the speed of change at political and regulatory level and the extensive government action in the field of energy is the socio-political will, for example, to improve climate protection or encourage the sparing use of natural resources. This means new challenges for EnBW on a constant basis, which it counters with flexible and long-term concepts.
On the cost and revenue side, the development of EnBW’s business is affected by the prices on the markets for electricity, fuels and CO2 allowances: the prices of primary energy sources and CO2 allowances essentially determine the variable costs of the power stations’ electricity production. At the same time, they are the decisive variables in the development of electricity prices on the wholesale market. The required quantity of CO2 allowances is one of the main factors in electricity production. They have to be tracked under the European emissions trading system to ensure that they match the actual volume of emissions. Alongside the price of fuel and CO2 allowances, the constantly increasing supply of renewable energies is a factor
exerting an ever-greater influence on the wholesale market. The profitability of the individual power stations varies according to the price level on the wholesale markets.
We constantly strive to reduce the uncertainties for the generation margin arising from developments in the price of primary energy sources, CO2 allowances and electricity on the wholesale markets. We consequently procure the quantities of primary energy sources and CO2 allowances required for electricity generation in advance on the forward market. We sell the planned electricity production on the forward market and through EnBW’s sales channels. Consequently, the terms of the supply contracts concluded in the previous years form the basis for costs and revenue in 2011. On the other hand, the development of prices on the forward market in 2011 will impact earnings in following periods. The same correlation applies to the quantities of electricity procured by the sales function on the forward market. (> Management report > Future development of the markets > p. 107f)
Economic environment
Overall economic developments The state of the global economy deteriorated in recent months. The International Monetary Fund (IMF) revised its growth forecast for the global economy in 2011 downwards to currently 4.0%. Negative economic indicators in the USA and the debt crisis of some euro area countries shook confidence in positive economic developments. In addition to unsolved structural problems in a large number of countries, disastrous events also put a damper on the global economy. The earthquake and tsunami in Japan exerted a negative impact on global production, while the uprisings in oil-producing countries drove oil prices upwards. Such uncertainties caused considerable volatility on the financial markets, which in turn negatively impacted the real economy. While a number of industrialised countries struggled with high levels of unemployment and structural problems, most emerging and developing economies saw continuing strong growth in 2011.
Economic and political environment

52 _
For Europe, the European Commission expects economic output in 2011 to grow by 1.6%, a similar figure to the one seen in the prior year. Growth in the euro area is anticipated to rise by about 1.5%. According to statistics published by the IMF, the economies in central and eastern Europe grew by 4.3% in the past year, after 4.4% in 2010. For the Czech Republic, the IMF anticipates gross domestic product (GDP) to rise by 2.0% (2010: 2.3%). After a considerable growth impetus of 8.9% in 2010, the IMF expects expansion in Turkey to slow a little in 2011 but remain at a high level of 6.6%.
According to initial estimates by the German Federal Statistics Office, GDP grew by 3.0% in Germany in 2011 (2010: 3.7%). The strongest buoyancy factor remained domestic demand, as was already the case in the prior year.
Energy consumption While growth in consumption had still been visible at the beginning of 2011, a slowdown in economic growth became apparent in the further course of the year. According to the working group on energy balances, AG Energiebilanzen (AGEB), energy consumption in Germany until the end of December was around 5% down on the prior-year figure. Preliminary data by the German Energy and Water Association (BDEW) reveal that electricity consumption stood at 607 billion kWh in 2011, 0.5% below the prior-year figure (610 billion kWh). All in all, a relatively mild winter caused a drop in natural gas consumption in 2011 of around 10% in comparison to 2010 to around 850 billion kWh. According to calculations by AGEB, the share of renewable energies in total energy consumption rose to around 10.8% in 2011. Consumption figures are still buoyed by German industrial production remaining at a high level.
Electricity generation and exports In 2011, electricity generation in Germany remained slightly down on prior-year levels. According to preliminary statistics by BDEW, this figure stood at 612 billion kWh in 2011, i.e. 2.5% lower than in the prior year. On balance, rising electricity imports and falling electricity exports caused smaller quantities of electricity to be exchanged with other countries.
Although nuclear power and brown coal have for years been two of the most important energy sources in Germany, the contribution of nuclear to the energy balance fell by around 23% in 2011 as a consequence of the decision to phase out nuclear power.
Gas procurement Long-term procurement agreements form the basis for the greater part of the gas that has to be imported in Germany. Of these quantities, 33% originated from Russia in 2010 (2009: 38%), 29% from Norway (2009: 37%) and 22% from the Netherlands (2009: 20%). The 11% share (2010) of domestic production in total demand is in decline. In 2009, this share
still stood at 13%. This means that Germany and the rest of western Europe are increasingly dependent on imports. As an alternative to transmission by pipeline, importing liquefied natural gas (LNG) will open up access to producing countries that are not linked by pipeline to the European market. This alternative means of procurement is increasingly gaining in importance in Europe as new import terminals go into operation.
Development of prices for primary energy sources, CO2 allowances and electricity In 2011, the spot market prices of oil, coal, natural gas and electricity were at times significantly above the levels prevailing in 2010. The higher prices are attributable in particular to the natural disaster in Japan and the associated accident in Fukushima nuclear power plant, the “Arab Spring” and the fall in the value of the euro. Prices fell in the course of the year on account of the slowing of the international economy but still remained above prior-year levels. Prices developed in a similar way on the forward market for deliveries in 2012. Surplus supplies of CO2 allowances led to a significantly lower price on average in 2011 than 2010.
Oil market: The average price for one barrel (159 l) of Brent oil for short-term deliveries (front month) stood at US$ 110.91 in 2011, 38% up on the comparable prior-year figure of US$ 80.34. Having started the year 2011 at US$ 94.84/bbl, oil prices for the front month were pushed to the significantly higher level of around US$ 115/bbl by the beginning of March on account of the protest movements in several countries in northern Africa and the Middle East and the civil war in Libya involving significant production outages. Over the next few weeks, the price for the front month rose by a further US$ 11/bbl to the annual peak of US$ 126.65/bbl at the beginning of April. This further rise was triggered by temporary economic optimism. The cooling-off of such optimism and the intensification of the debt crisis in some European countries caused a marked adjustment in oil prices at the beginning of May. At the beginning of August, downgrading of the credit rating of the US by rating agency Standard & Poor’s and the difficult debt situation in Europe and the US caused great volatility on the global financial markets. The price of Brent oil fell again as a result of expectations of a further cooling of the global economy and, accordingly, slower growth in demand for oil. The unexpectedly rapid resumption of oil production in Libya put additional downward pressure on prices as of September. Announcements of a solution to the European debt crisis and a brightening in the economic outlook brought about only brief price recoveries. As of the end of 2011, oil prices closed at US$ 107.38/bbl (front month) and US$ 105.61/bbl (front year). The price of oil deliveries in 2012 similarly averaged around 25% above the level prevailing in 2010.

Time to act
Management report
Economic and political environment ‹
Financial statements
Corporate governance
Service
_ 53
Coal market: The average price level on the forward markets for coal deliveries to the ARA ports (Amsterdam, Rotterdam, Antwerp) in 2012 stood at US$ 123.64/t in 2011, 16.3% above the average price in 2010 (US$ 106.32/t). Already at the beginning of 2011, price levels were significantly above the prior-year level on account of the after-effects of the flooding in Queensland (Australia), strong rainfall in Columbia and the rising prices on the oil market. The price curve for deliveries in 2012 (front year) was initially volatile in its movements. The events in Japan, the phase-out of nuclear power in Germany and the anticipation of growing
demand by European market participants led to rising prices as of mid-March. Until the end of September, forward prices were characterised by a sideways movement between US$ 125/t and US$ 130/t. China’s higher demand for imports compensated for Japan’s low import levels. The slowdown in the global economy and uncertainties regarding the debt crisis in Europe brought about lower prices. In addition, the US dollar recently appreciated strongly against the euro, regaining some of the ground it had lost. Towards the end of 2011, front-year contracts stood at US$ 111.94/t, up 5.3% on the prior-year average.
Price development on the oil and coal markets Average
2011 Average
2010 Average
2009
Crude oil (Brent) front month (daily quotes in US$/bbl) 110.91 80.34 62.67
Crude oil (Brent) annual price 2011 (daily quotes in US$/bbl) 108.37 86.68 76.87
Coal – weekly index for short-term delivery (API #2 Index) in US$/t 121.59 92.50 70.41
Coal – API #2 Y2012 in US$/t 123.64 106.32 101.10
Gas market: Long-term gas import contracts form the main basis for gas supplies in Germany. Prices track oil quotations with a time lapse of around six months. The border price index of the Federal Office of Economics and Export Control (BAFA) for natural gas, which is published on a monthly basis, went up once again in 2011 on account of rising oil prices. In October 2011, the index stood at € 26.78/MWh.
Another important source of natural gas are the wholesale markets such as the Dutch Title Transfer Facility (TTF) and the trading point of the NetConnect Germany (NCG) market territory. Spot market prices in the third quarter of 2011 averaged € 22.65/MWh on the TTF, which was € 5.27/MWh or 30% above the prior-year level. At the beginning of the year, the spot price remained at a high level on account of the cold start to the winter. At the end of February, prices rose once more in light of unrest in northern Africa and the Middle East and rising oil prices. The events in Japan in March 2011 led the market to assume that demand for gas there would increase in future, thereby potentially leading to a decrease in the quantities of liquefied natural gas (LNG) available for Europe, which also pushed prices upward. The price level fell
somewhat with the onset of the summer season from 1 April 2011 onwards. The German federal government’s decision made at the end of June to phase out nuclear power subsequently caused prices to increase further, particularly on the forward market. All in all, forward market prices turned out to be stable to a great extent in 2011. As of the summer, the price for deliveries in 2012 saw a sideways movement in a corridor between € 26/MWh and € 28/MWh. With the beginning of the mild winter, the price fell significantly and did not recover by the end of the year. At the beginning of August, spot market prices fell in line with the rising levels of gas held in gas storage facilities. Prices started to rise again following the announcement of servicing requirements for several LNG loading facilities in Qatar. There was a significant drop in prices towards the end of the gas business year on 30 September. However, prices recovered again in the first few days of the new gas business year. At the end of 2011, the spot market price stood at € 20.40/MWh and the price for deliveries in 2012 was € 23.28/MWh.
Development of prices for natural gas on the TTF
(Dutch wholesale market) in €/MWh
Average 2011
Average 2010
Average 2009
Spot 22.65 17.38 12.14
Delivery 2012 26.03 21.12 23.46
CO2 allowances: The prices of emission allowances (EU Allowances, EUA) for delivery in December 2011 (EUA-11) initially remained stable at around € 15/t CO2 at the beginning of the year, despite a record level of certified emission allowances (CER) being distributed. The unchanged
price level was attributable to the unusually low volume of sales by industry and small businesses due to the temporary closure of the EU register and the suspension of CO2 spot trading following a hacker attack and EUA thefts. Rising gas prices and the associated higher fuel switching costs caused
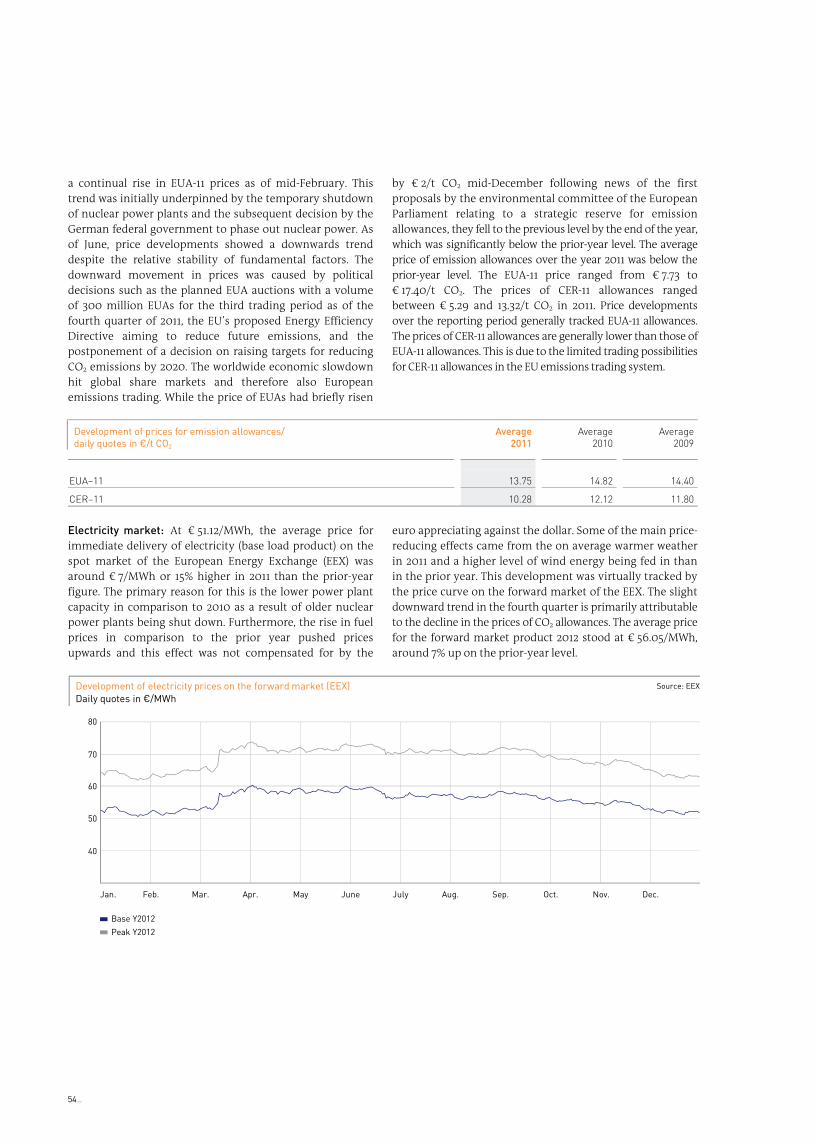
54 _
a continual rise in EUA-11 prices as of mid-February. This trend was initially underpinned by the temporary shutdown of nuclear power plants and the subsequent decision by the German federal government to phase out nuclear power. As of June, price developments showed a downwards trend despite the relative stability of fundamental factors. The downward movement in prices was caused by political decisions such as the planned EUA auctions with a volume of 300 million EUAs for the third trading period as of the fourth quarter of 2011, the EU’s proposed Energy Efficiency Directive aiming to reduce future emissions, and the postponement of a decision on raising targets for reducing CO2 emissions by 2020. The worldwide economic slowdown hit global share markets and therefore also European emissions trading. While the price of EUAs had briefly risen
by € 2/t CO2 mid-December following news of the first proposals by the environmental committee of the European Parliament relating to a strategic reserve for emission allowances, they fell to the previous level by the end of the year, which was significantly below the prior-year level. The average price of emission allowances over the year 2011 was below the prior-year level. The EUA-11 price ranged from € 7.73 to € 17.40/t CO2. The prices of CER-11 allowances ranged between € 5.29 and 13.32/t CO2 in 2011. Price developments over the reporting period generally tracked EUA-11 allowances. The prices of CER-11 allowances are generally lower than those of EUA-11 allowances. This is due to the limited trading possibilities for CER-11 allowances in the EU emissions trading system.
Development of prices for emission allowances/
daily quotes in €/t CO2
Average 2011
Average 2010
Average 2009
EUA–11 13.75 14.82 14.40
CER–11 10.28 12.12 11.80
Electricity market: At € 51.12/MWh, the average price for immediate delivery of electricity (base load product) on the spot market of the European Energy Exchange (EEX) was around € 7/MWh or 15% higher in 2011 than the prior-year figure. The primary reason for this is the lower power plant capacity in comparison to 2010 as a result of older nuclear power plants being shut down. Furthermore, the rise in fuel prices in comparison to the prior year pushed prices upwards and this effect was not compensated for by the
euro appreciating against the dollar. Some of the main price-reducing effects came from the on average warmer weather in 2011 and a higher level of wind energy being fed in than in the prior year. This development was virtually tracked by the price curve on the forward market of the EEX. The slight downward trend in the fourth quarter is primarily attributable to the decline in the prices of CO2 allowances. The average price for the forward market product 2012 stood at € 56.05/MWh, around 7% up on the prior-year level.
Base Y2012
60
50
40
Development of electricity prices on the forward market (EEX)
80
70
Peak Y2012
Jan. Mar.Feb. Apr. May June July Aug. Sep. Oct. Nov. Dec.
Daily quotes in €/MWh
Source: EEX

Time to act
Management report
Economic and political environment ‹
Financial statements
Corporate governance
Service
_ 55
Electricity and gas prices for retail and industrial customers Statistics published by the German Energy and Water Association (BDEW) in March 2011 revealed the monthly electricity bill for an average household with an annual consumption of 3,500 kWh came to € 72.77 in comparison to an average of € 69.10 in 2010. With regard to electricity prices, EnBW was forced to pass on the cost allocations under the German Renewable Energies Act (EEG) to its retail customers at the beginning of 2011. The increase was exclusively due to the government-induced price factors, the proportion of which has risen from 41% to 46%. As of the end of 2011/beginning of 2012, the prices for basic supplies remained stable, however.
As of 1 November 2011, EnBW restructured its range of heating electricity products. In conjunction with this there was the first rise in three years for electric-powered heating systems and heat pumps.
According to BDEW, electricity prices for industrial customers in 2011 rose to an average of 13.58 ct/kWh (figures for March; including electricity tax). This means that they had, for the first time, returned to levels last seen in 2008 (13.25 ct/kWh).
According to figures from the Federal Statistical Office, gas prices were 12.3% higher in January 2011 than one year previously. Prices continued to rise in the course of the year. In September 2011, quotations were 15.1% above the prior-year level. For household customers, gas was 5.4% more expensive in September 2011 than one year previously. Natural gas prices thus tracked the development of oil prices with a time lapse.
Political and regulatory environment
European energy policy The most important event relating to European energy policy in the reporting year was the meeting of the European Council on 4 February 2011 on the topic of energy.
Energy efficiency: The new action plan on energy efficiency demanded by the European Council has in the meantime been channelled into a proposal for an Energy Efficiency Directive. Among other things, it provides for energy saving requirements imposed on energy suppliers and annual renovation quotas for public buildings as well as regulations on the increased use of combined heat and power systems and regulatory requirements for reductions in power consumption. An agreement between the Council of Ministers and the European Parliament on the proposal from the Commission is expected by the middle or end of 2012.
Infrastructure and single market: The European Council is striving to complete the EU’s single energy market by 2014. In order to increase pressure on member states to implement the second and third energy liberalisation packages, the Commission not only instigated treaty infringement
proceedings but is also driving forward the European energy infrastructure. Preparation of the project lists to be approved by the Commission begins in 2012. This means that as of 2014 the first projects can begin with the funding of the EU’s new multi-annual financial framework, which has yet to be approved.
Reduction in CO2 emissions: Brussels is still discussing an increase in the EU’s reduction target to 30% by 2020 in comparison to the 1990 baseline. So far, no majority decision has been reached in either the Council or the European Parliament. At the beginning of March, climate action commissioner Hedegaard presented her “Climate Roadmap 2050”, which provides for carbon savings of 80% to 95% by 2050. A large portion of this amount will be borne by the energy industry with its decarbonisation requirements for the electricity sector of 93% to 99%. The complementary “Energy Roadmap 2050” published by the energy commissioner on 15 December provides an analysis of the technologies that are needed to reach these ambitious targets and the costs involved.
Stress tests for nuclear power plants: As a reaction to the accident at Fukushima nuclear power plant, the European Council instructed the European Commission and the European Nuclear Safety Regulators Group to perform stress tests for nuclear power plants. The purpose of these tests is to examine whether the EU’s nuclear power plants are able to withstand natural disasters and other extreme conditions. In addition, the effects of human error and human action were to be investigated. Nuclear power plant operators had to present their own assessments to the national supervisory authorities by the end of October. The latter communicated their review of the test results to the EU Commission by 31 December 2011. In a subsequent, four-month peer review, mixed teams of experts examined the national reports, in particular the three problematic areas of “extreme natural events”, “loss of safety functions” and “severe accident management”. The work is being coordinated by the EU Commission’s Joint Research Centre.
In addition to the stress tests, the prevention of dangers from terrorist acts was examined. This examination is the responsibility of a newly formed group consisting of national experts and representatives of the EU Commission.
The results of all the tests are due to be presented to the European Council, together with the first proposals for legislative measures, on 28/29 June 2012.
Financial market regulation: More stringent controls and, most of all, financial market stability and investor protection are the objectives of several legislative projects in the financial services sector. The increasing number of speculative transactions in the area of commodity derivatives trading led to proposals for regulations to be tightened, which could have extensive effects on the trading activities of energy companies.

56 _
Energy policy in Germany The dramatic events in Japan also brought about changes in the world of energy in Germany. This meant that the federal government’s energy concept and the related initiatives, measures and legislation as well as regulations and subsidy programmes were once again at the focus of energy policy discussions and decisions in 2011.
The federal government’s energy concept: The events in Fukushima induced the federal government to implement a new energy concept with radical action. The original plans were to implement the energy concept passed in autumn 2010 that had, among other things, provided for an extension of the working life of nuclear power plants. The new energy concept means a permanent shutdown of eight reactors and a shorter working life for the remaining facilities. The corresponding legislation was passed in July 2011.
As a supplementary measure, the federal government passed an extensive package of legislation on the new energy concept in the summer. It included amendments to the German Renewable Energies Act (EEG) to modify the amount of remuneration and, in particular, introduce a compression model for offshore wind farms. This provides for a higher level of remuneration but over a shorter period. Furthermore, the German Act to Accelerate Expansion of the Grid (NABEG) was also passed. As the upper house of the German parliament did not give its consent, the CCS law has not yet been passed. The possibility it offers of an opt-out clause for individual federal states is disputed. The Act on Tax Subsidies for Energy-related Renovation Measures on Residential Buildings similarly did not pass the upper house. Both acts are being discussed in the mediation committee.
German Energy Industry Act (EnWG): The new German Energy Industry Act (EnWG) came into force in summer 2011. One focus of this legislation was the transposition of the provisions of the third energy liberalisation package, such as unbundling. At the same time, it introduced changes relating to smart metering and network user charges for flexible consumption. To this end, the new act contains new authorisations to issue decrees, which the Federal Ministry of Economics will probably make use of in the new year.
German Combined Heat and Power Act: In December 2011, the federal government passed an amendment to the German Combined Heat and Power Act (KWK-G), which also provides for systems for the storage of heat and cold to be included in the subsidies. The legislative procedure is scheduled to come to a conclusion by summer 2012. The Act against Restraints on Competition (GWB) was also amended.
Regulation of the electricity and gas markets Incentive regulation: On 31 October 2011, the Federal Network Agency presented the new return on equity rates applicable for the duration of the second regulation period. These are used to determine the revenue caps for the operators of electricity and gas supply grids. The return on equity rate for new plants is 9.05% and for existing plants 7.14%; these return rates are before corporate income tax but after trade tax. The return on equity rates apply for gas grid operators as of January 2013 and for electricity grid operators as of January 2014.
On 28 June 2011, the German Federal Court of Justice (BGH) issued its decision essentially in favour of EnBW on the judicial review application filed by EnBW Regional AG on determining the cap on revenue in accordance with the Incentive Regulation Ordinance for the first regulation period (2009 to 2012 for gas networks and 2009 to 2013 for electricity networks). The points decided on by the Federal Court of Justice affect all of EnBW’s grid companies. In September, the Federal Network Agency made a corresponding settlement offer to EnBW’s grid companies in order to implement the ruling. The companies accepted the offer. The offer allows the network operators to collect the difference from the revenue cap that was set at too low a level between 2009 and 2011 via the network user charges as of 2012. Optionally, the difference can be collected over a period of between one and six years for gas and between one and seven years for electricity.
Network user charges: As part of the incentive regulation that has been in force since 2009, individual caps are set on the revenue from network user charges for gas and electricity networks which are valid for four and five years, respectively. In 2011, the third year of incentive regulation, the positive effects from the extension factor outweighed the burdens from the absorption of surplus revenues throughout the group. On 30 June 2011, the gas network operators submitted their network user charge applications to the regulatory authorities. These applications are completed on the basis of the past fiscal year 2010 for the second gas incentive regulatory period (2013 – 2017). In the area of electricity networks, quality will be introduced as a further element in incentive regulation as of 1 January 2012, which will constitute a new benefits and penalties system. The electricity grid operators received the corresponding notices in December 2011.
Reducing the number of market territories: Although originally planned for 2013, there was a reduction in the number of German market territories pursuant to the Gas Grid Access Ordinance (Gas-NZV) already as of the beginning of the gas business year 2011/2012 on 1 October 2011. There are now two market territories. All previous market territories were merged into the two remaining market territories, Gaspool and Net-Connect Germany. They include both gas qualities, L gas and H gas. Market participants are able to trade these two gas qualities on both virtual trading places.
Time to act
Management report
The EnBW group ‹
Financial statements
Corporate governance
Service
_ 57
In 2011, the EnBW group’s adjusted EBIT fell by 17.0% on the prior year to € 1,598.1 million. Weaker
operating performance was compounded by extraordinary effects. In total, the EnBW group incurred
a group net loss of € 867.3 million for fiscal year 2011.
Overall assessment of the business
development
With its sales of electricity and gas, EnBW maintained its position as Germany’s third largest energy supplier in fiscal year 2011. The operating result for 2011 fell far short of the prior-year level. Earnings were reduced primarily as a result of the newly introduced nuclear fuel rod tax as well as the shutdown of two of our nuclear power plants. Furthermore, the conclusion of Germany’s new energy concept in 2011 as well as extraordinary expenses reflected in the investment result led to considerable negative non-operating effects. In total, the group reported a net loss in terms of the loss/profit shares attributable to the equity holders of EnBW AG of € 867.3 million in 2011.
In light of the changed political conditions in the energy industry, EnBW sharpened its corporate strategy over the course of 2011 in order to safeguard the group’s scope for action and ability to prepare for the future. An extensive programme to increase efficiency has been launched and is already starting to show signs of success. The volume of planned divestitures was also increased, with the first sales
being conducted at the end of 2011. In October 2011, EnBW successfully placed a hybrid bond with a volume of € 750 million.
As in prior years, the electricity generation and trading segment was responsible for the largest share of adjusted EBIT in the group in 2011 (80.3%) and, as a result, determines the development of EnBW’s operating result. The nuclear fuel rod tax and burdens stemming from the new energy concept reduced the segment’s operating result in 2011, which fell by 20.9%. Despite stable earnings in the sales business, adjusted EBIT in the electricity grid and sales segment fell significantly as a result of higher expenses in the grid area, such as connection costs for the offshore wind farms, and higher maintenance costs. Earnings likewise declined in the gas segment. By contrast, adjusted EBIT in the energy and environmental services segment increased considerably.
At € 471.6 million, the value added of the EnBW group for 2011 fell far short of the prior-year figure. There was a slight rise in the average capital employed in 2011, while the operating result fell markedly. ROCE amounted to 11.7% for fiscal year 2011.
Forecast variances Development of sales, revenue and earnings in 2011 Forecast in the 2010 annual
report for 2011 Development
2011 Unit sales of electricity grid and sales (excluding trading) falling slightly – 2.0%
Unit sales of gas (excluding trading) falling slightly +2.4%
Energy and environmental services revenue rising slightly +9.7%
Adjusted EBIT, group – 10% to – 15% – 17.0%
The development of unit sales of electricity by the EnBW group in 2011 matched the expectations we held at the beginning of the year. The fact that unit sales of gas exceeded forecasted sales was attributable to the B2B area. The increase in revenue in the energy and environmental services segment was stronger than expected. Since autumn 2010, the political environment in the energy industry in Germany has seen a number of dramatic changes – some of
which were contradictory. Since publication of the annual report for 2010, we therefore had no choice but to make adjustments to our forecast of business development for 2011 over the course of the year. The fact that the actual development of adjusted EBIT came close to our forecast at the beginning of the year is attributable to the early and consistent implementation of measures taken to secure the future of the company.
The EnBW group

58 _
Results of operations
Unit sales and revenue Electricity sales of
the EnBW group
in billions of kWh
Generation and trading Grid and sales Total
2011 2010 2011 2010 2011 2010
Retail customers (B2C) 0.0 0.0 18.8 20.5 18.8 20.5
Industry and redistributors (B2B) 4.3 3.1 45.7 45.3 50.0 48.4
Trade 72.8 65.5 14.1 12.5 86.9 78.0
Total 77.1 68.6 78.6 78.3 155.7 146.9
In 2011, the unit sales of electricity of the EnBW group increased by 6.0% on the prior year to 155.7 billion kWh. This rise is primarily due to the 11.4% increase in trading activities. After adjusting for consolidation effects, unit sales rose by 4.6%. Unit sales of electricity to retail customers fell by 8.3% to 18.8 billion kWh in the reporting period. Milder
temperatures in comparison to the prior year and intense competition put a damper on unit sales of electricity. By contrast, unit sales to industrial customers and redistributors increased by 3.3% in 2011 to 50.0 billion kWh, mainly for consolidation-related reasons.
Gas sales of the EnBW group
in billions of kWh
2011 2010 Variance%
Retail customers (B2C) 8.5 11.8 – 28.0
Industry and redistributors (B2B) 46.4 41.8 11.0
Trade 2.5 0.0 -
Total 57.4 53.6 7.1
While gas sales to retail customers fell by 28.0% to 8.5 billion kWh in the reporting period, unit sales to business customers increased by 11.0% to 46.4 billion kWh. In addition to this unit sales in trading reached 2.5 billion kWh. In total, the EnBW group recorded a 7.1% increase in gas sales to 57.4 billion kWh in 2011 in comparison to 53.6 billion kWh in the prior year. The decline in unit sales of gas to retail customers is partially attributable to the sale of GESO
Beteiligungs- und Beratungs-AG (GESO) and its subsidiaries in the first quarter of 2010. In a year-on-year comparison, warmer weather and intense competition were additional factors negatively impacting the development of unit sales in 2011. The increase in the B2B area is due, among other things, to an increase in gas sales at GasVersorgung Süddeutschland GmbH (GVS).
External revenue of the EnBW group by segment
in € millions1
2011 2010 Variance%
Electricity generation and trading 5,449.0 4,817.0 13.1
Electricity grid and sales 10,742.6 10,192.7 5.4
Gas 1,817.7 1,788.1 1.7
Energy and environmental services 780.4 711.2 9.7
Total 18,789.7 17,509.0 7.3
1 After deducting electricity and natural gas tax.

Time to act
Management report
The EnBW group ‹
Financial statements
Corporate governance
Service
_ 59
External revenue of the EnBW group including electricity and natural gas tax rose by 7.3% year on year to € 19,757.0 million in fiscal year 2011 compared to 2010. After deducting electricity and natural gas tax, external revenue amounted to € 18,789.7 million (2010: € 17,509.0 million), an increase of 7.3%. Adjusted for consolidation effects, external revenue rose by 6.6% or € 1,169.5 million.
Electricity generation and trading: Revenue in the electricity generation and trading segment increased by 13.1% in comparison to 2010 to € 5,449.0 million in 2011. After adjusting for consolidation effects, this corresponds to an increase of 13.9%. This was attributable to positive volume effects. This caused the segment’s share of EnBW’s total group revenue to increase to 29.0% following 27.5% in 2010.
Electricity grid and sales: We accelerated our annual revenue growth in the electricity grid and sales segment to 5.4% in the reporting period. External revenue amounted to € 10,742.6 million in 2011. This rise is chiefly attributable to positive price effects. Adjusted for consolidation effects, external revenue rose by € 300.9 million or 2.9%. The share of this segment in the group’s total revenue came to 57.2% in 2011, down slightly on 2010 (58.2%).
Gas: Revenue in the gas segment increased by 1.7% year on year to € 1,817.7 million in 2011. After adjusting for consolidation effects, external revenue in this segment rose by 8.4%. This segment’s share of total group revenue decreased marginally by 0.5 percentage points on the prior year to 9.7%.
Energy and environmental services: The energy and environmental services segment increased its revenue in the reporting period by 9.7%, from € 711.2 million in the prior year to € 780.4 million. As a result, this segment’s share of total group revenue remained unchanged on the prior year at 4.1%.
Material developments in the income statement In the fiscal year, other operating income decreased by € 383.6 million from € 1,317.4 million in the prior year to € 933.8 million. Positive non-recurring effects from the deconsolidation of GESO and its subsidiaries, the increase in the shareholding in Pražská energetika a.s. (PRE) and compensation payments received for the premature termination of a long-term electricity supply agreement helped to boost income in the prior year. Due to the rise in group revenue, extraordinary expenses as a result of additions to nuclear power provisions under the amendment to the German Atomic Power Act passed by the German federal government as well as the introduction of the nuclear fuel rod tax, the cost of materials increased by 16.6% or € 2,149.1 million in 2011 to € 15,111.6 million. Other operating expenses amounted to € 1,278.6 million, up € 327.2 million on the prior-year level. This increase was primarily due to non-operating expenses of some € 300 million. The investment result showed a loss of € 646.4 million due to impairment losses, after the profit of € 103.2 million seen in the prior year. Income taxes fell by € 325.9 million to € 33.7 million. This decrease was mainly due to non-operating EBIT. (> Financial statements > Notes to the income statement and the balance sheet > p. 140ff)
Earnings In fiscal year 2011, the group incurred a net loss in terms of the loss/profit shares attributable to the equity holders of EnBW AG of € 867.3 million. In the prior year, EnBW had generated a group net profit of € 1,157.2 million in these same terms. Accordingly, earnings per share from the group net loss totalled € -3.55 in 2011, after € 4.74 in the prior year. Adjusted group net profit fell by 32.8% on the prior year to € 647.7 million.

60 _
Adjusted earnings and non-operating result One key performance indicator within the EnBW group is adjusted EBIT – earnings before interest and taxes. Adjusted EBIT is adjusted for non-operating effects in order to accurately reflect the development of results of operations. The non-operating result contains extraordinary effects
such as gains or losses on the disposal of non-current assets, extraordinary effects relating to the nuclear power provisions, income from the reversal of other provisions, expenses relating to restructuring, material effects on earnings resulting from changes in the law as well as impairment losses.
Adjusted earnings Adjusted EBIT of the EnBW group by segment
in € millions1
2011 2010 Variance%
Electricity generation and trading 1,283.1 1,622.2 – 20.9
Electricity grid and sales 199.2 263.8 – 24.5
Gas 51.3 80.1 – 36.0
Energy and environmental services 190.5 111.3 71.2
Holding/consolidation – 126.0 – 151.3 16.7
Total 1,598.1 1,926.1 – 17.0
1 Prior-year figures restated.
The EnBW group generated adjusted EBIT of € 1,598.1 million in 2011, which corresponds to a drop in the operating result by 17.0% in comparison to the prior-year figure of € 1,926.1 million. Without taking into account changes in the consolidated group, adjusted EBIT fell by 15.7%.
In 2011, adjusted EBIT generated in the electricity generation and trading segment fell by 20.9% year on year from € 1,622.2 million to € 1,283.1 million. Eliminating consolidation effects, this figure fell by 20.0%. Earnings were primarily burdened as a result of the new nuclear fuel rod tax introduced in 2011 as well as the permanent shutdown of two of our nuclear power plants as part of the new energy concept in Germany. This was accompanied by the necessary procurement of quantities of electricity from these two power plants that had already been sold on the forward market. In addition, higher fuel costs and the smaller spreads between the price of off-peak and peak electricity in comparison to the prior year also caused a further loss in earnings.
Despite stable earnings in the sales business, adjusted EBIT in the electricity grid and sales segment fell by 24.5% on the prior year to € 199.2 million. After eliminating consolidation effects, this constitutes a decrease of 27.4%. This is due to higher expenses in the grid area, such as connection costs for the offshore wind farms, as well as higher maintenance costs primarily incurred in the fourth quarter of 2011.
Adjusted EBIT in the gas segment fell far short of the prior-year level in 2011. After reaching € 80.1 million in 2010, adjusted EBIT fell by 36.0% in the reporting period to € 51.3 million. The sale of GESO and its subsidiaries were the main reason for the loss in earnings. Adjusted for consolidation effects, this segment experienced a decline of 2.5% or € 1.3 million in earnings. The volume of gas transmissions was down on the prior year due to the weather. As a result, EnBW recorded a fall in revenue from network user charges and saw earnings decrease, accordingly.
Adjusted EBIT in the energy and environmental services segment far exceeded the prior-year level in the past fiscal year, with earnings increasing by 71.2% to € 190.5 million. This rise is attributable, among other things, to our efficiency programme. The positive effect on earnings generated to date at the internal service companies was no longer passed on in full to the companies operating in other segments in 2011.
The loss recorded by the holding/consolidation segment dropped from € 151.3 million in 2010 to € 126.0 million in the reporting year. This decrease is primarily attributable to the first successes of our measures designed to increase efficiency. (> Financial statements > Segment reporting > p. 194ff)

Time to act
Management report
The EnBW group ‹
Financial statements
Corporate governance
Service
_ 61
Adjusted earnings indicators Adjusted earnings indicators of the EnBW group
in € millions1
2011 2010 Variance%
Adjusted investment result 175.2 192.3 – 8.9
Adjusted financial result – 735.3 – 669.8 – 9.8
Adjusted income taxes – 311.4 – 435.6 28.5
Adjusted group net profit 726.6 1,013.0 – 28.3
of which loss/profit shares attributable to non-controlling interests (78.9) (48.7) 62.0
of which loss/profit shares attributable to the equity holders of EnBW AG (647.7) (964.3) – 32.8
1 Prior-year figures restated.
In the fiscal year 2011, the adjusted investment result fell by 8.9% on the prior year to € 175.2 million. After eliminating consolidation effects, the adjusted investment result would be 2.8% down on the prior-year figure. This decrease in the result is due, among other things, to a decline in earnings at EWE Aktiengesellschaft.
The loss seen in the adjusted financial result increased in the fiscal year 2011 to € 735.3 million, after € 669.8 million in the prior year. This rise in the loss is due to higher amounts
from unwinding the discount on nuclear power provisions as well as higher interest expenses relating to other periods. As a result of the decrease in adjusted EBIT, adjusted income taxes fell from € 435.6 million to the current € 311.4 million. At around 30%, the adjusted income tax rate remained at the same level as in the prior year. Adjusted group net profit in terms of the loss/profit shares attributable to the equity holders of EnBW AG fell by 32.8% from € 964.3 million in the prior-year to € 647.7 million in the reporting year.
Non-operating result Non-operating result of the EnBW group
in € millions1
2011 2010 Variance%
Income/expenses relating to nuclear power – 487.3 – 63.2 -
Income from the reversal of other provisions 94.7 75.8 24.9
Gains on sale and income from acquisitions achieved in stages 26.8 473.1 – 94.3
Restructuring – 155.8 – 32.0 -
Other non-operating result – 122.7 2.6 -
Non-operating EBITDA – 644.3 456.3 -
Impairment losses – 282.9 – 257.6 – 9.8
Non-operating EBIT – 927.2 198.7 -
Non-operating investment result – 821.6 – 89.1 -
Non-operating financial result – 71.4 – 46.9 – 52.2
Non-operating income taxes 277.7 76.0 -
Non-operating group net loss/profit – 1,542.5 138.7 -
of which loss/profit shares attributable to non-controlling interests (– 27.5) (– 54.2) (49.3)
of which loss/profit shares attributable to the equity holders of EnBW AG (– 1,515.0) (192.9) -
1 Prior-year figures restated.
In the fiscal year, extraordinary expenses resulted in a loss in non-operating EBITDA of € 644.3 million, after the profit of € 456.3 million seen in the prior year. This loss is primarily attributable to the significant increase in expenses relating to nuclear power, which, after € 63.2 million in the prior year, amounted to € 487.3 million in the reporting period. The immediate and final shutdown of two of EnBW’s nuclear
power plants as a consequence of the 13th amendment to the German Atomic Power Act made it necessary to recognise an extraordinary addition to the decommissioning provisions as well as a write-off of the nuclear fuel rods in the reactor. The withdrawal of the decision to extend the working lives of the remaining nuclear power plants and their earlier dismantling as a consequence also resulted in

62 _
higher decommissioning provisions. The gains on sale in the reporting period fell by 94.3% on the prior year to € 26.8 million. The high prior-year figure is attributable to the sale of GESO and its subsidiaries as well as the sale of the shareholding in the Prague-based district heating supplier Prazská teplárenska a.s. (PT). In addition, income was generated in 2010 from the acquisition of PRE achieved in stages. Higher restructuring costs of € 155.8 million, primarily due to personnel cuts as part of the “Fokus” efficiency programme, also had a negative impact on non-operating EBITDA in 2011. The other non-operating result chiefly relates to additions to provisions. In the prior year, the other non-operating result contained compensation payments received for the premature termination of a long-term electricity supply agreement.
Impairment losses increased to € 282.9 million in 2011, after € 257.6 million in the prior year. This was due to the permanent closure of two nuclear power plants and impairment losses recognised on the gas grids, which made it necessary to recognise impairment losses on non-current assets.
In total, this produced negative non-operating EBIT of € 927.2 million, after positive earnings of € 198.7 million in the prior year.
With a loss of € 821.6 million, the non-operating investment result for 2011 was far below the prior-year result of € -89.1 million. The main factor for this were impairment losses that had to be recognised on the investments in EWE Aktien-gesellschaft (EWE) and EVN AG. At EWE, the impairment losses of € 384.8 million were caused by the increased capitalisation rate and changed conditions in the energy industry stemming from the rise in uncertainties on the capital market. The group’s carrying amount of the investment in EVN AG was adjusted to market price by recognising an impairment loss of € 245.4 million. In addition, there were other non-operating expenses of € 91.9 million and € 89.1 million relating to the accounting for EWE and EVN AG, respectively, using the equity method.
The main factor for the non-operating financial result of € -71.4 million being negatively impacted in 2011 were impairment losses on securities of € 71.2 million that were necessary in connection with falling prices on the stock markets.
Non-operating tax income amounted to € 277.7 million in 2011, following the recognition of tax income of € 76.0 million in the prior year. This was largely due to the high negative non-operating EBIT recorded in the reporting year. In total, this produced a non-operating group net loss of € 1,542.5 million for the fiscal year. The loss/profit shares attributable to the equity holders of EnBW AG amounted to € -1,515.0 million, after € 192.9 million in the prior year.
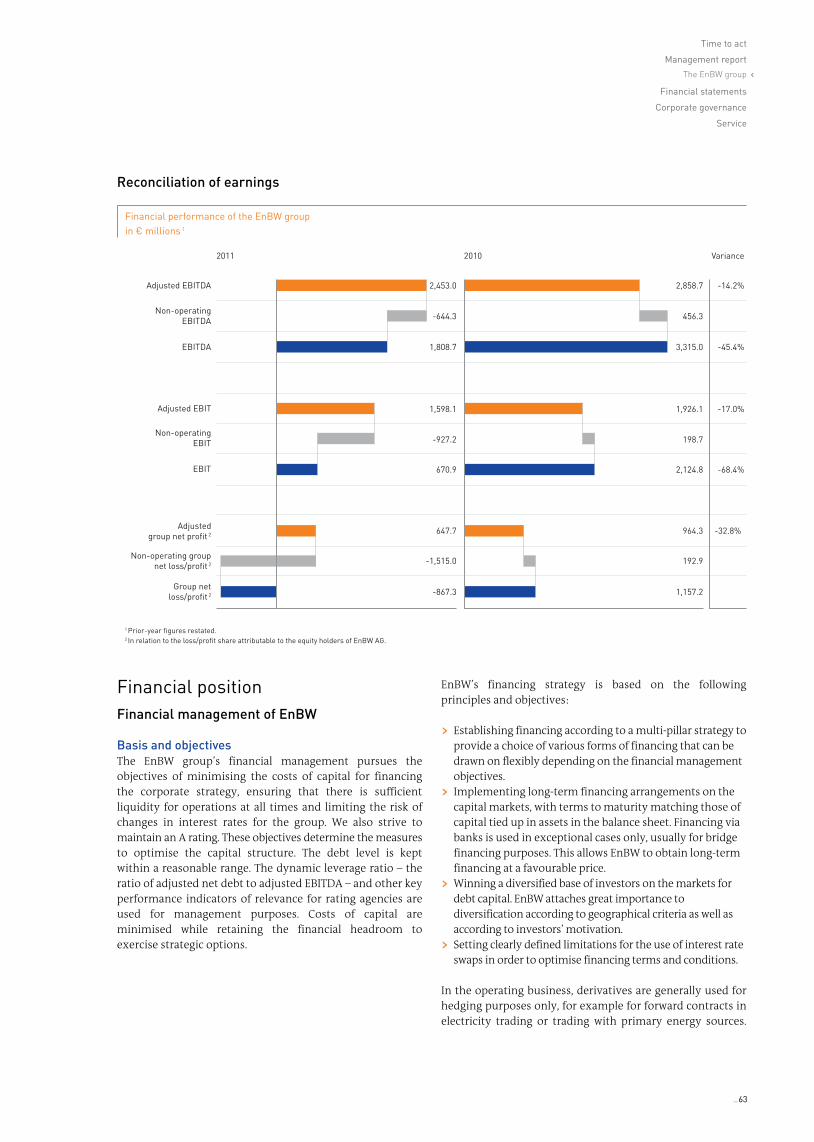
Time to act
Management report
The EnBW group ‹
Financial statements
Corporate governance
Service
_ 63
Reconciliation of earnings
Financial position
Financial management of EnBW Basis and objectives The EnBW group’s financial management pursues the objectives of minimising the costs of capital for financing the corporate strategy, ensuring that there is sufficient liquidity for operations at all times and limiting the risk of changes in interest rates for the group. We also strive to maintain an A rating. These objectives determine the measures to optimise the capital structure. The debt level is kept within a reasonable range. The dynamic leverage ratio – the ratio of adjusted net debt to adjusted EBITDA – and other key performance indicators of relevance for rating agencies are used for management purposes. Costs of capital are minimised while retaining the financial headroom to exercise strategic options.
EnBW’s financing strategy is based on the following principles and objectives:
› Establishing financing according to a multi-pillar strategy to provide a choice of various forms of financing that can be drawn on flexibly depending on the financial management objectives.
› Implementing long-term financing arrangements on the capital markets, with terms to maturity matching those of capital tied up in assets in the balance sheet. Financing via banks is used in exceptional cases only, usually for bridge financing purposes. This allows EnBW to obtain long-term financing at a favourable price.
› Winning a diversified base of investors on the markets for debt capital. EnBW attaches great importance to diversification according to geographical criteria as well as according to investors’ motivation.
› Setting clearly defined limitations for the use of interest rate swaps in order to optimise financing terms and conditions.
In the operating business, derivatives are generally used for hedging purposes only, for example for forward contracts in electricity trading or trading with primary energy sources.
Financial performance of the EnBW group in € millions 1
Adjusted EBITDA
EBITDA
Adjusted EBIT
Adjusted group net profit 2
Non-operating EBIT
Non-operating group net loss/profit 2
EBIT
Group net loss/profit 2
Non-operating EBITDA
1 Prior-year figures restated.2 In relation to the loss/profit share attributable to the equity holders of EnBW AG.
2011 2010 Variance
2,453.0
-644.3
1,808.7
1,598.1
-927.2
647.7
670.9
-1,515.0
-867.3
2,858.7
456.3
3,315.0
1,926.1
198.7
964.3
2,124.8
192.9
1,157.2
-14.2%
-45.4%
-17.0%
-32.8%
-68.4%

64 _
This also applies for foreign currency and interest rate derivatives. Furthermore, trading for own account is only permitted within narrow, clearly defined boundaries.
Financial management also includes asset management based on the appropriate provision obligations. EnBW uses a cash-flow-based model to determine the effects on the balance sheet, income statement and cash flow statement of the next 30 years. This model takes into account actuarial appraisals on pension provisions and external expert reports on provisions relating to nuclear power. It also allows simulations of various alternative scenarios.
Financial management is also responsible for securing the existing financial assets of the EnBW group and their settlement and guaranteeing a sufficient level of liquidity reserves to allow the group to meet its payment obligations at all times without restriction. The EnBW group’s treasury guidelines are defined by the financial transactions permitted by EnBW’s Board of Management and the framework within which they may be entered into. The guidelines are applicable at all entities that are consolidated in full or with which EnBW AG has a profit and loss transfer agreement, and should be referred to at all other entities as a matter of principle. Central financial management serves to minimise risks, provide transparency and optimise costs.
Treasury The treasury function manages all processes at all entities that are consolidated in full or with which EnBW AG has a profit and loss transfer agreement. Liquidity management is based on computerised rolling liquidity planning and extends to the predefined scope. It is also responsible for the central management of credit lines and bank guarantees, the issuance of guarantees and letters of comfort as well as interest rate risk and currency management.
Interest rate risk and currency management Interest rate risk and currency management involves the management and monitoring of interest-bearing and interest-sensitive assets and liabilities. The consolidated entities regularly report on existing risk items via the rolling liquidity planning. An interest rate risk strategy is devised based on an analysis conducted every quarter on a consolidated basis. The purpose is to limit the impact of fluctuation in interest rates and interest rate risks on results of operations and net assets. (> Financial statements > Interest rate risks > p. 186)
The interest rates for the EnBW group’s financial liabilities are contractually fixed for 75% of the financial liabilities. A change in interest rates can thus only affect the remaining 25% of financial liabilities. This can have an effect on EnBW’s interest result. The risk potential is determined on the basis of current interest rates and potential changes in these interest rates.
The currency items resulting from operations are generally closed by appropriate forward exchange contracts. The legal entities report net items of € 1 million or more to the holding company for a risk period of twelve months. Overall, currency fluctuation from operating activities does not have any major effect on EnBW’s profit or loss for the period. Any translation risks are monitored on a case-by-case basis in the framework of currency management.
Asset management We strive to cover the group’s non-current pension and nuclear power provisions within an economically reasonable period of time by means of investment in appropriate financial assets. The defined investment targets are to be reached with minimum risk. Efforts to optimise the risk/earnings profile of the financial assets were continued in the reporting year. An investment volume totalling around € 6 billion was managed in 2011 (prior year: € 6 billion), spread over a total of eight asset classes. The financial assets are bundled in four master funds with the following investment targets:
› Achieve long-term target return on financial assets of 5.5% › Minimise risks › Minimise the effect on the balance sheet and income
statement › Broadly diversify asset classes › Cut costs and simplify administration
Financing facilities In addition to the group’s internal financing power from a free cash flow of € 711.2 million in 2011 and the group’s own funds, the EnBW group has the following instruments at its disposal to cover its total financing needs:
› Commercial paper (CP) programme for a total of € 2.0 billion (undrawn as of 31 December 2011)
› Syndicated line of credit for € 2.0 billion with a term of five years (undrawn as of 31 December 2011)
› Bilateral short-term lines of credit (€ 397 million, undrawn as of 31 December 2011)
› Euro Medium Term Note (EMTN) programme with a line of € 7.0 billion (€ 5.0 billion utilised as of 31 December 2011)
› Measures to strengthen equity and offering of special products

Time to act
Management report
The EnBW group ‹
Financial statements
Corporate governance
Service
_ 65
On 24 October 2011, EnBW was able to place a € 750 million hybrid bond on the capital market. The bond has a term to maturity of around 60 years with repayment rights every five years after the first interest payment date. Half of the amount of the bond will be recognised as equity by rating agencies until the first possible date of repayment, thus helping to maintain EnBW’s A rating. The transaction was structured by Barclays Capital and Deutsche Bank in cooperation with EnBW. The placement was additionally performed by a syndicate of banks comprising Goldman Sachs, Morgan Stanley and Société Générale. The date for the last repayment will be 2 April 2072. The first interest payment date is 2 April 2012. The bond is equipped with a coupon of 7.375% initially and will be subordinated to all other financial liabilities. Demand was high despite the complicated bond structure. Book building was over in just a few hours with the bond heavily oversubscribed.
As of 31 December 2011, the special products included bonds throughout the group with a volume totalling CHF 400 million.
Documentation of short-term and long-term borrowings on the capital market under the established EMTN and CP programmes as well as all other credit documentation with banks (e.g. syndicated line of credit) includes standard international clauses. One key element of EnBW’s financing policy is the issuance of a negative report and a pari passu clause to all creditors.
In 2011, EnBW had access to the capital market as and when needed and no financing matured on the capital market. The bonds that mature in 2012 can be repaid without the need to borrow any additional financial liabilities. EnBW’s bonds have a well-balanced maturity profile. Thanks to our strong
internal financing power, we expect to be able to finance the planned net investments from cash flow from operating activities, potentially with some bridge financing.
The general meeting of Zweckverband Oberschwäbische Elektrizitätswerke (OEW) held on 17 October 2011 declared its general willingness to support EnBW with further capital. With regard to a capital increase intended to be performed by EnBW in 2012, the general meeting of OEW passed a unanimous resolution on 27 January 2012 to participate in a capital increase at EnBW through its subsidiary OEW Energie-Beteiligungs GmbH with up to € 400 million. At the beginning of December, the state of Baden-Württemberg announced that it is likewise willing to subscribe to a capital increase at EnBW. On 15 February 2012, as part of the state’s 2012 budget legislation, the state parliament put the necessary requirements in place such that NECKARPRI GmbH or an entity affiliated with it as defined by Sec. 15 German Stock Corporations Act (AktG) may participate in the intended capital increase, likewise in the amount of no more than € 400 million.
Details on liabilities are presented in note 24 of the notes to the consolidated financial statements. (> Financial statements > Notes to the consolidated financial statements > p. 170ff)
Rating and rating development One of the key objectives of EnBW’s financial strategy is to maintain an A rating. This criterion has been satisfied ever since the rating agencies Standard & Poor’s (2000), Moody’s (2002) and Fitch (2009) started issuing credit ratings for EnBW. However, Germany’s energy policy decisions and the consequences for its domestic energy industry meant that rating agencies were paying closer attention to German energy companies in 2011.
The rating development over the past years
Rating/outlook
2011 2010 2009 2008 2007
Fitch A-/stable A/stable A/stable
Standard & Poor's A-/stable A-/negative A-/negative A-/stable A-/stable
Moody's A3/negative A2/stable A2/stable A2/stable A2/stable
On 23 November 2011, rating agency Standard & Poor’s (S&P) confirmed EnBW’s A rating and raised the outlook to “stable”. On the one hand, this reflects S&P’s expectation that EnBW’s credit risk profile will decline as a result of Germany’s rapid phase-out of nuclear power and lower margins from electricity generation. On the other, S&P sees the change in EnBW’s ownership at the beginning of 2011 as an opportunity for the company to receive support from the state of Baden-Württemberg. This is thus reflected positively in the rating, with S&P expecting the support of the shareholders to improve the capital structure. Furthermore, S&P highlights EnBW’s strong liquidity position and expects
EnBW’s management to actively manage the company so as to maintain the key rating indicators.
On 20 December 2011, Moody’s re-assessed EnBW and revised its assessment from A2 to A3 with the outlook as negative. The primary reason given by Moody’s for this downgrading was the lower level of income and cash flows due to the closure of two of EnBW’s nuclear power plants in 2011, the nuclear fuel rod tax and lower wholesale market prices. Moody’s also took into account EnBW’s extensive package of measures and the support from the major shareholders in the planned capital increase. The rating also

66 _
considered EnBW’s shareholder composition. However, Moody’s referred to the fact that the state of Baden-Württemberg has not yet been the owner of EnBW for very long and that it therefore cannot derive any improvement in the rating from that fact. The negative outlook mostly reflects the implementation risk of these measures. However, Moody’s assumes that the measures to reinforce the capital structure and enhance profitability will lead to stabilisation of the financial indicators.
EnBW intends to maintain its A rating in the medium term in order to continue
› being a first-class address for financing partners without restricting its sources of financing
› being seen as a reliable business partner in its trading activities
› having the lowest possible interest expenses per year and › realising an appropriate number of projects, thereby
maintaining its future sustainability.
We adjusted our extensive package of measures, concluded at the end of 2010 to reinforce the financial strength of the company, over the course of the reporting year and with regard to the new energy concept in Germany.
This primarily involved increasing the volume of planned divestitures, initiating capital measures and building up the existing “Fokus” efficiency programme. We also sharpened the focus of our strategic profile. (> Management report > Corporate strategy > p. 48f)
The dynamic leverage ratio serves as a key performance indicator for financial management and as an indicator for the key performance indicators used by the rating agencies. As of the 2011 reporting date, the EnBW group’s dynamic leverage ratio came to 3.59.
Dynamic leverage ratio = Adjusted net debt
Adjusted EBITDA
Investment analysis Net cash investments of the EnBW group
in € millions
2011 2010 Variance%
Electricity generation and trading 508.3 933.4 – 45.5
Electricity grid and sales 379.1 383.3 – 1.1
Gas 119.4 92.7 28.8
Energy and environmental services 164.8 215.4 – 23.5
Total capital expenditures on intangible assets and property, plant and equipment 1,171.6 1,624.8 – 27.9
Cash paid for the acquisition of fully and proportionately consolidated entities and entities accounted for using the equity method1 85.5 643.1 – 86.7
Cash paid for the acquisition of investments2 42.1 60.0 – 29.8
Cash paid for changes in ownership interest without loss of control 19.8 0.0 -
Total investments 1,319.0 2,327.9 – 43.3
Cash received from disposals of intangible assets and property, plant and equipment – 39.2 – 45.7 – 14.2
Cash received from construction cost and investment subsidies – 83.1 – 78.3 6.1
Cash received from the sale of fully and proportionately consolidated entities and entities accounted for using the equity method3 – 6.3 – 843.9 – 99.3
Cash received from the sale of investments2 – 13.9 – 3.9 -
Cash received from changes in ownership interest without loss of control – 245.6 0.0 -
Cash received from participation models – 25.2 0.0 -
Total divestitures – 413.3 – 971.8 – 57.5
Net (cash) investments 905.7 1,356.1 – 33.2
1 This does not include cash and cash equivalents acquired. In the reporting period, these amounted to € 0.0 million (prior year: € 12.1 million) 2 Without investments held as financial assets. 3 This does not include cash and cash equivalents disposed of upon sale. In the reporting period, these amounted to € 0.0 million (prior year: € 63.0 million)..
In the fiscal year, the EnBW group reduced its total investments by € 1,008.9 million to € 1,319.0 million. The prior-year investment volume of € 2,327.9 million contained extensive financial investments.
Capital expenditures on intangible assets and property, plant and equipment came to € 1,171.6 million in the reporting period, down € 453.2 million or 27.9% on the prior-year period. They accounted for 88.8% of total investment, following 69.8% in the prior year.

Time to act
Management report
The EnBW group ‹
Financial statements
Corporate governance
Service
_ 67
At 44%, the majority of capital expenditures was attributable to replacement and renewal measures, in particular for power stations and grid infrastructure; 37% and 19% of total investment was used for growth projects and expansion projects, respectively. Capital expenditures on renewable energies came to around 16% of total investment, relating primarily to the commissioning of EnBW’s first offshore wind farm, EnBW Baltic 1, and the preparatory work for the construction of the second offshore wind farm, EnBW Baltic 2.
Capital expenditures (%)
Expansion (19) Existingportfolio (44)
Growth (37)
As in the prior year, the majority of capital expenditure was made in the electricity generation and trading segment. However, this was down 45.5% on the prior year at € 508.3 million. The group placed its investment focus on ongoing projects such as the construction of RDK 8 hard coal power station in Karlsruhe, the extension of the hydro-electric power station in Iffezheim, realisation of the offshore wind farms in the Baltic Sea and the hydro-electric power station in Rheinfelden already put into technical operation at the end of 2010. At € 379.1 million, capital expenditure in the electricity grid and sales segment was at the level of the prior year (2010: € 383.3 million). The funds mainly flowed into projects promoting the ongoing modernisation and expansion of our grids, in particular to permit the connection of facilities for the generation of renewable energies and to render them suitable for linking up to the grid. In the gas segment, capital expenditure increased by 28.8% from € 92.7 million to € 119.4 million, primarily due to progress in the construction of the gas storage facility in Etzel. Capital expenditure in the energy and environmental services segment amounted to € 164.8 million, thereby
falling by 23.5% from the prior-year level of € 215.4 million. A large share was invested in the construction of a substitute fuel power plant in Eisenhüttenstadt in the reporting year.
EnBW’s acquisitions fell by 79.0% in 2011 from € 703.1 million in the prior year to € 147.4 million. In the fiscal year, this primarily related to a subsequent purchase price payment relating to the acquisition of a shareholding in EWE Aktien-gesellschaft. The higher prior-year level was due to the increase in the shareholding in the Czech energy supplier PRE and the purchase of a share in Gesellschaft für die Beteiligung an dem Kraftwerk Rostock mbH. Divestitures amounted to € 413.3 million in fiscal year 2011, after € 971.8 million in the prior year. A significant portion of this total relates to classic divestitures associated with the sale of shares in Energiedienst Holding AG. An amount of € 25.2 million stems from the successful sale to municipal utilities of shares in the EnBW Baltic 1 offshore wind farm, and therefore relates to divestitures in participation models. The higher divestiture total in the prior year is chiefly attributable to the sale of GESO and its subsidiaries. On balance, net investments came to € 905.7 million in the fiscal year 2011 in comparison to € 1,356.1 million in the prior reporting period.
Divestitures (%)
Participation models (6)
Construction cost subsidies and other disposals (30)
Traditional divestitures (64)
Capital commitments for intangible assets and property, plant and equipment amounted to € 1,146.1 million as of 31 December 2011 (prior year: € 1,414.7 million). Commitments to acquire entities totalled € 481.1 million (prior year: € 474.5 million). The commitments will be financed from cash flow from operating activities.

68 _
Liquidity analysis Free cash flow in millions
2011 2010 Variance%
FFO electricity generation and trading1 1,451.4 2,178.4 – 33.4
FFO electricity grid and sales1 311.9 329.3 – 5.3
FFO gas1 154.1 170.5 – 9.6
FFO energy and environmental services1 305.1 260.5 17.1
FFO holding/consolidation1 – 37.4 – 106.7 64.9
Funds from operations (FFO) before taxes and financing1 2,185.1 2,832.0 – 22.8
Change in assets and liabilities from operating activities1 – 421.5 40.5 -
Income tax paid – 23.5 – 311.6 – 92.5
Cash flow from operating activities 1,740.1 2,560.9 – 32.1
Capital expenditures on intangible assets and property, plant and equipment – 1,171.6 – 1,624.8 – 27.9
Cash received from disposals of intangible assets and property, plant and equipment 39.2 45.7 – 14.2
Cash received from construction cost and investment subsidies 83.1 78.3 6.1
Free cash flow before financing 690.8 1,060.1 – 34.8
Interest and dividends received 389.1 381.6 2.0
Interest paid for financing activities – 368.7 – 355.1 3.8
Free cash flow after financing 711.2 1,086.6 – 34.5
1 Prior-year figures restated.
In the fiscal year, funds from operations (FFO) before taxes and financing fell by 22.8% compared to 2010 to € 2,185.1 million, primarily due to the decrease in group EBITDA. FFO decreased by a lower rate than EBITDA as a result of non-operating, non-cash effects in EBITDA. The higher increase in assets and liabilities from operating activities, mainly caused by higher security deposits for derivatives, saw the cash flow from operating activities plummet 32.1% in 2011 to € 1,740.1 million, after € 2,560.9 million in the prior year. Income taxes paid in 2011 were lower than in the prior year, totalling € 23.5 million after € 311.6 million in 2010. This
development was due to the sale of a corporate income tax credit, which brought about a cash inflow. The company also had to make higher tax prepayments in 2010 in comparison to the reporting year. Capital expenditure on intangible assets and property, plant and equipment fell by 27.9% to € 1,171.6 million in 2011. Free cash flow before financing decreased in fiscal year 2011 by 34.8% to € 690.8 million. The interest and dividends received and interest paid for financing activities remained on a par with the prior year. Overall, free cash flow after financing dropped by 34.5% to € 711.2 million in 2011.
Cash flow statement in millions
2011 2010 Variance%
Cash flow from operating activities 1,740.1 2,560.9 – 32.1
Cash flow from investing activities – 670.4 – 1,272.6 – 47.3
Cash flow from financing activities – 170.9 – 1,001.2 – 82.9
Net change in cash and cash equivalents 898.8 287.1 -
Net foreign exchange difference – 0.5 12.3 -
Change in cash and cash equivalents 898.3 299.4 -
The decrease in capital expenditures on intangible assets and property, plant and equipment in the fiscal year 2011 resulted in a lower cash outflow from investing activities.
At € 670.4 million, the cash outflow in the reporting year was significantly below the prior-year level of € 1,272.6 million.

Time to act
Management report
The EnBW group ‹
Financial statements
Corporate governance
Service
_ 69
Cash flow from financing activities reported a significantly reduced cash outflow of € 170.9 million in 2011 in comparison to the prior year (2010: € 1,001.2 million). Aside from the cash inflow from the hybrid bond, this was also attributable to the cash received from changes of shareholdings in entities that continue to be fully consolidated.
Taking into account the minor negative exchange rate changes, the group’s cash and cash equivalents as of 31 December 2011 rose by € 898.3 million in comparison to the end of 2010.
The EnBW group’s solvency was ensured at all times throughout the fiscal year 2011 through the liquidity available, the clearly positive free cash flow and the available external sources of financing. The company’s solvency is secured for the future by its sound financial position. This is also supported, among other things, by its free lines of credit of € 2.397 billion which are not subject to any restrictions. (> Financial statements > Notes to the income statement > p. 140ff)
Net assets
Condensed balance sheet of the EnBW group
in € millions 1
31/12/2011 31/12/2010 Variance%
Assets
Non-current assets 25,338.1 26,704.7 – 5.1
Intangible assets (2,034.6) (2,144.9) – 5.1
Property, plant and equipment (14,059.6) (13,935.7) 0.9
Entities accounted for using the equity method (2,805.2) (3,752.5) – 25.2
Other financial assets (5,442.8) (5,950.6) – 8.5
Deferred taxes (38.8) (28.2) 37.6
Current assets 10,272.7 9,063.6 13.3
Assets held for sale 209.9 11.8 -
35,820.7 35,780.1 0.1
Equity and liabilities
Equity 6,133.4 7,602.5 – 19.3
Non-current liabilities 20,747.1 20,765.5 – 0.1
Provisions (11,027.5) (10,322.1) 6.8
Deferred taxes (1,495.3) (1,800.3) – 16.9
Financial liabilities (6,263.7) (6,677.4) – 6.2
Current liabilities 8,939.6 7,412.1 20.6
Liabilities directly associated with the assets classified as held for sale 0.6 0.0 -
35,820.7 35,780.1 0.1
1 Prior-year figures restated.
As of the end of the reporting period on 31 December 2011, the total assets of the EnBW group came to € 35,820.7 million and therefore remained largely unchanged from the prior-year figure of € 35,780.1 million.
In a year-on-year comparison, non-current assets fell by 5.1% to € 25,338.1 million. This decrease is primarily due to the lower carrying amounts at entities accounted for using the equity method as part of impairment losses recognised on the investments in EWE Aktiengesellschaft and EVN AG. Falling market prices of securities are another factor.
Current assets increased by € 1,209.1 million to € 10,272.7 million. This is chiefly due to the € 650.4 million and € 898.3 million increase in other current assets and cash and cash equivalents, respectively. The increase in cash and cash equivalents is due, among other things, to the cash inflows as a result of issuing the hybrid bond and reducing our shareholding in Energiedienst Holding AG.
Assets held for sale increased by € 198.1 million to € 209.9 million as of the 2011 reporting date. This is in connection with the planned sale of our Polish investments.

70 _
Due to the group net loss incurred in 2011 and changes in other comprehensive income, equity dropped by 19.3% to € 6,133.4 million as of 31 December 2011.
As of the reporting date on 31 December 2011, non-current liabilities fell slightly from € 20,765.5 million as of the end of 2010 to € 20,747.1 million. Non-current provisions increased by € 705.4 million to € 11,027.5 million, comprising higher provisions relating to nuclear power. The opposite effect was exerted by the € 305.0 million decrease in deferred taxes to € 1,495.3 million. Non-current financial liabilities also decreased, falling from € 6,677.4 million at the end of the prior year to € 6,263.7 million as of the reporting date. This
result contained two contrary developments: As a result of the reclassification of bond liabilities totalling € 1 billion that are due for repayment at the end of February 2012, non-current financial liabilities decreased while current financial liabilities increased. On the other hand, the issue of the hybrid loan in December 2011 increased non-current liabilities.
On the whole, current liabilities increased by € 1,527.5 million to € 8,939.6 million, primarily as a result of reclassifying the liabilities for bonds. Trade payables and other liabilities also increased.
Key indicators for the analysis of the composition of assets, equity and liabilities1 2011 2010 Variance
%
Equity ratio (%) 17.1 21.2 – 19.3
Average capital employed in € millions 15,720.5 15,404.2 2.1
Adjusted net debt/equity 1.4 1.1 27.3
Coverage ratio for non-current assets (non-current assets/equity) 4.1 3.5 17.1
1 Prior-year figures restated.
As of 31 December 2011, the equity ratio fell to 17.1% as a result of the negative development of earnings in the fiscal year. The average capital employed increased by 2.1% to € 15,720.5 million in light of the positive – albeit lower than the prior year – net investments. The ratio of adjusted net debt to equity worsened in 2011, rising from 1.1 to 1.4. The lower level of equity also had a negative impact on the coverage ratio for non-current assets, which came to 3.5 after 4.1 in the prior year.
Adjusted net debt As of 31 December 2011, adjusted net debt stood at € 8,809.4 million, up slightly on the prior-year level of € 8,694.1
million. Cash and cash equivalents increased by € 1,045.7 million. This was due to the cash inflows that resulted from issue of the hybrid loan in October 2011 and the sale of a 15.05% shareholding in Energiedienst Holding AG in December 2011. By contrast, there were non-recurring non-cash effects in the reporting year, including a higher level of nuclear power provisions and the lower market value of our securities following the extreme fall in prices on the stock markets. The issue of the hybrid bond was entered under the item “Bonds”, which increased by € 705.4 million in a year-on-year comparison. As 50% of the nominal value of the hybrid bond is recognised as equity, € 375.0 million is deducted when calculating adjusted net debt.

Time to act
Management report
The EnBW group ‹
Financial statements
Corporate governance
Service
_ 71
Adjusted net debt
in € millions1
2011 2010 Variance%
Cash and cash equivalents – 3,763.8 – 2,718.1 38.5
Cash and cash equivalents of the special funds and short-term investments to cover the pension and nuclear power provisions 1,377.5 1,038.5 32.6
Adjusted cash and cash equivalents – 2,386.3 – 1,679.6 42.1
Bonds 6,196.3 5,490.9 12.8
Liabilities to banks 1,063.3 1,182.8 – 10.1
Other financial liabilities 480.2 647.2 – 25.8
Financial liabilities 7,739.8 7,320.9 5.7
Recognised net financial liabilities2 5,353.5 5,641.3 – 5.1
Pension and nuclear power provisions 10,875.9 10,170.5 6.9
Long-term investments and loans3 – 5,008.5 – 5,536.7 – 9.5
Cash and cash equivalents of the special funds and short-term investments to cover the pension and nuclear power provisions – 1,377.5 – 1,038.5 32.6
Other – 129.7 – 156.5 – 17.1
Recognised net debt3 9,713.7 9,080.1 7.0
Actuarial gains (-)/losses (+) not yet offset arising from provisions for pensions and similar obligations 106.7 157.3 – 32.2
Non-current receivables associated with nuclear power provisions – 511.0 – 464.4 10.0
Valuation effects from interest-induced hedging transactions – 125.0 – 78.9 58.4
Restatement of 50% of the nominal amount of the hybrid bond4 – 375.0 0.0 -
Adjusted net debt3 8,809.4 8,694.1 1.3
1 Prior-year figures restated. 2 Adjusted for valuation effects from interest-induced hedging transactions and 50% of the nominal amount of the hybrid bond, net financial liabilities amount to € 4,853.5 million (prior year:
€ 5,562.4 million). 3 Includes investments held as financial assets. 4 The structural characteristics of our hybrid bond meet the criteria for half of it to be classified as equity and the other half as debt by rating agencies Moody's and Standard & Poor's.
The dynamic leverage ratio is adjusted net debt divided by adjusted EBITDA.
Dynamic leverage ratio
in € millions1
2011 2010 Variance%
Adjusted net debt 8,809.4 8,694.1 1.3
Adjusted EBITDA 2,453.0 2,858.7 – 14.2
Dynamic leverage ratio 3.59 3.04 18.1
1 Prior-year figures restated.
As of 31 December 2011, the dynamic leverage ratio came to 3.59. This was attributable to the 14.2% decline in adjusted EBITDA compared to the prior year.

72 _
Value added Value added 2011 by segment Electricity
generation and trading
Electricity grid and
sales
Gas Energy and environmental
services
Holding/ consolidation
Total
Adjusted EBIT including investment result (€ millions) 1,358.5 296.1 70.9 194.0 – 88.0 1,831.5
Average capital employed (€ millions) 6,086.5 4,607.2 1,455.1 1,505.6 2,066.1 15,720.5
ROCE (%) 22.3 6.4 4.9 12.9 - 11.7
WACC (%) 9.8 8.0 8.1 8.9 - 8.7
Value added (€ millions) 760.8 – 73.7 – 46.6 60.2 - 471.6
Value added 2010 by segment1 Electricity
generation and trading
Electricity grid and
sales
Gas Energy and environmental
services
Holding/ consolidation
Total
Adjusted EBIT including investment result (€ millions) 1,702.6 350.2 90.0 115.2 – 75.9 2,182.1
Average capital employed (€ millions) 5,719.8 4,204.1 1,459.8 1,300.7 2,719.8 15,404.2
ROCE (%) 29.8 8.3 6.2 8.9 - 14.2
WACC (%) 10.1 8.6 8.6 9.0 - 9.0
Value added (€ millions) 1,126.8 – 12.6 – 35.0 – 1.3 - 801.0
1 Prior-year figures restated.
In fiscal year 2011, the EnBW group generated positive added value of € 471.6 million, which was slightly less than in the prior year. This decrease was primarily caused by the fact that adjusted EBIT including investment result fell considerably in 2011. Furthermore, there was also a slight increase in average capital employed. Accordingly, ROCE fell by 2.5 percentage points to 11.7% in fiscal year 2011.
The various segments contributed value as follows: The value added of the electricity generation and trading segment fell significantly from € 1,126.8 million in the prior year to € 760.8 million. In addition to the fall in the operating result, the higher level of capital employed also had a corresponding effect on ROCE and value added. The increase in capital employed is primarily attributable to capital expenditures on ongoing projects such as the construction of RDK 8 hard coal power station in Karlsruhe, the extension of the hydro-electric power station in Iffezheim, the development and realisation of wind power projects, in particular the offshore wind farms in the Baltic Sea (Baltic 1 and Baltic 2) and the hydro-electric power station in Rheinfelden already put into technical operation at the end of 2010.
The value added of the electricity grid and sales segment fell from € -12.6 million in the prior year to € -73.7 million. The decrease in this segment is due to the operating result falling in comparison to 2010 while capital employed increased. The increase in capital employed is essentially due to the full consolidation of the Czech energy provider Pražská energetika a.s. (PRE) since the end of the third quarter of 2010. Another factor are the capital expenditures on the ongoing modernisation and expansion of our grids, in particular to permit the connection of facilities for the generation of renewable energies and to render them suitable for linking up to the grid. Recognising the average capital employed means that for the first time the full consolidation of PRE is reflected in the level of capital employed.
The value added of the gas segment fell by € 11.6 million on fiscal year 2010 € -46.6 million in 2011 due to the decrease in earnings in this segment. Capital employed remained virtually unchanged in relation to the prior year.

Time to act
Management report
The EnBW group ‹
Financial statements
Corporate governance
Service
_ 73
In the energy and environmental services segment, value added increased by € 61.5 million to € 60.2 million in the reporting period. The increase is attributable to a rise in adjusted EBIT including investment result. The higher level of capital employed compared to the prior year is essentially a result of ongoing capital expenditures – among other things, on the construction of a substitute fuel power plant in Eisenhüttenstadt – as well as an increase in working capital.
Due to the impairment losses recognised on our strategic investments in EWE Aktiengesellschaft and EVN AG in the fiscal year 2011, capital employed with respect to the figures for the holding company/consolidation fell considerably.
Further details of the development of adjusted EBIT are given under the heading “Adjusted earnings and non-operating result” above. (> Management report > Results of operations > p. 58ff)
Calculating value added The weighted average cost of capital before tax represents the minimum return on capital employed. Positive value added is only generated once the return on capital employed (ROCE) exceeds the weighted average cost of capital. Cost of capital is determined based on the weighted average cost of equity and debt. The weighted average is the share of equity and debt in total capital. The value of equity refers to the value determined using the mark-to-market method, not the amount recognised. Cost of equity is based on the return of a risk-free investment and a company-specific risk premium (market risk premium). The latter is calculated as the difference between the risk-free investment and the return of the overall market in relation to the beta factor. The cost of capital includes the cost of equity on a pre-tax basis. The terms at which the EnBW group can obtain debt capital in the long term are used to determine the cost of debt on a pre-tax basis.
Calculation of the weighted average cost of capital 2011 2010
Risk-free interest rate (rD) 4.0% 4.0%
Market risk premium (MRP) 5.0% 5.0%
Beta factor (β) 0.8 0.9
Cost of equity after tax 7.9% 8.4%
Cost of debt before tax (rD) 6.0% 6.0%
Tax shield of interest on debt – 1.5% – 1.5%
Cost of debt after tax 4.5% 4.5%
Percentage of financing that is equity (E) 50.0% 50.0%
Percentage of financing that is debt (D) 50.0% 50.0%
WACC after tax 6.2% 6.4%
Tax rate (s) 29.0% 29.0%
WACC before tax (group) 8.7% 9.0%
WACC = (r + ß x MRP) x x E
E + D
D
E + D
1
(1-t)+ r x
In order to reflect the various risks of our activities along the value added chain, we calculate the cost of capital separately for each segment.
To calculate ROCE, adjusted EBIT is determined in a first step. The EBIT generated at group level is adjusted to eliminate any non-operating income and expenses. Investment
income and expenses are added to adjusted EBIT, provided the investments are a permanent part of EnBW’s business model. The calculation is made on a pre-tax basis to ensure comparability with adjusted EBIT.
Capital employed comprises all assets from the operating business. Non-interest bearing liabilities – such as trade payables – are deducted. Capital employed is calculated as the average of the opening value and closing value for the year as well as the three quarters.

74 _
Adjusted EBIT including investment result in € millions1 2011 2010
EBIT 670.9 2,124.8
Non-operating EBIT 927.2 – 198.7
Investment result2 – 655.9 92.6
Non-operating investment result 821.6 89.1
Tax adjustment investment result3 67.7 74.3
Adjusted EBIT including net investment income 1,831.5 2,182.1
1 Prior-year figures restated. 2 Without income from investments held as financial assets. 3 Adjusted investment result/0.71 – adjusted investment result (with 0.71 = 1 – tax rate of 29%).
Average capital employed in € millions1 2011 2010
Intangible assets 2,034.6 2,144.9
Property, plant and equipment 14,059.6 13,935.7
Investment properties 77.3 99.0
Equity investments2 3,239.5 4,166.4
Inventories 958.1 991.1
Current trade receivables3 3,042.6 3,187.5
Other assets4 2,811.8 2,234.1
Other provisions and tax provisions – 1,538.8 – 1,364.8
Trade payables and other liabilities5 – 6,408.9 – 5,893.7
Subsidies – 1,584.4 – 1,588.8
Deferred taxes6 – 1,456.5 – 1,772.1
Capital employed as of 31 December 15,234.9 16,139.3
Average capital employed7 15,720.5 15,404.2
1 Prior-year figures restated. 2 Including entities accounted fo using the equity method, shares in affiliated entities and other investments allocable to operating activities. 3 Without affiliated entities. 4 Without affiliated entities, without non-current receivables associated with nuclear power provisions. 5 Without affiliated entities, without potential purchase price obligations recognised as liabilities to non-controlling interests. 6 Deferred taxes and liabilities netted. 7 Calculation of the average based on the quarterly figures of the reporting year and the prior-year closing figure.
Unrecognised intangible assets
EnBW’s success and business development is also influenced by a range of intangible assets that are not recognised in the balance sheet. This requires optimising the use and organisation of the knowledge of our highly qualified employees in combination with modern, efficient business processes and our relationships with partners and customers. EnBW’s human, structural and relationship capital, i.e. its intellectual capital, has a significant influence on the company’s operations and business value.
We believe that the professional management of intellectual capital is of strategic importance. EnBW is the only large company in Germany that determines and reviews its intellectual capital objectives based on the principle of “Intellectual Capital Statement – Made in Germany” and has been doing so since 2005. The factors influencing
intellectual capital are assessed at key group entities in a systematic self-assessment process by several employee groups that are representative in terms of the professions and hierarchies of their members. The quality and quantity of individual factors as well as their systematic development within the company are assessed with the help of 27 questions. The results from the surveys of key group entities are then consolidated on a rolling basis.1
1 The intellectual capital statement is prepared on an alternating basis: in years ending with an
odd number it is prepared by the companies in the electricity segments and in even years at companies in the gas segment and the service companies. The results of the current year and of the prior year are consolidated in a group-wide summary (comprising the results of the intellectual capital statement at fourteen group entities). This alternating approach at segment level is primarily related to the speed of change with respect to development of intellectual capital.

Time to act
Management report
The EnBW group ‹
Financial statements
Corporate governance
Service
_ 75
This makes it possible to evaluate the development of intellectual capital within the group and to identify potential for optimisation. Measures to improve the situation are then introduced and monitored. A total of 291 measures were introduced between 2005 and 2010 to develop intellectual capital based on the results of the intellectual capital statements. The measures for management and social competence, in particular the team leader development programme, have proven to be particularly effective. Various measures to improve top-down/bottom-up communication have also been introduced successfully. EnBW’s intellectual capital has seen varied development since 2010. However, the assessments of human, structural and relationship capital are at a “good” level on average. While the evaluation of structural and relationship capital remains at around the good level of the prior year, the evaluation of human capital has continued to improve. (> Management report > Human capital > p. 86)
Structural capital: There were many differences in factors influencing the structural capital over the course of 2011. The assessment of the corporate culture improved considerably. Its overall rating is “good” and it is perceived as an open culture characterised by a desire to help others, team work and a feeling of unity. Above all, the efforts undertaken to improve corporate culture have been rated significantly better as a result of better trained management staff. By contrast, potential for improvement lies in the reinforcement of interdepartmental relations as a way of speeding up the group’s decision-making and operational processes.
The EnBW group’s communication and organisation was rated less favourably in 2011 than in the prior year and is now somewhere at the low end of “good”. As a result of their growing complexity, interfaces between departments, levels of hierarchy and the separate entities have optimisation potential in terms of efficiency, consistency and clarity.
The assessment of the company’s innovative power has worsened and is now at a “satisfactory” level. In particular, the lower assessment of quantity is attributable to the growing strategic demands for innovations in line with the drastic changes in market and legal conditions. Potential for improvement of the company’s innovative power was seen in the prioritisation and allocation of resources, consistent planning and implementation as well as the involvement of external innovation partners.
excel-lent
good
satis-factory
Communication and organisation
Corporate culture
Innovation
Development of the factors influencing the intellectual capital
of EnBW
Structural capital
2007 2008 2009 2010 2011
Relationship capital: The assessment of relationship capital reveals that relationships with shareholders and cooperation partners – at the top end of “good” – are somewhat better than relationships with customers, which achieved a “satisfactory” rating. Increasingly difficult market conditions and intense competition at a time when growth ambitions continue to rise have reduced the quality of customer relationships.
Relationships with cooperation partners continue to be rated as “good”. The quality and quantity of this factor even rose a little in comparison to the prior year. The number of cooperation projects was considered “excellent”. This factor can be strengthened by intensifying the individual relationships, such as those with research institutions. A more systematic approach to managing relationships with cooperation partners also needs to be taken.
As in the prior year, assessments of relationships with stakeholders were close to an excellent level in 2011. However, respondents still identified potential for improvement with respect to specific stakeholder groups.

76 _
Relationship with cooperation partners
Relationship with customers
Relationship with stakeholders
Development of the factors influencing the intellectual capital
of EnBW
Relationship capital
excel-lent
good
satis-factory
2007 2008 2009 2010 2011
Market research The EnBW brand is very important for us. A positive brand image is key to success in relationships with customers, partners and authorities, and must therefore be maintained and built on. The prerequisite is a clear positioning of EnBW
amidst intense competition, which is in turn based on EnBW’s brand identity. This strategic alignment has meant that, besides being very well known in Baden-Württemberg, the EnBW brand is also appreciated by its customers as an experienced and reliable partner with regional roots. Managing this intangible asset, the brand, pays off: the image of EnBW perceived by customers strengthens their loyalty to the company. As part of our focused corporate strategy, we aim to strengthen our future position on the market even further as a partner offering local energy solutions and to secure our generation position with low CO2 emissions.
Customer loyalty is based on high customer satisfaction. The intense competition in the industry continued to take its toll on customer satisfaction and customer loyalty among EnBW’s retail customers this year. Customer loyalty to EnBW suffered in 2011 as a result of the events in Japan, with analyses showing that the good level of the prior year was not quite reached. However, where customer satisfaction is concerned, EnBW nonetheless continued to place well among its national competitors RWE, E.ON and Vattenfall.

Time to act
Management report
EnBW AG ‹
Financial statements
Corporate governance
Service
_ 77
EnBW AG’s net profit/loss for the year fell by € 985.4 million in relation to the prior year, primarily as
a result of non-recurring effects. This produced a net loss for the year of € 68.8 million. Taking account
of the profit carryforward of € 299.5 million, retained earnings come to € 230.7 million. A dividend of
€ 0.85 per share, down by € 0.68, will be proposed to the annual general meeting.
EnBW AG
As holding company, EnBW Energie Baden-Württemberg AG (EnBW AG) exercises the management function in the EnBW group. The economic situation of EnBW AG hinges on the economic situation of the group. The financial statements of EnBW AG are prepared in accordance with the German Commercial Code (HGB) and the German Stock Corporations Act (AktG). The detailed financial statements of EnBW AG audited by KPMG AG Wirtschaftsprüfungsgesellschaft, Mannheim, and the management report of EnBW AG, which is combined with the group management report, will be published in the Electronic German Federal Gazette (“elektronischer Bundesanzeiger”) together with the unqualified audit opinion. The full financial statements of EnBW AG are available for download. (> www.enbw.com > Investors > Download centre)
Net assets of EnBW AG
The net assets of EnBW AG are largely dependent on its equity investments and the central treasury management. The central treasury management affects financial assets as well as receivables from, and liabilities to, affiliated entities. The pension obligations of the main subsidiaries are bundled at EnBW AG. The annual expenses for retirement benefits of active employees are paid by the subsidiaries concerned in each case.
Condensed balance sheet of EnBW AG
in € millions1
31/12/2011 31/12/2010
Assets
Non-current assets
Intangible assets 6.2 8.7
Property, plant and equipment 8.5 9.6
Financial assets 16,178.7 16,690.8
16,193.4 16,709.1
Current assets
Receivables from affiliated entities 2,600.6 2,123.6
Other receivables and other assets 211.1 494.3
Cash and cash equivalents 2,302.9 1,711.5
5,114.6 4,329.4
Prepaid expenses 43.3 51.8
Excess of covering assets over pension and similar obligations 0.1 0.1
21,351.4 21,090.4 1 According to German commercial law.
EnBW AG

78 _
Condensed balance sheet of EnBW AG
in € millions1
31/12/2011 31/12/2010
Equity and liabilities
Equity
Subscribed capital 640.0 640.0
Attributable to the group – 14.7 – 14.7
Issued capital (625.3) (625.3)
Capital reserve 22.2 22.2
Revenue reserves 1,592.5 1,592.5
Retained earnings 230.7 673.2
2,470.7 2,913.2
Provisions 4,774.2 4,055.6
Liabilities
Liabilities to affiliated entities 12,492.8 13,182.0
Other liabilities 1,603.8 927.0
14,096.6 14,109.0
Deferred income 9.9 12.6
21,351.4 21,090.4
1 According to German commercial law.
Financial assets decreased by € 512.1 million, primarily on account of the impairment losses that had to be recognised for the investments in EWE Aktiengesellschaft (EWE) and EVN AG. The increase in current assets is largely due to the increase in cash and cash equivalents stemming from the issue of a hybrid bond.
The equity ratio of EnBW AG fell by 2.2 percentage points on the prior year to 11.6%.
The increase in provisions is primarily due to the provisions for pensions and similar obligations. In the prior year, EnBW applied the transitional provisions of Art. 67 Introductory Law of the German Commercial Code (EGHGB) with regard to pensions and similar obligations and in fiscal 2011 added the remaining difference of € 503.8 million in full.
Other liabilities increased primarily as a result of placing a hybrid bond of € 750.0 million.

Time to act
Management report
EnBW AG ‹
Financial statements
Corporate governance
Service
_ 79
Net profit of EnBW AG and dividend Condensed income statement of EnBW AG
in € millions1
2011 2010
Investment result 1,004.0 1,997.9
Interest result – 473.3 – 481.5
Personnel expenses – 59.0 – 57.7
Other income and expenses 91.6 102.0
Profit from ordinary activities 563.3 1,560.7
Extraordinary expenses – 503.8 – 346.9
Taxes – 128.3 – 297.2
Loss/profit for the year – 68.8 916.6
1 According to German commercial law.
The net loss for fiscal year 2011 recorded by EnBW AG amounts to € 68.8 million, € 985.4 million below the prior-year level. Retained earnings total € 230.7 million and include the profit carried forward of € 299.5 million. The investment result was down € 993.9 million compared to the prior year. Burdens arose for subsidiaries as a result of the newly introduced nuclear fuel rod tax as well as the shutdown of two nuclear power plants. Impairment losses also had to be recognised on investments, amounting to € 720.7 million. By contrast, there were withdrawals from other revenue reserves at subsidiaries resulting from the prior-year transition to the requirements of the German Accounting Law Modernisation Act (BilMoG).
Other income and expenses contain additions of € 150.0 million to the provision for personnel redundancies as part of the “Fokus” efficiency programme.
Extraordinary expenses relate to the allocation to the provision for pensions and similar obligations as a result of fully taking into account the remaining difference that arose as a result of converting to the requirements of the German Accounting Law Modernisation Act (BilMoG) in the prior year.
The tax expense is € 168.9 million lower than in the prior year, amounting to € 128.3 million. The decrease is primarily due to provisioning for risks from tax field audits. The item relates to current tax only, as the option to recognise deferred tax assets was not exercised for the deferred tax assets net of deferred tax liabilities. The extraordinary result is not influenced by income taxes.
We will propose to the annual general meeting on 26 April 2012 that a dividend of € 0.85 per share be distributed from
the retained earnings of EnBW AG. As of 31 December 2011, a total of 244,256,523 shares were entitled to dividends. If the annual general meeting approves this proposal, the amount distributed by EnBW AG for fiscal 2011 will total € 207.6 million.
Comments on reporting
Since 31 December 2003, in accordance with Sec. 315a (1) German Commercial Code (HGB), the consolidated financial statements of the EnBW group have been prepared according to the International Financial Reporting Standards (IFRSs) issued by the International Accounting Standards Board (IASB), as endorsed by the European Union as of the reporting date.
Dependent company declaration
Pursuant to Sec. 312 German Stock Corporations Act (AktG), the Board of Management of EnBW AG prepared a dependent company report for the fiscal year 2011. This details relationships with affiliated entities, and closes with the following declaration: “In the legal transactions listed in the dependent company report, and according to the circumstances that were known to us when those legal transactions were performed, our company received an appropriate consideration in each legal transaction and was not placed at a disadvantage. We did not take, or refrain from taking, any reportable actions motivated by or in the interest of the controlling companies or their affiliated entities.”

80 _
Sustainability is an integral component of EnBW’s corporate philosophy. Our aim is to bring economic
success even closer together with our environmental and social responsibility.
EnBW has dedicated itself to sustainable corporate governance, manifested in the sustainability strategy adopted at the beginning of 2012. The objective of the strategy is for EnBW to bring all of its key processes in line with the concept of sustainability, to develop new sustainability-oriented business models and to position EnBW as a sustainable company. The sustainability strategy, which serves as a management tool, supports the corporate strategy and is divided into three fields of action:
› Innovation and growth: The innovation-based expansion of renewable energies, local solutions and energy efficiency services opens up new business possibilities for EnBW and helps to reduce CO2 emissions. The “sustainable town” model is an innovative platform for sustainable products and services, strengthening EnBW’s collaboration with municipalities and municipal utilities.
› Processes: Sustainable orientation of processes and employee behaviour reduces environmental and reputational risks, increases transparency of the supply chain and improves quality and cost efficiency.
› Employees and society: With our sustainable HR policy, we aim to increase the qualifications and motivation of our employees. We have more than 20,000 employees promoting energy-efficient consumer behaviour. Open dialogue creates transparency and understanding for EnBW’s sustainability activities.
These activities are described in detail in EnBW’s regular sustainability report (> www.enbw.com > Group > Sustainability report). Performance indicators serve to provide the necessary transparency regarding the sustainability of our activities. By participating in the pilot project run by the International Integrated Reporting Committee (IIRC), EnBW is increasing its efforts to combine the financial, environmental and social aspects of its activities.
Sustainability 2011 2010 2009
Renewable energies
Own generation from renewable energies billions of kWh 6.4 7.1 7.1
Share of renewable energies in EnBW’s own generation portfolio1 % 10.8 10.5 11.0
Capital expenditure on renewable energies € millions 216.6 536.4 153.7
Renewable energies generation capacity1, 2 MW 2,538 2,478 3,011
Share of renewable energies in EnBW’s total capacity1, 2 % 19 17 19
Grids
Average energy needed to cover losses in the transmission grid % 1.2 1.2 1.3
Average energy needed to cover losses in the distribution grid % –3 2.5 2.3
Fuels4
Coal GJ 203,424,996 190,305,735 160,002,932
Natural gas GJ 23,847,593 25,266,415 21,998,318
Waste GJ 8,855,220 9,297,054 8,587,948
Biomass2 GJ 2,836,802 1,752,844 1,663,474
Other5 GJ 1,914,032 1,868,699 1,910,929
Nuclear fuel employed t of uranium 38 84 59
Sustainability

Time to act
Management report
Sustainability ‹
Financial statements
Corporate governance
Service
_ 81
Sustainability 2011 2010 2009
Other consumables
Calcium carbonate products t 291,878 315,459 493,571
Ammonia/ammonium hydroxide t 20,976 22,810 22,133
Sodium hydroxide t 8,174 8,377 8,302
Hydrochloric acid t 6,057 6,495 5,618
THT used as odorant t 36 45 49
Emissions, waste4, water4
CO2 emissions from electricity generation6 g/kWh 3467 299 251
NOx emissions from electricity generation6 mg/kWh 231 204 166
SO2 emissions from electricity generation6 mg/kWh 206 192 163
Dust emissions t 413 275 451
Carbon dioxide millions of t 21.87 20.9 16.9
Sulphur hexafluoride8 t < 1 < 1 < 1
Conventional waste t 558,470 776,929 748,141
of which hazardous waste9 t 123,792 57,889 55,083
Percentage recycled % 80.0 96.3 95.5
Radioactive waste10 g/kWh 0.0013 0.0014 0.0015
Cooling water discharged millions of m3 2,751 2,965 2,741
Surface and river water drawn millions of m3 2,762 3,027 2,808
Well and groundwater extraction millions of m3 8 8.00 7.99
Extraction of drinking water millions of m3 41.2 46.0 46.2
Energy efficiency and environmental protection expenditure
Consulting in energy efficiency measures Number 21,823 21,318 20,876
Energy saved on a long-term basis through energy efficiency projects at customers millions of kWh 150 198 218
Capital expenditure on environmental protection11 € millions 253 184 200
Current environmental protection expenses11 € millions 230 190 168
Employees
Employees Number 20,296 20,952 21,124
Number of full-time equivalents Number 19,441 20,119 20,064
Trainees at the core companies % 7.1 7.3 7.6
Women % 25.6 25.5 25.2
Women in managerial positions % 10.2 9.9 8.3
Health rate % 95.7 95.8 95.8
Employee turnover % 4.6 4.2 4.2
1 Run-of-the-river power stations, storage power stations using the natural flow of water and other renewable generation capacities. 2 Prior-year figures restated. 3 Information not available at the time of printing. 4 Own generation including contract power stations; not including long-term procurement agreements and short-term procurement where the primary source of energy is unknown. 5 Heating oil and sewage sludge. 6 Own generation includes long-term procurement agreements and generation from partly owned power stations. 7 Preliminary data. 8 Monitoring in accordance with the voluntary commitment on SF6. SF6 emissions pursuant to the voluntary commitment procedure. 9 Total of recycling and waste disposal. 10 Pursuant to the BDEW's electricity labelling guidelines (September 2011), in term of EnBW's own generation portfolio. 11 Pursuant to the German Environmental Statistics Act (UStatG) and BDEW’s guidelines on the recognition of investment and ongoing expenditure relating to environmental protection (April 2007).

82 _
Renewable energies The share of renewable energies in our own generation portfolio increased slightly in comparison to 2010. Investments serving to increase this share of renewable energies, primarily the commissioning of the Rheinfelden run-of-the-river power station and the offshore wind farm EnBW Baltic 1, are proof of our commitment to increase our renewable energy generation capacity by 3,000 MW by 2020. Despite the increase in capacities, the share of renewable energies in our own generation portfolio fell to 6.4 billion kWh. This was due to the dry spell in 2011, which led to a fall in the energy generated at run-of-the-river power stations.
In 2011 investment in renewable energies amounted to around € 217 million (approximately 16% of EnBW’s total investment). Over the coming years, we plan to invest between € 8 and € 10 billion in the new energy concept by 2020, thus further increasing the share of renewable energies in our own generation portfolio. By 2020, the share of renewable energies in EnBW’s total generation capacity will thus increase to some 35%.
Fuels and other consumables The volume of fuels and other consumables we use is highly dependent on the utilisation of power plant capacities within the fossil generation portfolio. Changes on the prior year range between 2% and 8%, which are customary for this area.
The decommissioning of unit I of Neckarwestheim nuclear power plant (GKN I) and unit 1 of Philippsburg nuclear power plant (KKP 1) led the consumption of nuclear fuel to more than halve from 84 t of uranium in the prior year to 38 t of uranium in 2011.
Emissions CO2 emissions from electricity and heat generation increased by 0.9 million t or 4.3%. This was due to a shift within the fossil generation portfolio. In 2011, the specific CO2 emissions from EnBW’s own electricity generation increased by some 15% on the prior year to 346 g/kWh. This
is attributable to the fall in the share of nuclear energy as a result of decommissioning the GKN I and KKP 1 units, while the share of conventional electricity generated remained virtually the same. However, the specific CO2 emissions of our own electricity generation are still far below the energy source mix for Germany of 494 g/kWh for 2010 (figures for 2011 not available at the time of printing).
Waste A total of 558,470 t of conventional waste was produced in 2011, down 30% on the prior year. This is primarily due to the significantly lower volume of demolition and excavation material at Stadtwerke Düsseldorf. The increase in the volume of hazardous waste to 123,792 t is primarily due to the Eisenhüttenstadt industrial power plant commencing regular operations. Along with a decrease in the total volume of waste, this also resulted in a fall in the percentage of recycled waste from 96% in the prior year to 80% in 2011.
Environmental protection expenditure In 2011, capital expenditures for environmental protection increased from € 184 million to € 253 million and ongoing expenses for environmental protection from € 190 million to € 230 million. This increase of some 37% and 21%, respectively, is due to the expenses incurred with respect to renewable energies, which for the first time in 2011 were fully recognised as climate protection expenditure as defined by BDEW’s guidelines.

Time to act
Management report
Employees ‹
Financial statements
Corporate governance
Service
_ 83
Our employees are key to EnBW’s success. The objective of the personnel strategy is to support our
focused corporate strategy. Systematic management of the employer brand helps to position EnBW
as an attractive company. The assessment of human capital has improved further.
Headcount development and
personnel composition
As of 31 December 2011, the EnBW group employed 20,296 people. This constitutes a decrease of 656 employees or 3.1% in comparison to the end of 2010. Changes made to the allocation of employees caused employee numbers within the different business segments to shift in 2011. The increase
in the number of employees in the electricity grid and sales segment is due, among other things, to the change in allocation of some employees from the energy and environmental services segment. In the energy and environmental services segment, OSD Schäfer GmbH was deconsolidated with 830 employees. Adjusted for this deconsolidation effect, the number of employees in the EnBW group increased by 0.8% as of year-end 2011 compared to the end of 2010.
Employees of the EnBW group1 31/12/2011 31/12/2010 Variance
%
Electricity generation and trading 4,940 4,850 1.9
Electricity grid and sales 6,173 5,535 11.5
Gas 702 704 – 0.3
Energy and environmental services 7,990 9,378 – 14.8
Holding 491 485 1.2
Total 20,296 20,952 – 3.1
Number of full-time equivalents2 19,441 20,119 – 3.4
1 Number of employees without apprentices and without inactive employees. 2 Number of employees translated into full-time equivalents.
A share of 25.4% of employees at EnBW have a degree from a university, university of applied sciences or university of cooperative education (prior year: 23.8%); 68.7% of staff have completed a training programme at a technical college or an apprenticeship (prior year: 69.9%), while the remaining 5.9% have school-leaving certificates without further professional training (prior year: 6.3%). At the end of 2011, women accounted for 25.6% of the total headcount (25.5%). The proportion of women in managerial positions reached 10.2% (prior year: 9.9%). In comparison to 2010, the proportion of part-time employees, including employees participating in the phased retirement scheme, increased by 12.4% or 2,522 employees. The percentage of female part-time employees rose from 59.5% in the prior year to 59.9% or 1,510. Employee turnover amounted to 4.6% (prior year: 4.2%), with the health rate among EnBW employees coming to 95.7% (prior year: 95.8%). The regional distribution of our employees has changed only marginally since the prior year. The majority
of our employees are located in Baden-Württemberg. Most of the 8.0% of the workforce outside Germany are employed at the equity investment in the Czech Republic.
Employees by region (%)
in other countries (8.0)
in other German states (19.4)
in Baden-Württemberg (72.6)
Employees
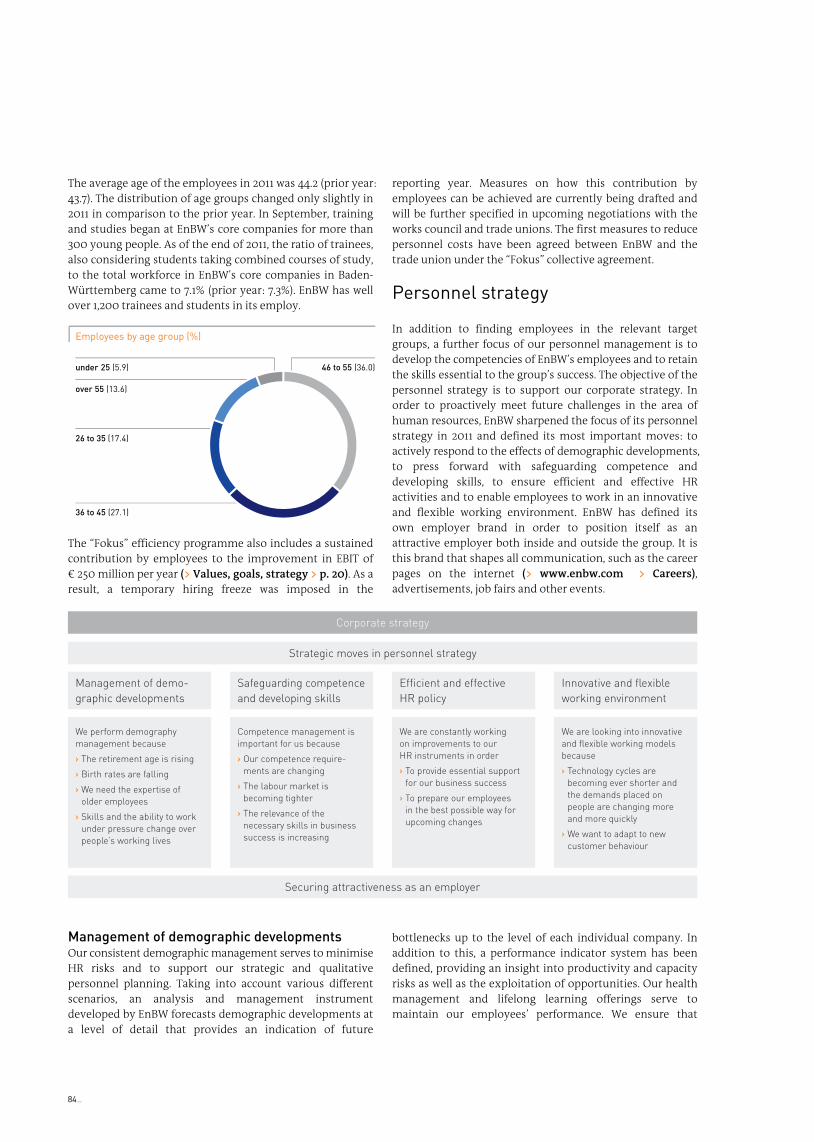
84 _
The average age of the employees in 2011 was 44.2 (prior year: 43.7). The distribution of age groups changed only slightly in 2011 in comparison to the prior year. In September, training and studies began at EnBW’s core companies for more than 300 young people. As of the end of 2011, the ratio of trainees, also considering students taking combined courses of study, to the total workforce in EnBW’s core companies in Baden-Württemberg came to 7.1% (prior year: 7.3%). EnBW has well over 1,200 trainees and students in its employ.
Employees by age group (%)
under 25 (5.9)
over 55 (13.6)
46 to 55 (36.0)
26 to 35 (17.4)
36 to 45 (27.1)
The “Fokus” efficiency programme also includes a sustained contribution by employees to the improvement in EBIT of € 250 million per year (> Values, goals, strategy > p. 20). As a result, a temporary hiring freeze was imposed in the
reporting year. Measures on how this contribution by employees can be achieved are currently being drafted and will be further specified in upcoming negotiations with the works council and trade unions. The first measures to reduce personnel costs have been agreed between EnBW and the trade union under the “Fokus” collective agreement.
Personnel strategy
In addition to finding employees in the relevant target groups, a further focus of our personnel management is to develop the competencies of EnBW’s employees and to retain the skills essential to the group’s success. The objective of the personnel strategy is to support our corporate strategy. In order to proactively meet future challenges in the area of human resources, EnBW sharpened the focus of its personnel strategy in 2011 and defined its most important moves: to actively respond to the effects of demographic developments, to press forward with safeguarding competence and developing skills, to ensure efficient and effective HR activities and to enable employees to work in an innovative and flexible working environment. EnBW has defined its own employer brand in order to position itself as an attractive employer both inside and outside the group. It is this brand that shapes all communication, such as the career pages on the internet (> www.enbw.com > Careers), advertisements, job fairs and other events.
Securing attractiveness as an employer
Strategic moves in personnel strategy
Corporate strategy
Management of demo-
graphic developments
We perform demography
management because
› The retirement age is rising
› Birth rates are falling
› We need the expertise of
older employees
› Skills and the ability to work
under pressure change over
people’s working lives
Safeguarding competence
and developing skills
Competence management is
important for us because
› Our competence require-
ments are changing
› The labour market is
becoming tighter
› The relevance of the
necessary skills in business
success is increasing
Efficient and effective
HR policy
We are constantly working
on improvements to our
HR instruments in order
› To provide essential support
for our business success
› To prepare our employees
in the best possible way for
upcoming changes
Innovative and flexible
working environment
We are looking into innovative
and flexible working models
because
› Technology cycles are
becoming ever shorter and
the demands placed on
people are changing more
and more quickly
› We want to adapt to new
customer behaviour
Management of demographic developments Our consistent demographic management serves to minimise HR risks and to support our strategic and qualitative personnel planning. Taking into account various different scenarios, an analysis and management instrument developed by EnBW forecasts demographic developments at a level of detail that provides an indication of future
bottlenecks up to the level of each individual company. In addition to this, a performance indicator system has been defined, providing an insight into productivity and capacity risks as well as the exploitation of opportunities. Our health management and lifelong learning offerings serve to maintain our employees’ performance. We ensure that

Time to act
Management report
Employees ‹
Financial statements
Corporate governance
Service
_ 85
expertise at the company is preserved using our knowledge relay tool.
Safeguarding competence and developing skills With our EnBW competence management tool “KomMit”, we prepare our employees in a targeted manner for future challenges and thereby strengthen the company’s competitiveness. The programme is being introduced step by step and was applied in staff appraisal meetings for the first time in 2011 among certain user groups. Uniform target profiles for employees, clear assessment criteria and structured review discussions make it easier to identify and respond to development needs in an efficient way. In this regard, EnBW Akademie has an extensive selection of off-the-job offerings. Furthermore, employees are to work more on their development “on the job” in future, for example by taking on new tasks or through job rotation. Another possible step would be to send employees on international secondment, often for several years, in order to develop and manage foreign investments or for however long a project takes to complete. The introduction process for “KomMit” as well as the use of the competence management system itself has been very well received.
Our annual management development process “ME EnBW” aims to further strengthen management skills within the company. It forms the basis for targeted and efficient development and successor planning at all management levels. “ME EnBW” is made up of several process components: discuss competences, evaluate performance, assess potential, give feedback, plan development, plan succession and promote development. Based on future needs, we offer group employees with management potential the opportunity to become increasingly networked within the group and to work together on group-related issues. As part of a management workshop, managers from middle management positions exhibiting potential for promotion discuss their individual development with regard to what upper management expects of them. The objective of EnBW’s central successor planning is to ensure that personnel needs are consistently and systematically met at the upper and top management levels, taking into account the strategic alignment of the company. This is based on the results from the “ME EnBW” cycle as well as regular, intense discussion with the individual companies.
The sharply falling numbers of students will lead to keener competition for the best trainees. In light of this, we launched a group-wide project in 2010 which is set to safeguard future training at EnBW. As part of this project, conferences were held for the first time in March and July as a way of identifying potential areas of focus for each young talent as well as perspectives for a quick and efficient career start following graduation. The first result was the acceleration of EnBW’s process for taking on students. As of 1 October 2011, around 50 young employees with a university degree have joined the group. In the fiscal year
2011, EnBW also offered around 1,000 students the opportunity to gain valuable work experience by completing their theses or working as casual workers. We also support students, for instance by participating in projects such as “Energy Career Program” (ECP), “Network²”, “Kompetenz-Kompass” or as a partner of Femtec, a network aiding the promotion of women working in the area of natural science and technology. Our commitment to university marketing is paying off. Around one third of graduates hired in 2011 had previously taken part in some kind of student activity for the company.
As a way of attracting suitable young academic talent, we offer university graduates an attractive start to their careers in the energy industry with our 15-month group trainee programme. In the course of several practical phases at the EnBW companies, spending time abroad and having discussions with professionals and executives, the trainees get to know EnBW’s core business and at the end of the programme carve out the career path that best suits them.
Efficient and effective HR policy We strive to continuously improve our processes and systems. For instance, we are currently hard at work on developing a group-wide knowledge platform allowing for central and transparent documentation for the HR departments. We are also continuing to expand a performance indicator system at group level for the overall management of strategic aims and processes. With the aim of creating future-oriented market and competitive conditions for energy supply companies in Baden-Württemberg, we continued with negotiations in 2011 pertaining to the collective framework agreement terminated by the employers’ association Elektrizitätswerke Baden-Württemberg in 2008. In accordance with an agreement concluded in February 2011 for the companies bound by collective agreement, the collectively bargained wage was increased by 3.4% with effect as of 1 January 2011.
Innovative and flexible working environment Since 2011, we have been meeting the increased need for competent and experienced project managers to temporarily deal with complicated matters with the help of a project manager development model. This model comprises organisational and personnel mechanisms as well as instruments promoting the development of general executives. This development model focuses on project manager positions as temporary management positions
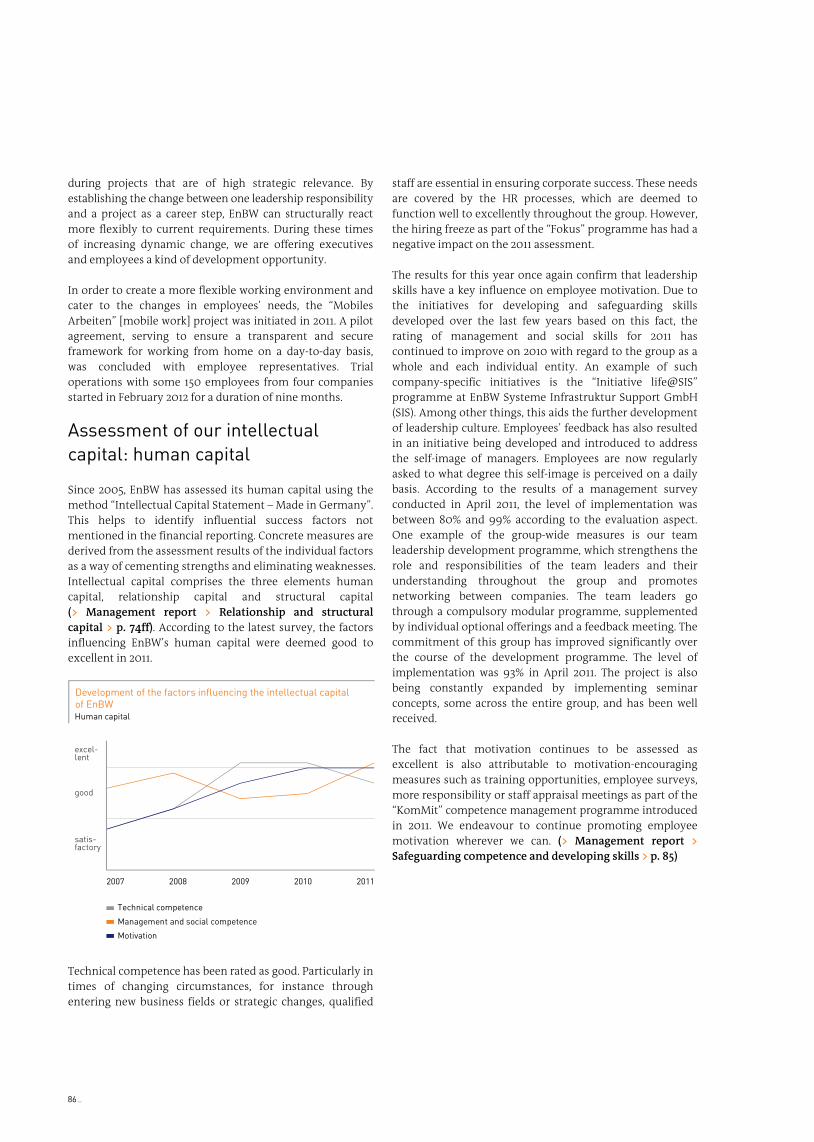
86 _
during projects that are of high strategic relevance. By establishing the change between one leadership responsibility and a project as a career step, EnBW can structurally react more flexibly to current requirements. During these times of increasing dynamic change, we are offering executives and employees a kind of development opportunity.
In order to create a more flexible working environment and cater to the changes in employees’ needs, the “Mobiles Arbeiten” [mobile work] project was initiated in 2011. A pilot agreement, serving to ensure a transparent and secure framework for working from home on a day-to-day basis, was concluded with employee representatives. Trial operations with some 150 employees from four companies started in February 2012 for a duration of nine months.
Assessment of our intellectual
capital: human capital
Since 2005, EnBW has assessed its human capital using the method “Intellectual Capital Statement – Made in Germany”. This helps to identify influential success factors not mentioned in the financial reporting. Concrete measures are derived from the assessment results of the individual factors as a way of cementing strengths and eliminating weaknesses. Intellectual capital comprises the three elements human capital, relationship capital and structural capital (> Management report > Relationship and structural capital > p. 74ff). According to the latest survey, the factors influencing EnBW’s human capital were deemed good to excellent in 2011.
Management and social competence
Technical competence
Motivation
Development of the factors influencing the intellectual capital
of EnBW
Human capital
excel-lent
good
satis-factory
2007 2008 2009 2010 2011
Technical competence has been rated as good. Particularly in times of changing circumstances, for instance through entering new business fields or strategic changes, qualified
staff are essential in ensuring corporate success. These needs are covered by the HR processes, which are deemed to function well to excellently throughout the group. However, the hiring freeze as part of the “Fokus” programme has had a negative impact on the 2011 assessment.
The results for this year once again confirm that leadership skills have a key influence on employee motivation. Due to the initiatives for developing and safeguarding skills developed over the last few years based on this fact, the rating of management and social skills for 2011 has continued to improve on 2010 with regard to the group as a whole and each individual entity. An example of such company-specific initiatives is the “Initiative life@SIS” programme at EnBW Systeme Infrastruktur Support GmbH (SIS). Among other things, this aids the further development of leadership culture. Employees’ feedback has also resulted in an initiative being developed and introduced to address the self-image of managers. Employees are now regularly asked to what degree this self-image is perceived on a daily basis. According to the results of a management survey conducted in April 2011, the level of implementation was between 80% and 99% according to the evaluation aspect. One example of the group-wide measures is our team leadership development programme, which strengthens the role and responsibilities of the team leaders and their understanding throughout the group and promotes networking between companies. The team leaders go through a compulsory modular programme, supplemented by individual optional offerings and a feedback meeting. The commitment of this group has improved significantly over the course of the development programme. The level of implementation was 93% in April 2011. The project is also being constantly expanded by implementing seminar concepts, some across the entire group, and has been well received.
The fact that motivation continues to be assessed as excellent is also attributable to motivation-encouraging measures such as training opportunities, employee surveys, more responsibility or staff appraisal meetings as part of the “KomMit” competence management programme introduced in 2011. We endeavour to continue promoting employee motivation wherever we can. (> Management report > Safeguarding competence and developing skills > p. 85)

Time to act
Management report
Research and development ‹
Financial statements
Corporate governance
Service
_ 87
The development of solutions of practical relevance for better processes and new products is at the
heart of EnBW’s research and development activities. Our aim is to generate added value for EnBW
and our customers. In 2011, the primary focus was on extensive projects in the areas of renewable
energies, smart grids and electromobility. At € 37.0 million, research and development expenditure
for 2011 was up 9% on the prior year.
Research and development
objectives and guidelines
In the course of conducting our many different research activities, we develop solutions that create added value in our own plants and at our customers, thereby making a contribution to increasing the company’s value. By taking a holistic approach, our R&D activities are geared to sustainable energy supply and optimised energy logistics. With the help of advanced technologies, we implement new developments along the company’s entire value added chain as well as applying them directly at the customer. Special emphasis is placed on pilot and demonstration projects, in which we focus on:
› Viably exploiting renewable energies and tapping additional potential. We primarily invest in geothermal energy, new bioenergy sources, wind energy and power-to-gas.
› Managing grids better at both the consumer and generation ends (smart grid) in order to integrate local generation more efficiently and to be able to handle more renewable energy being fed into our electricity grids at a local level. With our fuel cell field test and new types of small-scale power stations on the basis of micro gas turbines, we continue the development of combined heat and power solutions that, as a controllable energy generator, are able to manage grid imbalances. By offering our marketable products, we want to give our customers the opportunity to participate in our pilot projects and create a new energy world.
› Pressing forward with electromobility using model and pilot projects for the emission-free individual mobility of tomorrow.
› Establishing the viability of hydrogen as a storage medium for generating renewable electricity or as fuel for transportation purposes.
› Using conventional sources of energy more efficiently and reducing emissions by increasing the degree of efficiency of power stations and separating CO2 from flue gases. We are also testing new possibilities for the use of CO2.
Furthermore, we are involved in the development of additional possibilities for reducing greenhouse gases in the atmosphere.
Efficient research and development
structure
EnBW’s research and development function is characterised by a lean structure. Our objective is to promote the development of innovations with practical relevance. We implement these new developments within our company or at our customers in cooperation with our research partners. An early exchange of information with cooperation partners such as innovative new companies, technology suppliers and academia is important to us. Within the EnBW group, each EnBW entity is responsible for its own R&D activities in its area of the value added chain. These activities are supported by the research unit in the holding company, which is also responsible for coordinating the processes. In addition, the research unit devises strategic research objectives and drives the development of higher-level initiatives. Of particular interest are concepts that are about to reach market maturity. Instead of having our own research institutes, we have a close and trusting working relationship with our cooperation partners.
Expenditure and personnel
EnBW’s R&D expenditure totalled € 37.0 million in fiscal year 2011 after € 33.8 million in the prior year. Of this total, € 5.0 million was financed by government grants. One of the most important areas was renewable energies. The implementation of electromobility projects in particular resulted in an increased number of employees involved in research, development and innovation in the EnBW group. Of the some 200 (2010: 170) employees involved in R&D activities in 2011, around 180 are based at EnBW entities and
Research and development

88 _
also carry out R&D projects in the course of their operational work. There are 19 employees at the holding company’s research and innovation unit, most of which are engineers and people with a background in the natural and business sciences. They also receive support from numerous students as part of practical training.
Research expenditures ( in € millions)
Further fields of research (7.2)
Electromobilityand hydrogen (9.5)
Renewableenergies (10.5)
Local generation, smart grids and energy efficiency (10.3)
Incorporating external know-how
We are continuously expanding our know-how by entering into research and development cooperation agreements. The most important external research and innovation partners are the universities, colleges and research institutes in Baden-Württemberg, in particular in Karlsruhe and Stuttgart, with which we have very close ties. Germany-wide, we also work in close cooperation with universities and research institutes in Aachen, Berlin, Cologne, Darmstadt, Dortmund, Dresden, Düsseldorf, Hamburg-Harburg, Munich and Oldenburg. In total, we currently cooperate with some 50 universities. We strive to continuously expand this cooperation across the group.
Our close cooperation with EDF was largely dissolved in 2011. In return, EnBW sought to expand the international cooperation of its research and development function in the reporting year. This involved testing particularly low-loss local network transformers together with the French distribution network operator RTE as well as focusing on the transatlantic cooperation for securing critical infrastructures between a German plant manufacturer and US establishments.
Selected research and development
results
Renewable energies Geothermal energy: With our geothermal power stations in Bruchsal and Soultz-sous-Forêts in Alsace, we aim to actively promote energy research for renewable energies. Together with Energie- und Wasserversorgung Bruchsal GmbH (EWB), we are working on optimisation concepts and measures for improving the efficiency of processes and components at the geothermal power station in Bruchsal, which was put into operation at the end of 2009. The aim is to improve the thermal water circuit in the Bruchsal subsoil and adapt the power station better to this special heat source. These measures are intended to increase the number of operating hours a year to the high level of base load power stations and, in the long term, to make electricity derived from geothermal energy a viable option for Germany in the future. In Soultz-sous-Forêts in Alsace, EnBW is working with partners on developing enhanced geothermal systems (EGS). The geothermal power station began feeding electricity into the French electricity grid as scheduled in October 2011 following a further optimisation of operations.
Bioenergy: The sustainable use of biomass for generating heat and electricity (combined heat and power) is an essential component of Germany’s energy concept. Bioenergy uses renewable, natural raw materials to generate electricity, heat and biofuels. By tapping new energy sources and developing innovative and efficient bioenergy solutions, we aim to support the local and climate-neutral supply of energy. This is why we have been operating numerous different-sized biomass (combined power and) heating plants across Germany for several years now and researching an even more efficient firing system. As part of the “ETAMAX” project being conducted at EnBW’s power station in Stuttgart-Gaisburg, we are working on ways to generate and use biogas derived from biological waste in cooperation with scientists at the Frauenhofer Institute. EnBW is responsible for refining the derived biogas into pure bio natural gas. By employing innovative technology in the form of the membrane process, the biogas generated from waste is converted to bio natural gas, stored under high pressure and prepared for use as fuel in natural-gas-powered Mercedes Benz vehicles. The ETAMAX demonstration facility for the generation and treatment of biogas will be completed in the first half of 2012. Provided it meets expectations, a facility for commercial use will follow.
Power-to-gas: As a future method for storing large volumes of electricity from fluctuating wind and photovoltaic generation levels over a longer period of time, the only suitable alternatives today are chemical energy sources such as hydrogen or methane. In cooperation with partners from the business and scientific communities, we are investigating the long-term potential on offer as part of the project on

Time to act
Management report
Research and development ‹
Financial statements
Corporate governance
Service
_ 89
storage of electrical energy from renewable sources in the natural gas grid. This project, supported by the Federal Ministry of Education and Research, involves EnBW analysing the effect of various methods of operation and location-specific factors on the viability of various different power-to-gas concepts. EnBW is also the founding member of the “power-to-gas” strategy platform of Deutsche Energie-Agentur, where, in cooperation with additional partners, we are examining what conditions are necessary for power-to-gas to be able to contribute to the storage of renewable electricity.
Local generation of energy Natural-gas-based micro gas turbine CHP plant: As part of the joint research platform for local generation of energies, EnBW and the German Aerospace Center (DLR) are developing advanced components for a small-scale natural-gas-based power plant with a micro gas turbine and combined generation of heat and electricity. The aim is to increase efficiency and reduce harmful emissions, thereby further increasing the attractiveness of such a plant for supplying energy close to where it is needed by consumers such as in hospitals and industrial businesses. In addition, these power stations will play an even more important role as scalable facilities in the smart grids of the future. EnBW is currently working together with a plant manufacturer on the development of a prototype for commercial use. The prototype is due to be operational by 2013.
Fuel cells for power supplies to households: Fuel cell heating systems consume less primary energy and reduce CO2 emissions. We wish to make this environmentally compatible means of energy supply available as standard. This is why EnBW has been involved in various projects in this area, such as the “CALLUX” project, in which the participating companies intend to commission 800 plants throughout Germany by the end of 2013. By the end of 2011, we had already managed to install 61 plants; by the end of 2013, we aim to have installed a total of 222 fuel cell heating devices in Baden-Württemberg. A new interface developed in the course of the project according to the IEC standard facilitates communication between the different device types.
Smart grids MeRegio home: 1,000 retail, business and industry customers have been involved in the “MeRegio” (Minimum Emission Region) project to date, equipped with the intelligent electricity meter, dynamic charging rates and EnBW’s StromAmpel® displays that show an electricity price that varies by the hour. Data collection, with the aim of analysing consumer behaviour in response to the different electricity prices charged in the course of the day, is to continue until September 2012. In addition to the 250 smart end appliances (freezers) installed in 2010, dishwashers and stationary photovoltaic battery systems were installed in the reporting year. The aim is to offer our customers solutions that allow them to optimise their own consumption and
simultaneously ease the burden on the electricity grid – from grid demand through to self-supply. Analyses confirm that the overall system is capable of responding to signals as well as helping to avoid future electricity shortfalls. The project is to be expanded in future by adding electric storage heating units, heat pumps and facilities from industrial and commercial customers (> www.meregio.de).
Electromobility EnBW continued to expand its electromobility activities in 2011. At the end of September, we successfully concluded the “MeRegioMobil” and “Stuttgart as a model region” projects. We are currently working on other electromobility projects which are to expand on conceptual approaches we have already developed for combining energy and transport infrastructure as of 2012.
› Stuttgart as a model region: In Stuttgart, EnBW performed research into electromobility behaviour by means of the largest electric fleet in Germany, consisting of some 600 electric scooters which have travelled a total of 1 million kilometres. The constructive collaboration with our test riders has helped us gather important results for future products. In addition, 44 charging terminals have been installed in Stuttgart, where the public can charge their e-bikes and electric scooters and also rent out pedelecs from DB Rent.
› Franco-German fleet test: At the end of 2011, EnBW and its municipal utility partners installed roaming-capable charging stations along the Franco-German border. These special stations allow electric cars to be safely charged in both countries, thereby making it possible for German and French test drivers to travel across the border. A time-based invoicing concept was also developed, tests on which are to be performed in 2012.
› Electromobility initiative for towns and villages: In spring 2011, we began investigating mobility and charging behaviour in rural areas. Questionnaires and the data saved in the charging stations provided by EnBW will be evaluated and analysed over a period of 18 months. The project is intended to bring the benefits of expanding electromobility to towns and villages throughout Baden-Württemberg. The aim is to develop an infrastructure to cover the entire state.
› MeRegioMobil: More than 200 publicly accessible charging stations have been installed in Stuttgart and Karlsruhe, thus creating the first closely meshed smart charging infrastructure. The charging and invoicing concept developed within the scope of the project was successfully tested by EnBW in cooperation with Stadtwerke Karlsruhe using a test fleet with 40 smart electric drive vehicles.

90 _
The vehicle-to-grid approach, where the idea is to use the batteries of electric vehicles to help manage the electricity grid, was installed as a prototype in the Energy Smart Home laboratory of the Karlsruhe Institute of Technology (KIT). The method was tested with two Opel Merivas and one electric Mercedes A-class specially equipped for feeding electricity back into the grid.
Hydrogen (H2) mobility At the end of September 2011, we put the first standardised H2 filling station into operation in Karlsruhe as part of the “H2 mobility” initiative. A second H2 filling station is to follow in Stuttgart in the first half of 2012, which will additionally be equipped with a variable-output electrolysis system to enable hydrogen to be produced on site. This will serve to test the economic feasibility of hydrogen as a storage medium for renewable energies such as wind energy. The findings from these projects will be incorporated on an ongoing basis in current investigations into potential business models along the H2 value added chain. Its goal is to achieve a nationwide service station infrastructure for fuel cell vehicles in Germany over the next few years.
Increasing efficiency in conventional power generation and CO2 separation Increasing efficiency in power station technology: A higher degree of power station efficiency automatically results in the use of less coal and in lower CO2 emissions. Over the last few years, EnBW has successfully implemented a successful programme to optimise its coal-fired power stations, for example by equipping them with new, low-emission coal-fired burners or by reblading sections of the steam turbines. These measures have resulted in increased electricity generation with the same amount of coal, referred to as the “green megawatt”. Computer-assisted design and optimisation tools were used both during the preparatory and actual implementation stages, helping for example to improve the combustion process of the coal used. Such processes have been developed and constantly improved upon as a result of many years of performing research and development projects in close cooperation with universities and industrial partners.
CO2 capture: By testing the various CCS technologies it is our aim to come the closest we can to the requirements of power station operators in terms of energy and cost efficiency, environmental protection and supply reliability. The greatest challenge in capturing CO2 is to keep the energy consumed to a minimum, thereby forfeiting only a few percentage points of power station efficiency. In this way, we have chosen to focus on optimising methods in test facilities in a first step. Together with the University of Stuttgart, EnBW put a test plant into operation on the campus in May 2010 which uses the carbonate looping method. This method uses burnt lime at temperatures of between 600 and 700° C to bind CO2 from the power station’s flue gases. The limestone thus created is then heated to 900° C. This way, the CO2 is captured from the lime and is available for storage after cleaning and liquefaction. This procedure has so far remained problem-free. In early 2011, a second test facility in Heilbronn was put into operation. The methods applied there use aqueous amine solutions to clean CO2 from the flue gases created in the course of incineration. EnBW’s aim is to use these test facilities as a way of gaining operational know-how and drawing conclusions with regard to the flexibility, control capability and overall efficiency of large-scale plants equipped with this technology. Test operations are scheduled to run for at least three years in both projects.
Alternative methods for reducing CO2 As an alternative to the technical capture of CO2 and generation of allowances pursuant to the Kyoto Protocol, we are investigating ways in which we can use the natural CO2 cycle to our own advantage. In the desert region of Yotvata, Israel, we are testing cultivation techniques to aid the greening of deserts. In Oman, we are initiating a location and feasibility study investigating the forestation of offshore regions and the potential for seawater desalination.

Time to act
Management report
Subsequent events ‹
Financial statements
Corporate governance
Service
_ 91
There were no events after 31 December 2011 which would be significant for assessing the net assets, financial position and results of operations of EnBW.
Subsequent events

92 _
In the following, the Board of Management provides the information prescribed by Secs. 289 (5) and 315 (2) No. 5 German Commercial Code (HGB).
Principles
EnBW’s financial reporting internal control system (ICS) serves to ensure that the financial reporting is reliable and in compliance with laws and regulations. In order to guarantee that the ICS is effective, the group-wide control mechanisms are tested regularly at entity and group level to ascertain that they are suitable and functioning. If control weaknesses are identified and considered relevant for the financial statements, they are then remedied on a timely basis. The ICS methodology in the EnBW group is based on the COSO standard, an internationally accepted framework for internal control systems.
The ICS qualifies as effective if the control mechanisms reach a standardised and monitored degree of maturity and there are no material control weaknesses. The degree of maturity reflects the understanding of an ICS within the company as a useful method of risk provisioning and the level of implementation of the group-wide ICS methodology at group entities. Materiality of control weaknesses is measured as the probability of occurrence and the extent of a potential misstatement in proportion to the financial statement items concerned. The financial reporting risk management system as a component of the ICS is defined as a set of measures for identifying and assessing risks that jeopardise the objective of financial statements in accordance with law and regulations.
Despite having established an ICS, there is no absolute assurance with respect to the objectives and completeness. The effectiveness of the ICS can be impaired in exceptional cases by unforeseeable changes in the control environment, fraud or human error.
Structure
EnBW’s ICS is organised at a central and local level. All major entities have an ICS officer, who monitors the effectiveness of the ICS at entity level and evaluates any control weaknesses as they occur. An ICS report is prepared for the entity on an annual basis and approved by the entity’s management. The ICS officer at group level assists the entities with implementing a harmonised approach and also consolidates the data surveyed. A consolidated ICS report for the group is provided to the group’s Board of Management
every year, which serves as the basis for reporting to the Supervisory Board’s audit committee.
Process
Standardised processes ensure completeness and consistency in the preparation of the financial statements and financial reporting. The financial reporting ICS defines controls designed to guarantee compliance with the group’s accounting policies as well as procedural instructions and deadlines for the individual accounting processes. The ICS has an annual cycle to monitor that documentation is up to date, that the controls are suitable and functioning and identify and assess any control weaknesses.
Relevant entities, significant financial statement items and processes as well as controls are identified in a risk-based selection procedure. The procedure is based on quantitative and qualitative risk indicators.
1. Selection procedure
3. Assessment ofcontrol activities
4. Consolidationof results
5. Consolidationof results
2. Analysis, documentation
ICS stages at EnBW
6. Declaration on ICS and reporting
The processes and controls are recorded in a central documentation system. The documentation phase is followed by an assessment of the effectiveness of the control activities, which evaluates whether the control activities are in principle suitable for reducing the risks of misstatement in financial reporting. The defined controls are also reviewed to ascertain that they are functioning by regularly monitoring the implementation of the controls and appropriate documentation of the same. If any control weaknesses are identified in the process, their effect on the financial statements is evaluated. The results are presented in a report at entity level and in a consolidated report for the group.
Key features of the financial reporting internal control system

Time to act
Management report
Risk and opportunities report ‹
Financial statements
Corporate governance
Service
_ 93
The EnBW group’s risk situation was tense in 2011. The package of laws on a new energy concept adopted
in Germany in the summer presents major challenges for EnBW. This gives rise to considerable risks, but
there are also opportunities. The euro debt crisis putting pressure on international financial markets
presents risks with respect to the measurement of securities. Competition and market risks were also on
the increase in 2011. EnBW pursues targeted strategic and operational measures as a way of minimising
risks and exploiting opportunities. There are no risks to the group’s ability to continue as a going concern.
Principles of risk management
EnBW defines risk as potential negative variances from its planned net assets, financial positi0n and results of operations. Risks may arise from events that either can basically be planned, but are still subject to chance, or that are not foreseeable. The EnBW group identifies risks based on the following categorisation of risks: systemic and industry risks, strategic risks, financial risks, operating risks and other risks. The risk management at EnBW coordinates the proactive and preventive process of managing internal and external risks to EnBW’s business activities. The risk management process comprises risk identification, analysis, assessment and reporting.
Process
Risk
management
principles
Risk identification
Risk
reporting
Risk
analysis
Risk assessment
Risk management involves measures to avoid, reduce or transfer risk, to make provision in the balance sheet for risk or accept the risk. Risk management primarily focuses on the medium-term planning horizon; risks to which special importance is attached are also taken into account beyond this period.
Structure and process of risk
management
The EnBW group’s risk management system comprises central and local units. The group risk management function at the level of the holding company is responsible for specifying group-wide methods and processes as well as risk reporting to the Board of Management. The group’s risk management guidelines define the handling of risks across the group. Starting at the level of the individual entities, risks are aggregated along defined reporting lines throughout the group.
An interdisciplinary risk committee addresses questions and issues relating to risk management from various group perspectives and ensures the quality of the group’s risk report. The Supervisory Board is also informed regularly of the group’s risk situation. Within the Supervisory Board, the audit committee is specifically responsible for the detailed assessment of the group’s risk situation.
The risk management process is integrated in the operational processes of the EnBW group companies and at the level of the holding company as a continuous procedure. There are various stages of reporting and escalation. The materiality threshold for risks is a potential loss of € 1 million. Management of these risks is the responsibility of the respective entity’s management. Risks of € 20 million or
Risk and opportunities report
Risk management
Risk avoidance
Risk transfer
Risk minimisation
Risk acceptance

94 _
more in the three-year planning horizon or € 10 million or more in the first budget year are reported to the relevant member of the Board of Management. The group risk threshold is € 50 million over the planning horizon. Such risks are presented to the entire Board of Management. A standardised risk report is issued each month. The Board of Management is informed without delay of the occurrence of any acute risk situations needing immediate attention.
Any risks with a probability of occurrence of up to 50% are subject to an individual review as to whether they have to be dealt with in the next planning round. If there are any risks that are more likely than not, they are taken into account in the planning, with accounting measures being taken as far as possible in the consolidated financial statements in accordance with IFRSs.
Structure
Supervisory Board
Group Board of Management
Board member Board member Board member
Management of
group unit
Corporate risk management
Risk committeeRisk manager
at the group unit
Management of
group entity
Risk manager
at the group entity
Management of
subgroup
Risk manager
at the subgroup
As part of the ongoing development of our risk management process, we are expanding the bottom-up process we have in place by adding a systematic top-down perspective. This will provide us with an extensive all-round view and allow us to realise additional potential benefits. In a further step, we employ a stochastic model for assessing the top opportunities and risks over the medium-term planning period. This makes it possible to determine the range of the future group net profit or loss and additional targets. We support the development of our employees’ professional expertise with regard to risk management by holding workshops and events on a regular basis.
Systemic and industry risks
Economic risks Future economic development influences the demand for energy, thereby affecting the quantities of electricity and gas EnBW generates as well as the volume of units sold. Any significant negative deviation between actual and projected economic development gives rise to considerable risks for EnBW’s business development. In addition to the resale risk in the event of lower sales volumes in the sales function, risks include those arising from erosion of sales margins as well as smaller quantities being transmitted via EnBW’s grids and a resulting fall in revenue from network user charges. World economic growth slowed in 2011. The debt crisis in some countries of the euro area, the political discussions pertaining to the increase in the US government debt ceiling
and the downgrading of the credit rating of some countries caused turbulence on the international financial markets, putting an extra strain on the real economy. For EnBW, an intensification of the euro debt crisis, leading to a permanent fall in the general market prices for securities, entails the risk of having to recognise impairment losses on securities, for instance those that form part of the assets covering pension obligations.
Market development Market price risks: Almost all assets and transactions of our group entities in the areas of generation, trading and sales are exposed to market price risks. The valuation and management of the profit or loss potential arising from changes in market prices is therefore a main task of our risk management. Our risk management and risk controlling is based on best practices and is adapted to reflect market developments on an ongoing basis. The market price developments and credit risks, compliance with the limits and the result measured against current market prices are recorded by the risk controlling function of EnBW Trading GmbH (ETG) on a daily basis. ETG secures the group net profit by hedging the energy price risks on the forward markets at an early stage. The concept underlying the hedging strategy

Time to act
Management report
Risk and opportunities report ‹
Financial statements
Corporate governance
Service
_ 95
also involves the use of opportunities. The risk management for our electricity generation provides in particular for financial hedging of falling electricity prices and rising prices for fuel and emission allowances. The core business of ETG is to market our own generation products, and to hedge them against market price risks, primarily via the wholesale market. However, these risks can only be hedged over a limited period of time. Notwithstanding its hedging strategy, when selling the electricity quantities generated EnBW is exposed to the long-term risk of falling electricity prices and the risk of an unfavourable development of the fuel prices in proportion to electricity prices. The central body of our risk management is a risk management committee in which various group entities along the value added chain and the group’s holding company are integrated. Through risk management in the sales function EnBW ensures that the anticipated sales volume is available. ETG also hedges currency risks from the purchase of fuels which are traded in foreign currency. Opportunities which result from the flexibility of our power stations are continuously optimised on the basis of current market prices. In order to generate additional income, ETG uses its know-how on the energy markets to manage the risks as well as for trading for our own account.
The following significant market price risks are inherent in market development:
In the context of our energy trading activities, the EnBW group enters into energy trading contracts for the purpose of price risk management, optimisation of power stations, load equalisation and optimisation of margins. Trading for own account is only permitted within narrow, clearly defined boundaries. The price risks mostly arise from the procurement and sale of electricity, the procurement of coal, gas and oil as fuels and the procurement of emission allowances. Furthermore, EnBW is exposed to price risks from speculative items entered into in own-account trading. The price risks are hedged using appropriate financial instruments on the basis of continuously monitored forecasts of market prices. The hedging instruments used in the reporting period were forwards, futures, swaps and options. As of 31 December 2011, the nominal value of all energy derivatives totalled € 44,768.0 million. The market value of all energy derivatives as of the same date was € -83.9 million.
As already mentioned, the EnBW group has exposure to foreign currency risks from procurement and hedging of prices for fuel needs, as well as from gas and oil trading. In addition, EnBW has currency risks arising from liabilities denominated in foreign currency. The currency risk is hedged
with the help of appropriate standardised financial instruments on the basis of continuously monitored exchange rate forecasts. The EnBW group principally has exposure from US dollars, Swiss francs, Hungarian forints and Czech koruny. The net assets tied up at foreign group entities outside the euro area and the translation risks are only hedged against exchange rate fluctuation in exceptional cases.
The EnBW group and also EnBW AG use interest-sensitive financial instruments in order to meet the requirements of operational and strategic liquidity management. Interest rate risks therefore only stem from floating-rate instruments. On the assets side, there is interest exposure from bank balances and on the liabilities side from floating-rate liabilities to banks. The EnBW group and EnBW AG are also exposed to interest rate risks from derivatives in the form of swap transactions, primarily in the euro area. A sensitivity analysis is provided in the section on “Accounting for financial instruments” in the notes to the consolidated financial statements. The nominal volume of interest and currency derivatives amounted to € 5,840.4 million as of 31 December 2011. These derivatives had a total market value of € 264.9 million.
Competitive risk: In light of the intense competition in the retail customer business, both in the B2C and the B2B sectors, there is the risk that we might lose customers. This involves price and margin risks should it not be possible to pass on energy industry costs as a result of customers’ willingness to change provider.
Grid loss energy: EnBW’s grid companies have to purchase on the market any energy loss during transmission through the networks. While the amount of energy needed to cover grid losses in the distribution grid can be estimated quite accurately based on past experience, it is difficult to budget the amount needed for the transmission grid. The volatility of market prices for purchasing the energy needed to cover grid losses can lead to budgeted prices being exceeded.
Political and regulatory risks New energy concept: The package of laws on a new energy concept adopted in Germany in summer 2011 and the resulting decommissioning of unit I of Neckarwestheim nuclear power plant (GKN I) and unit 1 of Philippsburg nuclear power plant (KKP 1) led to financial burdens for EnBW in 2011, and will continue to do so in subsequent years. Impairment losses were recognised on the fuel rods and property, plant and equipment already in the financial statements for the first six months of 2011. Extraordinary additions to the provisions for nuclear power also reduced earnings and increased net debt. There is also uncertainty surrounding France’s future commitment to nuclear power following events in Fukushima. Additional political and government regulations for France’s nuclear power plants could also cause costs to rise with regard to existing procurement agreements with Electricité de France S.A.

96 _
Nuclear fuel rod tax and agreement on the fund to promote renewable energies: On 1 January 2011, the Nuclear Fuel Rod Tax Act came into force. It provides for a tax rate of € 145 per gram of nuclear fuel employed. The tax will be levied over the period from 2011 to 2016. Despite the 13th amendment to the German Atomic Energy Act coming into force and the seven oldest German nuclear power plants and Krümmel nuclear power plant having to permanently discontinue operations, the federal government continues to stand by the nuclear fuel rod tax. In the fiscal year 2011, this resulted in EnBW’s operating results being burdened by an additional € 240 million for the GKN II and KKP 2 nuclear power plants. As a result, EnBW filed actions at the Baden-Württemberg finance court in Freiburg in July 2011 relating to the registration of the nuclear fuel rod tax for GKN II and KKP 2, lodging an urgent appeal from the viewpoint that the tax violates constitutional and European law. The Baden-Württemberg finance court rejected this action in January 2012. After gaining approval, EnBW appealed to the Federal Finance Court. EnBW is also examining the possibility of taking the matter to the Federal Constitutional Court by filing an action against the 13th amendment to the German Atomic Energy Act.
As part of the legislation passed at the end of 2010 to extend the working lives of German nuclear power plants, the federal government and operators of nuclear power plants signed an agreement on a fund to promote renewable energies. It comprised three components: an extension of the working life of nuclear power plants, nuclear fuel rod tax and promotion of renewable energies. According to the agreement, the extension of the working life of nuclear power plants was linked to prepayments into a fund to promote renewable energies. From 2017 onwards, such prepayments were to be credited to the contribution of € 9/MWh on the additional volume of electricity generated from the extension of working life. From the viewpoint of nuclear power plant operators, the 13th amendment to the German Atomic Energy Act means that there are no longer any payment obligations. An agreement has not yet been reached in this regard.
Network use: Incentive regulation and the associated revenue caps and network user charges may be subject to changes within a regulation period. The amendment to the German Energy Industry Act (EnWG) means that network user charges for energy-intensive customers no longer apply or will be charged on an individual basis. The transmission system operators are to deal with an equalisation of burdens between themselves in this context and determine and publish a nationwide, standardised cost allocation. As specified by the Federal Network Agency on 14 December 2011, the cost allocation is to be initially determined on the basis of budget figures. Potential differences to the actual values are taken into account when determining the cost allocation for subsequent years. This helps to minimise the financial risk.
Reintroduction of the general productivity factor: In June 2011, the German Federal Court of Justice (BGH) declared the former structure of the general sectoral productivity factor taken into account as part of the incentive regulation to be illegitimate as there was no basis for it in the German Energy Industry Act. At the end of 2011, a new enabling clause was incorporated into the act, which has since taken legal effect. The restoration of the lawfulness of the general sectoral productivity factor will reduce the regulatory revenue caps set for 2012, and thereby the network user charges for 2012 and 2013, by tens of millions. The Federal Network Agency has requested that all network operators take into account the revenue caps reduced by the productivity factor when calculating the network user charges for 2012.
Retrofitting masts: A state-of-the-art safety level is currently being defined for existing masts. It is possible that the demands of the Baden-Württemberg energy regulator will no longer just be limited to inspecting and, if necessary, retrofitting masts manufactured from Thomas steel in future as has been done in the past, but may apply to all masts. Should it emerge during a reliability review that the requirements have not been met, this would necessitate retrofitting measures or the construction of new masts, which have not been taken into account in the current business plans.
Allocation of offshore grid connection costs: Transmission system operators, within whose balancing zone offshore wind turbines are to be connected to the grid, are required to make connections to the grid in accordance with Sec. 17 (2a) German Energy Industry Act (EnWG). The resulting grid connection costs are offset as part of the nationwide cost allocation mechanism pursuant to the German Combined Heat and Power Act (KWKG). The transmission system operators then take these costs into account in their revenue caps. Should this settlement continue to be carried out with a two-year time lag, it may have a temporary effect on earnings, although this would even out again after two years.
Abuse proceedings relating to balancing energy: The abuse proceedings initiated by the Federal Network Agency against German transmission system operators were not concluded on the part of the former. Since May 2010, all German transmission system operators have been part of the grid balancing organisation, which serves to minimise contradirectional non-harmonised use of balancing energy. This helped to resolve the proceedings with regard to the system-related contradirectional non-harmonised use of balancing energy between the four German balancing zones. Should a case of abuse be determined, there is a risk that some of the costs incurred for balancing energy since 2006 by our transmission system operator, EnBW Transport-netze AG, might not be recognised and will reduce network user charges in future periods.

Time to act
Management report
Risk and opportunities report ‹
Financial statements
Corporate governance
Service
_ 97
Implementation of the third energy liberalisation package: The amendment to the German Energy Industry Act (EnWG) that came into force in summer 2011 contains stricter unbundling requirements for transmission system operators. EnBW has implemented the ITO model. The synergy losses generated as a result of legal requirements are not insignificant.
Anti-trust pricing reviews: The anti-trust control activities for pricing district heating, gas, electricity and water could also give rise to anti-trust risks for the group in 2012. Following completion of the electricity generation/electricity wholesale sector survey, anti-trust reviews concentrate on the areas of district heating and water. In this regard, the focus is not on the prices of EnBW group entities. EnBW provides any information that is requested as part of the reviews of third-party companies on the basis of the comparable market concept.
Strategic risks
Viability of capital expenditures: As well as presenting opportunities, strategic objectives always entail risk. A potential loss of income may arise for EnBW from a misinterpretation of customer requirements and framework conditions as well as technological misjudgements. The EnBW group is pressing forward with a series of construction projects. Such large-scale projects are by their very nature highly complex and involve a large number of participants. For this reason, it is impossible to rule out impairments in the construction process that lead or could lead to deviations from the planned project schedules involving delays and cost increases. There is the risk that construction work for the new hard coal power station RDK 8 could be further delayed beyond the end of 2013. We expect construction of unit 9 of the large-scale power plant in Mannheim (GKM 9) to be delayed until 2015. EnBW has a 32% share in GKM 9. The offshore wind farm EnBW Baltic 2 is also at risk of being delayed. A closely meshed project risk management monitors risks relating to quality, cost and deadlines associated with such investment projects. Aside from these disruptions in the construction process, changes in the market environment also involve the risk that the return on investment is not achieved as planned and impairment losses may be necessary. As an energy supplier based on partnership, EnBW aims to utilise the potential together with citizens, municipalities, constituents and countries. It is therefore essential that the new power station projects are accepted by the general public.
Investments: EnBW acquires and disposes of investments as part of its corporate strategy. By the very nature of the activity, there are uncertainties as to the success of a transaction and the integration of the new entity in the group. The risk for the group’s carrying amounts from impairment of shareholdings arises from changes in assumptions regarding the equity investment’s business
development. This applies to newly acquired equity investments in particular, but is also valid for existing ones. In the fiscal year 2011, impairment losses had to be recognised on the carrying amount of the investments in EWE Aktiengesellschaft (EWE) and EVN AG. One key parameter in the measurement of investments is WACC, which, among other things, depends on the risk-free interest rate. If the associated interest rates increase, then WACC also increases. Changes to the assessment of the future profitability of group entities may also lead to additional impairment losses.
If the acquisition of the EnBW shares held by EDF until 17 February 2011 by NECKARPRI-Beteiligungsesellschaft mbH (NECKARPRI), attributed to the federal state of Baden-Württemberg, and the conclusion of a shareholder agreement between NECKARPRI and OEW Energie-Beteiligungs GmbH were to represent a change of control within the meaning of the agreement with EWE, EnBW would be obliged to offer its shares to the municipal shareholders of EWE at the market price as determined by an expert appraisal. EnBW holds the view that there was no change of control. The municipal shareholders, however, requested that EnBW make an offer. EnBW did not comply with this request. In the event that the parties do not come to a mutual agreement, there is a risk that the purchase price will be below the current carrying amount at EnBW.
In terms of amount and timing, EnBW’s investment programme is also dependent upon the success of divestitures. In this respect, there is the risk that the timing of divestitures and the associated gains on sale do not correspond to our budget and plans. This would affect the amount of the group’s total investment and could give rise to the need for impairment losses.
Renewal of franchise agreements: Some 200 electricity and gas franchise agreements within the network territory of EnBW and its main equity investments expire by 2014 and are up for renegotiation. Major franchise agreements for EnBW are those with Neckar-Elektrizitäts-Verband and the city of Stuttgart. The loss of a franchise territory may have a detrimental impact on the capitalised earnings value. In the event that an integrated energy supplier acquires the franchise, there is a risk that this company would then gradually lure away the remaining customers of EnBW’s sales functions as part of a network transition. Interest by third parties in the franchises we hold remains high. Towns and municipalities are increasingly showing an interest in returning their electricity, gas and water supply networks to public ownership. EnBW sees itself as a strong partner for municipalities in Baden-Württemberg and actively approaches towns and municipalities with a variety of offers. In addition to extending franchises, the offers also involve entering into partnerships with municipalities and municipal utilities. In 2011, around 50 franchise agreements were renegotiated and concluded. By focusing on municipal targets and our

98 _
established franchise and relationship management, the EnBW group has managed to maintain virtually the same number of franchises with municipal utilities despite the increased competition.
Operating risks
Internal and external factors: The production processes along our value added chain in the business segments of the EnBW group involve complex and highly specialised plant and equipment. It is our objective to avoid damage to our plants and to minimise downtimes. To prevent intrinsic risks, we use cutting-edge technology, carry out regular maintenance at our facilities and train our staff. Despite the high standards, it is not possible to rule out risks completely. External factors tend to impact our processes very rapidly and unexpectedly, making risk assessment difficult. We strive to counter such risks with preventive measures.
Where possible and economically feasible, we minimise the economic losses arising from operating risks, among other things, by taking out insurance. Every year, we analyse the effectiveness of the insurance cover and any additional requirements to guarantee that we are adequately insured should damage to property occur. We select the amount of the deductible based on what makes economic sense. Business interruptions, depending on how long they take, can significantly impact the operations of the group.
Power station dismantling: Long-term and complex large-scale projects such as dismantling power stations generally involve exposure to risk. This mainly relates to the current dismantling project in Obrigheim as well as the future dismantling of the two shutdown units of our nuclear power plants, KKP 1 and GKN I. In this context, special focus is put on the technical, regulatory and market risks that jeopardise budgets and schedules.
Financial risks
Counterparty risk Apart from customer transactions, transactions on the over-the-counter (OTC) market present counterparty risks. OTC transactions are entered into to hedge and optimise power station capacity in the trading area. On the trading side, counterparty risk consists of settlement risk and mark-to-market risk. Settlement risk arises from unsecured receivables from trading partners as well as relationships with sales customers. The mark-to-market risk is the result of market price fluctuations. Price movements affect the value of open positions in the trading and customer portfolio. As a result, this gives rise to a resale/replacement
risk in the event of default by a trading partner, with the latter meaning that the position has to be repurchased at the then current market prices.
In order to reduce the counterparty risk, we entered into bilateral margin agreements with some of our trading partners. This involved managing existing counterparty risks by providing collateral, thereby keeping the counterparty risk from the business relationship within the defined level. For trading partners on the OTC market, we define individual credit limits on the basis of their credit standing. Counterparty risk is established and adherence to the line of credit and spread thereof are monitored on a regular basis. We generally carry out OTC market transactions on the basis of master agreements, for example those published by the European Federation of Energy Traders (EFET), the International Swaps and Derivatives Association (ISDA) or the International Emissions Trading Association (IETA). Counterparty risk is excluded by clearing transactions through energy exchanges such as the EEX or ICE and the clearing bank. None of our OTC business partners filed for insolvency in fiscal 2011.
Margin regulations for stock market transactions and bilateral margin agreements may lead to short-term cash outflows as a result of unfavourable market developments, although this would be evened out again at the latest by the time the underlying forward transactions are settled. This liquidity risk is constantly monitored by performing stress tests.
In the fiscal year, the finance industry saw its creditworthiness drop and several financial institutions downgraded as a result of the euro crisis. This led to an increase in the credit risk. There is the risk that the financial crisis will spread to the real economy, leading to a further rise in the credit risk. We limit the potential negative impact where we can by means of active monitoring and management of customer and trading partner credit risks.
Rating The new energy concept in Germany is burdening the economic situation and outlook for German energy suppliers. The rating agencies, too, acknowledge the challenges faced by the energy industry and continue to observe market participants closely. On 23 November 2011, Standard & Poor’s confirmed EnBW’s A rating and raised the outlook to “stable”. On 20 December 2011, Moody’s re-assessed EnBW and revised its rating from A2 to A3 with the outlook as negative. We are nevertheless aware of the risk that the rating agencies could downgrade EnBW’s credit rating if EnBW does not fulfil the expectations of the agencies. (> Management report > Financial position > p. 65f)

Time to act
Management report
Risk and opportunities report ‹
Financial statements
Corporate governance
Service
_ 99
Financing and liquidity risk Owing to its stable financing with own funds and the contractually approved lines of credit, EnBW was able to cover its funding requirements at all times in the fiscal year 2011. There are no financing requirements for the bond that matures on 28 February 2012. Furthermore, no financing requirements are expected at present for the bonds that mature in 2013. Overall, we currently do not perceive any liquidity bottlenecks on the capital markets. (> Management report > Financial position > p. 63ff) More information is provided in the section on “Accounting for financial instruments” in the notes to the consolidated financial statements.
Asset management EnBW pursues a conservative cash investment strategy guided by the aims of achieving a good credit standing, a high level of liquidity and broad diversification of the investments, and continued to do so in 2011. There was a heightened risk of impairment in 2011 with regard to the portfolio of securities in connection with the euro debt crisis and the resulting impact on the international financial markets. This risk materialised in some cases. Furthermore, the nature of the markets means that there remains a risk of target returns not being achieved as well as other impairments. The value at risk determined per security as of the reporting date is € 71.5 million (95%/10 days). In the prior year, this figure came to € 82.6 million (95%/10 days).
The volatile financial markets mean that our financial assets are subject to price risks and other risks of potential losses. Impairment losses have to be recognised on securities if these risks lead to a significant or prolonged decline in the fair value of these investments below their cost. In fiscal 2011, impairment losses due to a significant decline in fair value totalled € 71.2 million (prior year: € 65.1 million). (> Management report > Financial position > p. 63ff)
Other risks
Personnel risks A key success factor in our operating and strategic corporate development is our personnel. In this respect, EnBW is exposed to the risk of not having a sufficient number of employees with the necessary qualifications. This risk primarily arises from competition with other companies on the labour market, exacerbated by demographic developments and stricter conditions for the energy industry and their impact on EnBW’s strategy and business activities. Ongoing analyses of demographic scenarios provide us with information on areas in particular need of action. The “Fokus” efficiency
programme also presents the risk of losing important high performers should they not see any prospects for themselves during this restructuring phase. We counter this risk with internal personnel development measures and by positioning the company as an attractive employer.
Legal risks EnBW’s entrepreneurial activity brings with it a series of legal risks from our contractual relationships with customers and business associates and from regulatory developments. In the operating business, the legal risks primarily relate to price adjustment clauses for energy supplies (meeting the criteria of Secs. 307 and 315 German Civil Code (BGB)), the conditions for network usage and power plant operation as well as activities requiring licences.
The Federal Court of Justice (BGH) has issued rulings on a range of issues relating to price adjustment clauses in energy supply agreements. However, not all open issues have been resolved by existing supreme court rulings. Where necessary, the price adjustment clauses employed by the EnBW group have been reworded to reflect more recent court rulings. Besides civil law disputes with business partners on the appropriateness of price increases, anti-trust risks relating to customers’ basic needs may also arise with regard to pricing reviews under Secs. 19 and 29 German Act against Restraints on Competition (GWB) (> Management report > Systemic and industry risks > p. 94ff). Court cases and other legal disputes are in the field of civil law and of public law, less so in the field of corporate law – in some cases relating to matters of great economic significance. Adequate risk provisioning has been made accordingly with the approval of the departments concerned and the legal department.
There are legal proceedings pending before the Federal Labour Court relating to the reorganisation of the company pension scheme at EnBW. A final ruling is not expected before the end of 2012. According to the lawyers representing EnBW there are generally good prospects for success.
IT risks Communication and information systems are of central importance for supporting and ensuring the smooth running of a large number of EnBW’s business processes. In this respect, communication and information security has a high priority within the group. We endeavour to ensure the uninterrupted provision of communication and information networks and applications, to protect from the loss of business-critical information and undesired change as well as to provide optimal support with regard to process performance.

100 _
High security standards, based on international and industry-specific principles, lower potential communication and information risks. The EnBW group principles for security in information and communication technology (EKSIT@) are an integral part of those standards. These are a group-wide binding set of rules for the use of our information and communication systems. In this regard, we attach particular value to the security of information and data, adherence to legal frameworks and the secure operation of our communication and information systems.
Data in the communication and information network are protected according to their significance and the assigned level of protection. Service level agreements are in place with communication and information service providers to guarantee that the requirements are met. The assessment of the communication and information risk involves comparing the level of protection by business process with the security level implemented for rendering the service. If required, additional measures may be derived in order to create the required level of security. The ongoing analysis and evaluation process involves IT managers as well as risk managers and is constantly optimised.
Overall assessment
Constantly developing the methods and tools of the risk management system allows the EnBW group to assess the economic impact of risks on a regular basis. The entire energy supply industry today is facing significantly changed conditions in the wake of the catastrophe at the nuclear power plant in Fukushima in March 2011 and the resulting
energy policy decisions taken. The risk situation has increased considerably for the whole industry. EnBW’s overall risk position has become very tense for 2012, with numerous factors jeopardising earnings targets.
The political decision involving Germany phasing out nuclear power reduced planning certainty over the course of 2011 and will hold great risk potential in future. Over the coming years, we anticipate a material negative impact on group earnings due to the new energy concept, although it will open up new opportunities for us in the medium term.
The ongoing euro debt crisis caused turbulence on the international financial markets, and continues to do so. In light of this, recognising further impairment losses on investments and other assets may become necessary. There is also the risk that a crisis on the financial markets could impact the real economy. Added to this are competition and market risks that may impact the net assets, financial position, results of operations and liquidity situation of the EnBW group. The project risks will also rise as part of future investment projects.
Operational and accounting measures mitigate potential risks to the group. Provisions and impairments in the accounts allow for risks where the probability of occurrence is high. Material risks are included in current projections.
There were no risks to the EnBW group’s ability to continue as a going concern in 2011.
Easing Increasing
Development of the risk position in 2011
Systemic and industry risks
Strategic risks
Operating risks
Financial risks
Other risks
><
Risk management system
In 2011, EnBW’s Board of Management and the management of the group entities were informed of the current risk situation in monthly reports. We also reported changes in the group’s risk position to the general public in our quarterly reports. Where unforeseen risks occurred, we
provided decision-makers with ad-hoc reports. The EnBW Board of Management provided the EnBW Supervisory Board with detailed quarterly reports on the group’s current risk situation. In accordance with the German Corporate Governance Code, the audit committee dealt at its meetings with risks which could have a significant influence on the group’s results of operations, financial position and net assets.

Time to act
Management report
Risk and opportunities report ‹
Financial statements
Corporate governance
Service
_ 101
The group’s internal audit function regularly reviews the group-wide risk management system – both in terms of compliance with legal requirements and also in terms of the way it works and how effective it is. The group’s internal audit function reports the results of its review to the Supervisory Board.
Principles of opportunity management
Development of business and the business environment presents opportunities for the EnBW group. Decisions relating to energy policy at national and European level, entering new markets and suggestions made by individual employees under the company-wide suggestion scheme can provide EnBW with new opportunities. If opportunities are recognised and seized at an early stage, they can increase the profit for the company. EnBW’s aim is to use opportunities to enable us to return higher profits than planned wherever possible. EnBW is convinced a market characterised by fierce competition serves to the benefit of our customers. All employees, irrespective of their area and level of responsibility, are encouraged to think and act entrepreneurially and to constantly search for and exploit any opportunities as they arise. In the operating business, this enables the group entities to identify opportunities that might materialise in the course of operating activities or due to an improved market environment or other extrinsic factors. The group strategy function, together with EnBW’s market entities, systematically records and assesses any strategic opportunities arising within EnBW or its environment and develops measures to exploit them. EnBW’s Board of Management discusses strategic opportunities on a regular basis and decides on associated measures.
Opportunities may arise anywhere within the EnBW group’s sphere of operations or in the course of a specific activity. Opportunities and risks are often two sides of the same coin. Opportunities arising from developments in the company’s environment can be broken down into opportunities from changes in the political and regulatory environment, opportunities arising from the general economic situation and opportunities from market and technological developments. Changes in the prevailing conditions generally differ in how relevant they are for EnBW in comparison to its competitors.
Company-specific opportunities
Investments We seek to identify and exploit synergy potential together with investees and partners, opening up the opportunity for EnBW to generate additional contributions to earnings.
New energy concept We also perceive opportunities of relevance for our corporate strategy in the changes that the energy industry is undergoing. EnBW’s above-average share of CO2-efficient generation capacities in its electricity generation portfolio means that we do not need as many CO2 allowances in relation to the competition. This gives us the opportunity to secure EnBW’s low-carbon energy position on the market. In addition, we invest in renewable energies, which will play a major role in energy generation in Germany and elsewhere in the medium and long term. The cash inflow resulting from an equity increase would allow us to play an even greater role in shaping the new energy concept. On the sales side, EnBW has also paved the way early on to distinguish itself as a provider of energy solutions in contrast to sole energy providers. Following thorough market tests, marketing of the associated products and packages will be increased – for example in the areas of smart home, energy efficiency in buildings, electromobility and local generation as well as “sustainable town” pilot projects – and they will be offered under the relevant brands. We are convinced this will open up new sales prospects and opportunities. We also see our customers’ rising environmental awareness as an opportunity for EnBW and offer them a range of green electricity products. Climate and environmental protection are a fixed part of our corporate philosophy. We want to combine a range of fuels in an economically and ecologically efficient way. Our expertise in renewable energies opens up additional business opportunities for EnBW.
New segments and markets Entering new fields of business offers opportunities in view of EnBW’s corporate strategy, especially given the changes arising in the energy policy environment in Germany. As part of our refined regional strategy, we aim to strengthen our relationship with local authorities and municipal utilities even further. Cooperation with third parties, public participation and partnership models also offer us the opportunity to successfully implement our projects as part of our focused corporate strategy. We also want to seize further strategic opportunities on selected international markets. In this context, EnBW is focusing on countries exhibiting high growth dynamics in economic output and energy consumption, such as those in central and eastern Europe as well as Turkey. EnBW sees an opportunity to participate in this dynamic growth through local investments.
102 _
With electricity and gas sales remaining the same for the most part, the EnBW group’s earnings situation deteriorated considerably in the fiscal year 2011 in comparison to the prior year. The operating result – adjusted EBIT – fell by 17%, while the non-operating result, reflecting extraordinary earnings components, reported a high loss. The developments are due to the changes in the energy policy environment as well as the challenging market conditions. The performance indicators for financial position and net assets reflect the financial burdens, while largely remaining at a satisfactory level. Important rating agencies confirmed EnBW’s A rating at the end of 2011. (> Management report > The EnBW group > Financing facilities > p. 64f)
Over the course of 2011, EnBW consistently took measures to counter the loss in earnings and to safeguard the financial stability of the company and its ability to prepare for the future. These measures include stepping up our efficiency enhancement programme, increasing our intended divestitures as well as accompanying these with capital measures. We will also reduce the planned investment volume. At the end of 2011, we reduced our share in Energiedienst Holding AG (EDH) by 15.05% to 66.67%. We also agreed on the sale of our non-controlling interests in Poland, which was still subject to the approval of the anti-trust authorities as of 31 December 2011, however. In October 2011, EnBW successfully issued a hybrid bond with a volume of € 750 million on the capital market, half of the funds from which will be recognised as equity over the next few years. EnBW is also preparing further steps for strengthening equity. The EnBW group’s adjusted net debt will fall in 2012.
EnBW’s corporate strategy is two-fold. Firstly, we aim to secure our low-carbon generation position, primarily by increasing the share of generation from renewable energy sources. Secondly, we will establish local solution offers in the field of energy in order to bring energy supply closer in line with energy consumption – preferably on the basis of renewable energy sources and the involvement of customers, municipalities and municipal utilities. EnBW is currently in a phase of realignment, which we are driving forward with great commitment together with our employees. Securing the financial stability of the group is essential for this process.
Overall assessment of the economic situation of the group

Time to act
Management report
Remuneration report ‹
Financial statements
Corporate governance
Service
_ 103
The remuneration report contained on pages 211 to 217 of the corporate governance report is an integral part of the management report. The remuneration report summarises the principles applied to determine the remuneration of members of the Board of Management and explains the structure and amount of the board remuneration and the remuneration of the Supervisory Board.
Remuneration report

104 _
In the following, the Board of Management provides the information prescribed by Secs. 289 (4) and 315 (4) German Commercial Code (HGB) and explains this in accordance with Sec. 176 (1) Sentence 1 German Stock Corporations Act (AktG).
Composition of subscribed capital The subscribed capital of EnBW Energie Baden-Württemberg AG (EnBW) amounts to € 640,015,872.00 and is divided into 250,006,200 no par value bearer shares with an imputed value of € 2.56 each.
Direct or indirect capital investments exceeding 10% OEW Energie-Beteiligungs GmbH, which is based in Ravens-burg (Germany), and NECKARPRI-Beteiligungsgesellschaft mbH, which is based in Stuttgart (Germany), each held 46.55% of the share capital of EnBW as of 31 December 2011.
The sole shareholder of OEW Energie-Beteiligungs GmbH is Zweckverband Oberschwäbische Elektrizitätswerke with registered offices in Ravensburg (Zweckverband OEW). The latter therefore had an indirect shareholding of 46.55% in EnBW’s share capital via OEW Energie-Beteiligungs GmbH as of 31 December 2011.
The sole shareholder of NECKARPRI-Beteiligungsesellschaft mbH is NECKARPRI GmbH based in Stuttgart, which in turn is an entity wholly owned by the federal state of Baden-Württemberg. NECKARPRI GmbH and the federal state of Baden-Württemberg therefore each had an indirect share of 46.55% in EnBW’s share capital via NECKARPRI-Beteiligungs-gesellschaft mbH as of 31 December 2011.
Restrictions relating to the voting rights or transferability of shares In its tender documents published on 7 January 2011 for the voluntary public takeover offer made to EnBW shareholders, NECKARPRI GmbH announced that, based on an agreement concluded with Zweckverband OEW, OEW Energie-Beteiligungs GmbH and the former shareholders Electricité de France SA (EDF) and E.D.F. INTERNATIONAL SA (EDFI), once the share purchase agreement concluded between NECKARPRI GmbH and EDFI on the purchase by NECKARPRI GmbH of the shareholding in EnBW held at that time by EDFI has been executed, NECKARPRI GmbH together with the state of Baden-Württemberg will accede to the
shareholder agreement with Zweckverband OEW and OEW Energie-Beteiligungs GmbH dated 26 July 2000 in EDFI and EDF’s place, releasing the latter from their obligations. The tender documents published by NECKARPRI GmbH do not specify information on any potential changes made to the shareholder agreement dated 26 July 2000 compared to the version published by EDF and printed on page 104 of the EnBW Annual Report 2010. The share purchase agreement concluded between NECKARPRI GmbH and EDFI was executed on 17 February 2011, resulting in the state of Baden-Württemberg and NECKARPRI GmbH becoming parties to the shareholder agreement with Zweckverband OEW and OEW Energie-Beteiligungs GmbH. On 5 April 2011, NECKARPRI GmbH transferred the entire equity interest in EnBW AG it held as of this date to its newly formed subsidiary NECKARPRI-Beteiligungsgesellschaft mbH; the latter thereby in turn became a party to the shareholder agreement with Zweckverband OEW and OEW Energie-Beteiligungs GmbH.
According to the above-mentioned tender documents, the shareholder agreement contains customary clauses governing the relationship between the two major shareholders of EnBW and their relationship with EnBW and coordination of their influence on EnBW. These include but are not limited to clauses prescribing that voting rights are to be exercised in a coordinated and in some cases uniform manner, establishing a shareholders’ committee for these purposes and clauses stipulating that each party shall consult with the other party on significant transactions and decisions. In addition, NECKARPRI GmbH stated in the tender documents that the shareholder agreement may potentially be amended or cancelled in full or in part during the term of the acceptance period of the voluntary public takeover offer.
On 27 January 2012, the general meeting of Zweckverband OEW agreed to uphold the shareholder agreement with NECKAPRI and the state of Baden-Württemberg. The Board of Management of EnBW has not received any information on whether any changes or additions to the shareholder agreement have been made compared to the content presented above as a result of this or any other event. According to the information available to EnBW pursuant to Secs. 21 et seq. German Securities Trading Act (WpHG), the state of Baden-Württemberg, NECKARPRI GmbH, NECKARPRI-Beteiligungs-gesellschaft mbH, Zweckverband OEW and OEW Energie-Beteiligungs GmbH were still coordinating their actions
Disclosures pursuant to Secs. 289 (4), 315 (4) German Commercial Code (HGB) and explanatory report of the Board of Management

Time to act
Management report
Disclosures pursuant to Secs. 289 (4), 315 (4) German Commercial Code (HGB) and explanatory report of the Board of Management
‹
Financial statements
Corporate governance
Service
_ 105
regarding EnBW on account of an agreement or otherwise at the time when this management report was prepared.
Legal provisions and statutes on the appointment and dismissal of members of the Board of Management and amendments to the articles of incorporation and bylaws Pursuant to Sec. 84 German Stock Corporations Act (AktG) in conjunction with Sec. 31 German Co-determination Act (MitbestG), responsibility for the appointment and dismissal of members of the Board of Management rests with the Supervisory Board. This competence is stipulated in Art. 7 (1) Sentence 2 of EnBW’s articles of incorporation and bylaws. If under exceptional circumstances a required board member is missing, Sec. 85 German Stock Corporations Act (AktG) requires in urgent cases that the board member be appointed by the court.
The annual general meeting has the right to make changes to the articles of incorporation and bylaws in accordance with Sec. 119 (1) No. 5 German Stock Corporations Act (AktG). The specific rules of procedure are contained in Secs. 179 and 181 German Stock Corporations Act (AktG). For practical reasons, the right to amend the articles of incorporation and bylaws, relating solely to the wording, was transferred to the Supervisory Board. This option pursuant to Sec. 179 (1) Sentence 2 German Stock Corporations Act (AktG) is incorporated in Art. 18 (2) of the articles of incorporation and bylaws.
Resolutions of the annual general meeting to amend the articles of incorporation and bylaws are, pursuant to Sec. 179 (2) German Stock Corporations Act (AktG), passed by the annual general meeting with a majority of at least three quarters of the capital stock represented at the passing of the resolution, unless the articles of incorporation and bylaws provide that the amendment of the purpose of the company requires a higher majority of the capital. Pursuant to Art. 18 (1) of the articles of incorporation and bylaws, the resolutions of the annual general meeting require a simple majority of the votes cast, unless legal regulations or the articles of incorporation and bylaws prescribe otherwise. If the law requires a larger majority of the votes cast or of the capital stock represented when taking the resolution, the simple majority suffices in those cases where the law leaves it up to the articles of incorporation and bylaws to determine this.
Authority of the Board of Management to issue shares or acquire treasury shares Since 29 April 2004, the annual general meeting at EnBW has not authorised the company in accordance with Sec. 71 (1) No. 8 German Stock Corporations Act (AktG) to purchase treasury shares. The company may purchase treasury shares only on the basis of other reasons justifying acquisition in accordance with Sec. 71 (1) German Stock Corporations Act (AktG). As of 31 December 2011 the company has 5,749,677
treasury shares which were purchased on the basis of earlier authorisations in accordance with Sec. 71 (1) No. 8 German Stock Corporations Act (AktG). The treasury shares of the company can be sold on the stock exchange or by public offer to all shareholders. The use of treasury shares, in particular their sale, in any other way must fall within the scope of the resolution taken by the annual general meeting on 29 April 2004. The treasury shares held by EnBW do not grant the company any rights in accordance with Sec. 71b German Stock Corporations Act (AktG).
Material agreements subject to the condition of a change of control as a result of a takeover bid and the resulting effects The following agreements of EnBW are subject to the condition of a change of control following a takeover bid as defined by Sec. 289 (4) No. 8 and Sec. 315 (4) No. 8 German Commercial Code (HGB):
Financing arrangements A syndicated line of credit of € 2 billion, which had not been drawn by 31 December 2011, can be terminated by the lenders and fall due for repayment if a third party acquires control. This does not apply if the third party is the state of Baden-Württemberg or OEW or another German public law legal entity.
A bond of JPY 20 billion issued on 12 December 2008 under the debt issuance programme can be terminated by the lenders and fall due for repayment if a third party acquires control. This does not apply if the third party is EDF (whose legal successor as shareholder is now the state of Baden Württemberg) or OEW or another German public law corporation.
There is also a bilateral long-term bank loan of € 500 million that can be terminated by the lenders and fall due for repayment if a third party acquires control, provided the change of control may have a negative effect on repayment of the loan in future. This does not apply if the third party is EDF (whose legal successor as shareholder is now the state of Baden Württemberg) or OEW. (> Management report > Financing facilities > p. 64f)
A bilateral long-term bank loan of € 80 million, which had not been drawn by 31 December 2011, can be terminated by the lenders and fall due for repayment if a third party acquires control, provided the change of control may have a negative effect on repayment of the loan in future. This does not apply if the third party is EDF or the state of Baden-Württemberg or OEW.
Corporate law agreements Under the shareholder agreement between EnBW and Eni S.p.A., Eni S.p.A. has the right to acquire EnBW’s 50% share in EnBW Eni Verwaltungsgesellschaft mbH in the event of a change of control at EnBW. A change of control is deemed to have taken place when an energy supply company directly or indirectly obtains

106 _
the majority of the voting rights in EnBW. EnBW Eni Verwaltungsgesellschaft mbH holds 100% of the shares in Gasversorgung Süddeutschland GmbH. The purchase price that Eni S.p.A. would have to pay for the share held by EnBW in EnBW Eni Verwaltungsgesellschaft mbH is based on the market value determined by expert appraisal.
In the event of a change of control at EnBW, EnBW is required to offer its shareholding in EWE Aktiengesellschaft (EWE) to EWE’s municipal shareholders, Weser-Ems-Energiebeteiligungen GmbH and Energieverband Elbe-Weser-Beteiligungsholding GmbH. The purchase price is the market price as determined by an expert appraisal. A change of control is deemed to have taken place when a shareholder other than EDF (whose legal successor as shareholder is now the state of Baden Württemberg) or OEW directly or indirectly obtains the majority of the voting rights in EnBW; this may also be achieved through joint control together with another shareholder.
Nos. 4, 5 and 9 of Secs. 289 (4), 315 (4) German Commercial Code (HGB) were not relevant for EnBW in the fiscal year 2011.

Time to act
Management report
Forecast ‹
Financial statements
Corporate governance
Service
_ 107
As international economic growth weakens, the framework conditions for the energy sector are
becoming increasingly difficult. The change in Germany’s energy policy will have a noticeable impact
on EnBW’s earnings over the next few years. We have launched an extensive package of measures as
a way of securing EnBW’s credit standing and actively shaping the new energy concept in the future.
To the extent possible, our forecast takes an in-depth look at the expected future development of EnBW and the environment we work in for the next two fiscal years.
Anticipated economic environment
Future economic development The global economy continues to be influenced by the weak economic growth in the US and the ongoing debt crisis in some countries in the euro area. Against this backdrop, the International Monetary Fund (IMF) forecasts modest international economic growth in 2012. The expected increase in economic output was lowered by 0.5 percentage points to 4.0%. The European Commission even lowered its forecast in November 2011 by 0.6 percentage points to 3.5%. The Commission anticipates economic growth for 2013 to amount to 3.6%. At 6.1%, the IMF forecasts that growth in economic output among emerging and developing countries will continue to exhibit more dynamism than among industrial countries in 2012. For the OECD countries, the Organisation for Economic Co-operation and Development (OECD) has forecast growth of 1.6% for 2012 and 2.3% for 2013. The European Commission forecasts the gross domestic product (GDP) in the EU to all but stagnate in 2012, anticipating growth of a mere 0.6% (euro area: 0.5%). In 2013, economic output is expected to slowly pick up again and show growth of around 1.5% (euro area: 1.3%). According to the IMF, economic growth in the countries in central and eastern Europe will come to 2.7% in 2012. For EnBW’s strategic international and growth markets – the Czech Republic and Turkey – the OECD forecasts growth of 1.6% and 3.0%, respectively, for 2012. Economic growth is expected to begin to show signs of recovery and pick up again in 2013. According to the OECD, GDP growth in the Czech Republic will then amount to 3.0%, with the Turkish economy growing by 4.5%. In light of increasing uncertainty surrounding the global economy and the pressure being put on the majority of industrialised countries to consolidate, the German Council of Economic Experts is forecasting a mere 0.9% rise in GDP for Germany in 2012. The German Institute for Economic Research (DIW) predicts an increase of only 0.6% in 2012. However, as economic output begins to
pick up again, a growth rate of 2.2% is expected to be reached in 2013.
Demand for energy: Periods of strong expansion or contraction of the economy as a whole have a great influence on industrial demand for energy as was shown in 2009 and 2010. Despite the fact that the short-term outlook for global economic growth is currently unclear, the International Energy Agency forecasts that global energy consumption will increase by a third between 2010 and 2035. Even for Germany – despite slowed economic growth forecast for the near future – we expect the demand for electricity and gas to rise slightly over the next two years.
Future development of the markets for primary energy sources, CO2 allowances and electricity Oil market: The average price for short-term oil deliveries (front month) was around US$ 110.91/bbl in 2011. Forward market prices for the one-year product Brent 2012 amounted to US$ 108.37/bbl on average in 2011. On average, forward curves showed a fall in price expectations in 2011, triggered by global and European economic concerns, potentially causing a decline in demand for oil. On the supply side, the risk of an escalating conflict with Iran increased, along with the risk of associated disruptions to delivery. However, at the end of 2011 market participants still expected prices to fall further. On the whole, oil prices will be affected primarily by the actual development of supply and demand, the US dollar exchange rate and whether crude oil remains attractive as an asset class.
Coal market: The market prices for forward delivery of hard coal to the ARA ports (Amsterdam, Rotterdam, Antwerp) had increased slightly by the end of 2011 (2012: US$ 111.94/t, 2013: US$ 117.23/t). These were at a higher level than spot prices,
Forecast
108 _
which were at US$ 112.07/t. This shows that market players expect prices to remain stable or increase slightly in the medium term. The development of the world economy, the European debt crisis and above all the possibility of economic growth cooling in emerging countries will determine future price developments. There continue to be uncertainties surrounding the amounts imported by China as well as the development of demand in Germany and Japan.
Gas market: Since the beginning of 2011, the forward prices on the gas market for 2012 have been significantly higher than the spot price. On the Dutch wholesale market TTF, the price in December 2011 for gas deliveries in 2012 averaged € 24.05/MWh and that for deliveries in 2013 averaged € 24.51/MWh. The reason for this high price is two-fold. Firstly, market participants expect Japan’s demand for liquefied natural gas (LNG) to soar following the disaster at the Fukushima nuclear power plant in March 2011. Secondly, Germany’s accelerated phase-out of nuclear power will involve using more gas and coal-fired power stations, which will in turn cause a higher demand for the respective energy sources. Prices will also be kept high by the unstable situation in northern Africa and the Middle East. The South Stream and Nabucco pipelines, currently at the planning or construction stage, are expected to increase supply reliability in the long term.
CO2 allowances: Important factors influencing the development of the price of CO2 allowances include the progress of the international climate protection negotiations and the upcoming decision on an increase in the European Union’s climate targets for 2020. This could have an impact on the volume of emissions permitted in future. Also decisive for the price development is how voting on a strategic reserve of CO2 allowances goes. The level of fuel switching costs are a further factor influencing prices. Demand is determined by the future development of the European economy that is currently in danger of falling into recession, which in turn affects the volume of emissions.
Electricity market: With spot market prices averaging € 51.12/MWh in 2011, forward prices for base load products stood at € 52.05/MWh (2012) at the end of 2011. The price for the 2013 base product stood at € 52.33/MWh at the beginning 0f 2012. Market participants continue to anticipate a stable price level slightly above today’s spot prices until 2014. The forward price curve therefore demonstrates a stable sideways movement. On the supply side, the main factors relevant to the future price development on the spot market are the prices for fuels and CO2 allowances. On the demand side, the economic development, especially industrial demand, is a significant factor in determining the price of electricity. On the supply side, the great expansion of renewable energies and the realisation of existing power station construction projects, among other factors, are causing prices to fall. In contrast, if the supply situation
remains tense, the decommissioning of older nuclear power plants is likely to push prices up. In light of the increase in the feed-in level of renewable energies based on the purchase and remuneration requirement under the German Renewable Energies Act (EEG), volatility on the wholesale spot market has increased. In future, this may lead to a more frequent occurrence of very low prices in some hours. At the same time, the cost allocation under the German Renewable Energies Act will cause a structural rise in the costs for end customers.
Future political and regulatory
environment
EnBW’s business operations will continue to be impacted to a significant degree by European and German energy policy over the coming years.
Europe: On 22 June 2011, the European Commission presented its final draft for a directive of the European Parliament and of the Council on the topic of energy efficiency. The directive is currently being debated. A decision is expected to be reached in 2012. Depending on how it is structured, the directive may generally contain measures governing infrastructure and the EU energy strategy, thereby influencing our business activities.
Germany: The new efforts being undertaken by the federal government for a modification and expansion of the search for an ultimate repository may be most relevant. The aim is to have drafted a law on the search for an ultimate repository by summer 2012. Decrees are also expected to come into force in the area of flexible consumption, meter reading and incentive regulations.
Regulatory environment: In accordance with the Incentive Regulation Ordinance (ARegV), there are two regulation periods for gas and electricity, during which the regulatory authorities approve revenue caps for both areas (2009 to 2012 and 2013 to 2017 for gas, 2009 to 2013 and 2014 to 2018 for electricity). It has not yet been possible to foresee whether the Federal Network Agency will take any additional regulatory measures before then. In June 2011, the German Federal Court of Justice (BGH) made two policy decisions on how revenue caps are determined. Several higher regional courts are also dealing with issues surrounding investment budget, extension factors and the level of interest rates applied to debt. Clarification of these and any new issues may lead to incentive regulations being adjusted.

Time to act
Management report
Forecast ‹
Financial statements
Corporate governance
Service
_ 109
Future industry development
The energy sector in Europe is currently in a state of upheaval. The events in Japan have forced the issue of energy policy to the centre of public interest. The political and regulatory conditions are changing, thereby forcing companies in the industry to review their business models. On top of this, many generation facilities are outdated and in need of renovation. Falling generation margins, the pending full auctioning of CO2 allowances, increasing requirements relating to the environmental and climate compatibility of business activities as well as increasing government regulations are burdening companies’ earning power and limiting their ability to invest. The answers to these challenges vary from company to company, ranging from rigid cost-cutting measures to expansion strategies that increase debt levels. We pursue a balanced and future-oriented corporate strategy that takes into account the interests of all stakeholders and the company’s future sustainability.
We expect competition in the retail and industrial customer business to remain fierce, both for electricity and for gas. In certain segments, the competitive situation will get even more intense due to the high level of price sensitivity on the part of customers and a rising number of providers from other industries. For retail and industrial customers, the next few years will be increasingly about seizing the opportunities the new and complex energy world has to offer. The question of who will set the benchmark for the solution skills this requires will become the subject of great competition between energy providers as well as between energy providers and the telecommunications and electronics industries, energy consultants, etc. In this regard, EnBW believes it is already well prepared. We will continue to systematically expand our offerings in areas such as smart home, electromobility, local generation and energy efficiency.
Politicians are demanding and supporting local generation concepts and more widespread energy services. These conditions are generally positive for EnBW’s business development, with the company expecting demand for energy efficiency solutions such as contracting to rise. Such solutions are demanded by industrial and commercial customers through their needs for energy-efficient and CO2-low facilities as well as by municipalities and in the service sector, where increasing the efficiency of buildings is a top priority.
Corporate strategy and future
development of the company
The environment for EnBW’s business activities is changing quickly and radically. Consequently, EnBW has made its objective to actively address and structure this change with a view to safeguarding the company’s future sustainability. Our strategy focuses on two strategic moves (> Management report > Objectives and Strategy> p. 48):
› Safeguarding low-carbon generation capacity › Establishing local solution offers
Securing our leading generation position with low CO2 emissions is one of EnBW’s key strategic moves, with special emphasis being placed on the expansion of renewable energies. By 2020, we aim to have expanded renewable energy capacities by 3,000 MW. In addition to pumped storage capacities, gas power stations are to make the greatest contribution in providing our generation portfolio with the flexibility required for increasing the use of renewable energies. As a supplementary measure, we are optimising EnBW’s existing portfolio of power stations and ensuring that the running and decommissioning of our nuclear power plants is done safely following the highest security standards. Our total generation capacity will be kept level in the long term at around 15,000 MW.
EnBW is catering to the increasing demand of municipalities, municipal utilities, industrial, commercial and retail customers for local energy solutions and is expanding its portfolio of services accordingly. We will intensify our sales of products and services relating to e-mobility, energy efficiency and smart home throughout Germany. We are also open to partnership models along the entire value chain. We intend to achieve economies of scale by opening up further EnBW’s internal operating functions to third parties.
With regard to our activities abroad, we are concentrating on the three national markets of the Czech Republic, Switzerland and Turkey, where we see considerable market opportunities and opportunities for returns. We will end our existing investments in other countries.
Implementing our strategy will require considerable investments in coming years. At the same time, our financial headroom is coming under severe constrictions on account of the energy policy decisions made in the recent past. As a result, the Board of Management of EnBW has approved a package of measures as a way of forming a sound basis for the further development of the company.

110 _
› Improving efficiency: We increased the “Fokus” efficiency programme launched in autumn 2010 by € 450 million. The objective is to achieve a sustainable improvement in EBIT of € 750 million p.a. The measures will be developed in detail by the end of 2014 and, following this, take full effect on earnings.
› Investments: Major changes in industry conditions have forced EnBW to review and adjust its investment planning for the coming years. For the period from 2012 to 2014, EnBW has budgeted gross investments of € 4.1 billion. This planning does not yet take into account the cash inflow that would result from an equity increase. For this reason, activities to shape the new energy concept that have not yet been adopted are not included in this investment volume.
Capital expenditure 2012 – 2014 (%)
Expansion (15) Growth (49)
Existing portfolio (36)
› Divestitures: In order to safeguard the financial headroom for investments, our investment programme also provides for an increase in divestitures. The sale of non-strategic equity investments is planned to generate € 1.5 billion for the period from 2012 to 2014. A portion of these divestitures was already realised through the sale of shares in Energie Holding AG at the end of 2011, thereby reducing the volume of classic divestitures for the forecast period to € 1.3 billion. In addition to this are divestitures arising from participation models for renewable energies as well as other disposals of property, plant and equipment of some € 1.1 billion.
Construction cost subsidies and other disposals (29)
Traditional divestitures (55)
Divestitures 2012 – 2014 (%)
Divestitures (16)
› Capital measures: At the end of October 2011, EnBW successfully placed a hybrid bond with a volume of € 750 million on the capital market, 50% of which was recognised as equity. We are currently in talks with the two major shareholders concerning measures amounting to some € 800 million for strengthening the company’s equity basis. Furthermore, a general meeting of Zweckverband Oberschwäbische Elektrizitätswerke (OEW) held mid-October 2011 declared its general willingness to support EnBW with further capital. With regard to a capital increase intended to be performed by EnBW in 2012, the general meeting of OEW passed a unanimous resolution on 27 January 2012 to participate in a capital increase at EnBW through its subsidiary OEW Energie-Beteiligungs GmbH with up to € 400 million. At the beginning of December, the state of Baden-Württemberg announced that it is likewise willing to subscribe to a capital increase at EnBW. On 15 February 2012, as part of the state’s 2012 budget legislation, the state parliament put the necessary requirements in place such that NECKARPRI GmbH or an entity affiliated with it as defined by Sec. 15 German Stock Corporations Act (AktG) may participate in the intended capital increase, likewise in the amount of no more than € 400 million.
Anticipated business development
In light of the profound changes to the energy policy environment in 2011, we will not be able to reach our original targets for 2012 or 2013. In addition to the introduction of the nuclear fuel rod tax in 2011, burdening EnBW’s operating result by between € 250 and 300 million a year, the company’s earnings will be hit hard in coming years as a result of the withdrawal of the decision to extend the working lives of two nuclear power plants and their decommissioning. This will be exacerbated by falling wholesale market prices and, as of 2013, the full auctioning of CO2 allowances.
By contrast, the opposite effect will be achieved as a result of introducing the “Fokus” efficiency programme, which, at its full effect, will amount to an improvement in EBIT of € 750 million p.a. as of 2014. Additional restructuring expenses are not likely to be incurred in 2012 and subsequent years. The many different strategic initiatives launched to extend EnBW’s portfolio of local energy solutions and the major investments currently being made, such as in offshore wind farms and coal and gas-fired power plants, will also generate considerable earnings growth in the medium term.

Time to act
Management report
Forecast ‹
Financial statements
Corporate governance
Service
_ 111
Anticipated development of unit sales and revenue The revenue of the EnBW group in absolute terms is of secondary importance for earnings performance. This is because revenue in the electricity generation and trading segment is determined primarily by the trading activities of our trading entity. Depending on how the market develops over the year, revenue may be subject to considerable fluctuations without this being reflected as such in the profit or loss. In the gas segment, the development of revenue tends to be influenced by the indexing of the gas price to the oil price, but that is not decisive for the gross margin in the gas segment.
Rather, the company’s future results of operations are influenced to a greater extent by unit sales in the B2C and B2B sectors of the electricity grid and sales segment and the gas segment. Overall, we expect unit sales in the electricity grid and sales segment in 2012 to remain unchanged on 2011. We will combat the ongoing fierce competition in the B2C segment with a range of innovative products and services. Even in the B2B segment, we expect to largely maintain the
sales level achieved in the prior year despite intense competition, the general efforts being taken to save energy and the troubled economic outlook in comparison to 2011.
In the gas segment, we have based our forecast for 2012 on average weather temperatures. The year 2011, however, was warmer than average, and therefore the forecast naturally shows a positive effect on sales for 2012, in comparison to 2011, based on the weather. In the B2C segment, the temperature effect described above will be the primary positive factor; however, even adjusted for temperature effects, we expect unit sales to increase. In the B2B business, we aim to maintain our sales of gas despite the strong competition. Adjusted for temperature effects, unit sales will most likely fall, as gas sales in the B2B business for 2011 contained high affinity trading activities that are unlikely to reoccur.
The revenue in the energy and environmental services segment is likely to increase further in 2012.
(External) sales in the segments in 20121 compared to the prior year
Electricity grid and sales segment (unit sales B2C, B2B) stable
Gas segment excluding trading (unit sales B2C, B2B) rising slightly
Energy and environmental services segment (revenue) rising slightly
1 Segments adjusted for changes in the consolidated companies.
Anticipated development of earnings (adjusted EBITDA) The sustainable earnings power of operating activities is of particular importance for the internal management and external communication of EnBW’s future development of earnings. For this reason, we have been using adjusted EBITDA – earnings before interest, taxes, depreciation and amortisation adjusted for non-operating effects – since the beginning of 2012 as a key reporting indicator for presenting the expected development of earnings. In comparison to adjusted EBIT, adjusted EBITDA is used by many analysts as a way of analysing development relating to cash. This is also manifested in the key performance indicator we use for the dynamic leverage ratio (net debt/adjusted EBITDA). This also improves comparability with other companies in the industry.
For many years now, the electricity generation and trading segment has made the largest contribution to EnBW’s earnings, and determines the group’s result to a large degree. Adjusted EBITDA in this segment will fall considerably in 2012. This is primarily due to prices falling on the wholesale markets for electricity during prior periods in which we agreed on sales prices for quantities of electricity that are to be supplied in 2012. This is coupled with the effect that the
wide range of financial burdens arising from the fundamental changes to the energy policy environment in Germany will now take effect throughout the whole of 2012 in comparison to 2011. Our efficiency improvement measures may only slightly cushion these negative influences in this segment in 2012.
By contrast, adjusted EBITDA in the electricity grid and sales segment is set to increase considerably in 2012. In the B2C business, we expect margins to improve and earnings to rise. In the B2B segment, margin development is likely to be noticeably more moderate. In the regulated business, we expect earnings to be boosted as a result of the cost of connecting offshore wind farms and solar power plants to the grid being included in network user charges with immediate effect rather than in later periods. Our measures to raise efficiency will of course also increase earnings in this segment.
We expect higher earnings for 2012 in the gas segment. Sales are likely to increase if temperatures are average. In addition, the start-up costs incurred in 2011 for the gas midstream business will not have to be borne.

112 _
Earnings in the energy and environmental services segment are expected to be lower in 2012 in comparison to the prior year. The two underlying factors will be the passing on of the efficiency improvements made in this segment to the companies operating in other segments, which was not the case in 2011, as well as the start-up and expansion costs for an overhauled IT platform. By opening up our IT invoicing and settlement systems to third parties, we expect to achieve positive economies of scale as of 2013.
As things stand today, changes in the consolidated group will not have any effect on earnings in 2012.
As a result, adjusted EBITDA at group level in 2012 will be between 10% and 15% below the 2011 level. The current extensive efficiency measures will only offset some of the additional costs incurred. The trend is not expected to reverse in the fiscal year 2013: improving efficiency can only offset the full auctioning of CO2 allowances to a limited extent. In 2013, we expect adjusted EBITDA to fall between 15% and 20% in comparison to 2011. As of 2014, we expect earnings to gradually rise as a result of the successive commissioning of power plants and the effectiveness of our efficiency programme. This will put adjusted EBITDA for 2014 at the level of 2012.
Development of earnings 2012
(adjusted EBITDA)1 compared to the prior year
2012 2011
Electricity generation and trading segment falling strongly 1,615.4
Electricity grid and sales segment rising strongly 481.2
Gas segment rising 125.8
Energy and environmental services segment falling 354.9
Holding/consolidation - – 124.3
Consolidated companies no effect -
Adjusted EBITDA, group – 10% to – 15% 2,453.0
1 Segments adjusted for changes in the consolidated companies.
Adjusted group net profit, dividend, non-operating result and ROCE Adjusted amortisation and depreciation will increase in 2012 as a result of high level of growth in investment. For 2012, we expect the adjusted investment result to show a slight improvement as a result of the business results returning to normal for important equity investments. The loss in the adjusted financial result is expected to fall considerably in 2012. This is based on the absence of effects relating to other periods as well as an improved investment performance with regard to the management of our cover funds by reducing the current high level of liquidity. The adjusted tax rate will decrease as the investment result accounts for a larger share of profit for 2012. On the whole, we therefore anticipate the adjusted group net profit after non-controlling interests to fall by between 10% and 15% in the fiscal year 2012. This development will most likely also continue in 2013, especially given the fact that additional expenses will also be incurred then as a result of the full auctioning of CO2 allowances.
The non-operating result will improve in 2012 compared to the current reporting year. This will be attributable to two factors, namely the negative non-recurring effects in 2011
and the divestiture programme introduced helping to contribute to profits.
We plan to finance the budgeted investments from cash flow from operating activities. Owing to the reduced investment volume and stable cash flows, adjusted net debt will be reduced significantly. In this connection, our aim is to reduce the dynamic leverage ratio as a way of maintaining our A rating. Taking financial stability into consideration, in principle we aim to achieve a distribution rate of 40% to 60% of adjusted group net profit.
The fall in return on capital employed (ROCE) seen in 2011 will continue in 2012. While capital employed will increase further, as capital expenditures exceed depreciation, earnings are set to fall.

Time to act
Management report
Overall assessment of the economic situation of the group ‹
Financial statements
Corporate governance
Service
_ 113
Business development at EnBW AG EnBW AG’s net profit for the year is primarily affected by the investment result, and the anticipated decrease in earnings from the group’s operating business will therefore also have an impact on the net profit for the year reported by EnBW AG. EnBW AG’s result is most likely to improve in 2012 in comparison to the prior year due to the absence of negative non-recurring effects and the positive contributions expected from divestitures. Overall, we expect EnBW AG to generate significant net profit for the year in 2012. In line with the development of group net profit, we then expect EnBW AG’s net profit to fall again in 2013.
Significant opportunities and risks of
the next two years
The generation margin, which reflects how commodity and electricity prices develop, is decisive in determining the level of future earnings at EnBW. As part of our hedging strategy, we have entered into forward contracts to hedge the major volumes for 2012 and to a large extent for the following year as well. The unhedged quantities naturally increase in the years thereafter, as do opportunities and risks.
Another risk factor for the results of operations is the availability of our power stations. In the past, our power stations always achieved above-average availability in a national comparison.
Considerable risks for EnBW’s sales activities can primarily arise as a result of changes in consumer behaviour. Risks relating to electricity and gas sales as well as the customer base further arise from unforeseeable activities of competitors and the uncertain political and legal framework for pricing measures. Gas sales are generally highly dependent on temperatures. An additional risk factor is economic development, which mainly influences consumption in trade and industry. Sales opportunities arise from the growing demand for energy services surrounding issues such as energy efficiency, smart home, energy management, electromobility and local generation.
We see significant business opportunities in the form of increasing collaboration efforts with municipalities and municipal utilities, especially in the construction and operation of local generation facilities based on renewable energy sources. Partnership and public participation models give us access to projects previously out of EnBW’s reach. Entering into sales partnerships with municipal utilities can also boost sales of our products and services.
Opportunities and risks relating to EnBW’s financial assets also depend on the increasing volatility of the capital markets. If price developments lead to a significant or prolonged decline in the fair value of investments below their cost, impairment losses have to be recognised on the
securities. The weighted average cost of capital (WACC) is a major factor in the measurement of EnBW’s investments. This depends on the risk-free interest rate, among other things. In the event of an increase in the corresponding interest rates and, consequently, in WACC, this could lead to the need to record an impairment loss. Changes in the assessment of the future profitability of group entities could also lead to impairment losses.
The fact that conditions have become tougher for the industry means that rating agencies are paying closer attention to German energy companies. Despite the measures taken to reinforce our sound financial position, there is still an increased risk of EnBW being downgraded, which would have a negative impact on our financing sources and costs on the capital market.
Developments in human resources
and welfare
The development and implementation of measures as part of the “Fokus” efficiency programme, which are set to boost EBIT by € 250 million p.a. in the personnel area as of 2014, will form an integral part of our HR policy over the next few years. In 2012, activities will range from developing internal mobility through to a targeted competence management system and professional support for restructuring measures.
Negotiations already underway with the works council and trade unions will be pursued further as part of measures under the “Fokus” programme. Over the next few years, changes are planned to be made to collective agreement benefits as well as the number of employees at EnBW.
As part of reorganisation efforts at EnBW, the efficiency and effectiveness of business processes is being increased considerably by avoiding duplication of efforts and redundancy within the organisation. Streamlining and clarifying EnBW’s business processes will help reduce personnel expenses, primarily in the support functions.

114 _
Research and development
Research and development expenditure in 2012 and 2013 is expected to match the level of 2011 (€ 37.0 million). We also do not expect the number of employees in this area to change.
We will strengthen our current activities for new local energy solutions as well as those pertaining to utilisation concepts for renewable energies. In this regard, smart grids will play a particularly important role, also taking into account storage solutions. Electromobility remains another key focal area of our R&D work. Here, we will continue practice tests for the provision of energy for transportation purposes and start tests on the use of hydrogen as a fuel.
In light of the importance of back-up power plants for future energy supply, techniques for reducing CO2 emissions in the atmosphere will continue to be part of our research.
Overall assessment of the
anticipated development
EnBW expects its adjusted EBITDA to fall in 2012 by between 10% and 15% on the prior year. We expect this trend to continue in 2013, although we will combat it by implementing extensive efficiency measures. We have reduced the planned investment volume and increased the intended level of divestitures. We have also taken certain equity measures and are preparing more. We will give our best attention to maintaining EnBW’s sound financial position. We will therefore reduce adjusted net debt, partly in order to maintain our A rating.
Future-oriented statements
This report contains statements relating to the future that are based on current assumptions and projections of the management of EnBW. Such statements are subject to risks and uncertainties. These and other factors mean that the actual results, financial position, developments or performance of the company may diverge materially from the estimates made here. EnBW assumes no obligation of any kind to update future-oriented statements or to adjust them to reflect future events or developments.

_ 115
Financial statements of the EnBW group
116 Income statement
117 Statement of comprehensive income
118 Balance sheet
119 Cash flow statement
120 Statement of changes in equity
121 Notes of the EnBW group
121 General principles
121 Basis of consolidation
122 Consolidated companies
122 Changes in the consolidated companies
123 Changes in shares held in entities which continue to be fully consolidated
123 Acquisitions in 2010
127 Disposals of entities in 2010
128 Changes in accounting policy
128 Effects of new accounting standards that are not yet mandatory
130 Restatement of prior-year figures
131 Significant accounting policies
137 Exercise of judgement and estimates when applying accounting policies
139 Joint ventures
140 Currency translation
140 Notes to the income statement and the balance sheet 140 (1) Revenue
141 (2) Other operating income
141 (3) Cost of materials
142 (4) Personnel expenses
142 (5) Other operating expenses
143 (6) Amortisation and depreciation
143 (7) Investment result
144 (8) Financial result
145 (9) Income taxes
147 (10) Intangible assets
150 (11) Property, plant and equipment
152 (12) Investment property
153 (13) Entities accounted for using the equity method
155 (14) Other financial assets
156 (15) Trade receivables
157 (16) Income tax refund claims
157 (17) Other assets
159 (18) Inventories
159 (19) Financial assets
160 (20) Cash and cash equivalents
160 (21) Equity
163 (22) Provisions
169 (23) Deferred taxes
170 (24) Liabilities and subsidies
174 (25) Assets held for sale and liabilities directly associated with assets classified as held for sale
175 Other notes 175 (26) Earnings per share
176 (27) Accounting for financial instruments
188 (28) Contingent liabilities and other financial commitments
189 (29) Audit fees
189 (30) Exemption pursuant to Sec. 264 (3) HGB and Sec. 264b HGB
190 (31) Declaration of compliance with the German Corporate Governance Code
190 (32) Share deals and shareholdings of key management personnel
191 (33) Notes to the cash flow statement
193 (34) Additional disclosures on capital management
194 (35) Segment reporting
198 (36) Related parties (entities)
200 (37) Related parties (individuals)
201 (38) Additional disclosures
204 (39) Disclosures concerning franchises
204 (40) Subsequent events
204 (41) Future-oriented statements
205 Audit opinion
206 Declaration of the legal representatives

116 _
€ millions1 Notes 2011 2010
Revenue including electricity and natural gas tax 19,757.0 18,406.2
Electricity and natural gas tax -967.3 -897.2
Revenue (1) 18,789.7 17,509.0
Changes in inventories 30.6 7.8
Own work capitalised 59.7 65.1
Other operating income (2) 933.8 1,317.4
Cost of materials (3) -15,111.6 -12,962.5
Personnel expenses (4) -1,614.9 -1,670.4
Other operating expenses (5) -1,278.6 -951.4
EBITDA 1,808.7 3,315.0
Amortisation and depreciation (6) -1,137.8 -1,190.2
Earnings before interest and taxes (EBIT) 670.9 2,124.8
Investment result (7) -646.4 103.2
of which net loss/profit from entities accounted for using the equity method (-694.3) (93.0)
of which other income from investments (47.9) (10.2)
Financial result (8) -806.7 -716.7
of which finance revenue (346.9) (371.0)
of which finance costs (-1,153.6) (-1,087.7)
Earnings before tax (EBT) -782.2 1,511.3
Income tax (9) -33.7 -359.6
Group net loss/profit -815.9 1,151.7
of which loss/profit shares attributable to non-controlling interests (51.4) (-5.5)
of which loss/profit shares attributable to the equity holders of EnBW AG (-867.3) (1,157.2)
Shares outstanding (millions), weighted average 244,257 244,257
Earnings per share from group net loss/profit (€)2 (26) -3.55 4.74
1 Prior-year figures restated. Further disclosures are presented in the notes under "Changes in accounting policy" and "Restatement of prior-year figures". 2 Basic and diluted; in relation to loss/profit shares attributable to the equity holders of EnBW AG.
Income statement

Time to act
Management report
Financial statements
Statement of comprehensive income ‹
Corporate governance
Service
_ 117
€ millions1 2011 2010
Group net loss/profit -815.9 1,151.7
Difference from currency translation -83.1 -46.7
Cash flow hedge -111.5 367.8
Available-for-sale financial assets -323.3 178.1
Entities accounted for using the equity method -6.7 -17.1
Income taxes on other comprehensive income 50.3 -119.3
Other comprehensive income -474.3 362.8
Total comprehensive income -1,290.2 1,514.5
of which loss/profit shares attributable to non-controlling interests (29.4) (-2.3)
of which loss/profit shares attributable to the equity holders of EnBW AG (-1,319.6) (1,516.8)
1 Prior-year figures restated. Further disclosures are presented in the notes under "Changes in accounting policy" and "Restatement of prior-year figures".
Statement of comprehensive income

118 _
€ millions1 Notes 31/12/2011 31/12/2010 1/1/2010
Assets Non-current assets Intangible assets (10) 2,034.6 2,144.9 1,746.9Property, plant and equipment (11) 14,059.6 13,935.7 12,127.8Investment properties (12) 77.3 99.0 70.3Entities accounted for using the equity method (13) 2,805.2 3,752.5 3,756.7Other financial assets (14) 5,442.8 5,950.6 5,691.4Trade receivables (15) 535.5 479.2 425.9Income tax refund claims (16) 19.2 23.7 215.9Other non-current assets (17) 325.1 290.9 203.8Deferred taxes (23) 38.8 28.2 29.2 25,338.1 26,704.7 24,267.9Current assets Inventories (18) 958.1 991.1 944.8Financial assets (19) 1,011.0 955.8 771.7Trade receivables (15) 3,077.0 3,213.8 2,807.5Income tax refund claims (16) 164.1 389.1 241.2Other current assets (17) 2,285.9 1,635.5 2,639.5Cash and cash equivalents (20) 2,776.6 1,878.3 1,470.8 10,272.7 9,063.6 8,875.5Assets held for sale (25) 209.9 11.8 1,698.0 10,482.6 9,075.4 10,573.5 35,820.7 35,780.1 34,841.4Equity and liabilities Equity (21) Equity holders of EnBW AG Subscribed capital 640.0 640.0 640.0Capital reserve 22.2 22.2 22.2Revenue reserves 4,278.9 5,404.2 4,620.7Treasury shares -204.1 -204.1 -204.1Other comprehensive income 131.2 584.8 225.2 4,868.2 6,447.1 5,304.0Non-controlling interests 1,265.2 1,155.4 1,077.9 6,133.4 7,602.5 6,381.9Non-current liabilities Provisions2 (22) 11,027.5 10,322.1 9,638.8Deferred taxes (23) 1,495.3 1,800.3 1,666.4Financial liabilities (24) 6,263.7 6,677.4 6,737.0Other liabilities and subsidies (24) 1,960.6 1,965.7 1,948.3 20,747.1 20,765.5 19,990.5Current liabilities Provisions3 (22) 1,387.2 1,213.2 1,006.2Financial liabilities (24) 1,476.1 643.5 447.3Trade payables (24) 3,528.1 3,164.4 2,803.4Income tax liabilities (24) 57.9 47.7 27.1Other liabilities and subsidies (24) 2,490.3 2,343.3 3,416.9 8,939.6 7,412.1 7,700.9Liabilities directly associated with the assets classified as held for sale (25) 0.6 0.0 768.1 8,940.2 7,412.1 8,469.0 35,820.7 35,780.1 34,841.4
1 Prior-year figures restated. Further disclosures are presented in the notes under "Changes in accounting policy" and "Restatement of prior-year figures". 2 Of which non-current provisions for income tax: € 264.3 million (31 December 2010: € 195.6 million; 1 January 2010: € 143.3 million). 3 Of which current provisions for income tax: € 142.9 million (31 December 2010: € 163.0 million; 1 January 2010: € 84.2 million).
Balance sheet

Time to act
Management report
Financial statements
Cash flow statement ‹
Corporate governance
Service
_ 119
€ millions1, 2 2011 2010
1. Operating activities EBITDA 1,808.7 3,315.0Change in provisions 192.7 -41.5
Gain/loss on disposal of non-current assets 14.7 -182.3Other non-cash expenses/income 169.0 -259.2Funds from operations (FFO) before taxes and financing 2,185.1 2,832.0Change in assets and liabilities from operating activities -421.5 40.5
Inventories (-137.2) (-83.2)Net balance of trade receivables and payables (344.3) (-155.2)Net balance of other assets and liabilities (-628.6) (278.9)
Income tax paid -23.5 -311.6
Cash flow from operating activities 1,740.1 2,560.9 2. Investing activities Capital expenditures on intangible assets and property, plant and equipment -1,171.6 -1,624.8
Cash received from disposals of intangible assets and property, plant and equipment 39.2 45.7
Cash received from construction cost and investment subsidies 83.1 78.3Cash paid for the acquisition of fully and proportionately consolidated entities and entities accounted for using the equity method -85.5 -631.0Cash received from the sale of fully and proportionately consolidated entities and entities accounted for using the equity method 6.3 780.9Cash paid for investments in other financial assets -1,073.8 -1,099.4Cash received from the sale of other financial assets 1,199.2 746.8Cash received/paid for investments in connection with short-term finance planning -56.4 49.3Interest received 238.7 230.4Dividends received 150.4 151.2
Cash flow from investing activities -670.4 -1,272.6 3. Financing activities Interest paid for financing activities -368.7 -355.1
Dividends paid -444.7 -419.2Cash received from changes in ownership interest without loss of control 245.6 0.0Cash paid for changes in ownership interest without loss of control -19.8 0.0
Proceeds from financial liabilities 1,045.1 431.1
Repayment of financial liabilities -628.4 -658.0
Cash flow from financing activities -170.9 -1,001.2Net change in cash and cash equivalents 898.8 287.1Net foreign exchange difference -0.5 12.3
Change in cash and cash equivalents 898.3 299.4Cash and cash equivalents at the beginning of the period3 1,878.3 1,578.9
Cash and cash equivalents at the end of the period 2,776.6 1,878.3
1 Further disclosures are presented under (33) "Notes to the cash flow statement". 2 Prior-year figures restated. Further disclosures are presented in the notes under "Changes in accounting policy" and "Restatement of prior-year figures". 3 As of 1 January 2010 the cash flow statement had included cash and cash equivalents of assets held for sale of € 108.1 million.
Cash flow statement

120 _
€ millions1, 2 Other comprehensive income4
Sub- scribed capital
and capital
reserve3
Revenue reserves
Treasury shares
Differencefrom
currencytrans-lation
Cash flow
hedge
Available-for-sale
financial assets
Entities account-
ed for using the
equitymethod
Equity holders of EnBW AG4
Non- control-
ling inter-ests4
Total
As of 1 January 2010 662.2 4,646.5 -204.1 -4.3 -130.3 336.0 23.8 5,329.8 1,077.9 6,407.7
Changes in accounting policy -25.8 -25.8 -25.8
As of 1 January 2010 after changes in accounting policy 662.2 4,620.7 -204.1 -4.3 -130.3 336.0 23.8 5,304.0 1,077.9 6,381.9
Other comprehensive income -45.3 233.1 188.9 -17.1 359.6 3.2 362.8
Group net profit5 1,157.2 1,157.2 -5.5 1,151.7
Total comprehensive income 0.0 1,157.2 0.0 -45.3 233.1 188.9 -17.1 1,516.8 -2.3 1,514.5
Dividends paid -373.7 -373.7 -45.5 -419.2
Other changes6 0.0 125.3 125.3
As of 31 December 2010 662.2 5,404.2 -204.1 -49.6 102.8 524.9 6.7 6,447.1 1,155.4 7,602.5
Other comprehensive income -68.8 -59.1 -317.7 -6.7 -452.3 -22.0 -474.3
Group net loss/profit -867.3 -867.3 51.4 -815.9
Total comprehensive income 0.0 -867.3 0.0 -68.8 -59.1 -317.7 -6.7 -1,319.6 29.4 -1,290.2
Dividends paid -373.7 -373.7 -71.0 -444.7
Other changes6 115.7 -1.3 114.4 151.4 265.8
As of 31 December 2011 662.2 4,278.9 -204.1 -119.7 43.7 207.2 0.0 4,868.2 1,265.2 6,133.4
1 Prior-year figures restated. Further disclosures are presented in the notes under "Changes in accounting policy" and "Restatement of prior-year figures". 2 Further disclosures are presented in note (21) “Equity”. 3 Of which subscribed capital € 640.0 million and capital reserve € 22.2 million. 4 Of which other comprehensive income directly associated with assets classified as held for sale amounting to € 16.5 million as of 31 December 2011 (31 December 2010: € 0.0 million).
Attributable to the equity holders of EnBW AG: € 16.5 million (31 December 2010: € 0.0 million). Attributable to non-controlling interests: € 0.0 million (31 December 2010: € 0.0 million). 5 Group net profit includes a retroactive restatement for the period from 1 January 2010 to 31 December 2010 of € -13.8 million. Attributable to the equity holders of EnBW AG: € -13.3 million.
Attributable to non-controlling interests: € -0.5 million. 6 Of which changes in revenue reserves and differences from currency translation due to the sale of shares in subsidiaries without loss of control of € 99.7 million and € -1.3 million
(prior year: € 0.0 million). Of which changes in non-controlling interests due to the sale of shares in subsidiaries without loss of control of € 146.6 million (prior year: € 0.0 million).
Statement of changes in equity

Time to act
Management report
Financial statements
Notes of the EnBW group ‹
Corporate governance
Service
_ 121
General principles In accordance with Sec. 315a (1) German Commercial Code (HGB), the consolidated financial statements of EnBW Energie Baden-Württemberg AG (EnBW) are prepared according to the International Financial Reporting Standards (IFRSs), the adoption of which is mandatory in the European Union at the reporting date. In addition, the interpretations of the International Financial Reporting Standards Interpretations Committee (IFRS IC) are observed. IFRSs and IFRICs whose application is not yet mandatory are not early adopted. The consolidated financial statements comply with those IFRSs and IFRICs issued by the International Accounting Standards Board (IASB) which have been endorsed by the EU.
The consolidated financial statements are presented in millions of euros (€ millions). The income statement as well as the statement of comprehensive income, the balance sheet, the cash flow statement and the statement of changes in equity of the EnBW group are presented separately.
In the interest of clarity, items have been combined in the income statement and in the balance sheet, and disclosed separately and explained in the notes.
The income statement has been prepared using the nature of expense method.
The consolidated financial statements are prepared as of the reporting date of the parent company’s financial statements. The parent company’s fiscal year is the calendar year.
The registered offices of the company are in Karlsruhe, Germany. The address is EnBW Energie Baden-Württemberg AG, Durlacher Allee 93, 76131 Karlsruhe.
EnBW’s principal activities are described in the segment reporting.
EnBW’s Board of Management authorised the consolidated financial statements for issue on 15 February 2012.
Basis of consolidation The financial statements of the domestic and foreign subsidiaries and joint ventures included in consolidation were prepared in accordance with the accounting policies of EnBW.
Subsidiaries are consolidated in accordance with the acquisition method. The cost of a business combination is measured based on the fair value of the assets acquired and liabilities assumed or entered into as of the acquisition date. Non-controlling interests are measured at the proportionate share of fair value of the identified assets and liabilities assumed. From 2010, acquisition-related costs are expensed as incurred. If the business combination is achieved in stages, the acquisition-date fair value of the acquirer’s equity interest previously held in the acquiree is remeasured at fair value as of the acquisition date through profit or loss from 2010. Goodwill is measured as the excess of the aggregate of the consideration transferred and the amount of any non-controlling interest in the acquiree over the group’s net identifiable assets acquired and liabilities assumed. If this consideration is lower than the fair value of the net assets acquired, the difference is recognised immediately in profit or loss following further review.
A change in the ownership interest of a subsidiary which continues to be fully consolidated is accounted for as an equity transaction. All remaining shares are remeasured at fair value upon loss of control.
Notes to the 2011 financial statements of the EnBW group

122 _
Receivables, liabilities and provisions between the consolidated entities are netted. Intercompany income is offset against the corresponding expenses. Intercompany profits are eliminated, unless they are immaterial. Deferred taxes are recorded.
Consolidated companies Under the full consolidation method, all subsidiaries are included over whose financial and business policy control can be exercised as defined by the control concept. In this case, the assets and liabilities of a subsidiary are included in full in the consolidated financial statements.
Joint ventures are included in the consolidated financial statements by way of proportionate consolidation. In the case of the proportionate consolidation, the assets and liabilities of the subsidiary are only considered in the consolidated financial statements in proportion to the shareholding of the parent company.
The equity method is used when a significant influence may be exercised on the business policy of the associate, but the entity does not qualify as a subsidiary or a joint venture. When measuring shares, this means that only the proportionate equity of the entity is included in consolidated financial statements, and not its assets and liabilities. Goodwill is included in the carrying amount of the investment. Negative differences are recognised in profit or loss via the investment result.
Shares in subsidiaries, jointly controlled entities or entities accounted for using the equity method which are immaterial from the group’s perspective are accounted for according to IAS 39.
The disclosures required by Sec. 313 (2) German Commercial Code (HGB), which are an integral part of the notes to the consolidated financial statements, are not reprinted here. The disclosures are published in the Electronic German Federal Gazette (elektronischer Bundesanzeiger) as well as on the website of the company at www.enbw.com. The material subsidiaries included in these consolidated financial statements and investments accounted for using the equity method are listed in note (38) “Additional disclosures”.
There are no cross-holdings as defined by Sec. 19 (1) German Stock Corporations Act (AktG) in the EnBW group.
The companies have been consolidated as follows:
Type of consolidation and number 31/12/2011 31/12/2010
Full consolidation 117 114
Proportionate consolidation (joint ventures) 30 31
Entities accounted for using the equity method (associates) 19 18
Changes in the consolidated companies Of the companies fully consolidated in the consolidated financial statements, 8 (prior year: 20) German companies and 3 (prior year: 5) foreign companies were consolidated for the first time in the reporting year. One German company (prior year: 8) and no foreign companies (prior year: 1) were deconsolidated and 7 companies (prior year: 1) were merged.
Of the joint ventures, our share of which was included in the consolidated financial statements, 1 foreign company (prior year: 0) was included for the first time in the subgroup Borusan EnBW Enerji yatirimlari ve Üretim A.S. by way of proportionate consolidation in the reporting year.
The consolidation method was changed for 2 German companies (prior year: 1 foreign company) from proportionate consolidation to full consolidation. No proportionately consolidated companies (prior year: 1 German, 3 foreign) were deconsolidated in the reporting year.

Time to act
Management report
Financial statements
Notes of the EnBW group ‹
Corporate governance
Service
_ 123
Of the associates, 1 German company (prior year: 2) was accounted for using the equity method for the first time. No companies (prior year: 1 German company) previously accounted for using the equity method were no longer included in the reporting year.
No significant acquisitions or disposals of entities took place in fiscal year 2011.
Changes in shares held in entities which continue to be fully consolidated Changes in shares in Energiedienst Holding AG On 22 December 2011, EnBW sold a share of 15.05% in its subsidiary Energiedienst Holding (EDH), Laufenburg, Switzerland, to Services Industriels de Genève (SIG). As a result of the transaction, our shareholding in EDH fell to 66.67%. EnBW continues to have economic control of EDH. The consideration received from this sale of shares amounts to € 245.6 million, which EnBW received in cash. The amount attributable to non-controlling interests amounts to € 147.7 million. The difference between the gain on sale and the amount attributable to non-controlling interests was recorded under revenue reserves and other comprehensive income in equity.
€ millions 2011
Consideration received 245.6
Amount attributable to non-controlling interests 147.7
Amount recognised under revenue reserves in equity 99.2
Amount recognised in other comprehensive income -1.3
Acquisitions in 2010 Share swap Pražská energetika, a.s. and Pražská teplárenská a.s. In the first quarter of 2011, a final fair value opinion was made available to us in connection with the acquisition of Pražská energetika, a.s. (PRE). Consequently, the accounting for the business combination was completed as of 31 March 2011. The assets and liabilities recognised as of the acquisition date and the resulting effects on the income statement were adjusted.
As of 20 September 2010, EnBW had swapped the 24.3% share it previously held primarily via Pražská teplárenská Holding a.s. (PT Holding) in the Prague-based district heating supplier Pražská teplárenská a.s. (PT) in return for the 41.1% share held by Energetický a průmyslový holding, a.s. in PRE. The purpose of the transaction was to obtain a majority shareholding in the Czech energy company PRE and thereby expand our presence in the Czech Republic, a strategic target market. Supplying some 745,000 points of consumption, PRE is the third-largest electricity company in the Czech Republic, bringing together grid operations and sales in the capital city of Prague and the surrounding region.
Prior to the share swap, PRE and PT had been included as joint ventures in the EnBW group by way of proportionate consolidation. Since the transaction, EnBW overall holds 69.6% of the shares in PRE. EnBW obtained economic and industrial control over PRE through the contractual agreements in connection with the share increase, and the entity is therefore included in the consolidated financial statements by way of full consolidation. Following the share swap, EnBW no longer holds any shares in PT.
The consideration transferred in the course of the share acquisition included the PT shares, measured at fair value, of € 200.5 million and a cash component of € 305.1 million. The PT share swap generated other operating income of € 81.1 million contained in the 2010 financial statements. The following assets and liabilities were disposed of in the PT share swap:

124 _
€ millions Carrying amount
under IFRS
Intangible assets held for sale 0.7
Property, plant and equipment held for sale 106.1
Other non-current assets held for sale 1.2
Cash and cash equivalents held for sale 37.5
Other current assets held for sale 11.1
Total assets held for sale 156.6
Non-current liabilities held for sale 9.4
Current liabilities held for sale 8.6
Total liabilities held for sale 18.0
Other comprehensive income 19.2
Net assets attributable to equity holders of EnBW AG 119.4
The 28.5% share previously held in PRE was measured at fair value as of the acquisition date. The resulting gain of € 173.6 million was recognised in other operating income in the 2010 financial statements.
Costs directly attributable to the transaction amounted to € 6.0 million and were recognised in other operating expenses in the 2010 financial statements. The non-controlling interests were measured on the basis of PRE’s identifiable net assets and amount to € 236.5 million. The goodwill of € 271.1 million includes non-separable synergies in the electricity grid and sales segment.
As of its consolidation in full, PRE accounted for revenue of € 215.4 million and earnings after tax of € 17.2 million recorded in the 2010 financial statements. If PRE had been fully consolidated since the beginning of 2010, revenue would have increased by € 462.8 million to € 17,971.8 million and earnings after tax would have increased by € 39.5 million to € 1,191.2 million. The following assets were acquired and the following liabilities were assumed as part of the acquisition:
€ millions1 Carrying amount
under IFRSRecognised
on acquisition
Intangible assets 7.9 197.5
Property, plant and equipment 720.3 847.4
Current assets 93.5 93.5
Total assets 821.7 1,138.4
Non-current liabilities 243.6 253.0
Current liabilities 106.9 106.9
Total liabilities 350.5 359.9
Net assets 471.2 778.5
EnBW's interest in net assets 69.6% 542.0
Costs (paid in cash) 305.1
Fair value of PT shares 200.5
Total consideration transferred 505.6
Fair value of previously held PRE shares 307.5
Goodwill 271.1
1 Figures adjusted based on the final fair value opinion.
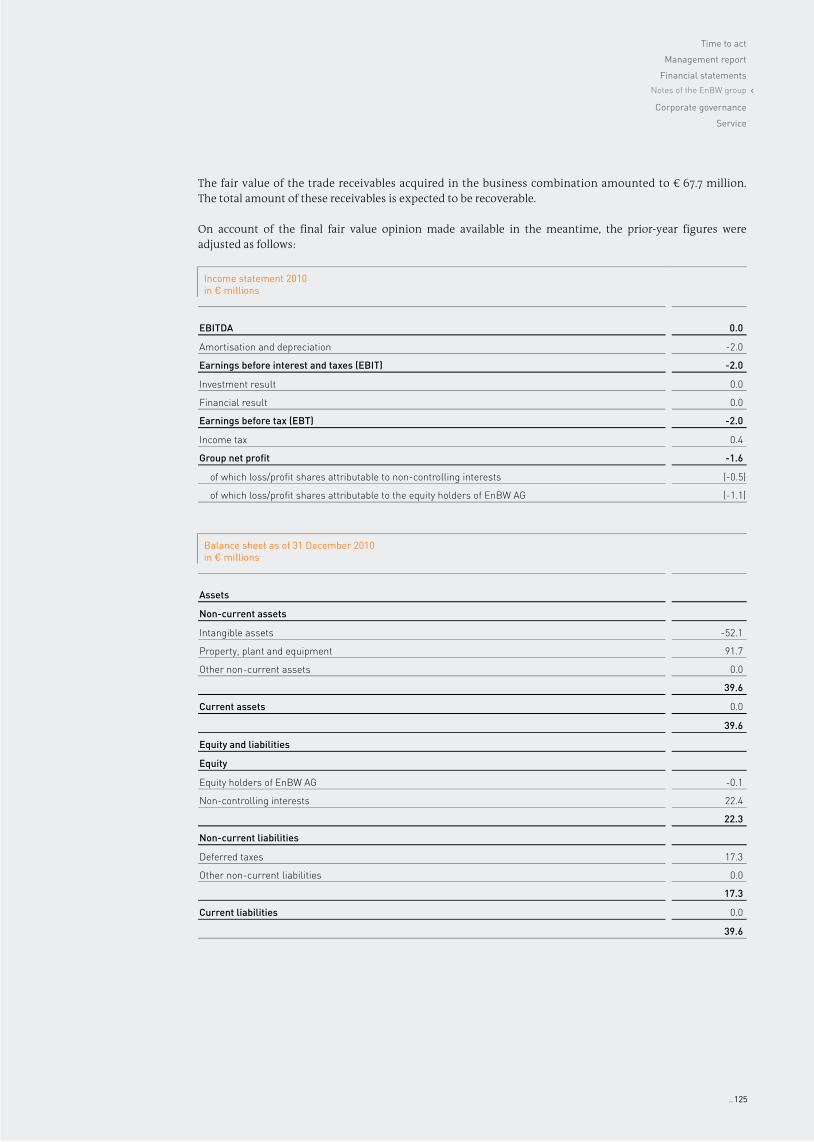
Time to act
Management report
Financial statements
Notes of the EnBW group ‹
Corporate governance
Service
_ 125
The fair value of the trade receivables acquired in the business combination amounted to € 67.7 million. The total amount of these receivables is expected to be recoverable.
On account of the final fair value opinion made available in the meantime, the prior-year figures were adjusted as follows:
Income statement 2010
in € millions
EBITDA 0.0
Amortisation and depreciation -2.0
Earnings before interest and taxes (EBIT) -2.0
Investment result 0.0
Financial result 0.0
Earnings before tax (EBT) -2.0
Income tax 0.4
Group net profit -1.6
of which loss/profit shares attributable to non-controlling interests (-0.5)
of which loss/profit shares attributable to the equity holders of EnBW AG (-1.1)
Balance sheet as of 31 December 2010
in € millions
Assets
Non-current assets
Intangible assets -52.1
Property, plant and equipment 91.7
Other non-current assets 0.0
39.6
Current assets 0.0
39.6
Equity and liabilities
Equity
Equity holders of EnBW AG -0.1
Non-controlling interests 22.4
22.3
Non-current liabilities
Deferred taxes 17.3
Other non-current liabilities 0.0
17.3
Current liabilities 0.0
39.6

126 _
Kraftwerk Rostock mbH In order to further increase its domestic generation capacities, EnBW acquired a 100% share in Gesellschaft für die Beteiligung an dem Kraftwerk Rostock mbH, Hanover, with effect as of 1 January 2010. The company holds a 50.4% shareholding in Rostock power station. The purchase price came to € 320.9 million and was settled in cash. No major acquisition-related costs were incurred for the transaction. The company accounted for revenue of € 85.7 million and earnings after tax of € 4.0 million in the 2010 annual financial statements. The following assets were acquired and the following liabilities were assumed as part of the acquisition:
€ millions Carrying
amount under IFRS
Recognised on acquisition
Intangible assets 0.0 2.4
Property, plant and equipment 44.9 266.9
Current assets 20.9 53.8
Total assets 65.8 323.1
Non-current liabilities 0.0 0.0
Current liabilities 2.2 2.2
Total liabilities 2.2 2.2
Net assets 63.6 320.9
Costs (paid in cash) 320.9
Goodwill 0.0
The fair value of the trade receivables acquired in the business combination amounted to € 20.9 million. The total amount of these receivables is expected to be recoverable.
Onshore wind farms In order to further expand its generation capacity in wind power, EnBW acquired a 100% share in Plambeck Neue Energien Windpark Fonds CVI GmbH & Co. KG, Cuxhaven, Plambeck Neue Energien Windpark Fonds CVII GmbH & Co. KG, Cuxhaven, Plambeck Neue Energien Windpark Fonds LXXXV GmbH & Co. KG, Cuxhaven, Plambeck Neue Energien Windpark Fonds XCIX GmbH & Co. KG, Cuxhaven, and PNE WIND Oldendorf GmbH & Co. KG, Cuxhaven, effective as of 18 March, 5 May, 17 June, 22 September and 30 November 2010, respectively. The purchase price came to € 20.5 million and an amount of € 16.1 million thereof was settled in cash at the acquisition date. This includes contingent consideration of € 4.4 million, relating mostly to earn-out obligations, of which € 1.0 million was already paid as of year-end 2010. The earn-out obligations involve further consideration if the entities acquired meet the conditions for an increase in the consideration required by law in the form of bonus payments. Contingent consideration is expected to amount to € 4.4 million. No major acquisition-related costs were incurred for the transaction. The entities’ wind power plants were completed mid-December 2009, mid-March, mid-June, mid-September and mid-September to early December 2010, respectively. The effect arising from these entities on revenue and earnings after tax in the annual financial statements for 2010 is immaterial, even when including the entities as of the beginning of the year. The following assets were acquired and the following liabilities were assumed as part of the acquisition:

Time to act
Management report
Financial statements
Notes of the EnBW group ‹
Corporate governance
Service
_ 127
€ millions Carrying
amount under IFRS
Recognised on acquisition
Property, plant and equipment 51.5 56.3
Current assets 8.4 8.4
Total assets 59.9 64.7
Non-current liabilities 0.1 0.5
Current liabilities 43.7 43.7
Total liabilities 43.8 44.2
Net assets 16.1 20.5
Costs (paid in cash) 16.1
Contingent consideration liabilities 4.4
Total consideration transferred 20.5
Goodwill 0.0
The fair value of other receivables acquired in the business combination amounted to € 7.2 million. The total amount of these receivables is expected to be recoverable.
Disposals of entities in 2010 GESO Beteiligungs- und Beratungs-AG Based on a condition imposed by the antitrust authorities in connection with the purchase of shares in EWE Aktiengesellschaft, EnBW AG decided in December 2009 to sell the shares in GESO Beteiligungs- und Beratungs-AG (GESO). The sale of GESO and its subsidiaries was completed in March 2010. The purchaser was Technische Werke Dresden GmbH (TWD), an entity wholly owned by Dresden, the capital city of the German state of Saxony. Other operating income before costs to sell generated from the sale came to € 176.6 million. The proceeds of € 834.4 million were paid in cash. They include repayment of group loans amounting to € 220.6 million. The following assets and liabilities were disposed of as part of the sale:
€ millions Carrying
amount under IFRS
Intangible assets held for sale 157.3
Property, plant and equipment held for sale 814.2
Other non-current assets held for sale 414.7
Cash and cash equivalents held for sale 24.2
Other current assets held for sale 208.3
Total assets held for sale 1,618.7
Non-current liabilities held for sale 547.9
Current liabilities held for sale 508.7
Total liabilities held for sale 1,056.6
Other comprehensive income 9.3
Net assets 552.8
Non-controlling interests 115.6
Net assets attributable to equity holders of EnBW AG 437.2

128 _
Changes in accounting policy The IASB and the IFRS IC have issued the following new standards and interpretations, the adoption of which is mandatory as of the fiscal year 2011. They did not have a material impact on EnBW’s consolidated financial statements.
› Omnibus of amendments to various IFRSs (2010) “Improvements to International Financial Reporting Standards”
› Amendment to IFRS 1 (2010) “Limited Exemptions from Comparative IFRS 7 Disclosures for First-time Adopters”
› Amendment to IAS 24 (2009) “Related Party Disclosures” › Amendment to IAS 32 (2009) “Classification of Rights Issues” › Amendment to IFRIC 14 (2009) “Prepayments of a Minimum Funding Requirement” › IFRIC 19 “Extinguishing Financial Liabilities with Equity Instruments”
With regard to the obligation to dispose of fuel rods regardless of volume in accordance with Sec. 9a German Atomic Power Act (AtG), this was allocated to the provision pro rata in prior years. In fiscal year 2011, the provision was recorded in full and a corresponding asset was recognised. A restatement was made for the prior years in accordance with IAS 8. The change in accounting policy offers a better insight into the entity’s net assets, financial position and results of operations. The restatements made to the consolidated financial statements in the reporting year and in prior years are as follows:
Income statement in € millions 2011 2010
Cost of materials 139.0 35.2
EBITDA 139.0 35.2
Amortisation and depreciation -116.0 -25.4
Earnings before interest and taxes (EBIT) 23.0 9.8
Financial result -10.0 -27.0
Earnings before tax (EBT) 13.0 -17.2
Income tax -3.8 5.0
Group net loss/profit 9.2 -12.2
of which loss/profit shares attributable to the equity holders of EnBW AG (9.2) (-12.2)
Earnings per share from group net loss/profit (€)1 0.04 -0.05
1 Basic and diluted; in relation to the loss/profit shares attributable to the equity holders of EnBW AG.
Balance sheet in € millions 31/12/2011 31/12/2010 1/1/2010
Property, plant and equipment 167.7 500.7 202.6
Revenue reserves -28.8 -38.0 -25.8
Provisions 208.3 554.3 239.0
Deferred taxes -11.8 -15.6 -10.6
Effects of new accounting standards that are not yet mandatory The IASB and IFRS IC have published the following standards and interpretations whose adoption is not yet mandatory for the fiscal year 2011. Their application in the future is subject to their endorsement by the EU into European law.
› Amendment to IAS 1 (2011) “Presentation of Items of Other Comprehensive Income”: According to the amendments, items of other comprehensive income that will be reclassified to profit or loss subsequently are required to be presented separately from items that are not reclassified. If items of other comprehensive income are presented before tax, the associated tax must similarly be presented separately for each category.
Time to act
Management report
Financial statements
Notes of the EnBW group ‹
Corporate governance
Service
_ 129
Furthermore, the term used in IAS 1 for the statement of comprehensive income has been changed to statement of “profit or loss and other comprehensive income”. The amendments are effective for fiscal years beginning on or after 1 July 2012. The amendments have not yet been endorsed into European law. The effects on EnBW’s consolidated financial statements are currently being assessed.
› Amendment to IAS 12 (2010) “Deferred Taxes: Recovery of Underlying Assets”: The amendment clarifies at least some of the issues relating to the treatment of taxable temporary differences when using the fair value model in IAS 40 “Investment Property”. The amendment of IAS 12 also led to the amendment of SIC 21 “Income Taxes – Recovery of Revalued Non-Depreciable Assets”. The amendments are effective for the first time for fiscal years beginning on or after 1 January 2012. The amendments have not yet been endorsed into European law. The effects on EnBW’s consolidated financial statements are currently being assessed.
› Amendment to IAS 19 (2011) “Employee Benefits”: The most significant amendment to IAS 19 is that unexpected fluctuations of pension obligations and actuarial gains and losses must be recognised directly in equity (other comprehensive income) in future. The amendment removes the previous option allowing a choice between immediate recognition in profit or loss, recognition in other comprehensive income or delayed recognition according to the corridor method. The amendments are effective for fiscal years beginning on or after 1 January 2013. The amendments to IAS 19 have yet to be endorsed into European law. The effects on EnBW’s consolidated financial statements are currently being assessed.
› Revision of IAS 27 (2011) “Separate Financial Statements”: The standard was revised as part of the comprehensive reform project regarding consolidation. IAS 27 now solely comprises the unamended provisions on IFRS separate financial statements. The revised standard is effective for the first time for fiscal years beginning on or after 1 January 2013. The standard has not yet been endorsed by the EU. The standard is not expected to have any effect on EnBW’s consolidated financial statements.
› Amendment to IAS 28 (2011) “Investments in Associates and Joint Ventures”: IAS 28 was amended in 2011 in connection with the IASB project on joint arrangements. Most of these amendments are the result of including joint ventures in IAS 28 (2011). The underlying approach for recognition using the equity method was not changed. The amendments are effective for the first time for fiscal years beginning on or after 1 January 2013. They have yet to be endorsed by the EU. The effects on EnBW’s consolidated financial statements are currently being assessed.
› Amendment to IAS 32 (2011) “Offsetting Financial Assets and Financial Liabilities”: This amendment specifies the criteria for the offsetting of financial assets and liabilities in more detail by providing additional application guidelines. This amendment is effective for fiscal years beginning on or after 1 January 2014. It has yet to be endorsed by the EU. The effects on EnBW’s consolidated financial statements are currently being assessed.
› Amendment to IFRS 1 (2010) “Severe Hyperinflation and Removal of Fixed Dates”: The first amendment removed the reference to the fixed date for first-time adopters “1 January 2004” and replaced it with “the date of transition to IFRSs”. The second amendment provides guidance on how an entity should resume presenting financial statements in accordance with IFRSs after a period of severe hyperinflation, during which the entity had been unable to comply with IFRSs. The amendments are effective for fiscal years beginning on or after 1 July 2011. They have yet to be endorsed by the EU. The amendments are not expected to have any effect on EnBW’s consolidated financial statements.
› Amendment to IFRS 7 (2010) “Financial Instruments: Disclosures – Transfers of Financial Assets”: These amendments will require extended disclosures on transfers of financial assets and are intended to help users of financial statements to gain a better understanding of such transactions. The amendments are effective for the first time for fiscal years beginning on or after 1 July 2011. The amendments are not expected to have any effect on EnBW’s consolidated financial statements.
› Amendment to IFRS 7 (2011) “Disclosures – Offsetting Financial Assets and Financial Liabilities”: In connection with the amendment to IAS 32 “Financial Instruments: Presentation” with regard to offsetting financial instruments, the scope of the disclosures which IFRSs require in the notes to the financial statements was expanded. The amended IFRS 7 is effective for the first time for fiscal years beginning on or after 1 January 2013. It has yet to be endorsed by the EU. The effects on EnBW’s consolidated financial statements are currently being assessed.

130 _
› IFRS 9 “Financial instruments”: Publication of IFRS 9 (2009) and IFRS 9 (2010) by the IASB represents the completion of the first part of a three-part project to reform accounting for financial instruments. The IASB intends to completely replace the existing IAS 39 “Financial instruments: Recognition and Measurement” with IFRS 9. In the first part, the standard addresses the classification and measurement of financial instruments. IFRS 9 reduces the existing measurement categories to two: at amortised cost and at fair value through profit or loss. On 16 December 2011, the IASB published an amendment to IFRS 9 delaying the date it is to be applied for the first time to fiscal years beginning on or after 1 January 2015 (previously 1 January 2013). IFRS 9 has not yet been endorsed by the EU. The effects on EnBW’s consolidated financial statements are currently being assessed.
› IFRS 10 “Consolidated Financial Statements”: IFRS 10 replaces the consolidation requirements in the previous IAS 27 “Consolidated and Separate Financial Statements” and SIC 12 “Consolidation – Special Purpose Entities”, thus creating a uniform definition of control. IFRS 10 is to be applied for the first time for fiscal years beginning on or after 1 January 2013. The standard has not yet been endorsed by the EU. The effects on EnBW’s consolidated financial statements are currently being assessed.
› IFRS 11 “Joint Arrangements”: IFRS 11 replaces IAS 31 “Interests in Joint Ventures” and SIC 13 “Jointly Controlled Entities – Non-monetary Contributions by Joint Ventures” and contains provisions regulating the identification, classification and accounting treatment of joint arrangements. IFRS 11 is to be applied for the first time for fiscal years beginning on or after 1 January 2013. It has yet to be endorsed by the EU. The effects on EnBW’s consolidated financial statements are currently being assessed.
› IFRS 12 “Disclosure of Interests in Other Entities”: The new standard regulates the disclosure requirements for group relationships in the notes to the consolidated financial statements as well as the disclosure of joint arrangements and associates. IFRS 12 is to be applied for the first time for fiscal years beginning on or after 1 January 2013. The standard has not yet been endorsed into European law. The effects on EnBW’s consolidated financial statements are currently being assessed.
› IFRS 13 “Fair Value Measurement”: IFRS 13 standardises the definition of and requirements for the measurement of the fair values disclosed in the notes to the financial statements. IFRS 13 is to be applied for the first time for fiscal years beginning on or after 1 January 2013. The standard has not yet been endorsed by the EU. The effects on EnBW’s consolidated financial statements are currently being assessed.
› IFRIC 20 “Stripping Costs in the Production Phase of a Surface Mine”: IFRIC 20 regulates the requirements for accounting for stripping costs associated with waste removal during the production phase of surface mining. The interpretation clarifies when production stripping costs should be recognised as an asset and how the asset is initially recognised and subsequently measured. IFRIC 20 is to be applied for the first time for fiscal years beginning on or after 1 January 2013. The interpretation has not yet been endorsed into European law. The interpretation is not expected to have any effect on EnBW’s consolidated financial statements.
Restatement of prior-year figures › The final fair value opinion in connection with the acquisition of Pražská energetika, a.s. (PRE) allowed the
accounting for the business combination to be completed as of 31 March 2011. The assets and liabilities recognised as of the acquisition date and the resulting effects on the income statement were adjusted. The restatements of the prior-year figures in the income statement and balance sheet are detailed in the section “Acquisitions in 2010”.
› To improve the presentation of the financial position, we summarised the change to non-current and current provisions in the 2011 cash flow statement. This caused funds from operations (FFO) before taxes and financing to increase by € 84.3 million on the prior year to € 2,832.0 million. The cash flow from operating activities remained unchanged.
Additional disclosures on the restatement of prior-year figures can be found in these notes to the consolidated financial statements in the section “Changes in accounting policy”.

Time to act
Management report
Financial statements
Notes of the EnBW group ‹
Corporate governance
Service
_ 131
Significant accounting policies Intangible assets Intangible assets acquired for a consideration are carried at amortised cost and, except for goodwill, are amortised using the straight-line method over their useful life. The amortisation period of acquired software ranges from three to five years; the amortisation period of franchises for power stations is between 15 and 65 years. Customer relationships are amortised over their expected useful life of between 6 and 30 years, water rights and the underlying franchises are amortised over 30 years.
Internally generated intangible assets are recognised at cost if it is probable that a future economic benefit will flow to the company from the use of the asset and the cost of the asset can be reliably determined. If the recognition criteria are not satisfied, costs are expensed immediately through profit or loss in the year in which they were incurred. At the EnBW group, these assets relate to software programmes that are amortised on a straight-line basis over a useful life of five years.
The useful lives and amortisation methods are reviewed annually.
In accordance with the provisions of the IFRSs, goodwill from capital consolidation is not amortised, but tested for impairment at least once a year and whenever there is any indication that the recoverable amount may be lower than the carrying amount.
Property, plant and equipment Items of property, plant and equipment are measured at cost. Items that are subject to wear and tear are depreciated using the straight-line method over the expected useful life of their individual components. Depreciation is recorded pro rata temporis in the year of addition.
Maintenance and repair costs are recorded as expenses. Renewal or maintenance expenses which lead to future economic benefits of an asset are capitalised.
Investment grants or subsidies are not deducted from the cost of the asset concerned, but recognised on the liabilities side of the balance sheet.
The nuclear power plants also contain the present value, net of depreciation, of the estimated cost of the closure and dismantling of the contaminated plants.
Depreciation on our major items of property, plant and equipment is computed using the following uniform group-wide useful lives:
Years
Buildings 25–50
Power stations 15–50
Electricity distribution plants 25–45
Gas distribution plants 15–55
Water distribution plants 20–40
Other equipment, furniture and fixtures 5–14
The useful lives and depreciation methods are reviewed annually.
Property, plant and equipment are derecognised upon disposal or when no further economic benefits are expected from their continued use or sale. Any gain or loss arising on derecognition of the asset (calculated as the difference between the net disposal proceeds and the carrying amount of the asset) is included in the income statement in the year the asset is derecognised.

132 _
Borrowing costs If an asset necessarily takes a substantial period of time (more than twelve months) to get ready for its intended use, the borrowing costs incurred until it is ready for its intended use that are directly attributable to its acquisition or production are capitalised as part of the respective asset. Where there are specific debt financing arrangements, the respective borrowing costs incurred are used. Where the debt financing arrangements are not specific, borrowing costs are capitalised using a uniform rate within the group of 4.5% (prior year: 5.0%). Borrowing costs totalling € 49.8 million (prior year: € 50.5 million) were recognised as an asset in the fiscal year.
Leases A lease is an agreement whereby the lessor conveys to the lessee in return for a payment or series of payments the right to use an asset for an agreed period of time. This also applies for agreements that do not explicitly describe the conveyance of such a right. Leases are classified either as finance leases or as operating leases.
Leases where the EnBW group as lessee retains substantially all the risks and rewards of ownership of the asset are classified as finance leases. The leased asset is recognised at the lower of fair value and the present value of the minimum lease payments and a corresponding liability is recognised.
The recognised leased asset is depreciated over the shorter of its estimated useful life and the lease term. The liability is repaid in subsequent periods and recognised using the effective interest method. All other leases where the EnBW group is the lessee are classified as operating leases. Lease payments and instalments from operating leases are recognised immediately as an expense in the income statement.
Leases where the EnBW group as lessor transfers substantially all the risks and rewards of ownership of the asset to the lessee are recognised as finance leases at the lessor. A receivable is recognised for the amount of the net investment in the lease. The payments made by the lessee are recognised as repayments on the principal or interest income using the effective interest method.
All other leases where the EnBW group is the lessor are classified as operating leases. The leased asset remains in the consolidated balance sheet and is depreciated. The payments made by the lessee are recognised as income on a straight-line basis over the term of the lease.
Investment property Investment property includes land and buildings held to earn rentals or for capital appreciation and not used by EnBW itself. Investment property is measured at cost less depreciation and, if it has a limited life, is depreciated over a term of 25 to 50 years using the straight-line method. The market value is determined using internationally recognised methods such as the discounted cash flow or mark-to-market methods and disclosed in the notes to the financial statements.
Impairment The carrying amounts of intangible assets, property, plant and equipment, and investment properties are tested for impairment at each reporting date. If there is any indication that the asset may be impaired, the recoverable amount of the asset concerned is determined in impairment testing. The recoverable amount is the higher of the fair value less costs to sell and the value in use.
The fair value is determined on the basis of a business valuation model and reflects the best estimate of the amount at which a third party would acquire the asset. The value in use corresponds to the present value of the future cash flows expected to be derived from an asset or cash-generating unit. A cash-generating unit is the smallest identifiable group of assets that generates cash inflows that are largely independent of the cash inflows from other assets or groups of assets.

Time to act
Management report
Financial statements
Notes of the EnBW group ‹
Corporate governance
Service
_ 133
If it is not possible to determine the recoverable amount for an individual asset, the recoverable amount is determined for the cash-generating unit to which the asset can be allocated.
Goodwill arising from business combinations is allocated to the cash-generating units or groups of cash-generating units that are expected to achieve synergies from the business combination.
The recoverable amount of these cash-generating units or groups of cash-generating units is tested for impairment at least once a year. An additional test is performed whenever there is any indication that the carrying amount may not be recoverable. For more information, please refer to note 10, “Intangible assets”.
If the recoverable amount of an asset falls short of its carrying amount, an impairment loss is recognised in profit or loss. In the event of impairment losses on cash-generating units to which goodwill has been allocated, the goodwill is reduced first. If the impairment loss exceeds the carrying amount of the goodwill, the difference is allocated proportionally to the remaining non-current assets of the cash-generating unit.
If the reason for a previously recognised impairment loss no longer exists at a later date, the impairment loss is reversed. The increased carrying amount of the asset attributable to a reversal may not exceed the carrying amount that would have been determined had no impairment loss been recognised in prior years (amortised cost).
An impairment loss recognised for goodwill may not be reversed in a subsequent period. Accordingly, impairment losses on goodwill are not reversed.
Entities accounted for using the equity method Investments in associates accounted for using the equity method are initially recognised at cost and subsequently recognised according to the amortised interest in net assets. The carrying amounts are increased or reduced each year by the share in profit or loss, dividends paid or other changes in equity. Goodwill is included in the carrying amount of the investment.
Financial assets Investments in non-consolidated affiliated entities, in associates not accounted for using the equity method and in other investees, as well as some of the securities, are allocated to the “available-for-sale” measurement category. This measurement category includes all financial assets that are not “held for trading”, “held to maturity” or “loans and receivables”. They are measured at fair value if it can be determined reliably. If the fair value cannot be determined reliably because there is no active market, these financial assets are measured at amortised cost. Most of these assets are other investments, which are not traded on an active market. Unrealised gains and losses are recognised directly in equity.
If there is any permanent or significant impairment as of the reporting date, the adjustments to the negative market value are recognised in profit or loss. The unrealised gains or losses previously recognised directly in equity are recognised in profit or loss upon sale. Impairment losses are reflected in an allowance account.
Securities classified as “held-to-maturity investments” are measured at amortised cost. These relate to securities listed on the stock exchange that had a total fair value of € 1,182.3 million (prior year: € 1,112.6 million) as of 31 December 2011.

134 _
Loans are accounted for at amortised cost. Loans subject to market interest rates are recognised at nominal value, and low-interest or interest-free loans at present value. Some bad debt allowances are recognised via an allowance account. The decision whether the bad debt allowance reduces the carrying amount directly or indirectly via an allowance account depends on the probability of the anticipated default.
The securities recognised as current financial assets and allocated to the “held for trading” category are measured at fair value through profit or loss. The fair value equals the quoted price or repurchase price as of the reporting date. Changes in fair value are recognised immediately in profit or loss.
To date, EnBW has not made use of the option to measure financial assets or financial liabilities at fair value through profit or loss (fair value option).
Inventories Inventories are stated at costs of purchase or costs of conversion. As a rule, they are measured at average prices. Pursuant to IAS 2, costs of conversion contain the direct costs and an appropriate portion of the necessary materials and production overheads including depreciation. Costs of conversion are determined on the basis of normal capacity utilisation. Borrowing costs are not capitalised as a component of costs of conversion. Appropriate allowance is made for risks relating to slow-moving goods. Where necessary, the lower net realisable value compared to the carrying amount is recognised. Write-ups on inventories are deducted from the cost of materials.
The nuclear fuel rods disclosed in the inventories are measured at amortised cost. Write-downs are determined in accordance with consumption.
Inventories acquired for trading purposes are recognised at fair value less costs to sell.
Emission allowances Emission allowances are recognised under inventories. Emission allowances acquired for no consideration in the current fiscal year are recognised at their nominal value, while those acquired for a consideration to cover anticipated consumption are recognised at cost. Emission allowances acquired for trading purposes are recognised as other assets at fair value through profit or loss, and any fluctuation in fair value is recognised directly in profit or loss.
The obligation to return CO2 emission allowances is accounted for under other provisions. The carrying amount of the provision is determined based on the carrying amount of the emission allowances provided free of charge and, if more emission allowances are needed, on the carrying amount of the existing emission allowances. If further emission allowances are needed, they are accounted for at their fair value as of the reporting date.
Trade receivables and other assets Trade receivables and other assets are accounted for at cost less any bad debt allowances required based on the actual bad debt risk. Trade receivables primarily have short terms to maturity. Consequently, their carrying amounts as of the reporting date approximate their fair value. Receivables that bear off-market interest with remaining terms to maturity of more than one year are disclosed in the balance sheet at present value.
For other current assets, it is assumed that fair value approximates the carrying amount. For other non-current assets, the market value is determined by discounting the expected future cash flows. Some bad debt allowances are recognised via an allowance account. The decision whether the bad debt allowance reduces the carrying amount directly or indirectly via an allowance account depends on the probability of the anticipated default.

Time to act
Management report
Financial statements
Notes of the EnBW group ‹
Corporate governance
Service
_ 135
Cash and cash equivalents Cash and cash equivalents have short terms to maturity. Consequently, their carrying amounts as of the reporting date approximate their fair value.
Treasury shares Own equity instruments which are repurchased (treasury shares) are deducted from equity. No gain or loss is recognised in the income statement on the purchase, sale, issue or cancellation of the group’s own equity instruments.
Provisions for pensions and similar obligations For defined benefit plans, provisions for pensions and similar obligations are determined using the projected unit credit method in accordance with IAS 19. This method considers current and future pension benefits known at the reporting date as well as future anticipated salary and pension increases. Actuarial gains and losses outside the 10% corridor are distributed over the average remaining working lives of the employees using the straight-line method. Assets of funds established to cover the pension obligations are deducted from the provision. Service cost is disclosed in personnel expenses, while the interest portion of additions to the provision and the return on plan assets are recorded in the financial result.
Payments for defined contribution plans are expensed as incurred and presented under personnel expenses.
Other provisions Other provisions take account of all legal or constructive obligations towards third parties resulting from past events that are identifiable at the reporting date and which are uncertain in terms of amount and/or date of occurrence to the extent that it is probable that they will lead to an outflow of resources in future and their amount can be reliably estimated. The provisions are recognised at their settlement amount. They are measured at the estimated future amount or the amount most likely to be incurred.
The non-current provisions are stated at the future amount needed to settle the obligation discounted to the reporting date. This does not apply to provisions for pensions and similar obligations. They are subject to special rules in accordance with IAS 19.
Deferred taxes Deferred taxes are recorded in accordance with the temporary concept (IAS 12) on all timing differences between the tax accounts and the IFRS balance sheet of the individual entities. Deferred taxes from consolidation entries are recognised separately. Deferred tax assets are recognised on unused tax losses if it is reasonably certain that they will be recovered.
Deferred taxes are calculated on the basis of the tax rates that apply or that are expected to apply in the individual countries at the time of utilisation. A tax rate of 29.0% is applied for German group companies. Tax assets and tax liabilities are netted with each other by consolidated tax group or entity if the conditions to do so have been satisfied.

136 _
Financial liabilities Financial liabilities are recorded at fair value upon initial recognition. After initial recognition, they are measured at amortised cost. Liabilities from finance leases are measured at the lower of fair value and present value of the minimum lease payments at the date when the leased asset is recognised.
The fair value of bonds listed on the capital market is the nominal value multiplied by the quoted price as of the reporting date. For current financial liabilities, it is assumed that fair value approximates the carrying amount. For non-current financial liabilities, the market value is determined by discounting the expected future cash outflows. If these financial liabilities are subject to floating interest rates, the carrying amount corresponds to fair value. The fair value of the bonds as of 31 December 2011 amounts to € 6,630.9 million (prior year: € 5,867.0 million), while the fair value of the liabilities to banks comes to € 1,087.2 million (prior year: € 1,233.6 million).
Trade payables and other liabilities Trade payables and other liabilities are recognised at the amount repayable. Trade payables primarily have short terms to maturity. Consequently, their carrying amounts as of the reporting date approximate their fair value. For other current liabilities, it is assumed that fair value approximates the carrying amount. For other non-current liabilities, the market value is determined by discounting the expected future cash outflows. The construction cost subsidies recorded as liabilities are released to other operating income in accordance with the use of the subsidised item of property, plant and equipment. As a rule, the period of release for construction cost subsidies is between 40 and 45 years. Investment cost subsidies and grants are released over the depreciation period of the subsidised assets. The amount released is offset against depreciation in the balance sheet.
Assets held for sale and liabilities directly associated with assets classified as held for sale Assets held for sale are individual non-current assets and groups of assets which can be sold in their present condition, whose sale is highly probable and which satisfy all the criteria defined in IFRS 5. The item “liabilities directly associated with assets held for sale” includes liabilities that are part of a group of assets held for sale.
Assets that meet the criteria to be classified as assets held for sale for the first time are measured at the lower of carrying amount and fair value less costs to sell, and depreciation on such assets ceases.
Gains or losses from measuring individual assets held for sale and groups of assets are disclosed as profit or loss from continuing operations until they are finally sold.
Derivatives Derivatives are measured at fair value in accordance with IAS 39. They are recognised under other assets and other liabilities and subsidies.
Derivatives are measured using quoted prices in active markets such as stock market prices. Where such prices are not available, the fair values are determined by reference to generally accepted valuation techniques. Quoted prices in active markets are used as inputs wherever possible. If they are not available either, entity-specific planning assumptions are considered in the valuation.
If they are contracts that were entered into and continue to be held for the purpose of the receipt or delivery of a non-financial item in accordance with the entity’s expected purchase, sale or usage requirements (own use), they are not recognised as derivatives under IAS 39, but as uncertain future events in accordance with IAS 37.
Derivatives are classified as “held for trading” unless hedge accounting is used. Changes in fair value are recognised immediately in profit or loss.
For derivatives used in a hedge, the accounting treatment of changes in fair value depends on the nature of the hedge.

Time to act
Management report
Financial statements
Notes of the EnBW group ‹
Corporate governance
Service
_ 137
In the case of changes in the fair value of cash flow hedges which are used to offset future cash flow risks arising from existing hedged transactions or highly probable forecast transactions, the unrealised gains and losses are initially recognised directly in equity (other comprehensive income) in the amount of the hedged transaction covered. Amounts are reclassified to the income statement when the hedged transaction is recognised in profit or loss.
In the case of a fair value hedge used to hedge the fair value of assets or liabilities, the gains or losses from the measurement of derivatives and the hedged transactions at fair value are recognised in profit or loss.
Foreign currency risks from investments with a foreign functional currency are secured by hedges of a net investment in a foreign operation. Unrealised exchange differences are initially recognised in equity and reclassified to profit or loss when the foreign operation is sold.
Contingent liabilities Contingent liabilities are possible obligations to third parties or present obligations where the probability of an outflow of resources is remote or the amount cannot be determined reliably. Contingent liabilities are not recognised.
Revenue recognition Revenue is generally recognised when the risk has been transferred to the customer. Substantially all the risks and rewards are transferred to the customer together with the transfer of title or ownership. Revenue is measured at the fair value of the consideration received or receivable for goods or services. Revenue is recognised net of any sales deductions such as price discounts and rebates and VAT as well as after elimination of intercompany sales. Most of the revenue is generated from the sale of electricity and gas, the distribution of electricity and gas as well as waste disposal, energy services and water supply.
Interest income is recognised using the effective interest method. Dividend income is recognised when the right to receive payment is established.
Exercise of judgement and estimates when applying accounting policies The preparation of the consolidated financial statements requires judgements and estimates to be made in applying the accounting policies that affect the reported amounts of assets and liabilities, revenue and expenses and the disclosure of contingent liabilities.
The following judgements in particular were made in the process of applying the accounting policies:
› Judgement is required with respect to certain commodity futures contracts to determine whether they are derivatives as defined by IAS 39 or an uncertain future event in accordance with the provisions of IAS 37.
› Financial assets are allocated to the measurement categories in accordance with IAS 39: “held for trading”, “available for sale”, “held-to-maturity investments” and “loans and receivables”.
› IAS 19 allows different methods for the measurement of pension provisions with regard to the recognition of actuarial gains and losses. The EnBW group uses the corridor method.
These estimates are based on assumptions and forecasts which, by their very nature, are uncertain and may be subject to change. The key future-oriented assumptions and other sources of uncertainty as of the reporting date concerning estimates which have given rise to a considerable risk that material adjustments of carrying amounts of assets and liabilities may be required in the next fiscal year are explained below.

138 _
Goodwill: Goodwill is tested for impairment at least once a year. The impairment test involves estimates above all concerning future cash inflows. To determine the recoverable amount, an appropriate discount rate must be chosen. Future changes in the overall economic, industry or company situation may reduce cash inflows or the discount rate and thus potentially lead to an impairment of goodwill.
Property, plant and equipment: Technical progress, deterioration in the market situation or damage could lead to an impairment of property, plant and equipment.
Impairment of available-for-sale financial assets: Changes in the value of financial assets in the “available for sale” measurement category are recognised directly in equity. Permanent impairment is recognised in the profit or loss for the period. A significant (20% or more) or prolonged (over the last nine months) decline in the fair value of an investment in an equity instrument below its amortised cost is objective evidence of impairment. In the fiscal year 2011, impairment losses of € 80.0 million (prior year: € 79.4 million) were recognised in the income statement for available-for-sale financial assets.
Determination of fair value of financial assets and financial liabilities: The fair value of financial assets and financial liabilities is determined by reference to quoted market prices or using valuation techniques such as the discounted cash flow method. Where the parameters used in the valuation techniques are not supported by observable market data, assumptions need to be made which can affect the fair value of financial assets and financial liabilities.
Trade receivables and other assets: Bad debt allowances are recognised for doubtful debts in order to account for the credit risk. The amount of the allowance includes estimates and judgements concerning individual receivables, based on the age structure of the receivables, the customers’ credit rating, past experience relating to the derecognition of receivables and changes in payment terms. As of 31 December 2011, bad debt allowances on trade receivables and other assets totalled € 103.2 million (prior year: € 70.0 million).
Pension provisions: When calculating pension provisions, differences compared to the actual obligations incurred over time may arise from the selection of underlying assumptions such as the imputed interest rate or trends, use of demographic probabilities based on the 2005 G Heubeck mortality tables and accepted approximation methods for future pension increases from the statutory pension insurance fund.
Nuclear power provisions: The provisions for decommissioning and dismantling relating to nuclear power are based on external appraisals that are updated annually. These appraisals are based on cost estimates of the settlement value for each obligation. The uncertainty inherent in the estimates is primarily due to changes in the scope of the obligation, departures from the assumed cost development and changes in payment dates. Changes in the discount rate could also lead to an adjustment of the nuclear power provisions.
Provisions for onerous contracts: Provisions for onerous contracts are generally set up for onerous procurement and sales agreements. Future changes in market prices on the procurement or sales side may lead to an adjustment of the provisions for onerous contracts.
Acquisition accounting: For acquisition accounting purposes, all identifiable assets, liabilities and contingent liabilities acquired in a share purchase are recognised at fair value as of the date of acquisition. Estimates are used to calculate the fair value of these assets and liabilities as of the date of acquisition. Land and buildings as well as other equipment, furniture and fixtures are generally measured by independent appraisers. Marketable securities are recognised at market price.
The measurement of intangible assets is based on the nature of the intangible asset as well as the complexity of determining fair value. Fair value is therefore determined on the basis of an independent external valuation appraisal.
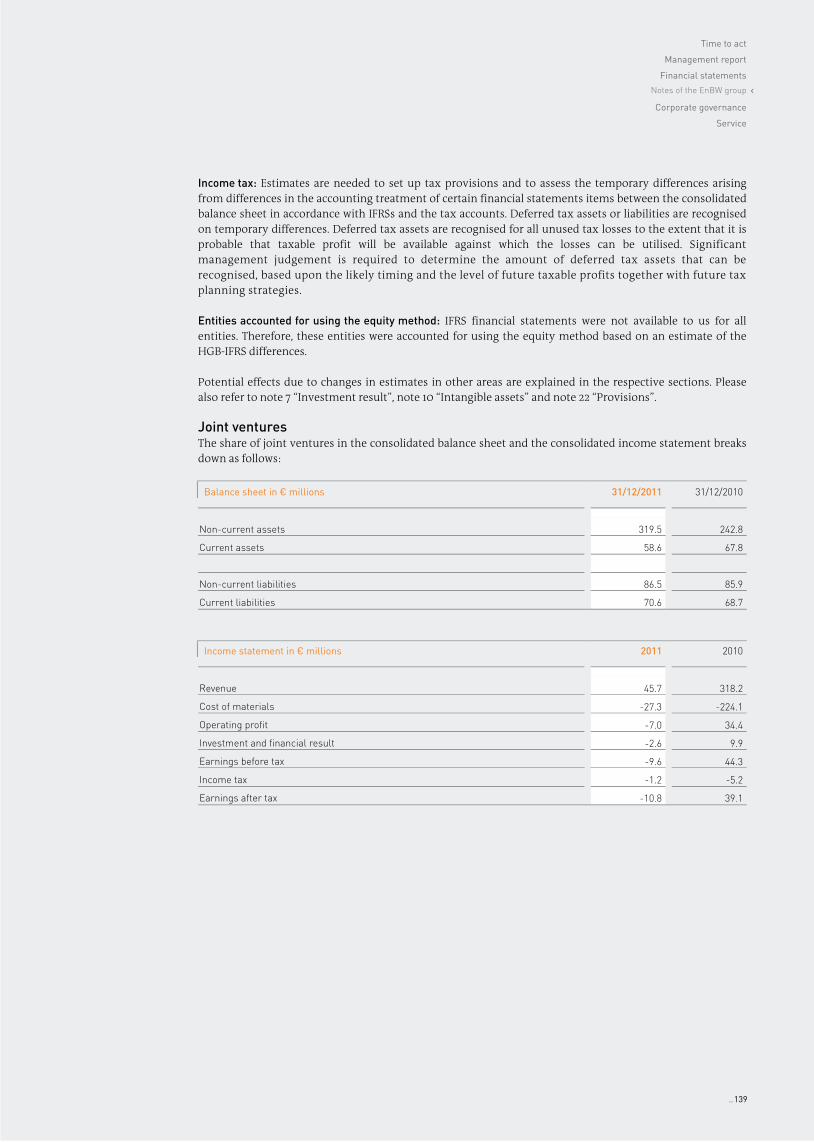
Time to act
Management report
Financial statements
Notes of the EnBW group ‹
Corporate governance
Service
_ 139
Income tax: Estimates are needed to set up tax provisions and to assess the temporary differences arising from differences in the accounting treatment of certain financial statements items between the consolidated balance sheet in accordance with IFRSs and the tax accounts. Deferred tax assets or liabilities are recognised on temporary differences. Deferred tax assets are recognised for all unused tax losses to the extent that it is probable that taxable profit will be available against which the losses can be utilised. Significant management judgement is required to determine the amount of deferred tax assets that can be recognised, based upon the likely timing and the level of future taxable profits together with future tax planning strategies.
Entities accounted for using the equity method: IFRS financial statements were not available to us for all entities. Therefore, these entities were accounted for using the equity method based on an estimate of the HGB-IFRS differences.
Potential effects due to changes in estimates in other areas are explained in the respective sections. Please also refer to note 7 “Investment result”, note 10 “Intangible assets” and note 22 “Provisions”.
Joint ventures The share of joint ventures in the consolidated balance sheet and the consolidated income statement breaks down as follows:
Balance sheet in € millions 31/12/2011 31/12/2010
Non-current assets 319.5 242.8
Current assets 58.6 67.8
Non-current liabilities 86.5 85.9
Current liabilities 70.6 68.7
Income statement in € millions 2011 2010
Revenue 45.7 318.2
Cost of materials -27.3 -224.1
Operating profit -7.0 34.4
Investment and financial result -2.6 9.9
Earnings before tax -9.6 44.3
Income tax -1.2 -5.2
Earnings after tax -10.8 39.1

140 _
Currency translation In the separate financial statements of the entities, business transactions in foreign currency are translated at the rate of the transaction date. Non-monetary items are measured at the rate prevailing when they were first recorded. Monetary items are translated at the closing rate as of the reporting date. Exchange differences from monetary items that are allocable to the operating activities are recognised in other operating income or other operating expenses with effect on profit or loss. Translation differences from financing activities are disclosed in the interest result.
The reporting currency of EnBW, which is also the functional currency, is the euro (€). The financial statements of the group entities are translated to euros. Currency translation is performed in accordance with IAS 21 “The Effects of Changes in Foreign Exchange Rates” using the modified closing rate method. Under this method, the assets and liabilities of entities that do not report in euros are translated at the mean rate prevailing on the reporting date, while expenses and income are translated at the average annual rate. The companies concerned are foreign operations. Differences from the currency translation of assets and liabilities compared to the translation of the prior year as well as exchange differences between the income statement and the balance sheet are recognised directly in equity under other comprehensive income. The same procedure is applied by analogy for foreign entities accounted for using the equity method.
The entities of the EnBW group mainly operate in the euro area. As in the prior year, the provisions of IAS 29 on financial reporting in hyperinflationary economies were not relevant in the fiscal year. No major group entities are domiciled in a hyperinflationary economy.
Currency translation was based on the following exchange rates, among others:
€ 1 Closing rate Average rate
31/12/2011 31/12/2010 2011 2010
Swiss franc 1.22 1.25 1.23 1.38
Pound sterling 0.84 0.86 0.87 0.86
US dollar 1.29 1.34 1.39 1.33
Hungarian forint 314.58 277.95 279.31 275.35
Czech koruna 25.79 25.06 24.59 25.30
Japanese yen 100.20 108.65 111.01 116.47
Notes to the income statement and the balance sheet
(1) Revenue Revenue is recognised when the risk has been transferred to the customer. The electricity and natural gas tax paid by the entities is deducted from revenue in the income statement.
Most of the revenue is generated from the sale of electricity and gas to industry customers, businesses and consumers. In addition, this item includes revenue from the distribution of electricity and gas, of steam, heat and water as well as own-account trading.
In the interest of a more accurate presentation of the business development, income and expenses from energy trading are disclosed net. The net disclosure means that revenue from energy trading is reported net of the related cost of materials. For the fiscal year 2011, the net energy trading revenue came to € 11,882.7 million (prior year: € 9,135.7 million).
The segment reporting contains a breakdown of revenue by business segment and geographical segment.

Time to act
Management report
Financial statements
Notes of the EnBW group ‹
Corporate governance
Service
_ 141
(2) Other operating income € millions 2011 2010
Rent and lease income 22.2 24.4
Income from the release and reduction of specific bad debt allowances 8.6 5.3
Gains on sale and income from acquisitions achieved in stages 7.2 458.5
Income from the reversal of provisions 272.6 198.1
Income from the release and retirement of construction cost subsidies 103.4 104.5
Income from derivatives 253.5 90.4
Sundry 266.3 436.2
Total 933.8 1,317.4
Gains on sale contain income of € 1.8 million (prior year: € 3.1 million) from the disposal of real property held for sale. The high gains on sale in the prior year are mainly due to the deconsolidation of GESO and its subsidiaries as well as of PT Holding and its subsidiaries. The measurement at fair value of shares previously held in PRE had generated income from acquisitions achieved in stages in the prior year.
Reversals of impairment losses on intangible assets, property, plant and equipment and investment property amounted to € 1.0 million in the reporting period (prior year: € 7.4 million).
In the reporting year, income from exchange rate gains came to € 23.7 million (prior year: € 60.6 million). In the reporting year, this figure did not include any exchange rate gains from the deconsolidation of equity investments (prior year: € 44.9 million).
Sundry other operating income mainly includes income from the reversal of accruals and income from insurance claims. In the prior year, this also contained non-operating income from compensation claims for the premature termination of a long-term electricity supply agreement.
(3) Cost of materials € millions1 2011 2010
Cost of materials and supplies and of purchased merchandise 13,100.6 10,653.6
Cost of purchased services 2,011.0 2,308.9
Total 15,111.6 12,962.5
1 Prior-year figures restated.
Cost of materials and supplies and of purchased merchandise comprises in particular electricity and gas procurement costs as well as the necessary increase – other than due to the passage of time – in provisions for the decommissioning of nuclear power plants unless they are required to be recognised as part of the cost of the asset. Expenses relating to nuclear power also include costs for the disposal of irradiated fuel rods and radioactive waste as well as the consumption of nuclear fuel rods and nuclear fuels. In the reporting year, these expenses also included non-operating expenses resulting from additions to nuclear power provisions under the German Atomic Power Act passed by the German federal government. Since the fiscal year 2011, these also include expenses for the nuclear fuel rod tax which must be paid for new fuel rods used. Furthermore, fuels for conventional power stations are also disclosed here.
Cost of purchased services mainly contains expenses for network use, services purchased for the operation and maintenance of the plants as well as franchise fees. In addition, other expenses directly attributable to services rendered are shown under this heading.

142 _
(4) Personnel expenses € millions 2011 2010
Wages and salaries 1,280.6 1,274.0
Social security, pension and other benefit costs 334.3 396.4
of which for post-employment benefits (120.7) (153.3)
Total 1,614.9 1,670.4
Average headcount for the year 2011 2010
Electricity generation and trading 4,972 4,925
Electricity grid and sales 6,140 6,315
Gas 698 700
Energy and environmental services 8,661 8,018
Holding 488 492
Employees 20,959 20,450
Apprentices and trainees in the group 1,178 1,203
Expenses for post-employment benefits arising from the increase in the benefit obligation amount to € 67.2 million (prior year: € 71.3 million). The other expenses for post-employment benefits mainly contain other social benefits that can be recognised as a provision and contributions to the pension guarantee association.
The total figure includes 109 employees (prior year: 416) from entities included on a proportionate basis based on their EnBW share.
(5) Other operating expenses € millions 2011 2010
Rent and lease expenses 38.4 46.4
Expense from specific bad debt allowances 67.4 43.0
Loss on the disposal of non-current assets 21.9 21.5
Other personnel expenses 203.6 71.2
Advertising expenses 82.0 100.2
Administrative and selling costs and other overheads 252.4 249.7
Audit, legal and consulting fees 116.1 152.8
Expenses from derivatives 197.5 68.5
Insurance 46.6 46.5
Dues and levies 8.7 7.3
Other taxes 13.1 22.7
Sundry 230.9 121.6
Total 1,278.6 951.4
In the reporting year, expenses from exchange rate losses came to € 23.6 million (prior year: € 10.0 million).

Time to act
Management report
Financial statements
Notes of the EnBW group ‹
Corporate governance
Service
_ 143
The increase in other personnel expenses is primarily attributable to non-operating expenses from additions to restructuring provisions.
Sundry other operating expenses primarily contain non-operating expenses of € 125.1 million (prior year: € 21.1 million). In the reporting year, these primarily related to expenses from allocations to provisions.
(6) Amortisation and depreciation € millions1 2011 2010
Amortisation of intangible assets 126.6 161.9
Depreciation of property, plant and equipment 1,006.6 1,022.9
Depreciation of investment properties 8.5 10.0
Release of investment cost subsidies -3.9 -4.6
Total 1,137.8 1,190.2
1 Prior-year figures restated.
In the reporting year, there were no impairment losses on goodwill from capital consolidation (prior year: € 35.1 million).
Impairment losses recognised on other intangible assets, property, plant and equipment and investment property amounted to € 282.9 million (prior year: € 222.5 million). In the current fiscal year, impairment losses primarily comprised impairment losses recognised on nuclear power plants and gas grids. Impairment losses recognised on nuclear power plants were triggered by the German Atomic Power Act and have been allocated to the electricity generation and trading segment for segment reporting purposes. Impairment losses recognised on gas grids are allocated to the gas segment. The recoverable amount based on fair value less costs to sell was below the carrying amount due to the regulatory environment deteriorating on a long-term basis.
(7) Investment result € millions 2011 2010
Share of loss/profit of entities accounted for using the equity method -64.1 93.0
Write-downs of entities accounted for using the equity method -630.2 0.0
Net loss/profit from entities accounted for using the equity method -694.3 93.0
Investment income1 49.7 52.1
of which non-consolidated affiliated entities (3.1) (10.0)
Write-downs of investments -8.8 -14.3
of which non-consolidated affiliated entities (-0.4) (-1.9)
Income from the sale of equity investments 7.0 -27.6
Other income from investments 47.9 10.2
Investment result -646.4 103.2
1 Of which € 9.5 million (prior year: € 10.6 million) stems from investments held as financial assets.
In the reporting period, the share of loss/profit of entities accounted for using the equity method included non-operating expenses of EWE Aktiengesellschaft (EWE) of € 91.9 million and EVN AG of € 89.1 million (prior year: € 47.2 million).
The write-downs of entities accounted for using the equity method include impairment losses recognised on the carrying amount of the investment in EWE and EVN AG.

144 _
At EWE, the impairment losses of € 384.8 million were caused by the increased capitalisation rate on account of the rise in uncertainties on the capital market and changed conditions in the energy industry. The carrying amount of the investment in EVN AG was adjusted to market volume by recognising an impairment loss of € 245.4 million.
Write-downs of investments include impairment losses on investments of € 8.4 million (prior year: € 12.4 million). These primarily related to other investments in the reporting year, whereas in the prior year investments held as financial assets were chiefly involved. The impairment losses on shares in affiliated entities amounted to € 0.4 million (prior year: € 1.9 million).
(8) Financial result € millions1 2011 2010
Interest and similar income 223.7 220.7
of which non-consolidated affiliated entities (0.4) (0.3)
Other finance revenue 123.2 150.3
Finance revenue 346.9 371.0
Borrowing costs -335.7 -315.9
Other interest and similar expenses -58.9 -31.4
Interest portion of increases in provisions -594.2 -567.9
Personnel provisions (-227.5) (-227.4)
Provisions relating to nuclear power (-349.4) (-310.9)
Other non-current provisions (-17.3) (-29.6)
Other finance costs -164.8 -172.5
Finance costs -1,153.6 -1,087.7
Financial result -806.7 -716.7
1 Prior-year figures restated.
Interest and similar income contains interest income from interest-bearing securities and loans, dividends and other profit shares.
No interest income (prior year: € 10.2 million) was offset against economically related interest expenses in the fiscal year 2011.
Borrowing costs include expenses for bank interest and bonds of € 263.8 million (prior year: € 249.8 million), the interest portion for finance leases of € 28.8 million (prior year: € 32.7 million) and other borrowing costs of € 43.1 million (prior year: € 33.4 million).
The increase in other interest and similar expenses for the fiscal year 2011 is primarily attributable to interest on tax backpayments. The interest portion from the increase in provisions relates to the annual increase of the non-current provisions due to the passage of time.
Other finance costs contain expenses in the 2011 reporting period of € 71.2 million for impairment losses recognised on our investments in the available-for-sale category (prior year: € 65.1 million). In addition, the other finance costs comprise impairment losses of € 6.1 million on loans (prior year: € 1.2 million) and exchange rate losses on the disposal of securities of € 65.8 million (prior year: € 75.3 million). Other finance revenue contains, among other items, realised exchange rate gains on the sale of securities of € 110.3 million (prior year: € 121.6 million).

Time to act
Management report
Financial statements
Notes of the EnBW group ‹
Corporate governance
Service
_ 145
The total interest income and expenses for financial assets and financial liabilities presented in the financial result breaks down as follows:
Total interest income and expenses in € millions 2011 2010
Total interest income 247.8 237.9
Total interest expenses -334.9 -284.8
The total interest income and expenses arose from financial instruments that are not measured at fair value through profit or loss. The main items here are interest received from loans and bank balances as well as interest and dividends received from financial assets classified as available for sale. The interest expenses were principally incurred on bonds, bank liabilities and finance lease liabilities.
The total interest income did not include any interest income received on impaired financial assets (prior year: € 0.5 million).
(9) Income taxes € millions1 2011 2010
Current income tax
Domestic corporate income tax 205.9 269.4
Domestic trade tax 48.1 171.8
Foreign income taxes 45.6 32.5
Total 299.6 473.7
Deferred taxes
Germany -247.9 -101.4
Abroad -18.0 -12.7
Total -265.9 -114.1
Income tax (-income/+expense) 33.7 359.6
1 Prior-year figures restated.
The net balance of current income tax contains expenses of € 158.7 million (prior year: € 175.2 million) that relate to prior periods. The net balance of deferred taxes contains income of € 88.0 million (prior year: € 112.6 million) that relates to prior periods and income of € 8.9 million (prior year: € 18.9 million) from tax rate changes.
The corporate income tax rate came to 15.0% in the fiscal year plus a solidarity surcharge amounting to 5.5% of corporate income tax. The trade tax rate was 13.2%. This represents a tax rate on income of 29.0%. For the foreign entities, the tax rate applicable in their country of residence is used to calculate income taxes. Deferred tax assets and liabilities are measured at the tax rates expected to apply when the asset is realised or the liability is settled.

146 _
Deferred tax relates to the following:
€ millions1 2011 2010
Origination or reversal of temporary differences -174.9 -119.9
Utilisation/expiry or origination of unused tax losses -91.0 5.8
Deferred tax (–income/+expense) -265.9 -114.1
1 Prior-year figures restated.
In 2011, deferred tax income increased by € 1.1 million by recognising previously unused tax losses (prior year: € 0.0 million).
The reconciliation from the theoretical income tax expense to the current income tax expense is presented below:
€ millions1 2011 % 2010 %
Earnings before tax -782.2 1,511.3
Applicable tax rate 29.0 29.0
Theoretical income tax expense (-income/+expense) -226.8 438.3
Tax effects
Differences in foreign tax rates and tax rate differences -38.8 5.0 -30.9 -2.0
Tax-free income -51.6 6.6 -49.9 -3.3
Non-deductible expenses 55.2 -7.1 55.5 3.7
Amortisation of goodwill from capital and equity consolidation 0.0 0.0 10.2 0.7
Addbacks and reductions for trade tax purposes 19.2 -2.5 22.3 1.5
Measurement of associates using the equity method 200.5 -25.6 -27.0 -1.8
Change in deferred tax assets relating to unused tax losses -0.6 0.1 2.3 0.2
Zero-rated disposals of investments -1.9 0.2 -117.5 -7.8
Taxes relating to other periods 70.7 -9.0 62.6 4.1
Other 7.8 -1.0 -6.3 -0.5
Current income tax (-income/+expense) 33.7 359.6
Effective tax rate -4.3 23.8
1 Prior-year figures restated.
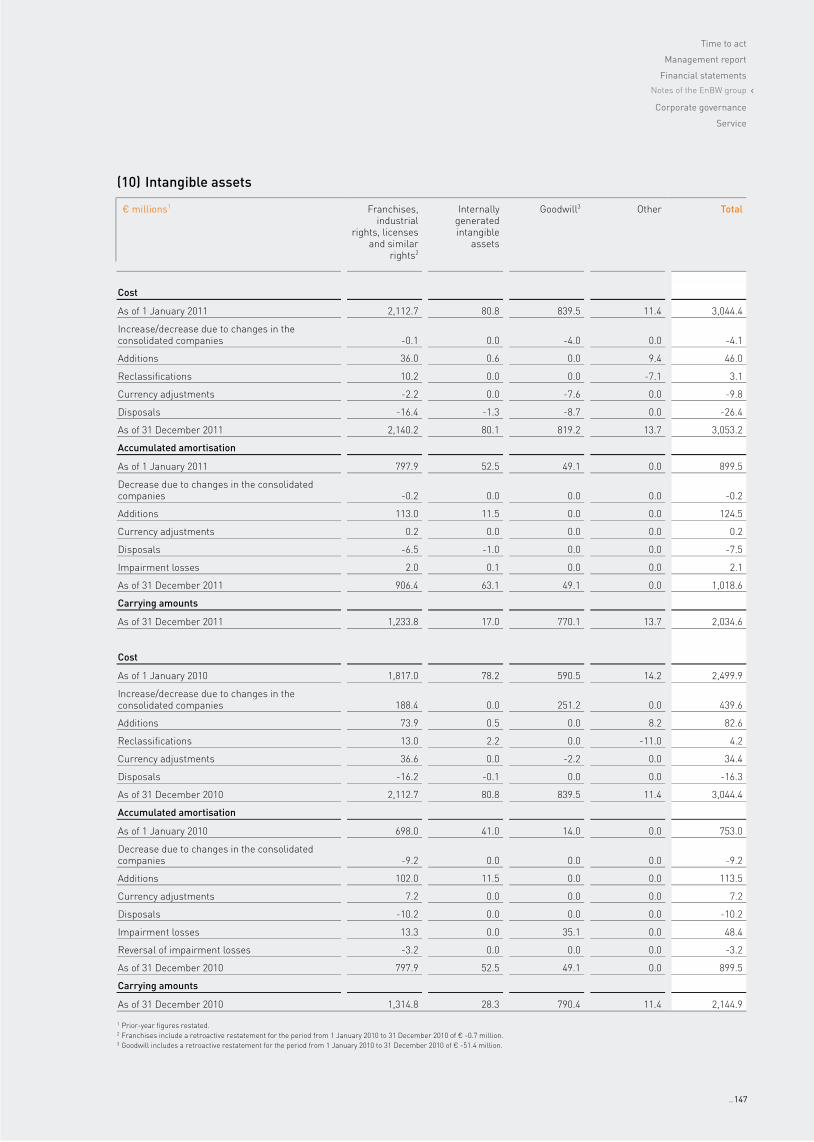
Time to act
Management report
Financial statements
Notes of the EnBW group ‹
Corporate governance
Service
_ 147
(10) Intangible assets
1 Prior-year figures restated. 2 Franchises include a retroactive restatement for the period from 1 January 2010 to 31 December 2010 of € -0.7 million. 3 Goodwill includes a retroactive restatement for the period from 1 January 2010 to 31 December 2010 of € -51.4 million.
€ millions1 Franchises,
industrial rights, licenses
and similar rights2
Internally generated intangible
assets
Goodwill3 Other Total
Cost
As of 1 January 2011 2,112.7 80.8 839.5 11.4 3,044.4
Increase/decrease due to changes in the consolidated companies -0.1 0.0 -4.0 0.0 -4.1
Additions 36.0 0.6 0.0 9.4 46.0
Reclassifications 10.2 0.0 0.0 -7.1 3.1
Currency adjustments -2.2 0.0 -7.6 0.0 -9.8
Disposals -16.4 -1.3 -8.7 0.0 -26.4
As of 31 December 2011 2,140.2 80.1 819.2 13.7 3,053.2
Accumulated amortisation
As of 1 January 2011 797.9 52.5 49.1 0.0 899.5
Decrease due to changes in the consolidated companies -0.2 0.0 0.0 0.0 -0.2
Additions 113.0 11.5 0.0 0.0 124.5
Currency adjustments 0.2 0.0 0.0 0.0 0.2
Disposals -6.5 -1.0 0.0 0.0 -7.5
Impairment losses 2.0 0.1 0.0 0.0 2.1
As of 31 December 2011 906.4 63.1 49.1 0.0 1,018.6
Carrying amounts
As of 31 December 2011 1,233.8 17.0 770.1 13.7 2,034.6
Cost
As of 1 January 2010 1,817.0 78.2 590.5 14.2 2,499.9
Increase/decrease due to changes in the consolidated companies 188.4 0.0 251.2 0.0 439.6
Additions 73.9 0.5 0.0 8.2 82.6
Reclassifications 13.0 2.2 0.0 -11.0 4.2
Currency adjustments 36.6 0.0 -2.2 0.0 34.4
Disposals -16.2 -0.1 0.0 0.0 -16.3
As of 31 December 2010 2,112.7 80.8 839.5 11.4 3,044.4
Accumulated amortisation
As of 1 January 2010 698.0 41.0 14.0 0.0 753.0
Decrease due to changes in the consolidated companies -9.2 0.0 0.0 0.0 -9.2
Additions 102.0 11.5 0.0 0.0 113.5
Currency adjustments 7.2 0.0 0.0 0.0 7.2
Disposals -10.2 0.0 0.0 0.0 -10.2
Impairment losses 13.3 0.0 35.1 0.0 48.4
Reversal of impairment losses -3.2 0.0 0.0 0.0 -3.2
As of 31 December 2010 797.9 52.5 49.1 0.0 899.5
Carrying amounts
As of 31 December 2010 1,314.8 28.3 790.4 11.4 2,144.9

148 _
Finance leases account for € 122.1 million (prior year: € 156.3 million) of the carrying amount of intangible assets. They mainly refer to an electricity procurement right of € 120.9 million (prior year: € 153.1 million). The contract expires in 2015. The carrying amount of intangible assets also includes operating licences for power stations of € 676.1 million (prior year: € 699.1 million) and customer relationships of € 237.3 million (prior year restated: € 263.9 million). The remaining terms of power station concessions is between 15 and 60 years.
In 2011, a total of € 37.0 million (prior year: € 33.8 million) was spent on research and development. The criteria for their recognition required under IFRSs were not satisfied.
Goodwill was allocated to the cash-generating units or groups of cash-generating units for impairment test purposes. No impairment losses were recognised on goodwill in 2011 (prior year: € 35.1 million).
Goodwill totalled € 770.1 million as of 31 December 2011 (prior year restated: € 790.4 million). Of this figure, 85.0% (prior year restated: 83.7%) is attributable to the cash-generating units or groups of cash-generating units presented in the table below:
Cash generating unit/
group of cash-generating units
After-taxdiscount rates (%)
Goodwill in € millions
2011 2010 2011 2010
PRE subgroup1 6.3–7.9 7.1 258.4 265.8
Electricity sales and distribution 4.6–6.6 4.9–6.8 133.0 133.0
Stadtwerke Düsseldorf AG subgroup 4.6–6.6 4.9–6.3 127.4 127.4
Energiedienst Holding AG subgroup 4.6–6.6 4.9–6.8 135.6 135.6
1 Prior-year figures restated.
The goodwill that is allocated to the other cash-generating units or groups of cash-generating units accounted for less than 10% of total goodwill. It amounted to a total of € 115.7 million (prior year: € 128.6 million).
The recoverable amount of the cash-generating unit is generally determined on the basis of fair value less costs to sell. Using a business valuation model, fair value is derived from the cash flow planning, based on the mid-term planning approved by the Board of Management for a period of three years and valid as of the date of the impairment test. The planning is based on past experience and on estimates concerning the future market development.
Key assumptions underlying the determination of fair value less costs to sell include projections of future electricity and gas prices, materials prices, company-specific investing activities, the regulatory framework as well as growth and discount rates.
The discount rates applied to the cash flows are determined on the basis of market data and range from 4.6% to 7.9% after tax and 6.5% to 9.7% before tax (prior year: 4.9% to 7.1% after tax and 7.0% to 8.9% before tax).
Constant growth rates of 0% and 1.5% (prior year: 1.0% and 1.5%) are used to extrapolate the cash flows beyond the detailed planning period, taking into account expected price and volume-related growth.

Time to act
Management report
Financial statements
Notes of the EnBW group ‹
Corporate governance
Service
_ 149
Goodwill by segment developed as follows:
€ millions1 Electricity
generation and trading
Electricity grid and sales
Gas Energy and environmental
services
Total
Carrying amounts as of 1 January 2011 139.0 530.6 75.2 45.6 790.4
Increase/decrease due to changes in the consolidated companies 0.0 0.0 0.0 -4.0 -4.0
Other changes 0.0 -16.3 0.0 0.0 -16.3
Carrying amounts as of 31 December 2011 139.0 514.3 75.2 41.6 770.1
Carrying amounts as of 1 January 2010 172.5 283.2 75.2 45.6 576.5
Increase/decrease due to changes in the consolidated companies 0.0 251.2 0.0 0.0 251.2
Other changes -33.5 -3.8 0.0 0.0 -37.3
Carrying amounts as of 31 December 2010 139.0 530.6 75.2 45.6 790.4
1 Prior-year figures restated.

150 _
(11) Property, plant and equipment € millions1 Land and
buildingsPower
plants2Distribution
plants3Other
equipmentAssets under
construction
Total
Cost As of 1 January 2011 3,806.4 13,831.3 14,592.3 1,523.1 1,695.0 35,448.1Increase/decrease due to changes in the consolidated companies 1.8 36.7 2.3 -0.2 7.1 47.7Additions 47.1 181.6 343.8 78.3 538.8 1,189.6Reclassifications 41.8 257.3 97.6 26.5 -414.0 9.2Reclassification to assets held for sale -1.0 0.0 -116.9 0.0 -2.7 -120.6Currency adjustments -3.0 6.9 -34.5 0.4 0.6 -29.6Disposals -8.7 -53.5 -260.0 -117.1 -47.9 -487.2As of 31 December 2011 3,884.4 14,260.3 14,624.6 1,511.0 1,776.9 36,057.2Accumulated depreciation As of 1 January 2011 1,489.6 10,393.3 8,586.6 994.2 48.7 21,512.4Decrease due to changes in the consolidated companies 0.0 0.0 0.0 -0.4 0.0 -0.4Additions 75.5 227.2 331.6 97.9 0.0 732.2Reclassifications 41.4 -41.2 0.1 3.4 0.0 3.7Reclassification to assets held for sale -0.1 0.0 -88.8 0.0 0.0 -88.9Currency adjustments -1.3 3.7 -13.2 0.2 0.0 -10.6Disposals -3.4 -39.0 -221.8 -113.5 -46.5 -424.2Impairment losses 11.3 130.3 128.3 4.5 0.0 274.4Reversal of impairment losses 0.0 0.0 -1.0 0.0 0.0 -1.0As of 31 December 2011 1,613.0 10,674.3 8,721.8 986.3 2.2 21,997.6Carrying amounts As of 31 December 2011 2,271.4 3,586.0 5,902.8 524.7 1,774.7 14,059.6 Cost As of 1 January 2010 3,602.4 12,488.1 13,822.1 1,484.3 1,361.3 32,758.2Changes in accounting policy 0.0 202.6 0.0 0.0 0.0 202.6As of 1 January 20104 3,602.4 12,690.7 13,822.1 1,484.3 1,361.3 32,960.8Increase/decrease due to changes in the consolidated companies 68.5 307.3 448.9 0.9 42.4 868.0Additions 57.6 943.5 336.3 74.9 859.4 2,271.7Reclassifications 106.6 235.5 157.5 -12.2 -570.7 -83.3Reclassification to assets held for sale -0.1 0.0 -32.5 0.0 0.0 -32.6Currency adjustments 2.4 28.0 17.1 3.5 5.3 56.3Disposals -31.0 -373.7 -157.1 -28.3 -2.7 -592.8As of 31 December 2010 3,806.4 13,831.3 14,592.3 1,523.1 1,695.0 35,448.1Accumulated depreciation As of 1 January 2010 1,364.7 9,998.9 8,498.1 934.9 36.4 20,833.0Decrease due to changes in the consolidated companies -11.3 0.0 -107.0 -0.1 0.0 -118.4Additions 81.1 334.4 309.2 97.0 0.0 821.7Reclassifications 39.7 -74.5 11.0 -19.1 0.0 -42.9Reclassification to assets held for sale 0.0 0.0 -22.0 0.0 0.0 -22.0Currency adjustments 0.6 17.2 7.3 2.5 0.0 27.6Disposals -23.0 -23.9 -115.2 -25.2 0.0 -187.3Impairment losses 37.8 141.3 5.6 4.2 12.3 201.2Reversal of impairment losses 0.0 -0.1 -0.4 0.0 0.0 -0.5As of 31 December 2010 1,489.6 10,393.3 8,586.6 994.2 48.7 21,512.4Carrying amounts As of 31 December 2010 2,316.8 3,438.0 6,005.7 528.9 1,646.3 13,935.7
1 Prior-year figures restated. 2 Power plants include a retroactive restatement for the period from 1 January 2010 to 31 December 2010 of € 298.1 million. 3 Distribution plants include a retroactive restatement for the period from 1 January 2010 to 31 December 2010 of € 91.7 million. 4 The carrying amount of power plants was € 2,691.8 million as of 1 January 2010.

Time to act
Management report
Financial statements
Notes of the EnBW group ‹
Corporate governance
Service
_ 151
Items of property, plant and equipment are encumbered by property liens totalling € 64.7 million (prior year: € 66.9 million).
Land and buildings also include land rights and buildings on third-party land. Other plant and equipment includes waste disposal facilities, other technical facilities as well as furniture and fixtures.
Finance leases account for € 75.7 million (prior year: € 75.7 million) of the carrying amount of property, plant and equipment. They principally refer to two natural gas caverns whose contractual term covers most of their useful life.
The carrying amounts of the finance leases recognised as non-current assets are summarised below:
€ millions 31/12/2011 31/12/2010
Franchises, industrial rights and similar rights and assets 122.1 156.3
Technical equipment and machines 75.7 75.7
Total 197.8 232.0
Group capital expenditures on intangible assets and property, plant and equipment of € 1,171.6 million (prior year: € 1,624.8 million) are derived as follows from the statement of changes in non-current assets:
€ millions1 2011 2010
Additions to intangible assets and property, plant and equipment according to the statement of changes in non-current assets 1,235.6 2,354.3
Additions to assets recognised under finance leases 0.0 -114.6
Additions to the provision recognised for the decommissioning and dismantling of property, plant and equipment -64.0 -620.0
Additions to intangible assets and property, plant and equipment of assets held for sale 0.0 5.1
Capital expenditures on intangible assets and property, plant and equipment 1,171.6 1,624.8
1 Prior-year figures restated.

152 _
(12) Investment property € millions
Cost
As of 1 January 2011 169.7
Reclassifications -13.2
Disposals -6.1
As of 31 December 2011 150.4
Accumulated depreciation
As of 1 January 2011 70.7
Additions 2.1
Reclassifications -3.7
Disposals -2.4
Impairment losses 6.4
As of 31 December 2011 73.1
Carrying amount
As of 31 December 2011 77.3
Cost
As of 1 January 2010 123.4
Additions 0.7
Reclassifications 48.4
Reclassification to assets held for sale -1.1
Disposals -1.7
As of 31 December 2010 169.7
Accumulated depreciation
As of 1 January 2010 53.1
Additions 2.0
Reclassifications 12.2
Disposals -0.9
Impairment losses 8.0
Reversal of impairment losses -3.7
As of 31 December 2010 70.7
Carrying amount
As of 31 December 2010 99.0
As of the reporting date, the market value of the real estate that is classified as investment property was € 100.9 million (prior year: € 126.8 million). The market value was determined either using the discounted cash flow method or from current market prices. As in the prior year, almost all of the investment property was valued by external valuers. Rent income totalled € 7.6 million (prior year: € 12.5 million). The directly allocable operating expenses amounted to € 1.1 million (prior year: € 3.2 million). Operating expenses that were not offset by rent income totalled € 0.7 million (prior year: € 0.6 million).
As in the prior year, there are no obligations to purchase investment property.
Gains on sale of € 4.3 million were generated in the fiscal year 2011 from the sale of investment property (prior year: € 0.4 million).

Time to act
Management report
Financial statements
Notes of the EnBW group ‹
Corporate governance
Service
_ 153
The EnBW group’s receivables from non-cancellable operating leases of € 87.7 million (prior year: € 87.5 million) mainly stem from the rental of business and residential properties. As in the prior year, no contingent rent was recognised in the reporting period.
The minimum lease payments receivable are as follows:
€ millions 2011 2010
Due within 1 year 19.9 19.9
Due in 1 to 5 years 30.6 29.5
Due in more than 5 years 37.2 38.1
Total 87.7 87.5
(13) Entities accounted for using the equity method € millions
Cost
As of 1 January 2011 3,854.5
Increase/decrease due to changes in the consolidated companies 36.8
Increase/decrease due to profits/losses -64.1
Increase/decrease due to amounts recognised directly in equity -6.7
Reclassification to assets held for sale -131.4
Currency adjustments -45.8
Decrease due to dividend distributions -100.6
Other additions/disposals -5.3
As of 31 December 2011 3,537.4
Accumulated impairment
As of 1 January 2011 102.0
Impairment losses 630.2
As of 31 December 2011 732.2
Carrying amount
As of 31 December 2011 2,805.2
Cost
As of 1 January 2010 3,858.7
Increase/decrease due to changes in the consolidated companies 49.9
Increase/decrease due to profits/losses 93.0
Increase/decrease due to amounts recognised directly in equity -17.1
Currency adjustments 7.3
Decrease due to dividend distributions -99.1
Other additions/disposals -38.2
As of 31 December 2010 3,854.5
Accumulated impairment
As of 1 January 2010 102.0
Decrease due to changes in the consolidated companies 0.0
As of 31 December 2010 102.0
Carrying amount
As of 31 December 2010 3,752.5

154 _
The table below shows the key items of the income statements and balance sheets of the entities accounted for using the equity method:
Profit/loss of the entities accounted for using the equity method in € millions 2011 2010
Revenue 14,532.1 14,553.7
Profit for the year 165.4 441.7
Adjustment to EnBW's interest and equity measurement -859.7 -348.7
Net loss/profit from entities accounted for using the equity method -694.3 93.0
Balance sheet figures of the entities accounted for using the equity method
in € millions
31/12/2011 31/12/2010
Assets 21,075.2 21,873.2
Liabilities 13,689.5 13,650.3
Equity 7,385.7 8,222.8
Adjustment to EnBW's interest and equity measurement -4,580.5 -4,470.3
Carrying amount of entities accounted for using the equity method 2,805.2 3,752.5
The EnBW group’s share of the contingent liabilities and other financial obligations of entities accounted for using the equity method came to € 882.0 million as of 31 December 2011 (prior year: € 814.3 million).
The market value of those investments for which there are published price quotations amounts to € 776.6 million (prior year: € 965.2 million). The carrying amount of these investments is € 824.1 million (prior year: € 1,127.9 million). Because of their higher value in use, there is no need to recognise an additional impairment loss.
The following entities accounted for using the equity method have a different reporting date and are consolidated with the figures from their financial statements as of 30 September 2011:
› Elektrizitätswerk Rheinau AG, Rheinau/Switzerland › EVN AG, Maria Enzersdorf/Austria

Time to act
Management report
Financial statements
Notes of the EnBW group ‹
Corporate governance
Service
_ 155
(14) Other financial assets € millions Shares in
affiliated entities
Other investments1
Long-term investments2
Loans Total
Cost
As of 1 January 2011 84.0 659.8 5,421.8 99.3 6,264.9
Increase/decrease due to changes in the consolidated companies 0.0 -20.4 0.0 0.0 -20.4
Additions 21.6 97.6 3,201.9 10.4 3,331.5
Reclassifications 0.2 -0.2 -453.6 1.3 -452.3
Reclassification to assets held for sale 0.0 0.0 -54.1 0.0 -54.1
Currency adjustments 0.0 0.8 0.0 0.6 1.4
Disposals -1.8 -24.4 -3,265.2 -14.4 -3,305.8
As of 31 December 2011 104.0 713.2 4,850.8 97.2 5,765.2
Accumulated impairment
As of 1 January 2011 31.0 120.2 161.6 1.5 314.3
Impairment losses 0.4 8.4 71.2 6.1 86.1
Reclassification to assets held for sale 0.0 0.0 -17.8 0.0 -17.8
Disposals 0.0 0.0 -60.2 0.0 -60.2
As of 31 December 2011 31.4 128.6 154.8 7.6 322.4
Carrying amounts
As of 31 December 2011 72.6 584.6 4,696.0 89.6 5,442.8
Cost
As of 1 January 2010 85.3 933.1 4,825.3 121.6 5,965.3
Increase/decrease due to changes in the consolidated companies 0.0 -62.3 0.8 0.5 -61.0
Additions 0.4 101.6 3,268.4 9.9 3,380.3
Reclassifications 7.1 -313.3 -8.5 -7.0 -321.7
Currency adjustments 0.0 4.6 0.0 4.0 8.6
Disposals -8.8 -3.9 -2,664.2 -29.7 -2,706.6
As of 31 December 2010 84.0 659.8 5,421.8 99.3 6,264.9
Accumulated impairment
As of 1 January 2010 26.8 131.4 114.9 0.8 273.9
Decrease due to changes in the consolidated companies 0.0 -20.8 0.0 0.0 -20.8
Impairment losses 1.9 12.4 65.1 0.7 80.1
Reclassifications 2.9 -2.9 0.0 0.0 0.0
Currency adjustments 0.0 0.1 0.0 0.0 0.1
Disposals -0.6 0.0 -18.4 0.0 -19.0
As of 31 December 2010 31.0 120.2 161.6 1.5 314.3
Carrying amounts
As of 31 December 2010 53.0 539.6 5,260.2 97.8 5,950.6
1 Of the carrying amounts of cost, € 222.9 million (prior year: € 178.7 million) relates to investments held as financial assets. 2 Of the additions under cost, € 99.0 million (prior year: € 304.8 million) stems from market valuation, of the disposals under cost € 448.1 million (prior year: € 138.1 million).

156 _
The investments in affiliated entities disclosed in the financial assets are entities that are not included in the consolidated financial statements due to immateriality.
The non-current securities are mainly fixed-interest securities as well as listed shares. To a large extent, the non-current securities are held in special funds. For consolidation purposes, the individual securities in the special funds are shown separately in the consolidated balance sheet by type of investment.
Loans comprise loans to affiliated entities of € 0.4 million (prior year: € 0.5 million), loans to other investees and investors of € 24.1 million (prior year: € 20.8 million) and other loans of € 65.1 million (prior year: € 76.5 million).
Impairment losses of financial assets are recorded on a separate allowance account and presented in the statement of changes in non-current assets.
(15) Trade receivables € millions 31/12/2011 31/12/2010
Current Non-current Total Current Non-current Total
Trade receivables 3,077.0 535.5 3,612.5 3,213.8 479.2 3,693.0
of which receivables from affiliated entities (34.4) (10.0) (44.4) (26.3) (10.0) (36.3)
of which receivables from other investees and investors (35.9) (0.0) (35.9) (21.9) (0.2) (22.1)
of which receivables from entities accounted for using the equity method (32.1) (0.0) (32.1) (26.7) (0.0) (26.7)
Non-current trade receivables principally include receivables relating to electricity supplies, whose term to maturity does not match the customary business cycle.
The movements in the provision for impairment of trade receivables break down as follows:
€ millions 2011 2010
As of 1 January 35.5 36.8
Utilisation -25.1 -36.8
Net additions 58.7 35.5
As of 31 December 69.1 35.5

Time to act
Management report
Financial statements
Notes of the EnBW group ‹
Corporate governance
Service
_ 157
The credit risks inherent in trade receivables are presented below:
€ millions 31/12/2011 31/12/2010
Not past due and not impaired 3,461.7 3,588.7
Past due, but not impaired
Due within 3 months 63.4 47.1
Due in between 3 and 6 months 13.1 3.0
Due in between 6 months and 1 year 8.3 3.2
Due in more than 1 year 1.1 6.3
Impaired 64.9 44.7
Total 3,612.5 3,693.0
There was no indication as of the reporting date that any impairment losses needed to be recognised on the trade receivables recorded as not impaired.
(16) Income tax refund claims Current and non-current income tax refund claims include deductible tax on investment income from prior years and the current year. Also included is the corporate income tax credit arising from transition to the half-income method pursuant to the German Tax Reduction Act (StSenkG) of 23 October 2000, on the basis of the revised act on tax measures accompanying the introduction of the European company and the amendment of other tax law provisions (SEStEG) from 7 December 2006. EnBW AG’s and Neckarwerke Stuttgart GmbH’s assignment and sale of corporate income tax credit caused current income tax refund claims to fall by € 189.6 million on the prior year.
(17) Other assets € millions 31/12/2011 31/12/2010
Current Non-current Total Current Non-current Total
Other tax refund claims 62.7 4.8 67.5 75.2 2.6 77.8
Derivatives 1,447.8 163.8 1,611.6 1,194.5 122.8 1,317.3
of which without hedges (1,297.3) (9.5) (1,306.8) (931.1) (12.1) (943.2)
of which cash flow hedge (129.3) (49.8) (179.1) (238.8) (55.8) (294.6)
of which fair value hedge (21.2) (104.5) (125.7) (24.6) (54.9) (79.5)
Finance lease receivables 4.8 36.3 41.1 7.0 31.0 38.0
Payments on account 129.2 58.2 187.4 70.4 65.0 135.4
Prepaid expenses 17.6 32.5 50.1 15.4 46.1 61.5
Sundry assets 623.8 29.5 653.3 273.0 23.4 296.4
Total 2,285.9 325.1 2,611.0 1,635.5 290.9 1,926.4
The finance lease receivables arose from supply contracts for various forms of energy such as electricity, heat, cooling and compressed air under which the economic ownership of the leased technical equipment and machinery is allocable to the lessee. The leases contain escalation clauses as well as renewal and purchase price options.

158 _
The agreements are based on the following parameters and terms to maturity:
€ millions 31/12/2011 31/12/2010
Total lease instalments 53.0 46.7
Interest portion of outstanding lease instalments 11.9 8.7
Present value of outstanding lease instalments 41.1 38.0
The outstanding lease instalments are due as follows:
€ millions Nominal value Present value
31/12/2011 31/12/2010 31/12/2011 31/12/2010
Due within 1 year 7.1 9.1 5.6 7.9
Due in 1 to 5 years 26.5 24.9 20.5 20.3
Due in more than 5 years 19.4 12.7 15.0 9.8
Total 53.0 46.7 41.1 38.0
As in the prior year, no impairment losses or reversals of impairment losses had to be recognised on outstanding finance lease receivables.
Payments on account contain prepayments for electricity procurement agreements of € 72.7 million (prior year: € 79.0 million). Of the total amount of prepaid expenses, € 18.8 million (prior year: € 23.5 million) relates to deferred lease instalments.
Sundry assets contain security deposits for over-the-counter transactions of € 45.1 million (prior year: € 16.8 million) and variation margins of € 340.7 million (prior year: € 33.0 million).
Bad debt allowances on other assets measured at amortised cost developed as follows:
€ millions 2011 2010
As of 1 January 34.5 33.3
Utilisation -1.8 -1.0
Net additions 1.4 2.2
As of 31 December 34.1 34.5
The credit risks of financial instruments disclosed under other assets break down as follows:
€ millions 31/12/2011 31/12/2010
Not past due and not impaired 2,293.5 1,630.9
Past due, but not impaired
Due within 3 months 0.2 0.2
Due in between 3 and 6 months 0.0 0.1
Due in between 6 months and 1 year 0.1 0.1
Due in more than 1 year 0.2 0.2
Impaired 6.8 3.4
Total 2,300.8 1,634.9

Time to act
Management report
Financial statements
Notes of the EnBW group ‹
Corporate governance
Service
_ 159
There was no indication as of the reporting date that any impairment losses needed to be recognised on the other assets recorded as not impaired.
(18) Inventories € millions 31/12/2011 31/12/2010
Materials and supplies 441.1 566.8
Nuclear fuel rods (incl. payments on account) 287.0 327.9
Work in progress 87.2 49.8
Finished goods and merchandise 141.4 44.8
Payments on account 1.4 1.8
Total 958.1 991.1
No inventories have been assigned as collateral. There are no significant long-term construction contracts which would require accounting for as long-term construction contracts.
In the reporting year, write-downs of € 100.4 million (prior year: € 11.3 million) were recorded on inventories. Write-downs for the reporting year relate to impairment losses recognised on nuclear fuel rods and special tools.
Of inventories, € 143.0 million (prior year: € 22.7 million) was recognised at fair value.
For the fiscal year 2011, EnBW received emission allowances for 14.9 million t (prior year: 13.4 million t) free of charge from the government.
(19) Financial assets Current financial assets mainly consist of fixed-interest securities. Other current financial assets principally relate to borrowings in the current fiscal year and in the prior year mostly to loans issued. Due to the measurement at market value, reversals of impairment losses came to € 4.0 million in the fiscal year (prior year: € 0.5 million) and impairment losses to € 2.5 million (prior year: € 1.5 million).
In the reporting year, no impairment losses were recognised on other financial assets (prior year: 0.5 million). As in the prior year, no impairment losses attributable to securities in the available-for-sale category were recorded in the fiscal year.
€ millions 31/12/2011 31/12/2010
Profit participation rights, funds and shares 987.2 839.8
Other current financial assets 23.8 116.0
Total 1,011.0 955.8
Current financial assets totalling € 207.1 million (prior year: € 124.8 million) were provided as collateral. The collateral was mainly provided for stock exchange transactions fluctuating according to the development of the trading volume. Market interest rates applied to the collateral provided. This collateral will be used by the stock exchanges in the event of non-performance of the obligations entered into in the transactions.
160 _
(20) Cash and cash equivalents Cash and cash equivalents relate primarily to bank balances, largely in the form of time and call deposits.
Of the cash and cash equivalents, an amount of € 44.7 million (prior year: € 49.1 million) is attributable to proportionately consolidated entities.
Cash was not subject to any significant restrictions on disposal.
(21) Equity The development of equity and total comprehensive income for the year is presented separately in the statement of changes in equity. The components of total comprehensive income are presented on an aggregated basis in the statement of comprehensive income.
Capital stock The capital stock of EnBW AG amounts to € 640,015,872.00 (prior year: € 640,015,872.00) and is divided into 250,006,200 (prior year: 250,006,200) no-par value bearer shares, all of which have been fully paid in. The no-par value shares each represent an imputed share of € 2.56 per share of the subscribed capital (prior year: € 2.56 per share).
NECKARPRI-Beteiligungsgesellschaft mbH and OEW Energie-Beteiligungs GmbH each directly hold 46.55% of the capital stock of EnBW AG as of 31 December 2011 (prior year: E.D.F. INTERNATIONAL SA and OEW Energie-Beteiligungs GmbH 45.01% each).
Capital reserve The capital reserve contains the amounts received from the issue of shares of EnBW AG which exceed the imputed value of the shares.
Revenue reserves The revenue reserves primarily contain the pro rata revenue reserves of the parent company and the other companies included in the consolidation after the date of acquisition accounting. They include retroactive restatements as of 31 December 2010 of € -39.1 million (as of 1 January 2010: € -25.8 million). The restatements are chiefly due to fully recognising the provision for the obligation to dispose of fuel rods regardless of volume.
Retained earnings of EnBW AG Taking account of the profit carryforward of € 299.5 million (prior year: € 106.6 million), retained earnings come to € 230.7 million (prior year: € 673.2 million). In the prior year, this figure included a transfer to the other revenue reserves of € 350.0 million. We will propose to the annual general meeting that a dividend of € 0.85 (prior year: € 1.53) per share be distributed from the retained earnings of EnBW AG. As of 31 December 2011, a total of 244,256,523 shares were entitled to dividends (prior year: 244,256,523 shares). If the annual general meeting approves this proposal, the amount distributed by EnBW AG for fiscal 2011 will total € 207.6 million (prior year: € 373.7 million).
The retained earnings of EnBW AG are disclosed under revenue reserves.
Treasury shares As of 31 December 2011, EnBW AG holds 5,749,677 treasury shares (prior year: 5,749,677 treasury shares). The cost of acquiring the treasury shares of € 204.1 million was deducted from the carrying amount of equity. The attributable amount of share capital amounts to € 14,719,173.12 (2.3% of subscribed capital).
The company has no rights or dividend entitlements from the directly or indirectly held treasury shares. In accordance with the rulings of IFRSs, the treasury shares are not recognised as securities but offset in one sum against equity in the balance sheet.

Time to act
Management report
Financial statements
Notes of the EnBW group ‹
Corporate governance
Service
_ 161
Other comprehensive income Other comprehensive income comprises changes in the market value of available-for-sale financial assets, changes in the market value of cash flow hedges, amounts recognised directly in equity for accounting for entities using the equity method as well as exchange differences from the translation of financial statements of foreign entities.
For details on the changes recognised directly in equity on available-for-sale financial assets and of cash flow hedges, we refer to note (27) “Accounting for financial instruments”.
Presentation of the components of other comprehensive income:
2011
€ millions
Differencefrom
currencytrans-lation
Cash flow
hedge
Available-for-sale financial
assets
Entities accounted
for using the
equitymethod
Equity holders
of EnBW AG
Non-controlling
interests
Total
Unrealised changes in market value in the current period -67.1 -115.6 -349.3 -6.7 -538.7 -25.6 -564.3
Reclassification adjustments included in the income statement -3.0 65.8 26.1 0.0 88.9 0.1 89.0
Reclassification to cost of hedged items -49.3 -49.3 0.0 -49.3
Other comprehensive income before tax -70.1 -99.1 -323.2 -6.7 -499.1 -25.5 -524.6
Income tax 1.3 40.0 5.5 0.0 46.8 3.5 50.3
Other comprehensive income -68.8 -59.1 -317.7 -6.7 -452.3 -22.0 -474.3
2010
€ millions1
Differencefrom
currencytrans-lation
Cash flow
hedge
Available-for-sale financial
assets
Entities accounted
for using the
equitymethod
Equity holders
of EnBW AG
Non-controlling
interests
Total
Unrealised changes in market value in the current period -14.5 344.1 166.6 -64.3 431.9 6.5 438.4
Reclassification adjustments included in the income statement -38.5 -22.2 15.4 47.2 1.9 -4.0 -2.1
Reclassification to cost of hedged items 45.8 45.8 0.0 45.8
Other comprehensive income before tax -53.0 367.7 182.0 -17.1 479.6 2.5 482.1
Income tax 7.7 -134.6 6.9 0.0 -120.0 0.7 -119.3
Other comprehensive income -45.3 233.1 188.9 -17.1 359.6 3.2 362.8
1 Prior-year figures restated.

162 _
Presentation of the tax effect relating to unrealised gains and losses in equity:
€ millions1 2011 2010
Before tax Tax expense/
income
After tax Before tax Tax expense/
income
After tax
Difference from currency translation -80.3 1.3 -79.0 -9.7 7.7 -2.0
Cash flow hedge -128.0 53.9 -74.1 344.2 -117.1 227.1
Available-for-sale financial assets -349.3 1.0 -348.3 168.2 -5.6 162.6
Entities accounted for using the equity method -6.7 0.0 -6.7 -64.3 0.0 -64.3
Other comprehensive income -564.3 56.2 -508.1 438.4 -115.0 323.4
1 Prior-year figures restated.
Presentation of reclassification adjustments included in the income statement and the cost of hedged items:
€ millions 2011 2010
Before tax Tax expense/
income
After tax Before tax Tax expense/
income
After tax
Difference from currency translation -2.8 0.0 -2.8 -37.0 0.0 -37.0
Cash flow hedge 16.5 -11.0 5.5 23.6 -17.4 6.2
Available-for-sale financial assets 26.0 5.1 31.1 9.9 13.1 23.0
Entities accounted for using the equity method 0.0 0.0 0.0 47.2 0.0 47.2
Other comprehensive income 39.7 -5.9 33.8 43.7 -4.3 39.4
Non-controlling interests Non-controlling interests relate to shares in group entities held by third parties. They relate in particular to the Energiedienst group, Stadtwerke Düsseldorf AG, GVS Netz GmbH and Pražská energetika a.s.
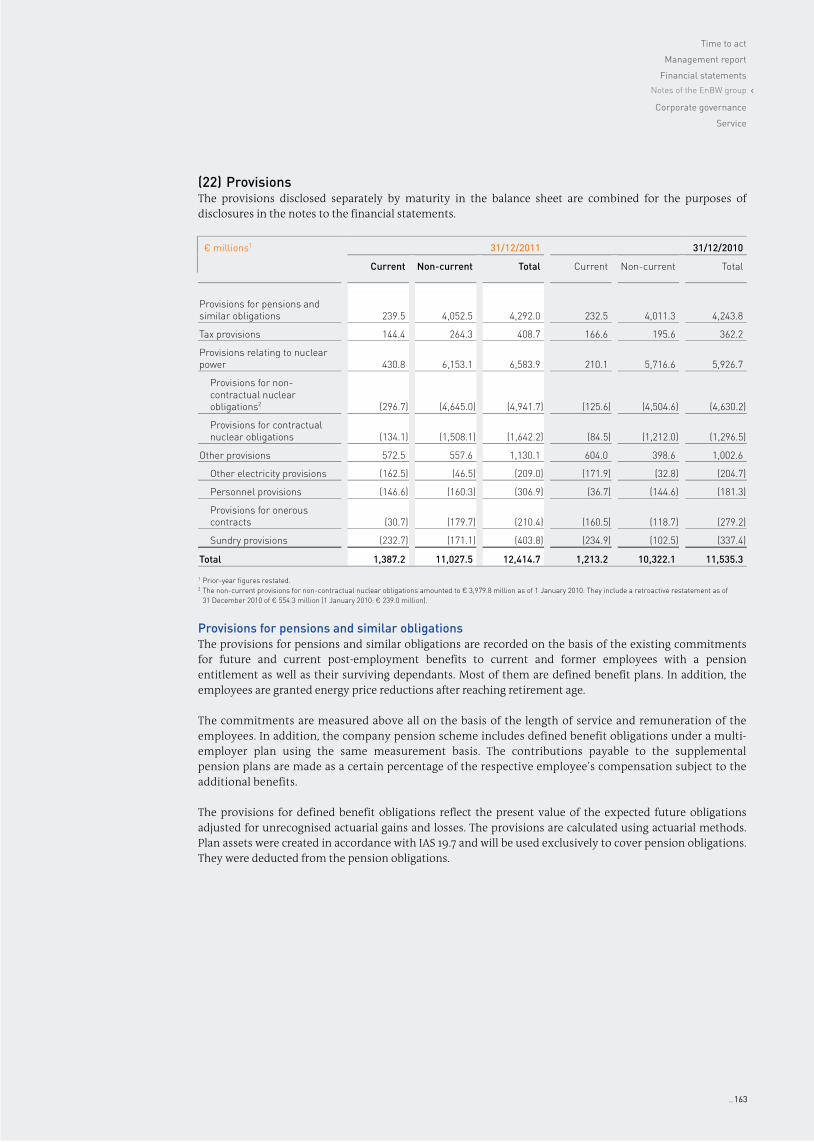
Time to act
Management report
Financial statements
Notes of the EnBW group ‹
Corporate governance
Service
_ 163
(22) Provisions The provisions disclosed separately by maturity in the balance sheet are combined for the purposes of disclosures in the notes to the financial statements.
€ millions1 31/12/2011 31/12/2010
Current Non-current Total Current Non-current Total
Provisions for pensions and similar obligations 239.5 4,052.5 4,292.0 232.5 4,011.3 4,243.8
Tax provisions 144.4 264.3 408.7 166.6 195.6 362.2
Provisions relating to nuclear power 430.8 6,153.1 6,583.9 210.1 5,716.6 5,926.7
Provisions for non-contractual nuclear obligations2 (296.7) (4,645.0) (4,941.7) (125.6) (4,504.6) (4,630.2)
Provisions for contractual nuclear obligations (134.1) (1,508.1) (1,642.2) (84.5) (1,212.0) (1,296.5)
Other provisions 572.5 557.6 1,130.1 604.0 398.6 1,002.6
Other electricity provisions (162.5) (46.5) (209.0) (171.9) (32.8) (204.7)
Personnel provisions (146.6) (160.3) (306.9) (36.7) (144.6) (181.3)
Provisions for onerous contracts (30.7) (179.7) (210.4) (160.5) (118.7) (279.2)
Sundry provisions (232.7) (171.1) (403.8) (234.9) (102.5) (337.4)
Total 1,387.2 11,027.5 12,414.7 1,213.2 10,322.1 11,535.3
1 Prior-year figures restated. 2 The non-current provisions for non-contractual nuclear obligations amounted to € 3,979.8 million as of 1 January 2010. They include a retroactive restatement as of
31 December 2010 of € 554.3 million (1 January 2010: € 239.0 million).
Provisions for pensions and similar obligations The provisions for pensions and similar obligations are recorded on the basis of the existing commitments for future and current post-employment benefits to current and former employees with a pension entitlement as well as their surviving dependants. Most of them are defined benefit plans. In addition, the employees are granted energy price reductions after reaching retirement age.
The commitments are measured above all on the basis of the length of service and remuneration of the employees. In addition, the company pension scheme includes defined benefit obligations under a multi-employer plan using the same measurement basis. The contributions payable to the supplemental pension plans are made as a certain percentage of the respective employee’s compensation subject to the additional benefits.
The provisions for defined benefit obligations reflect the present value of the expected future obligations adjusted for unrecognised actuarial gains and losses. The provisions are calculated using actuarial methods. Plan assets were created in accordance with IAS 19.7 and will be used exclusively to cover pension obligations. They were deducted from the pension obligations.

164 _
The main parameters (averages) of the calculation of the defined benefit obligations for the German companies are presented below:
% 31/12/2011 31/12/2010
Discount rate 5.25 5.25
Future expected wage and salary increases1 3.00 3.00
Future expected pension increase 2.10 2.10
Employee turnover 2.00 2.00
Expected return on plan assets 5.30 5.30
1 2012: 0.5%.
The calculations are based on the 2005 G mortality tables of Prof. Dr. Klaus Heubeck. The expense for pensions and similar obligations is comprised as follows:
€ millions 2011 2010
Net benefit expense
Current service cost 64.1 47.9
Past service cost 0.0 22.2
Actuarial gains (+)/losses (-) 3.1 1.2
Expected return on plan assets -7.2 -6.6
Interest cost 229.8 229.3
Total 289.8 294.0
The present value of the pension and similar benefit obligations can be reconciled to the carrying amount of the benefit obligations as follows:
€ millions 31/12/2011 31/12/2010
Defined benefit obligation 4,537.1 4,545.8
of which internally funded benefits (4,366.1) (4,371.8)
of which externally funded benefits (171.0) (174.0)
Fair market value of plan assets -141.1 -148.9
Plan surplus 2.7 4.2
Unrecognised actuarial gains (+)/losses (-) -106.7 -157.3
Provisions for pensions and similar obligations 4,292.0 4,243.8
Statement of changes in plan assets in € millions 2011 2010
Fair market value of plan assets at the beginning of the fiscal year 148.9 136.1
Expected return on plan assets 7.2 6.6
Transfer of assets 2.0 10.0
Benefits paid -8.9 -10.4
Actuarial gains (+)/losses (-) -10.2 -2.5
Currency adjustments and reclassifications 2.1 9.1
Fair market value of plan assets at the end of the fiscal year 141.1 148.9

Time to act
Management report
Financial statements
Notes of the EnBW group ‹
Corporate governance
Service
_ 165
The actual development of plan assets amounted to € -3.0 million (prior year: € 4.1 million). As in the prior year, there are no plans to make future payments to plan assets.
Experience adjustments in € millions
2011 2010 2009 2008 2007
Defined benefit obligation -51.0 -8.6 -17.3 -53.1 -31.9
Fair market value of plan assets -10.2 -2.5 5.5 -11.1 -0.8
The experience adjustments of the defined benefit obligation that were not caused by changes in the underlying assumptions are a component of the actuarial gains and losses arising in the respective period. The experience adjustments of the fair market value of plan assets correspond to the actuarial gains and losses arising in the respective period.
Composition of plan assets (%) 31/12/2011 31/12/2010
Shares 34.0 30.4
Fixed-interest securities 52.0 52.3
Other assets 14.0 17.3
100.0 100.0
The investment objective for the external plan assets is to cover benefit obligations with a similar term. Plan assets do not include any shares of EnBW group entities or any owner-occupied property. The investment strategy takes into consideration the maturity structure and volume of benefit obligations. The average return was -2.1% (prior year: 2.9%). The expected return was 5.3% (prior year: 5.3%). The expected return is calculated based on the asset forecasts of each asset class as well as negotiations with banks. The forecasts are based on past experience and general economic data.
Development of the present value of the defined benefit obligation in € millions
2011 2010
Defined benefit obligation at the beginning of the fiscal year 4,545.8 4,167.2
Current service cost 64.1 47.9
Interest cost 229.8 229.3
Benefits paid -240.7 -230.2
Actuarial gains (+)/losses (–) -67.3 289.1
Past service cost 0.0 22.2
Changes in the consolidated companies and currency adjustments 3.1 13.8
Reclassifications 2.3 6.5
Present value of the defined benefit obligation at the end of the fiscal year 4,537.1 4,545.8
A fall or rise in interest rates of 0.5 percentage points would have led to a rise in the present value of defined benefit obligations of € 278.2 million (prior year: € 324.2 million) or a fall of € 311.5 million (prior year: € 289.1 million).

166 _
The present value of the defined benefit obligation breaks down as follows by funded status:
€ millions 31/12/2011 31/12/2010
Funded benefits 171.0 174.0
Fully funded (171.0) (174.0)
Unfunded benefits 4,366.1 4,371.8
The present value of the benefit obligations, the fair market value of plan assets and the plan surplus or deficit have developed as follows since 2007:
€ millions 31/12/2011 31/12/2010 31/12/2009 31/12/2008 31/12/2007
Present value of benefit obligations 4,537.1 4,545.8 4,167.2 4,009.9 4,244.7
Fair market value of plan assets -141.1 -148.9 -136.1 -145.2 -105.4
Plan surplus or deficit 4,396.0 4,396.9 4,031.1 3,864.7 4,139.3
Multi-employer plans Multi-employer plans, which are defined benefit plans, are accounted for as defined contribution plans because the information required to allocate the obligations and plan assets to the respective participating employer and the corresponding expenses is not provided by the supplemental pension plans. The expenses from defined benefit obligations via multi-employer plans amounted to € 16.4 million (prior year: € 14.4 million). Potential future increases in contributions from unfunded obligations will not have a significant effect on the EnBW group.
The employer’s contributions to statutory pension insurance amounted to € 99.1 million in 2011 (prior year: € 97.7 million).
Tax provisions The tax provisions principally contain provisions for income taxes such as corporate income tax, including solidarity surcharge, and trade tax.
Provisions relating to nuclear power The provisions relating to nuclear power have been recorded for the disposal of irradiated fuel rods and radioactive waste as well as for the decommissioning and restoration of contaminated facilities.
€ millions1 31/12/2011 31/12/2010
Decommissioning and restoration 4,143.2 3,202.7
Disposal of spent fuel rods2 2,161.2 2,456.3
Waste 279.5 267.7
Total 6,583.9 5,926.7
1 Prior-year figures restated. 2 Provisions for the disposal of spent fuel rods amounted to € 2,082.1 million as of 1 January 2010. They include a retroactive restatement as of 31 December 2010 of
€ 554.3 million (1 January 2010: € 239.0 million).

Time to act
Management report
Financial statements
Notes of the EnBW group ‹
Corporate governance
Service
_ 167
The provisions are all based on public law obligations and requirements in the operating licences.
In those instances where contracts had not been concluded under civil law by the reporting date for performance of these public law obligations, the provisions were measured based on external appraisals and cost estimates (non-contractual nuclear obligations). This mainly concerns the anticipated costs relating to decommissioning and post-closure operating of the plants, dismantling and disposal of parts of nuclear power plants, and also the actual costs of ultimate storage. With regard to the disposal of fuel rods, the non-contractual share of costs mostly relates to costs for conditioning in preparation for ultimate storage, transportation costs, costs for the procurement of containers for ultimate storage purposes as well as the costs of ultimate storage.
In addition, part of the carrying amount of the provisions is substantiated by civil-law contracts (contractual nuclear obligations). On the one hand, these are personnel costs for the company’s own staff expected to be dealing with the decommissioning. On the other hand, the disposal of fuel rods mainly comprises costs yet to be incurred for reprocessing spent fuel rods, costs of local interim storage in the vicinity of the plants, central interim storage at the Gorleben and Ahaus interim storage facilities as well as costs for transportation and the procurement of containers.
The provisions for the decommissioning and restoration of contaminated plants as well as for fuel rods are recognised at the discounted settlement amount at the time of commissioning. This is disclosed accordingly under the generating facilities and depreciated. It totals € 540.8 million (prior year restated: € 631.0 million). Changes in estimates due to changes in assumptions concerning the future development of costs were generally recognised without effect on profit or loss by adjusting the appropriate balance sheet items by € 54.7 million (prior year restated: € 268.9 million). Where such changes in estimates related to discontinued power stations, they were recognised in profit or loss. Decommissioning costs are calculated on the basis of the scenario that assumes that the plants will be removed immediately. The provisions are partially offset by receivables of € 511.0 million (prior year: € 464.4 million) that relate to restoration obligations for nuclear power plants assumed by a contractual partner in connection with the supply of electricity.

168 _
Statement of changes
in provisions
in € millions1
As of 1/1/2011
Increases Reversals Increase due to the
passage of time
Changes recognised
in equity
Changes in consolidated
companies, currency
adjustments, reclassifi-
cations
Utilisation As of31/12/2011
Provisions for pensions and similar obligations 4,243.8 62.9 0.0 223.0 0.0 3.0 240.7 4,292.0
Tax provisions 362.2 149.3 2.2 11.3 0.0 -26.6 85.3 408.7
Provisions relating to nuclear power2 5,926.7 610.2 177.9 349.4 54.7 -2.3 176.9 6,583.9
Other provisions 1,002.6 592.3 98.8 10.5 9.3 -0.6 385.2 1,130.1
Other electricity provisions (204.7) (133.1) (22.9) (1.6) (9.3) (0.0) (116.8) (209.0)
Personnel provisions (181.3) (191.0) (11.9) (4.5) (0.0) (-3.0) (55.0) (306.9)
Provisions for onerous contracts (279.2) (85.9) (45.5) (2.7) (0.0) (20.3) (132.2) (210.4)
Sundry provisions (337.4) (182.3) (18.5) (1.7) (0.0) (-17.9) (81.2) (403.8)
Total 11,535.3 1,414.7 278.9 594.2 64.0 -26.5 888.1 12,414.7
1 Prior-year figures restated. 2 Provisions relating to nuclear power amounted to € 5,419.5 million as of 1 January 2010. They include a retroactive restatement as of 31 December 2010 of € 554.3
million (1 January 2010: € 239.0 million).
The provisions relating to nuclear power are set up in an amount equivalent to the present value of the expected future obligations and increased annually to reflect the passage of time. The discount rate for calculating the provisions is unchanged at 5.5%. Based on the information currently available, the provisions are expected to be utilised mostly in the period from 2020 to 2050.
The payments on account made to reprocessing firms and the Federal Office for Radiation Protection, which are taken into account in the provisions relating to nuclear power, amount to € 523.6 million (prior year: € 489.0 million). The payments to the Federal Office for Radiation Protection relate to construction of the Gorleben and Konrad ultimate repositories and are based on the German Final Storage Advance Payments Ordinance (EndlagerVlV).
Other provisions Other electricity provisions primarily relate to obligations from CO2 emission allowances, the German Combined Heat and Power Act (KWKG), the conventional procurement of electricity and fuels and decommissioning obligations for wind and hydro-electric power stations.
Personnel provisions concern above all obligations from phased retirement arrangements, long-service awards and restructuring measures.
The provisions for onerous contracts concern future obligations from onerous procurement and sales agreements. The obligations include additional costs relating to the delayed construction of power stations and, on the procurement side, above all to the non-thermal waste disposal area.
Other provisions are discounted using an interest rate of 1.00% to 3.75% on average (prior year: 1.00% to 3.00%). The majority of other provisions have a term of between one and five years.
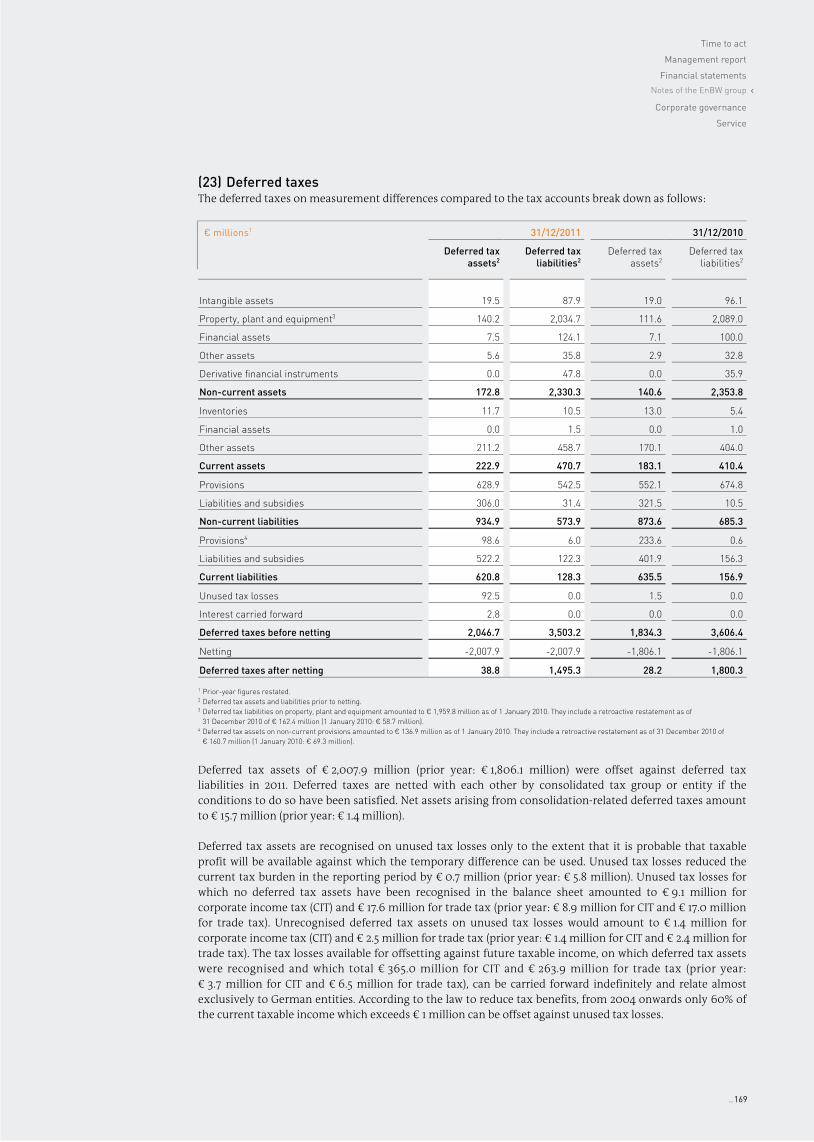
Time to act
Management report
Financial statements
Notes of the EnBW group ‹
Corporate governance
Service
_ 169
(23) Deferred taxes The deferred taxes on measurement differences compared to the tax accounts break down as follows:
€ millions1 31/12/2011 31/12/2010
Deferred tax assets2
Deferred tax liabilities2
Deferred tax assets2
Deferred tax liabilities2
Intangible assets 19.5 87.9 19.0 96.1
Property, plant and equipment3 140.2 2,034.7 111.6 2,089.0
Financial assets 7.5 124.1 7.1 100.0
Other assets 5.6 35.8 2.9 32.8
Derivative financial instruments 0.0 47.8 0.0 35.9
Non-current assets 172.8 2,330.3 140.6 2,353.8
Inventories 11.7 10.5 13.0 5.4
Financial assets 0.0 1.5 0.0 1.0
Other assets 211.2 458.7 170.1 404.0
Current assets 222.9 470.7 183.1 410.4
Provisions 628.9 542.5 552.1 674.8
Liabilities and subsidies 306.0 31.4 321.5 10.5
Non-current liabilities 934.9 573.9 873.6 685.3
Provisions4 98.6 6.0 233.6 0.6
Liabilities and subsidies 522.2 122.3 401.9 156.3
Current liabilities 620.8 128.3 635.5 156.9
Unused tax losses 92.5 0.0 1.5 0.0
Interest carried forward 2.8 0.0 0.0 0.0
Deferred taxes before netting 2,046.7 3,503.2 1,834.3 3,606.4
Netting -2,007.9 -2,007.9 -1,806.1 -1,806.1
Deferred taxes after netting 38.8 1,495.3 28.2 1,800.3
1 Prior-year figures restated. 2 Deferred tax assets and liabilities prior to netting. 3 Deferred tax liabilities on property, plant and equipment amounted to € 1,959.8 million as of 1 January 2010. They include a retroactive restatement as of
31 December 2010 of € 162.4 million (1 January 2010: € 58.7 million). 4 Deferred tax assets on non-current provisions amounted to € 136.9 million as of 1 January 2010. They include a retroactive restatement as of 31 December 2010 of
€ 160.7 million (1 January 2010: € 69.3 million).
Deferred tax assets of € 2,007.9 million (prior year: € 1,806.1 million) were offset against deferred tax liabilities in 2011. Deferred taxes are netted with each other by consolidated tax group or entity if the conditions to do so have been satisfied. Net assets arising from consolidation-related deferred taxes amount to € 15.7 million (prior year: € 1.4 million).
Deferred tax assets are recognised on unused tax losses only to the extent that it is probable that taxable profit will be available against which the temporary difference can be used. Unused tax losses reduced the current tax burden in the reporting period by € 0.7 million (prior year: € 5.8 million). Unused tax losses for which no deferred tax assets have been recognised in the balance sheet amounted to € 9.1 million for corporate income tax (CIT) and € 17.6 million for trade tax (prior year: € 8.9 million for CIT and € 17.0 million for trade tax). Unrecognised deferred tax assets on unused tax losses would amount to € 1.4 million for corporate income tax (CIT) and € 2.5 million for trade tax (prior year: € 1.4 million for CIT and € 2.4 million for trade tax). The tax losses available for offsetting against future taxable income, on which deferred tax assets were recognised and which total € 365.0 million for CIT and € 263.9 million for trade tax (prior year: € 3.7 million for CIT and € 6.5 million for trade tax), can be carried forward indefinitely and relate almost exclusively to German entities. According to the law to reduce tax benefits, from 2004 onwards only 60% of the current taxable income which exceeds € 1 million can be offset against unused tax losses.

170 _
The deferred taxes on unused tax losses break down as follows:
€ millions 31/12/2011 31/12/2010
Corporate income tax (or comparable foreign tax) 57.8 0.6
Trade tax 34.7 0.9
Total 92.5 1.5
Presentation of the development of deferred taxes on unused tax losses:
€ millions 31/12/2011 31/12/2010
Opening balance 1.5 7.3
Utilisation of tax losses 0.0 -5.8
Adjustment of previously unrecognised tax losses (addition) 1.1 0.0
Origination of tax losses 89.9 0.0
Closing balance 92.5 1.5
Deferred taxes on unused tax losses for corporate income tax of € 36.3 million (prior year: € 0.0 million) and for trade tax of € 30.4 million (prior year: € 0.0 million) are expected to be realised within a year, the remainder of € 21.5 million for corporate income tax (prior year: € 4.3 million) and of € 0.6 million for trade tax (prior year: €0.9 million) will be realised within five years.
An amount of € 2.8 million (prior year: € 0.0 million) of deferred taxes on interest carryforwards relates exclusively to German entities and is likely to be realised within five years.
Deferred tax liabilities totalling € 28.0 million (prior year: € 78.3 million) were offset directly against equity under other comprehensive income as of 31 December 2011.
(24) Liabilities and subsidies Financial liabilities Financial liabilities break down as follows as of 31 December 2011 compared to the prior year:
€ millions1 31/12/2011 31/12/2010
Current Non-current Total Current Non-current Total
Hybrid bond 0.0 740.2 740.2 0.0 0.0 0.0
Bonds 1,082.1 4,374.0 5,456.1 0.0 5,391.0 5,391.0
Commercial papers 0.0 0.0 0.0 99.9 0.0 99.9
Liabilities to banks 280.0 783.3 1,063.3 342.7 840.1 1,182.8
Other financial liabilities 114.0 366.2 480.2 200.9 446.3 647.2
Financial liabilities 1,476.1 6,263.7 7,739.8 643.5 6,677.4 7,320.9
1 Reference is made to note (27) for more details on the credit and liquidity risk, fair values and undiscounted cash flows by year.
Financial liabilities rose by € 418.9 million in the fiscal year 2011 (prior year: € 136.6 million).
On 24 October 2011, EnBW AG placed a hybrid bond with a volume of € 750.0 million. The bond matures on 2 April 2072 and is furnished with repayment rights for EnBW AG every five years, starting on 2 April 2017.

Time to act
Management report
Financial statements
Notes of the EnBW group ‹
Corporate governance
Service
_ 171
The bond is subordinated to other existing bonds and, based on its terms and conditions, half of the amount of the bond will be recognised as equity by rating agencies until the first possible date of repayment, thereby supporting EnBW’s current A rating. The bond is initially furnished with a fixed coupon rate of 7.375% p.a., which, beginning on 2 April 2017, is adjusted every five years to the then prevailing five-year mid-swap rate plus the risk premium of 5.401% determined upon issuing the bond. In 2022 and 2037, the coupon rate will increase by 0.25% p.a. and a further 0.75% p.a., respectively.
EnBW International Finance B.V. repaid a private placement of € 150 million made within the established debt issuance programme as scheduled in the prior year. As of the reporting date, no funds had been drawn under the commercial paper programme in place at EnBW International B.V. for short-term financing purposes (prior year: € 99.9 million).
Liabilities to banks fell by € 119.5 million on the prior year (prior year: increase of € 220.3 million). The decrease is attributable to scheduled repayments made by EnBW AG and its subsidiaries. The majority of the outstanding liabilities to banks are bilateral loan agreements.
The item “other financial liabilities” includes mainly long-term finance leases. It also contains the (residual) purchase price obligations from acquisitions made. In a year-on-year comparison, other financial liabilities fell by a total of € 167.0 million in the reporting period (prior year: decrease of € 78.9 million).
The maturity structure of our financial liabilities is as follows:
€ millions Due in
< 1 yearDue in 1–5 years Due in
> 5 yearsTotal
Due in 2012
Due in 2013
Due in2014
Due in2015
Due in 2016
Due after 2016
Hybrid bond 0.0 0.0 0.0 0.0 0.0 740.2 740.2
Bonds 1,082.1 1,005.8 0.0 787.4 496.8 2,084.0 5,456.1
Liabilities to banks 280.0 38.7 65.8 42.7 41.9 594.2 1,063.3
Other financial liabilities 114.0 111.8 92.3 66.1 9.3 86.7 480.2
Financial liabilities 1,476.1 1,156.3 158.1 896.2 548.0 3,505.1 7,739.8
Overview of the hybrid bond:
Issuer Issue
volumeCarrying amount
Coupon Maturity
EnBW AG1 € 750 million € 740.2 million 7.375% 2/4/2072
1 Repayment right for EnBW every five years after the first interest payment date; the earliest date is 2 April 2017.
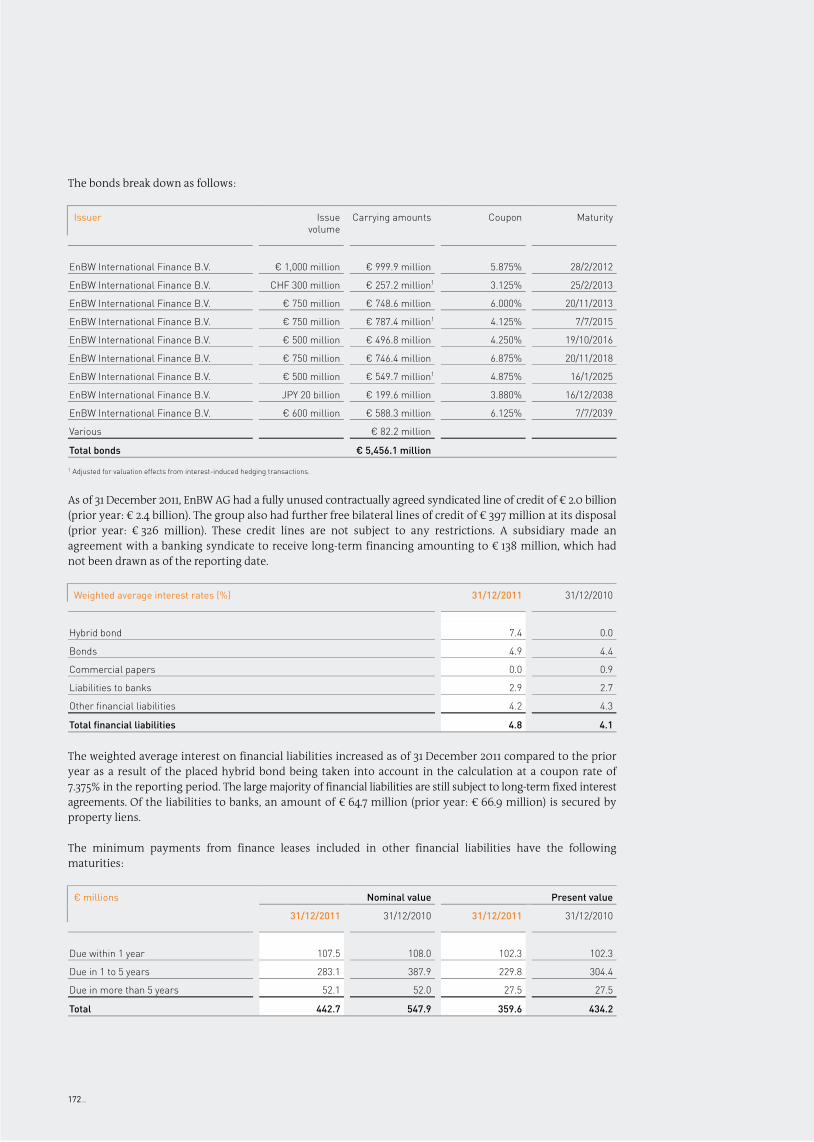
172 _
The bonds break down as follows:
Issuer Issue
volumeCarrying amounts Coupon Maturity
EnBW International Finance B.V. € 1,000 million € 999.9 million 5.875% 28/2/2012
EnBW International Finance B.V. CHF 300 million € 257.2 million1 3.125% 25/2/2013
EnBW International Finance B.V. € 750 million € 748.6 million 6.000% 20/11/2013
EnBW International Finance B.V. € 750 million € 787.4 million1 4.125% 7/7/2015
EnBW International Finance B.V. € 500 million € 496.8 million 4.250% 19/10/2016
EnBW International Finance B.V. € 750 million € 746.4 million 6.875% 20/11/2018
EnBW International Finance B.V. € 500 million € 549.7 million1 4.875% 16/1/2025
EnBW International Finance B.V. JPY 20 billion € 199.6 million 3.880% 16/12/2038
EnBW International Finance B.V. € 600 million € 588.3 million 6.125% 7/7/2039
Various € 82.2 million
Total bonds € 5,456.1 million
1 Adjusted for valuation effects from interest-induced hedging transactions.
As of 31 December 2011, EnBW AG had a fully unused contractually agreed syndicated line of credit of € 2.0 billion (prior year: € 2.4 billion). The group also had further free bilateral lines of credit of € 397 million at its disposal (prior year: € 326 million). These credit lines are not subject to any restrictions. A subsidiary made an agreement with a banking syndicate to receive long-term financing amounting to € 138 million, which had not been drawn as of the reporting date.
Weighted average interest rates (%) 31/12/2011 31/12/2010
Hybrid bond 7.4 0.0
Bonds 4.9 4.4
Commercial papers 0.0 0.9
Liabilities to banks 2.9 2.7
Other financial liabilities 4.2 4.3
Total financial liabilities 4.8 4.1
The weighted average interest on financial liabilities increased as of 31 December 2011 compared to the prior year as a result of the placed hybrid bond being taken into account in the calculation at a coupon rate of 7.375% in the reporting period. The large majority of financial liabilities are still subject to long-term fixed interest agreements. Of the liabilities to banks, an amount of € 64.7 million (prior year: € 66.9 million) is secured by property liens.
The minimum payments from finance leases included in other financial liabilities have the following maturities:
€ millions Nominal value Present value
31/12/2011 31/12/2010 31/12/2011 31/12/2010
Due within 1 year 107.5 108.0 102.3 102.3
Due in 1 to 5 years 283.1 387.9 229.8 304.4
Due in more than 5 years 52.1 52.0 27.5 27.5
Total 442.7 547.9 359.6 434.2

Time to act
Management report
Financial statements
Notes of the EnBW group ‹
Corporate governance
Service
_ 173
Other liabilities and subsidies Other liabilities and subsidies disclosed separately by maturity in the balance sheet are combined in the notes to the financial statements.
€ millions 31/12/2011 31/12/2010
Non-current liabilities 447.9 456.4
Current liabilities 6,004.6 5,475.9
Liabilities 6,452.5 5,932.3
Non-current subsidies 1,512.7 1,509.3
Current subsidies 71.7 79.5
Subsidies 1,584.4 1,588.8
Non-current liabilities and subsidies 1,960.6 1,965.7
Current liabilities and subsidies 6,076.3 5,555.4
Liabilities and subsidies 8,036.9 7,521.1
Other liabilities break down as follows as of 31 December 2011 compared to the prior year:
€ millions1 31/12/2011 31/12/2010
Current Non-current Total Current Non-current Total
Payments received on account of orders 45.3 55.9 101.2 34.7 34.3 69.0
Trade payables 3,528.1 0.5 3,528.6 3,164.4 6.5 3,170.9
of which liabilities to affiliated entities (10.4) (0.0) (10.4) (9.5) (0.0) (9.5)
of which liabilities to other investees and investors (88.4) (0.2) (88.6) (87.5) (6.1) (93.6)
of which liabilities to entities accounted for using the equity method (21.6) (0.2) (21.8) (12.8) (0.1) (12.9)
Other deferred income 14.3 186.9 201.2 22.9 204.3 227.2
Liabilities from derivatives 1,418.4 12.2 1,430.6 1,057.9 7.6 1,065.5
of which without hedges (1,375.3) (9.2) (1,384.5) (1,028.4) (7.6) (1,036.0)
of which cash flow hedge (43.1) (3.0) (46.1) (29.5) (0.0) (29.5)
Miscellaneous liabilities 998.5 192.4 1,190.9 1,196.0 203.7 1,399.7
of which from income tax (57.9) (0.0) (57.9) (47.7) (0.0) (47.7)
of which interest from back taxes (0.0) (2.0) (2.0) (1.4) (1.7) (3.1)
of which from other taxes (137.7) (0.5) (138.2) (152.2) (0.5) (152.7)
of which relating to social security (20.5) (13.9) (34.4) (21.6) (19.2) (40.8)
Other liabilities 6,004.6 447.9 6,452.5 5,475.9 456.4 5,932.3
1 Reference is made to note (27) for more details on the credit and liquidity risk, fair values and undiscounted cash flows by year.

174 _
Other non-current liabilities amounting to € 191.0 million (prior year: € 176.1 million) are due in more than five years.
Trade payables primarily include obligations for outstanding invoices amounting to € 2,509.5 million (prior year: € 2,176.0 million).
Miscellaneous liabilities mainly consist of the tax liabilities, including interest from back taxes, of € 198.1 million (prior year: € 203.5 million), security deposits for over-the-counter trading (margin calls received) of € 284.3 million (prior year: € 445.1 million) as well as for market trading (variation margins) of € 68.0 million (prior year: € 48.9 million), interest obligations from bonds of € 139.6 million (prior year: € 127.1 million) and purchase obligations to non-controlling interests recognised as liabilities of € 23.8 million (prior year: € 28.5 million).
Subsidies include investment grants as well as construction cost and investment cost subsidies.
€ millions 31/12/2011 31/12/2010
Investment grants 2.2 3.5
Investment cost subsidies 20.2 22.9
Construction cost subsidies 1,562.0 1,562.4
Total 1,584.4 1,588.8
The investment grants were awarded in accordance with Sec. 4a German Investment Grant Act (InvZulG).
The construction cost subsidies which have not yet been recognised in profit or loss were largely granted for capital expenditures in the electricity and gas segments; title to the subsidised assets is retained by the EnBW group companies.
The subsidies are released over the estimated useful life of the subsidised assets. Of the total amount of subsidies, an amount of € 1,512.7 million (prior year: € 1,509.3 million) will be recognised in profit or loss in more than one year.
(25) Assets held for sale and liabilities directly associated with assets classified as held for sale
Assets held for sale contain our Polish investments of € 168.6 million in Elektrownia Rybnik S.A. and Zespól Elektrocieplowni Wroclawskich Kogeneracja S.A. (prior year: € 0.0 million). In December 2011, an agreement was concluded with Electricité de France (EDF) on the sale of these investments, yet this was still subject to the approval of the antitrust authorities as of 31 December 2011. The remaining assets classified as held for sale totalling € 41.3 million (prior year: € 11.8 million) essentially relate to distribution plants. Liabilities directly associated with assets classified as held for sale totalling € 0.6 million (prior year: € 0.0 million) relate to deferred tax liabilities.

Time to act
Management report
Financial statements
Notes of the EnBW group ‹
Corporate governance
Service
_ 175
Other notes
(26) Earnings per share 2011 2010
Profit from continuing operations1 € millions -815.9 1,151.7
of which loss/profit shares attributable to the equity holders of EnBW AG1 € millions (-867.3) (1,157.2)
Group net loss/profit1 € millions -815.9 1,151.7
of which loss/profit shares attributable to the equity holders of EnBW AG1 € millions (-867.3) (1,157.2)
Number of shares outstanding (weighted average) thousand shares 244,257 244,257
Earnings per share from continuing operations1, 2 € -3.55 4.74
Earnings per share from group net loss/profit (€)1, 2 € -3.55 4.74
Dividends per share for fiscal year 2010 of EnBW AG € - 1.53
Proposed dividends per share for fiscal year 2011 of EnBW AG € 0.85 -
1 Prior-year figures restated. 2 In relation to the loss/profit shares attributable to the equity holders of EnBW AG.
Earnings per share is determined by dividing the loss/profit shares attributable to the equity holders of EnBW AG by the average number of shares outstanding. The indicator may be diluted by potential shares on account of share options or convertible bonds. As EnBW does not have any potential shares, the basic earnings per share is identical to the diluted earnings per share.

176 _
(27) Accounting for financial instruments Financial instruments include primary financial instruments and derivatives. On the assets side, primary financial instruments mainly consist of financial assets, trade receivables, other assets and cash and cash equivalents. On the liabilities side, they consist of financial liabilities, trade payables and other liabilities.
Fair value and carrying amounts of financial instruments by measurement category The table below shows the fair values and carrying amounts of the financial assets and financial liabilities contained in the individual balance sheet items:
31/12/2011 Input hierarchy
€ millions Fair value Level 1 Level 2 At amortised
cost
Not within
the scopeof IFRS 7
Carrying amount
Financial assets 6,510.1 1,029.1 3,528.1 1,896.6 6,453.8
Held for trading (459.6) (262.4) (197.2) (459.6)
Available for sale (4,754.8) (766.7) (3,330.9) (657.2) (4,754.8)
Held to maturity (1,182.3) (1,126.0) (1,126.0)
Loans and receivables (113.4) (113.4) (113.4)
Trade receivables 3,612.5 3,612.5 3,612.5
Loans and receivables (3,612.5) (3,612.5) (3,612.5)
Other assets 2,300.8 87.4 1,524.2 689.2 310.2 2,611.0
Held for trading (1,306.8) (75.3) (1,231.5) (1,306.8)
Loans and receivables (648.1) (648.1) (648.1)
Derivatives designated as hedging instruments (304.8) (12.1) (292.7) (304.8)
Carrying amount in accordance with IAS 17 (41.1) (41.1) (41.1)
Cash and cash equivalents 2,776.6 2,776.6 2,776.6
Loans and receivables (2,776.6) (2,776.6) (2,776.6)
Total assets 15,200.0 1,116.5 5,052.3 8,974.9 310.2 15,453.9
Assets held for sale 37.2 37.2 172.7 209.9
Available for sale (37.2) (37.2) (37.2)
Financial liabilities 8,198.3 7,739.8 7,739.8
At amortised cost (7,838.7) (7,380.2) (7,380.2)
Carrying amount in accordance with IAS 17 (359.6) (359.6) (359.6)
Trade payables 434.2 434.2 3,094.4 3,528.6
At amortised cost (434.2) (434.2) (434.2)
Other liabilities and subsidies 2,159.4 145.1 1,285.5 728.8 2,348.9 4,508.3
Held for trading (1,384.5) (141.5) (1,243.0) (1,384.5)
At amortised cost (728.8) (728.8) (728.8)
Derivatives designated as hedging instruments (46.1) (3.6) (42.5) (46.1)
Total liabilities 10,791.9 145.1 1,285.5 8,902.8 5,443.3 15,776.7
Liabilities directly associated with the assets classified as held for sale 0.6 0.6

Time to act
Management report
Financial statements
Notes of the EnBW group ‹
Corporate governance
Service
_ 177
31/12/2010 Input hierarchy
€ millions Fair value Level 1 Level 2 At amortised
cost
Not within the scope of IFRS 7
Carrying amount
Financial assets 6,944.0 1,010.9 4,014.2 1,881.3 6,906.4
Held for trading (385.5) (176.4) (209.1) (385.5)
Available for sale (5,232.2) (834.5) (3,805.1) (592.6) (5,232.2)
Held to maturity (1,112.6) (1,075.0) (1,075.0)
Loans and receivables (213.7) (213.7) (213.7)
Trade receivables 3,693.0 3,693.0 3,693.0
Loans and receivables (3,693.0) (3,693.0) (3,693.0)
Other assets 1,634.9 62.4 1,254.9 317.6 291.5 1,926.4
Held for trading (943.2) (25.1) (918.1) (943.2)
Loans and receivables (279.6) (279.6) (279.6)
Derivatives designated as hedging instruments (374.1) (37.3) (336.8) (374.1)
Carrying amount in accordance with IAS 17 (38.0) (38.0) (38.0)
Cash and cash equivalents 1,878.3 1,878.3 1,878.3
Loans and receivables (1,878.3) (1,878.3) (1,878.3)
Total assets 14,150.2 1,073.3 5,269.1 7,770.2 291.5 14,404.1
Financial liabilities 7,747.8 7,320.9 7,320.9
At amortised cost (7,313.6) (6,886.7) (6,886.7)
Carrying amount in accordance with IAS 17 (434.2) (434.2) (434.2)
Trade payables 596.0 596.0 2,574.9 3,170.9
At amortised cost (596.0) (596.0) (596.0)
Other liabilities and subsidies 1,969.9 20.7 1,044.8 904.4 2,380.3 4,350.2
Held for trading (1,036.0) (20.7) (1,015.3) (1,036.0)
At amortised cost (904.4) (904.4) (904.4)
Derivatives designated as hedging instruments (29.5) (29.5) (29.5)
Total liabilities 10,313.7 20.7 1,044.8 8,821.3 4,955.2 14,842.0
The fair value of assets classified as “held for trading” amounts to a total of € 1,766.4 million (prior year: € 1,328.7 million), of which € 337.7 million (prior year: € 201.5 million) relates to the first level of the input hierarchy and € 1,428.7 million (prior year: € 1,127.2 million) to the second level. Assets classified as “available for sale” are recorded at a total fair value of € 4,792.0 million (prior year: € 5,232.2 million), of which € 803.9 million (prior year: € 834.5 million) relates to the first level of the input hierarchy, € 3,330.9 million (prior year: € 3,805.1 million) to the second level and € 657.2 million (prior year: € 592.6 million) to assets measured “at amortised cost”. Assets classified as “loans and receivables” are measured at amortised cost and amount to a total of € 7,150.6 million (prior year: € 6,064.6 million). Equity instruments measured at cost had a carrying amount of € 657.2 million (prior year: € 592.6 million) as of the reporting date.
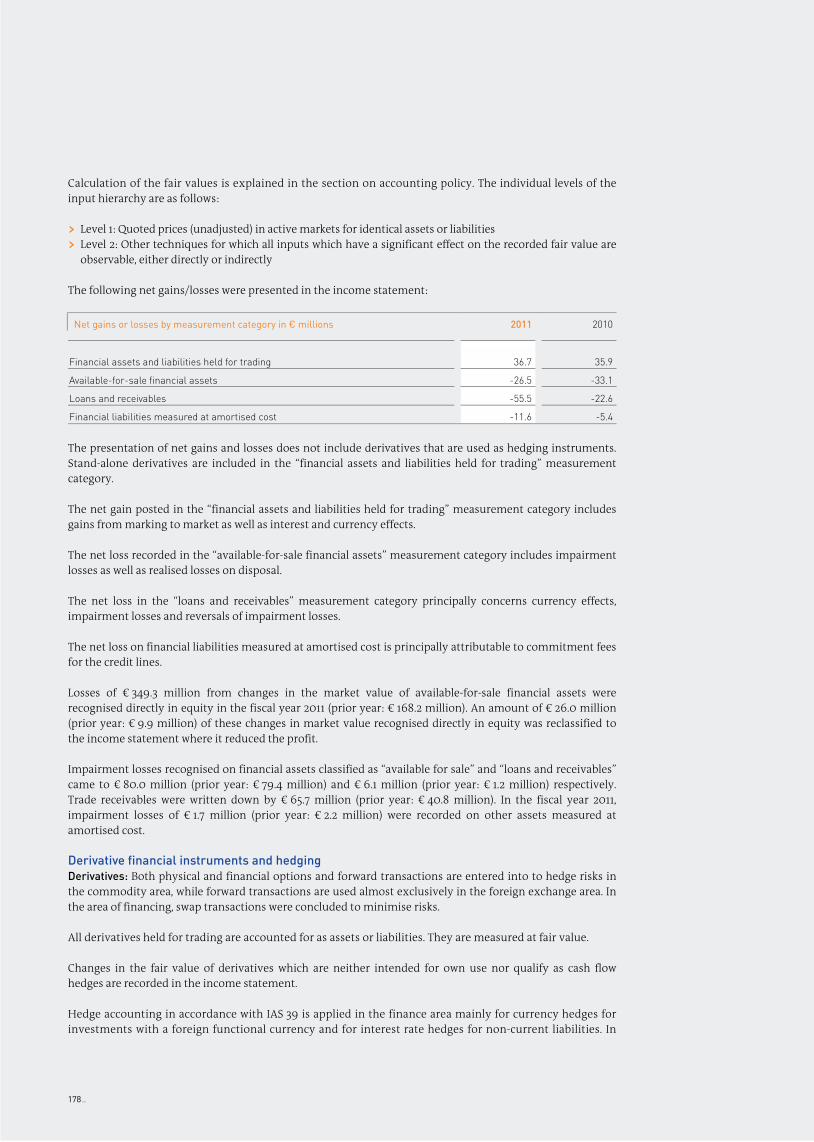
178 _
Calculation of the fair values is explained in the section on accounting policy. The individual levels of the input hierarchy are as follows:
› Level 1: Quoted prices (unadjusted) in active markets for identical assets or liabilities › Level 2: Other techniques for which all inputs which have a significant effect on the recorded fair value are
observable, either directly or indirectly
The following net gains/losses were presented in the income statement:
Net gains or losses by measurement category in € millions 2011 2010
Financial assets and liabilities held for trading 36.7 35.9
Available-for-sale financial assets -26.5 -33.1
Loans and receivables -55.5 -22.6
Financial liabilities measured at amortised cost -11.6 -5.4
The presentation of net gains and losses does not include derivatives that are used as hedging instruments. Stand-alone derivatives are included in the “financial assets and liabilities held for trading” measurement category.
The net gain posted in the “financial assets and liabilities held for trading” measurement category includes gains from marking to market as well as interest and currency effects.
The net loss recorded in the “available-for-sale financial assets” measurement category includes impairment losses as well as realised losses on disposal.
The net loss in the “loans and receivables” measurement category principally concerns currency effects, impairment losses and reversals of impairment losses.
The net loss on financial liabilities measured at amortised cost is principally attributable to commitment fees for the credit lines.
Losses of € 349.3 million from changes in the market value of available-for-sale financial assets were recognised directly in equity in the fiscal year 2011 (prior year: € 168.2 million). An amount of € 26.0 million (prior year: € 9.9 million) of these changes in market value recognised directly in equity was reclassified to the income statement where it reduced the profit.
Impairment losses recognised on financial assets classified as “available for sale” and “loans and receivables” came to € 80.0 million (prior year: € 79.4 million) and € 6.1 million (prior year: € 1.2 million) respectively. Trade receivables were written down by € 65.7 million (prior year: € 40.8 million). In the fiscal year 2011, impairment losses of € 1.7 million (prior year: € 2.2 million) were recorded on other assets measured at amortised cost.
Derivative financial instruments and hedging Derivatives: Both physical and financial options and forward transactions are entered into to hedge risks in the commodity area, while forward transactions are used almost exclusively in the foreign exchange area. In the area of financing, swap transactions were concluded to minimise risks.
All derivatives held for trading are accounted for as assets or liabilities. They are measured at fair value.
Changes in the fair value of derivatives which are neither intended for own use nor qualify as cash flow hedges are recorded in the income statement.
Hedge accounting in accordance with IAS 39 is applied in the finance area mainly for currency hedges for investments with a foreign functional currency and for interest rate hedges for non-current liabilities. In
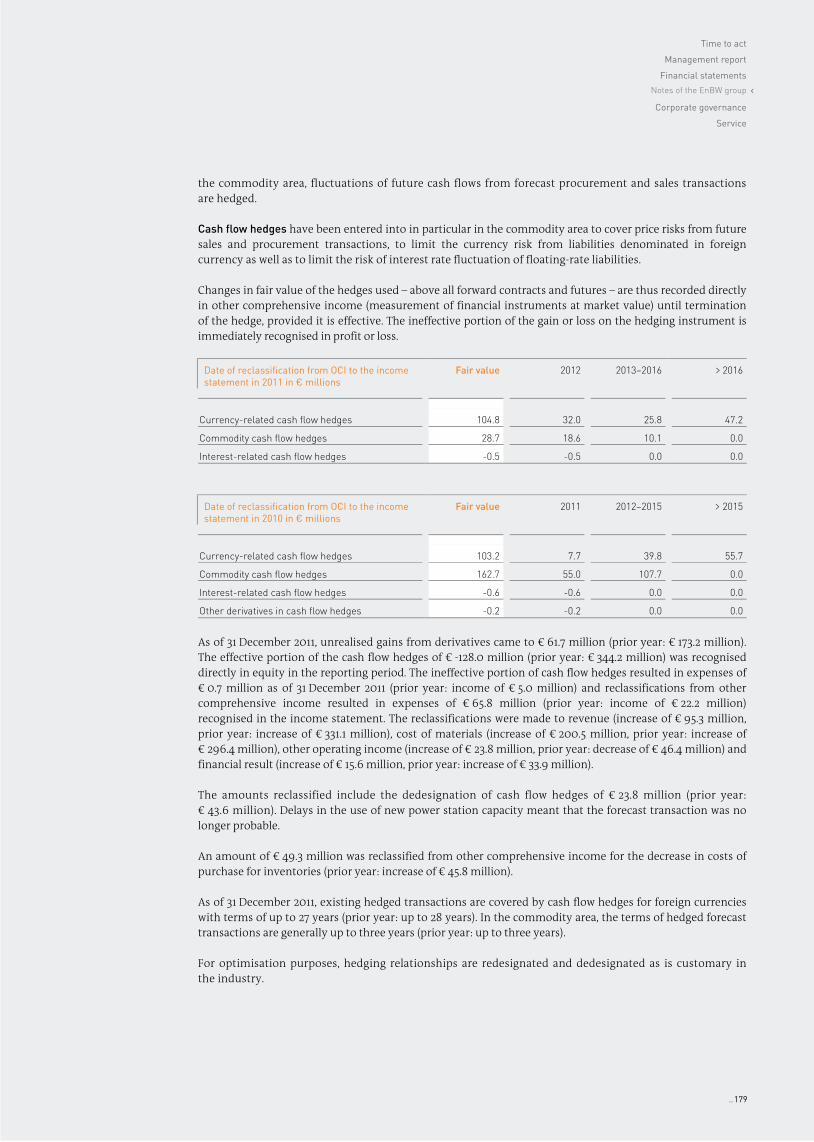
Time to act
Management report
Financial statements
Notes of the EnBW group ‹
Corporate governance
Service
_ 179
the commodity area, fluctuations of future cash flows from forecast procurement and sales transactions are hedged.
Cash flow hedges have been entered into in particular in the commodity area to cover price risks from future sales and procurement transactions, to limit the currency risk from liabilities denominated in foreign currency as well as to limit the risk of interest rate fluctuation of floating-rate liabilities.
Changes in fair value of the hedges used – above all forward contracts and futures – are thus recorded directly in other comprehensive income (measurement of financial instruments at market value) until termination of the hedge, provided it is effective. The ineffective portion of the gain or loss on the hedging instrument is immediately recognised in profit or loss.
Date of reclassification from OCI to the income
statement in 2011 in € millions
Fair value 2012 2013–2016 > 2016
Currency-related cash flow hedges 104.8 32.0 25.8 47.2
Commodity cash flow hedges 28.7 18.6 10.1 0.0
Interest-related cash flow hedges -0.5 -0.5 0.0 0.0
Date of reclassification from OCI to the income
statement in 2010 in € millions
Fair value 2011 2012–2015 > 2015
Currency-related cash flow hedges 103.2 7.7 39.8 55.7
Commodity cash flow hedges 162.7 55.0 107.7 0.0
Interest-related cash flow hedges -0.6 -0.6 0.0 0.0
Other derivatives in cash flow hedges -0.2 -0.2 0.0 0.0
As of 31 December 2011, unrealised gains from derivatives came to € 61.7 million (prior year: € 173.2 million). The effective portion of the cash flow hedges of € -128.0 million (prior year: € 344.2 million) was recognised directly in equity in the reporting period. The ineffective portion of cash flow hedges resulted in expenses of € 0.7 million as of 31 December 2011 (prior year: income of € 5.0 million) and reclassifications from other comprehensive income resulted in expenses of € 65.8 million (prior year: income of € 22.2 million) recognised in the income statement. The reclassifications were made to revenue (increase of € 95.3 million, prior year: increase of € 331.1 million), cost of materials (increase of € 200.5 million, prior year: increase of € 296.4 million), other operating income (increase of € 23.8 million, prior year: decrease of € 46.4 million) and financial result (increase of € 15.6 million, prior year: increase of € 33.9 million).
The amounts reclassified include the dedesignation of cash flow hedges of € 23.8 million (prior year: € 43.6 million). Delays in the use of new power station capacity meant that the forecast transaction was no longer probable.
An amount of € 49.3 million was reclassified from other comprehensive income for the decrease in costs of purchase for inventories (prior year: increase of € 45.8 million).
As of 31 December 2011, existing hedged transactions are covered by cash flow hedges for foreign currencies with terms of up to 27 years (prior year: up to 28 years). In the commodity area, the terms of hedged forecast transactions are generally up to three years (prior year: up to three years).
For optimisation purposes, hedging relationships are redesignated and dedesignated as is customary in the industry.

180 _
Fair value hedges are entered into above all to hedge fixed-interest liabilities against market price risks. Interest rate swaps are used as hedging instruments. With a fair value hedge, both the hedged transaction and the hedging instrument for an exposure are measured at fair value through profit or loss. The change in the fair value of hedging instruments of € 46.2 million was recognised in profit or loss in the reporting period (prior year: € 30.4 million). For hedged liabilities, the fluctuation in market values arising from the hedged risk was also recognised in profit or loss. Changes in market value of hedged transactions of € 43.8 million were recognised in profit or loss in the reporting year (prior year: € 29.3 million).
Hedges of net investments in foreign operations: Primary foreign currency bonds are used to hedge against foreign exchange risks from investments with a foreign functional currency. As of 31 December 2011, an amount of € -31.9 million (prior year: € -27.3 million) arising from exchange rate changes in the hedges is disclosed in the currency translation item under equity.
Contracts that have been concluded to meet the company’s expected usage requirements are not recorded in the balance sheet pursuant to the provisions of IAS 39.
Regular way purchases or sales (spot purchases/sales) of primary financial instruments are generally recognised as of the settlement date. Derivative financial assets are recognised as of the trading date. Derivative and primary financial instruments are recognised in the balance sheet when EnBW becomes party to the contract.
Purchases and sales of fuels are made in euros, US dollars or pounds sterling.
Counterparty risks are assessed taking into account the period for which the current replacement and selling risk has been calculated. In addition, these risks are analysed with reference to the current rating by the rating agencies Moody’s and Standard & Poor’s. An internal rating procedure is used for trading partners that do not have such an external rating.
The counterparty risk is based on replacement and selling risks resulting from the market value of the item in question with the individual trading partner as of the reporting date. Netting options agreed in master agreements concluded with the trading partner are also taken into account when determining the counterparty risk. If there is a netting agreement, positive and negative market values are netted for each trading partner. Otherwise, only positive market values are taken into consideration.
The nominal volume of the derivatives presented below has not been netted. It represents the sum of all purchase and sale amounts underlying the transactions. The amount of the nominal volume allows conclusions to be drawn about the extent to which derivatives have been used. However, it does not reflect the risk of the group as the derivative transactions are counterbalanced by hedged items with risks that run counter to that of the derivative. Collateral is provided or obtained for derivatives that are traded on the stock exchange.
Counterparty risk in € millions
Moody’s, S&P or internal rating
31/12/2011 31/12/2010
< 1 year 1–5 years < 1 year 1–5 years
up to A1 51.5 35.0 55.9 67.2
up to A3 100.8 40.8 71.4 63.9
Baa1 28.3 19.5 12.8 4.0
up to Baa3 11.6 6.7 3.8 3.2
below Baa3 12.8 8.0 0.5 2.0
Total 205.0 110.0 144.4 140.3

Time to act
Management report
Financial statements
Notes of the EnBW group ‹
Corporate governance
Service
_ 181
€ millions Total volume of derivatives
Nominal volume Fair value
31/12/2011 31/12/2010 31/12/2011 31/12/2010
Forward exchange transactions 3,960.6 3,373.2 150.7 124.9
Electricity options and futures 7,188.3 7,824.9 67.0 -0.8
Forward electricity transactions 22,030.5 22,635.9 -23.1 -70.8
Forward gas transactions and swaps 7,624.7 2,368.3 -20.7 6.3
Forward coal transactions and swaps 5,034.5 5,084.4 16.4 120.7
Derivatives for emission rights 1,944.8 1,138.4 -113.2 -4.6
Fixed interest paying 583.0 64.0 -11.3 -0.6
Fixed interest bearing 1,296.8 1,289.9 125.5 79.5
Other futures and derivatives 945.2 878.4 -10.3 -2.8
Total 50,608.4 44,657.4 181.0 251.8
Derivatives used for hedging purposes can be reconciled to other comprehensive income (cash flow hedge) as follows:
€ millions 31/12/2011 31/12/2010 Variance
Derivatives used in cash flow hedges with a positive fair value 179.1 294.6 -115.5
Derivatives used in cash flow hedges with a negative fair value 46.1 29.5 16.6
133.0 265.1 -132.1
Deferred tax on changes recognised directly in equity in derivatives used in cash flow hedges -27.2 -71.1 43.9
Hedge ineffectiveness -0.2 0.6 -0.8
Cascading effects -32.0 -58.0 26.0
Effects realised from hedged transactions -42.0 -33.9 -8.1
Non-controlling interests 12.1 0.1 12.0
Cash flow hedge (recognised in equity) 43.7 102.8 -59.1
The cascading effects concern the changes in market value of the futures that are part of hedges accumulated until the time of cascading.
In cascading, annual and quarterly futures are settled by other futures instead of in cash.
Changes in carrying amounts of stand-alone derivatives can be reconciled to the income statement as follows:
€ millions 31/12/2011 31/12/2010 Variance
Derivatives with a positive fair market value 1,306.8 943.2 363.6
Derivatives with a negative fair market value 1,384.5 1,036.0 348.5
Carrying amounts of stand-alone derivatives -77.7 -92.8 15.1

182 _
€ millions 2011 2010
Changes in the carrying amounts of stand-alone derivatives 15.1 -13.9
Changes in the consolidated companies and hedge accounting designation 0.0 0.9
Reclassification to non-current assets and liabilities held for sale 0.0 -2.6
Option premium paid 6.0 -0.7
Change in fair value of the derivatives 21.1 -16.3
The loss from derivatives disclosed in the income statement breaks down as follows:
€ millions 2011 2010
Fair value adjustment 21.1 -16.3
Gain/loss recognised 18.6 44.8
Hedge ineffectiveness -0.7 5.0
Gain/loss from derivatives 39.0 33.5
of which other operating income (253.5) (90.4)
of which other operating expenses (197.5) (68.5)
of which finance revenue (4.8) (13.6)
of which finance costs (21.8) (2.0)
When the derivatives are sold the gain/loss recognised reverses the previous market valuation of economically secured stand-alone derivatives. As a result of previously marking the derivatives to market, the hedged transactions are not carried out at the price hedged by the derivative, but at the current spot price.
In the interest of transparency, we have disclosed the effects from marking to market as well as the gain/loss recognised.
Risk management system As an energy company, EnBW is exposed to financial price risks in the currency, interest and commodity areas in the course of its operating activities, investments and financing transactions. In addition, there are credit and liquidity risks. It is company policy to eliminate or limit these risks by systematic risk management.
Exchange rate fluctuation between the euro and other currencies, fluctuation in interest rates on international money and capital markets as well as fluctuating prices on the markets for electricity, coal, gas and emission allowances are the main price risks for EnBW. The hedging policy used to limit these risks is set forth by the Board of Management and is documented in internal group guidelines. They also provide for the use of derivatives.

Time to act
Management report
Financial statements
Notes of the EnBW group ‹
Corporate governance
Service
_ 183
The derivatives used to hedge against financial risks are subject to the assessment criteria defined in the risk management guidelines. These include value at risk ratios and position limit and loss limit. The segregation of duties between trading and back-office processing and control is a further key element of our risk management.
The corresponding financial transactions are only concluded with counterparties with excellent credit ratings. Using suitable hedging instruments, it is possible to make use of market opportunities while hedging the risk position.
The risks arising from financial instruments as well as the methods used to assess and manage them have not been changed significantly since the prior year.
For further details on EnBW’s risk management system, we refer to our explanations given in the risk report contained in the management report.
Credit risks: EnBW is exposed to credit risks from the counterparties not performing under contractual agreements. EnBW manages its credit risks by generally demanding a high credit rating of its counterparties and limiting the credit risk with counterparties. The credit ratings of counterparties are continually monitored by EnBW’s system for managing credit ratings. Commodity and energy transactions are generally made under master agreements such as EFET, ISDA or IETA. These master agreements are generally only entered into following careful scrutiny of the counterparty’s creditworthiness. Exceptions to this business policy can be made only if it is in the justified interest of the company, e.g. in order to penetrate new markets. In terms of the customer structure, the receivables from individual counterparties are not high enough to give rise to a significant concentration of risks.
Financial investments are only made with the investment limits and counterparties defined in the treasury guidelines. Compliance with these guidelines is constantly monitored by the internal control system (ICS).
The maximum credit risk from financial assets (including derivatives with positive market value) is equivalent to the carrying amounts recognised in the balance sheet. The maximum credit risk amounts to € 15,180.9 million as of the end of the reporting period on 31 December 2011 (prior year: € 14,112.6 million).
Liquidity risks: Liquidity risks arise for EnBW from the obligation to repay liabilities completely and in time. The purpose of EnBW’s cash and liquidity management is to secure the company’s solvency at all times.
Cash management determines any cash requirements and surpluses on a central basis. By offsetting cash requirements and excess cash, the number of banking transactions is reduced to a minimum. The offsetting is carried out by cash pooling. Cash management has implemented standardised processes and systems to manage bank accounts and internal clearing accounts and perform automated payment transactions.
For liquidity management purposes, a finance plan based on cash flows is prepared centrally. As they arise, finance needs are covered by suitable liquidity management instruments. In addition to ensuring that liquidity is available on a daily basis, EnBW maintains further liquidity reserves of € 2.4 billion that are available at short notice (prior year: € 2.8 billion). The amount of liquidity reserves is based on strategic liquidity planning taking into account defined worst case parameters. The liquidity reserve is made up of contractually agreed, syndicated and free credit lines with various terms to maturity. In view of the liquidity available and existing credit lines, EnBW does not consider there to be any concentration of risk.
Further details on financial liabilities are presented in note (24), “Liabilities and subsidies”.

184 _
The tables below show future undiscounted cash flows from financial liabilities and derivative financial instruments that affect the future liquidity situation of the EnBW group.
The analysis includes all contractual obligations as of the reporting date 31 December 2011 that are disclosed in the balance sheet.
Interest and redemption payments are taken into consideration for debt instruments issued and liabilities to banks.
The interest payments on fixed-interest financial instruments are based on the contractually agreed interest rates. For financial instruments subject to floating interest, the interest rates last fixed prior to 31 December 2011 were used.
Financial instruments denominated in foreign currency are translated using the spot rate as of 31 December 2011.
Where derivatives are concerned, positive or negative market values are generally included, provided they give rise to a net outflow of resources. Undiscounted cash flows are based on the following terms and conditions:
› Swap transactions are only included in the liquidity analysis provided they give rise to a net outflow of resources.
› Forward exchange transactions are taken into account provided they give rise to an outflow of resources. › In the case of forward transactions, all calls are taken into account. The future cash flows are equivalent to
the quantities measured at the contractually agreed price. › Future transactions are not included in the liquidity analysis because they are settled by daily variation
margins and there is thus no liquidity risk.
Undiscounted cash flows
as of 31 December 2011
in € millions
Total 2012 2013 2014 2015 Cash flows > 2015
Non-derivative financial liabilities
Debt instruments issued 8,763.3 1,390.1 1,277.4 227.9 977.9 4,890.0
Liabilities to banks 1,278.1 304.6 67.9 90.2 58.9 756.5
Finance lease liabilities 442.7 107.5 102.1 102.1 77.1 53.9
Other financial liabilities 139.2 10.6 23.0 10.7 11.2 83.7
Trade payables 434.2 433.7 0.0 0.0 0.0 0.5
Other financial obligations 728.8 575.8 1.7 1.4 1.2 148.7
Derivative financial assets 2,403.7 1,316.0 942.2 137.8 5.6 2.1
Derivative financial liabilities 13,011.5 8,882.9 2,797.6 1,127.2 94.2 109.6
Total 27,201.5 13,021.2 5,211.9 1,697.3 1,226.1 6,045.0

Time to act
Management report
Financial statements
Notes of the EnBW group ‹
Corporate governance
Service
_ 185
Undiscounted cash flows
as of 31 December 2010
in € millions
Total 2011 2012 2013 2014 Cash flows> 2014
Non-derivative financial liabilities
Debt instruments issued 8,060.2 388.4 1,363.3 1,214.4 172.0 4,922.1
Liabilities to banks 1,423.4 384.5 116.4 90.2 111.4 720.9
Finance lease liabilities 547.9 108.0 103.5 102.6 178.3 55.5
Other financial liabilities 341.7 91.2 107.9 14.9 14.9 112.8
Trade payables 596.0 589.5 2.1 2.1 2.1 0.2
Other financial obligations 904.4 751.6 2.7 1.0 1.0 148.1
Derivative financial assets 7,528.9 5,539.9 1,270.1 637.9 68.9 12.1
Derivative financial liabilities 5,811.8 3,853.0 1,462.4 459.2 36.7 0.5
Total 25,214.3 11,706.1 4,428.4 2,522.3 585.3 5,972.2
The increase recorded for derivative financial assets and liabilities compared to the prior year is essentially due to a higher volume of forward transactions to purchase gas. The volume of sales, which also increased as a result, is not taken into account here. Instead, a one-sided overview is presented of all derivatives causing an outflow of resources. The netting agreements concluded with numerous trading partners are not included here either, which means that the derivatives do not directly reflect EnBW’s actual liquidity risk.
Market risks Market price risks can arise from foreign exchange and interest rate risks as well as from commodity and other price risks for shares, share-based investment funds and interest-bearing securities.
EnBW has exposure to foreign currency risk from procurement and hedging of prices for the fuel needed, as well as gas and oil trading. In addition, EnBW has currency risks arising from liabilities denominated in foreign currency. The currency risk is hedged with the help of appropriate standardised financial instruments – in the reporting period forward exchange contracts in particular – on the basis of continuously monitored exchange rate forecasts. Foreign exchange risks are hedged centrally. EnBW principally has exposure to currency risks from US dollars and Swiss francs.
The net assets tied up at foreign group entities outside the euro area and the translation risks are only hedged against exchange rate fluctuation in exceptional cases.
The effects of changes in exchange rates on the profit for the year and on equity are analysed below. The analysis was made assuming that all other parameters, such as interest rates, remain unchanged. The analysis includes financial instruments whose exchange rate exposure might affect equity or the profit for the year.

186 _
These mainly are hedging instruments from cash flow hedges and from hedges of net investments in foreign operations, stand-alone derivatives and receivables and liabilities denominated in foreign currency.
Revaluation (devaluation) of the euro by 10% against all other currencies as of the reporting date 31 December 2011 would reduce (increase) the profit for the year by € 60.0 million (prior year: € 15.1 million). This hypothetical change in profit is attributable to the euro/US dollar currency sensitivities (€ 60.0 million; prior year: € 15.1 million).
Equity would decrease (increase) by € 92.5 million as of 31 December 2011 (prior year: € 120.5 million) in the event of a 10% revaluation (devaluation). This hypothetical change in equity is attributable to the euro/US dollar and euro/Swiss franc currency sensitivities (€ 125.5 million and € -33.0 million, respectively; prior year: € 152.5 million and € -32.0 million, respectively).
EnBW uses a multitude of interest-sensitive financial instruments in order to meet the requirements of operational and strategic liquidity management. Interest rate risks only stem from floating-rate instruments.
Interest-induced changes in the market value of interest-bearing securities in the “available for sale” measurement category are presented under other price risks for shares, share-based investment funds and interest-bearing securities.
On the assets side, there is interest exposure from bank balances and on the liabilities side from floating-rate liabilities to banks. In addition, there are interest rate risks from derivatives in the form of swap transactions. EnBW mainly has interest rate risks in the euro area.
The effects of changes in interest rates on the profit for the year and on equity are analysed below. The analysis was made assuming that all other parameters, such as exchange rates, remain unchanged. The analysis includes only financial instruments whose interest rate exposure might affect equity or the profit for the year. For analysis purposes, the average change in yield over the last ten years was used.
An increase (decrease) in the level of interest rates in the euro area by 60 base points as of the reporting date 31 December 2011 in relation to the nominal volume (prior year: 50 base points) would reduce (raise) the profit for the year by € 7.0 million (prior year: € 5.7 million). The hypothetical change in profit comprises potential effects from interest derivatives of € 7.8 million (prior year: € 6.4 million), floating-rate bank balances of € -5.5 million (prior year: € -3.9 million) and primary financial liabilities subject to floating-rate interest of € 4.7 million (prior year: € 3.2 million).
In the context of our energy trading activities, EnBW enters into energy trading contracts for the purpose of price risk management, optimisation of power stations, load equalisation and optimisation of margins. Trading for own account is only permitted within narrow, clearly defined boundaries.
The price risks mostly arise from the procurement and sale of electricity, the procurement of coal, gas and oil as fuels and the procurement of emission allowances. Furthermore, EnBW is exposed to price risks from speculative items entered into in own-account trading. The price risks are hedged using appropriate financial instruments on the basis of continuously monitored forecasts of market prices. The hedging instruments used in the reporting period were forwards, futures, swaps and options.
The sensitivity of the measurement of derivatives to the price of electricity, coal, oil, gas and emission allowances is analysed below. The analysis was made assuming that all other parameters remain unchanged. It includes only derivatives whose changes in market value affect equity or the profit for the year. These are derivatives that are accounted for as stand-alone derivatives as well as derivatives used as hedging instruments in cash flow hedges.

Time to act
Management report
Financial statements
Notes of the EnBW group ‹
Corporate governance
Service
_ 187
The analysis does not include any derivatives that are intended for the purpose of receipt or delivery of a non-financial item in accordance with the entity’s expected purchase, sale or usage requirements (own use) and are not required to be accounted for in accordance with IAS 39. Our generation and distribution positions are not included in the analysis either. The sensitivities presented below therefore do not represent the actual economic risks that the EnBW group is exposed to and serve solely to satisfy the disclosure requirements of IFRS 7.
An increase (decrease) in the market price for electricity by 15% as of the reporting date 31 December 2011 (prior year: 15%) would reduce (raise) the profit for the year by € 213.3 million (prior year: € 205.5 million). A decrease (increase) in the market price by 15% as of the reporting date 31 December 2011 (prior year: 15%) would reduce (raise) equity by € 92.7 million (prior year: € 196.5 million).
A decrease (increase) in the market price for coal by 15% as of the reporting date 31 December 2011 (prior year: 20%) would reduce (raise) the profit for the year by € 112.5 million (prior year: € 33.8 million). A decrease (increase) in the market price by 15% as of the reporting date 31 December 2011 (prior year: 20%) would reduce (raise) equity by € 279.0 million (prior year: € 388.1 million).
A decrease (increase) in the market price for oil by 25% as of the reporting date 31 December 2011 (prior year: 25%) would reduce (raise) the profit for the year by € 47.6 million (prior year: € 14.1 million).
An increase (decrease) in the market price for gas by 15% as of the reporting date 31 December 2011 (prior year: 30%) would reduce (raise) the profit for the year by € 21.7 million. In the prior year, a decrease (increase) would have reduced (raised) the profit for the year by € 21.0 million.
A decrease (increase) in the market price for emission allowances by 35% as of the reporting date 31 December 2011 (prior year: 25%) would reduce (raise) the profit for the year by € 50.6 million (prior year: € 0.6 million). A decrease (increase) in the market price by 35% as of the reporting date 31 December 2011 (prior year: 25%) would reduce (raise) equity by € 5.4 million (prior year: € 0.0 million).
EnBW has investments in shares and share-based investment funds and fixed-interest securities which pose price risks for the company. When selecting securities, the company always attaches particular importance to high marketability and good credit rating. As of the reporting date 31 December 2011, shares, share-based investment funds and fixed-interest securities of € 4,557.2 million (prior year: € 5,024.9 million) were exposed to market price risks.
The effects of price risks from shares and share-based investment funds as well as interest-bearing securities on the profit for the year and on equity are analysed below. The analysis was made assuming that all other parameters, such as currency, remain unchanged. The analysis includes financial instruments whose price risks might affect equity or the profit for the year. The analysis of the market price risk of shares and share-based investment funds was carried out based on historical volatility. A standard deviation was assumed as a realistic scenario. The market risk of fixed-interest securities was analysed by modified duration. Taking into account the changes in interest rates assumed (see interest rate risk) in relation to the fair value of fixed-interest securities, earnings are determined in absolute figures. The assumptions underlying the sensitivity analysis are 17% (prior year: 18%) for shares and share-based investment funds and 3% (prior year: 2%) for interest-bearing securities.
With the risk scenario given, profit for the year would increase (decrease) by € 14.0 million (prior year: € 15.6 million). The hypothetical change in profit for the year is primarily due to fixed-interest securities in the current fiscal year. In the prior year, the change in profit for the year would have been primarily due to shares and fixed-interest securities. With the risk scenario given, equity would increase (decrease) by € 336.2 million (prior year: € 416.7 million). Of the hypothetical change in equity, an amount of € 259.0 million (prior year: € 364.4 million) is attributable to shares and share-based investment funds and € 77.2 million (prior year: € 52.3 million) to fixed-interest securities.

188 _
(28) Contingent liabilities and other financial commitments The disclosures on contingent liabilities and other financial commitments relate to the nominal values.
Contingent liabilities After the amended German Atomic Power Act (AtG) and the amended Directive on the Coverage Provisions in the Nuclear Power Industry (AtDeckV) came into force on 27 April 2002, the German nuclear power plant operators are required to provide evidence of coverage provision up to a maximum amount of € 2.5 billion per case of damage. Of this provision, € 255.6 million is covered by uniform third-party liability insurance. Nuklear Haftpflicht GbR is now restricted to a solidarity agreement to cover claims in connection with evacuation measures ordered by the authorities of between € 0.5 million and € 15 million. In proportion to their shares in nuclear power plants, group companies have undertaken to equip their operating companies with sufficient resources so that they can meet their obligations from the membership in Nuklear Haftpflicht GbR at all times.
To fulfil the subsequent coverage provision of € 2,244.4 million per claim, EnBW Energie Baden-Württemberg AG and the other ultimate parent companies of the German nuclear power plant operators agreed by contract dated 11 July, 27 July, 21 August and 28 August 2001, extended by agreement on 25 March, 18 April, 28 April and 1 June 2011, to provide financial assistance to the liable nuclear power plant operator in case of damage, after exhausting its own possibilities and those of its parent company – so that it can meet its payment obligations (solidarity agreement). According to the agreement, EnBW Energie Baden-Württemberg AG has to bear a 24.921% share of the liability as of 31 December 2011 and the same share of 24.921% as of 1 January 2012, plus 5% for costs to settle the claims. Sufficient liquidity has been provided for in the liquidity plan.
In addition, the EnBW group has the following other contingent liabilities:
€ millions 31/12/2011 Of which due in 31/12/2010
< 1 year 1–5 years > 5 years
Guarantees and collateral 291.9 227.9 19.5 44.5 192.1
Guarantees for third-party services 111.1 103.0 0.6 7.5 113.1
Contingent liabilities from pending litigation 135.3 134.9 0.4 0.0 133.6
Total 538.3 465.8 20.5 52.0 438.8
Guarantees and collateral, guarantees for third-party services and contingent liabilities from pending litigation include an amount of € 7.0 million (prior year: € 4.4 million) from joint ventures. No provisions were set up for pending litigation because the counterparty is unlikely to win the case. In addition, various court cases, investigations by authorities or proceedings and other claims are pending against EnBW. The chances of their being successful is, however, remote and they are therefore not reported under contingent liabilities.
Other financial obligations The EnBW group has long-term purchase commitments for natural gas, coal and other fossil fuels as well as electricity. In addition, there are commitments from long-term agreements for the purchase, conversion, enrichment, production and disposal of uranium. The energy and environmental services segment also has long-term commitments under disposal agreements. The total volume of these commitments amounts to € 18.5 billion (prior year: € 17.0 billion). The increase is mainly due to the rise in raw materials prices.

Time to act
Management report
Financial statements
Notes of the EnBW group ‹
Corporate governance
Service
_ 189
Sundry other financial commitments break down as follows:
€ millions 31/12/2011 Of which due in 31/12/2010
< 1 year 1–5 years > 5 years
Financial commitments from rent and lease agreements 193.3 43.3 80.8 69.2 188.0
Purchase commitment 577.9 328.5 149.0 100.4 528.5
Capital commitments for property, plant and equipment 1,144.2 851.2 288.7 4.3 1,413.5
Capital commitments for intangible assets 1.9 1.6 0.3 0.0 1.2
Financial commitments from business combinations1 481.1 144.2 298.6 38.3 474.5
Other financial commitments 308.2 31.8 73.3 203.1 414.7
Total 2,706.6 1,400.6 890.7 415.3 3,020.4
1 Financial commitments from business combinations < 1 year include investments held as financial assets amounting to € 123.6 million (prior year: € 81.9 million).
Sundry other financial commitments include obligations from joint ventures and for the acquisition of joint ventures totalling € 71.7 million (prior year: € 111.9 million). An amount of € 59.6 million thereof is attributable to future acquisitions (prior year: € 59.6 million) and € 12.1 million (prior year: € 52.3 million) to other financial commitments.
(29) Audit fees The fees of the group auditor KPMG AG Wirtschaftsprüfungsgesellschaft recorded as an expense break down as follows:
€ millions 2011 2010
Statutory audit 2.4 2.3
Other attest services 0.7 0.7
Other services 0.2 0.8
Total 3.3 3.8
(30) Exemption pursuant to Sec. 264 (3) HGB and Sec. 264b HGB In the reporting period 2011 the following German subsidiaries made use of the exemption afforded by Sec. 264 (3) German Commercial Code (HGB) and Sec. 264b HGB regarding the duty to publish financial statements in accordance with Secs. 325 to 329 HGB:
Exemption pursuant to Sec. 264 (3) HGB › EnBW Akademie Gesellschaft für Personal- und Managemententwicklung mbH, Stuttgart › EnBW Biogas GmbH, Stuttgart › EnBW Energy Solutions GmbH, Stuttgart › EnBW EnergyWatchers GmbH, Stuttgart › EnBW EnHol Beteiligungsgesellschaft mbH, Karlsruhe › EnBW Erneuerbare Energien GmbH, Stuttgart › EnBW Etzel Speicher GmbH, Karlsruhe › EnBW Gas GmbH, Stuttgart › EnBW Gas Midstream GmbH, Stuttgart › EnBW Gasnetz GmbH, Stuttgart › EnBW Kernkraft GmbH, Obrigheim

190 _
› EnBW Kommunale Beteiligungen GmbH, Stuttgart › EnBW Kraftwerk Lippendorf Beteiligungsgesellschaft mbH, Stuttgart › EnBW Kraftwerke AG, Stuttgart › EnBW Offshore Service GmbH, Klausdorf-Barhöft › EnBW Operations GmbH, Karlsruhe › EnBW Propower GmbH, Eisenhüttenstadt (formerly: PROPOWER GmbH, Eisenhüttenstadt) › EnBW REG Beteiligungsgesellschaft mbH, Stuttgart › EnBW Regional AG, Stuttgart › EnBW Solar GmbH, Stuttgart › EnBW Systeme Infrastruktur Support GmbH, Karlsruhe › EnBW Technische Dienste und kaufmännische Leistungen GmbH, Karlsruhe › EnBW Trading GmbH, Karlsruhe › EnBW Transportnetze AG, Stuttgart › EnBW Vertrieb GmbH, Stuttgart › EnBW Windpark Alt Zeschdorf GmbH, Cuxhaven › EnBW Windpark Buchholz GmbH, Cuxhaven › EnBW Windpark Schwienau II GmbH, Cuxhaven › Kernkraftwerk Obrigheim GmbH, Obrigheim › MSE Mobile Schlammentwässerungs GmbH, Karlsbad-Ittersbach › NaturEnergie+ Deutschland GmbH, Rheinfelden › Neckarwerke Stuttgart GmbH, Stuttgart › NWS Energiehandel GmbH, Stuttgart › NWS REG Beteiligungsgesellschaft mbH, Stuttgart › Teweratio GmbH, Stuttgart › TPLUS GmbH, Karlsruhe (formerly: T-plus GmbH, Karlsruhe) › TWS Kernkraft GmbH, Gemmrigheim › U-plus Umweltservice AG, Karlsruhe › Watt Deutschland GmbH, Frankfurt am Main › Watt Synergia GmbH, Frankfurt am Main › Yello Strom GmbH, Cologne
Exemption pursuant to Sec. 264b HGB › EnBW City GmbH & Co. KG, Stuttgart › EVGA Grundstücks- und Gebäudemanagement GmbH & Co. KG, Obrigheim › Facilma Grundbesitzmanagement und -service GmbH & Co. Besitz KG, Obrigheim › KMS Kraftwerke Grundbesitzmanagement und -service GmbH & Co. KG, Karlsruhe › NWS Grundstücksmanagement GmbH & Co. KG, Obrigheim › Salamander Marken GmbH & Co. KG, Karlsruhe (formerly: Salamander Marken GmbH & Co. KG,
Kornwestheim)
(31) Declaration of compliance with the German Corporate Governance Code The Board of Management and Supervisory Board of EnBW Energie Baden-Württemberg AG issued the declaration of compliance with the German Corporate Governance Code required by Sec. 161 German Stock Corporations Act (AktG) on 8 December 2011 and made it permanently available to the shareholders on the internet at www.enbw.com/declarationofcompliance.
The declaration of compliance of the listed subsidiary ZEAG Energie AG is available on the internet at www.zeag-energie.de.
(32) Share deals and shareholdings of key management personnel The company did not receive any notices in the fiscal year 2011 of transactions with EnBW shares or related financial instruments of persons in managerial positions and persons closely related to them in accordance with Sec. 15a German Securities Trading Act (Wertpapierhandelsgesetz). The EnBW shares held by all members of the Board of Management and the Supervisory Board total less than 1% of the company’s shares outstanding.

Time to act
Management report
Financial statements
Notes of the EnBW group ‹
Corporate governance
Service
_ 191
(33) Notes to the cash flow statement The cash flow statement is split up into cash flows from operating, investing and financing activities. The balance of the cash flow statement represents the change in cash and cash equivalents during the fiscal year 2011 of € 898.8 million (prior year: € 287.1 million).
Cash and cash equivalents relate almost exclusively to bank balances, largely in the form of time and call deposits.
In the fiscal year 2011, the cash flow from operating activities was € 1,740.1 million (prior year: € 2,560.9 million).
Other non-cash expenses and income break down as follows:
€ millions 2011 2010
Income from the release and retirement of construction cost subsidies -103.4 -104.5
Income and expenses from changes in specific bad debt allowances 60.1 37.7
Reversal of impairment losses on property, plant, equipment and intangible assets -1.0 -7.4
Gains on sale and income from acquisitions achieved in stages 0.0 -254.7
Write-down of inventories 100.4 0.0
Other 112.9 69.7
Total 169.0 -259.2
In the fiscal year 2011, € 71.0 million was distributed to non-controlling interests of group entities (prior year: € 45.5 million).
Purchase prices paid in cash for the acquisition of fully and proportionately consolidated entities and entities accounted for using the equity method totalled € 85.5 million in the reporting year (prior year: € 643.1 million). In the reporting year, no cash and cash equivalents were acquired in the course of share purchases (prior year: € 12.1 million). At € 83.9 million, cash payments in the reporting period primarily relate to a subsequent purchase price payment relating to the acquisition of a shareholding in EWE Aktiengesellschaft. The cash paid in the prior year mainly relates to the acquisition of Gesellschaft für die Beteiligung am Kraftwerk Rostock mbH as well as onshore wind farms. These acquisitions were paid in cash. The consideration transferred in return for the increase in the shareholding in Pražská energetika, a.s. (PRE) included Pražská teplárenská a.s. (PT) shares and a cash component of € 305.1 million.
The sales prices from the sale of fully and proportionately consolidated entities and entities accounted for using the equity method totalled € 6.3 million (prior year: € 843.9 million). There was no cash transferred from the sale of fully and proportionately consolidated entities and entities accounted for using the equity method (prior year: € 25.5 million). In the prior year, cash and cash equivalents were reduced by € 37.5 million as a result of the disposal of PT. In the reporting year, cash received primarily resulted from a capital reduction for the entity Bayerische-Schwäbische Wasserkraftwerke Beteiligungsgesellschaft mbH. The cash received in the fiscal year 2010 was mainly attributable to the sale of GESO Beteiligungs- und Beratungs-AG (GESO) and its subsidiaries. The proceeds from the sale amounted to € 834.4 million and include the settlement of group loans of € 220.6 million.

192 _
The EnBW group acquired the following assets (net of cash) and in the prior year assumed the following liabilities as part of the acquisition of entities over which it has gained control:
€ millions1 31/12/2011 31/12/2010
Intangible assets 0.0 471.0
Property, plant and equipment 0.0 1,170.6
Current assets (net of cash) 0.0 139.2
Total assets 0.0 1,780.8
Non-current liabilities 0.0 253.5
Current liabilities 0.0 152.8
Total liabilities 0.0 406.3
Net assets (net of cash) 0.0 1,374.5
1 Prior-year figures restated.
The assets (net of cash) and liabilities disposed of as part of the sale of entities over which the EnBW group lost control in 2010 relate to GESO and its subsidiaries and are presented in the notes under “Disposals of entities in 2010”.
For further explanations on the cash flow statement, please refer to the explanations given in the management report on the EnBW group’s financial position.
Funds from operations (FFO) Funds from operations (FFO) before taxes and financing declined in the reporting year by € 646.9 million to € 2,185.1 million (prior year restated: € 2,832.0 million). This is primarily due to the decrease in earnings power in the group. FFO after taxes and financing also decreased by € 364.9 million to € 2,182.0 million (prior year restated: € 2,546.9 million).
Funds from operations (FFO) in € millions 2011 2010
FFO before taxes and financing1 2,185.1 2,832.0
Income tax paid -23.5 -311.6
Interest and dividends received 389.1 381.6
Interest paid for financing activities -368.7 -355.1
FFO after taxes and financing1 2,182.0 2,546.9
1 Prior-year figures restated.
Total interest paid in the period € millions 2011 2010
Interest paid for investing activities (capitalised borrowing costs) -49.8 -50.5
Interest paid for financing activities -368.7 -355.1
Total interest paid in the period -418.5 -405.6

Time to act
Management report
Financial statements
Notes of the EnBW group ‹
Corporate governance
Service
_ 193
(34) Additional disclosures on capital management EnBW’s capital management covers the management of liabilities as well as of financial assets. Financial assets include non-current securities and loans as well as current financial assets and cash and cash equivalents. On the liabilities’ side, capital management covers financial liabilities as well as provisions for pensions and relating to nuclear power.
All deliberations on the long-term capital management at EnBW are based on a theoretical analysis of the capital market in order to determine the best possible capital structure. Both debt capital and equity are included in these deliberations. An optimum capital structure aims to minimise the total cost of capital, taking into consideration a premium for retaining financial flexibility. For EnBW, an A category rating implies that it has achieved an optimum capital structure. The analysis is performed on an ongoing basis.
Based on the mid-term planning, EnBW analyses the financial headroom for a given rating target. This determines the scope for strategic leverage. The Board of Management addresses this topic at least once a year.
Acquisitions and divestitures are key factors for the company’s financial headroom. The acquisitions and divestitures planned and performed are reviewed regularly and compared against the headroom determined.
EnBW uses a rolling planning horizon of three months for the short-term management of liquidity. EnBW also uses tools which allow forecasts to be made about liquidity requirements beyond a medium-term period.
EnBW’s capital management also extends to the active management of financial assets based on appraisals of the pension provisions as well as appraisals on the nuclear power provisions. EnBW uses a cash-flow-based model to determine the effects of the next 30 years. This model forms the basis for the management of the financial assets. It allows simulations of various alternative return and provision scenarios.
EnBW manages the financial assets in such a way that the pensions and nuclear obligations are expected to be covered up to 2032.

194 _
(35) Segment reporting 1/1–31/12/2011
in € millions
Electricity generation and
trading
Electricity grid and sales
Gas Energy and environmental
services
Holding/ consolidation
Total
Revenue
External revenue 5,449.0 10,742.6 1,817.7 780.4 0.0 18,789.7
Internal revenue 4,005.8 217.6 80.9 676.8 -4,981.1 0.0
Total revenue 9,454.8 10,960.2 1,898.6 1,457.2 -4,981.1 18,789.7
Earnings indicators
Adjusted EBIT 1,283.1 199.2 51.3 190.5 -126.0 1,598.1
EBIT 563.2 123.6 -52.9 84.7 -47.7 670.9
Amortisation and depreciation -332.3 -282.0 -74.5 -164.4 -1.7 -854.9
Impairment losses -133.6 -16.7 -99.9 -32.7 0.0 -282.9
Adjusted net loss/profit from entities accounted for using the equity method 50.4 45.1 4.3 -0.4 26.0 125.4
Net loss/profit from entities accounted for using the equity method 50.4 36.6 4.3 -0.4 -785.2 -694.3
Significant non-cash items -83.7 54.8 -22.0 -16.7 0.9 -66.7
Assets and liabilities
Capital employed 6,282.2 4,394.8 1,394.4 1,494.4 1,669.1 15,234.9
of which intangible assets, property, plant and equipment and investment property (6,832.6) (5,531.9) (1,764.2) (2,036.2) (6.6) (16,171.5)
of which carrying amount of entities accounted for using the equity method (256.0) (335.6) (52.0) (76.6) (2,085.0) (2,805.2)
Other segment information
Cash flow from operating activities 714.3 620.3 66.8 242.0 96.7 1,740.1
Capital expenditures on intangible assets and property, plant and equipment 508.3 379.1 119.4 164.8 0.0 1,171.6

Time to act
Management report
Financial statements
Notes of the EnBW group ‹
Corporate governance
Service
_ 195
1/1–31/12/2010
in € millions1
Electricity generation and
trading
Electricity grid and sales
Gas Energy and environmental
services
Holding/ consolidation
Total
Revenue
External revenue 4,817.0 10,192.7 1,788.1 711.2 0.0 17,509.0
Internal revenue 4,438.3 201.5 91.4 720.1 -5,451.3 0.0
Total revenue 9,255.3 10,394.2 1,879.5 1,431.3 -5,451.3 17,509.0
Earnings indicators
Adjusted EBIT 1,622.2 263.8 80.1 111.3 -151.3 1,926.1
EBIT 1,442.1 597.6 78.9 95.7 -89.5 2,124.8
Amortisation and depreciation -448.8 -241.5 -73.8 -166.2 -2.3 -932.6
Impairment losses -238.7 -13.4 -1.1 -4.4 0.0 -257.6
Adjusted net loss/profit from entities accounted for using the equity method 44.0 39.5 3.7 -0.4 53.4 140.2
Net loss/profit from entities accounted for using the equity method 44.0 39.5 3.7 -0.4 6.2 93.0
Significant non-cash items -186.9 13.5 6.3 -8.9 1.8 -174.2
Assets and liabilities
Capital employed 5,837.1 4,769.9 1,440.6 1,357.6 2,734.1 16,139.3
of which intangible assets, property, plant and equipment and investment property (6,771.5) (5,681.9) (1,859.6) (1,855.4) (11.2) (16,179.6)
of which carrying amount of entities accounted for using the equity method (349.8) (350.6) (52.0) (77.1) (2,923.0) (3,752.5)
Other segment information
Cash flow from operating activities 2,041.6 95.3 113.6 274.3 36.1 2,560.9
Capital expenditures on intangible assets and property, plant and equipment 933.4 383.3 92.7 215.4 0.0 1,624.8
1 Prior-year figures restated.
One of the key performance indicators is adjusted EBIT. Adjusted EBIT is an earnings ratio adjusted for non-operating effects, which accurately reflects the development of results of operations. The management report describes the development of segments on the basis of adjusted EBIT.

196 _
Adjusted EBIT can be reconciled to earnings before tax (EBT) as follows:
€ millions1 2011 2010
Adjusted EBIT 1,598.1 1,926.1
Non-operating EBIT -927.2 198.7
Earnings before interest and taxes (EBIT) 670.9 2,124.8
Investment result -646.4 103.2
Financial result -806.7 -716.7
Earnings before tax (EBT) -782.2 1,511.3
1 Prior-year figures restated.
Segment reporting is based on internal reporting. The electricity generation and trading segment comprises the value added stages of generation as well as trading and procurement. The electricity grid and sales segment comprises the value added stages of transmission, distribution and sales. The gas segment comprises the midstream area including import agreements and infrastructure, storage, trading, portfolio management as well as the downstream area including transmission, distribution and sales. The energy and environmental services segment includes the areas of thermal disposal, non-thermal disposal, water and other services including contracting services.
Assets, liabilities, revenue and expenses allocable to EnBW AG, our shareholding in EWE Aktiengesellschaft and EVN AG and other activities not allocable to the segments presented separately are disclosed in the holding/consolidation column together with eliminations. The direct costs of EnBW AG are allocated to the individual segments using allocation keys.
The segment figures have been determined in accordance with the accounting policies used in the consolidated financial statements. Internal revenue shows the level of sales between group companies. Intersegment sales were made at market prices.
The significant non-cash items principally comprise expenses from transfers to provisions and income from the release of construction cost subsidies.
Capital employed, which we use as segment assets, comprises all assets from the operating business. Non-interest-bearing liabilities – such as trade payables – are deducted. Capital employed is calculated as follows:

Time to act
Management report
Financial statements
Notes of the EnBW group ‹
Corporate governance
Service
_ 197
€ millions1 31/12/2011 31/12/2010 1/1/2010
Intangible assets 2,034.6 2,144.9 1,746.9
Property, plant and equipment 14,059.6 13,935.7 12,127.8
Investment properties 77.3 99.0 70.3
Equity investments2 3,239.5 4,166.4 4,464.8
Inventories 958.1 991.1 944.8
Current trade receivables3 3,042.6 3,187.5 2,786.3
Other assets4 2,811.8 2,234.1 4,910.8
of which income tax refund claims (183.4) (412.8) (457.1)
of which assets held for sale (209.9) (11.8) (1,698.0)
of which other tax refund claims (67.5) (77.8) (63.4)
of which derivatives (1,611.5) (1,317.3) (2,064.9)
of which payments on account made (187.4) (135.4) (134.6)
of which prepaid expenses (50.1) (61.5) (74.6)
of which sundry assets (653.5) (296.4) (464.2)
of which non-current trade receivables (525.5) (469.2) (415.9)
of which assets attributable to net debt (-677.0) (-548.1) (-461.9)
Other provisions and tax provisions -1,538.8 -1,364.8 -1,050.2
Trade payables and sundry liabilities5 -6,408.9 -5,893.7 -7,405.1
of which payments received on account of orders (-101.2) (-69.0) (-182.1)
of which trade payables (-3,519.9) (-3,161.4) (-2,797.5)
of which other deferred income (-201.5) (-227.2) (-186.0)
of which derivatives (-1,430.5) (-1,065.5) (-2,332.9)
of which other liabilities (-1,166.8) (-1,399.7) (-1,166.9)
of which liabilities directly associated with the assets classified as held for sale (-0.6) (0.0) (-768.1)
of which liabilities attributable to net debt (11.6) (29.1) (28.4)
Subsidies -1,584.4 -1,588.8 -1,519.0
Deferred taxes6 -1,456.5 -1,772.1 -1,637.2
Assets and liabilities directly associated with the assets classified as held for sale that are attributable to net debt 0.0 0.0 -60.5
Capital employed 15,234.9 16,139.3 15,379.7
1 Prior-year figures restated. 2 Including entities accounted for using the equity method, investments in affiliated entities and other investments that are allocable to operations. 3 Without affiliated entities. 4 Without affiliated entities, without non-current receivables associated with nuclear power provisions. 5 Without affiliated entities, without potential purchase price obligations recognised as liabilities to non-controlling interests. 6 Deferred tax assets and liabilities netted.
As a result of the change in the accounting policy for the obligation to dispose of fuel rods regardless of volume, retroactive restatements were performed at EnBW pursuant to IAS 8. The asset recognised in connection with the full recognition of the provision as well as the corresponding deferred taxes resulted in an adjustment to capital employed as of 1 January 2010 of € 213.2 million. An amount of € 202.6 million thereof is attributable to property, plant and equipment and € -10.6 million to deferred taxes. After the restatement capital employed breaks down by segment as follows:

198 _
Capital employed as of
1 January 2010 in € millions
Electricity generation
and trading
Electricity grid and sales
Gas Energy and environmental
services
Holding/ consolidation
Total
Capital employed 5,214.2 3,973.3 1,682.1 1,351.0 3,159.1 15,379.7
of which intangible assets, property, plant and equipment and investment property (5,815.6) (4,432.9) (1,774.8) (1,907.3) (14.4) (13,945.0)
of which carrying amount of entities accounted for using the equity method (291.9) (344.2) (36.1) (77.7) (3,006.8) (3,756.7)
External revenue by region is determined based on the place of supply. The EnBW group does not generate 10% or more of external revenue with any one external customer.
External revenue by region in € millions 2011 2010
Germany 16,189.5 15,943.0
Economic and Monetary Union without Germany 1,232.2 867.3
Rest of Europe 1,362.8 693.9
Rest of world 5.2 4.8
18,789.7 17,509.0
Intangible assets, property, plant and equipment and investment property by region in € millions1
31/12/2011 31/12/2010 1/1/2010
Germany 14,019.0 13,424.7 12,351.1
Rest of Europe 2,039.7 2,658.1 1,482.7
Rest of world 112.8 96.8 111.2
16,171.5 16,179.6 13,945.0
1 Prior-year figures restated.
(36) Related parties (entities) On 17 February 2011, NECKARPRI GmbH, an entity wholly owned by the federal state of Baden-Württemberg, purchased the 45.01% shareholding in EnBW Energie Baden-Württemberg AG (EnBW AG) previously held by E.D.F. INTERNATIONAL S.A. (EDFI), a wholly owned subsidiary of Electricité de France (EDF). Furthermore, NECKARPRI GmbH and the federal state of Baden-Württemberg (federal state) entered into the already existing shareholder agreement with Zweckverband Oberschwäbische Elektrizitätswerke (OEW) and its wholly owned subsidiary OEW Energie-Beteiligungs GmbH (OEW GmbH), thus replacing EDF and EDFI. On account of the undertaking contained in the shareholder agreement on exercising their voting rights at EnBW AG in a uniform manner, the voting rights held in EnBW AG are reciprocally attributable to the federal state and NECKARPRI GmbH and to OEW and OEW GmbH. This means that, as of 17 February 2011, related parties include in particular the federal state, NECKARPRI GmbH, OEW, OEW GmbH and entities controlled or jointly controlled by them or over which they have a significant influence.
As of 31 March 2011, OEW GmbH and NECKARPRI GmbH each directly held 45.01% of the shares in EnBW AG.
On 5 April 2011, NECKARPRI GmbH announced that it had formed the wholly owned subsidiary NECKARPRI Beteiligungsgesellschaft mbH to which it had transferred its 45.01% equity interest in EnBW AG. On 7 January 2011, NECKARPRI GmbH published a voluntary takeover offer to all shareholders of EnBW AG. By the end of the tender period on 6 April 2011, the takeover offer was accepted for 3.08% of EnBW shares. In accordance with an obligation published in the tender documents, NECKARPRI-Beteiligungsgesellschaft mbH transferred 1.54% of the EnBW shares to OEW GmbH on 11 April 2011 at the offer price. This transaction was performed

Time to act
Management report
Financial statements
Notes of the EnBW group ‹
Corporate governance
Service
_ 199
outside of the tender procedure with the aim of restoring the parity of the shareholdings of the two major shareholders. On 13 April 2011, 3.08% of EnBW shares for which the takeover offer had been accepted were transferred to NECKARPRI GmbH in return for payment of the offer price. NECKARPRI GmbH subsequently likewise contributed these shares to its subsidiary NECKARPRI-Beteiligungsgesellschaft mbH.
After closing of the transaction to ensure parity of the shareholdings, completion of the takeover offer and the transfer of EnBW shares acquired on the basis of the takeover offer to NECKARPRI-Beteiligungsgesellschaft mbH, the federal state and NECKARPRI GmbH each indirectly hold 46.55% of the shares in EnBW AG, and NECKARPRI-Beteiligungsgesellschaft mbH holds the same amount directly. Since this date, OEW indirectly holds 46.55% of the shares in EnBW AG, and OEW GmbH holds the same amount directly.
Until 17 February 2011, EnBW AG was controlled jointly by EDF and OEW. Until this date, related parties of EnBW AG included EDF, which is controlled by the French state, and the entities controlled or jointly controlled by it or over which it has a significant influence. The transactions concluded with EDF and its related parties up to 17 February 2011 essentially relate to electricity supply and electricity procurement agreements. Revenue and cost of materials came to a low nine-digit figure. Existing receivables and liabilities are due within one year. All business relations with EDF were at arm’s length. The contingent liabilities and financial commitments attributable to EDF entities are immaterial.
The transactions concluded with the federal state and entities controlled or jointly controlled by it or over which it has significant influence essentially relate to electricity supply agreements to public entities, such as universities and clinics. The revenue from these transactions was immaterial in the reporting period; most of the receivables had been settled as of 31 December 2011. All business relations with the federal state were at arm’s length. There are no contingent liabilities or financial commitments to the federal state.
There are no business relations with OEW and NECKARPRI-Beteiligungsgesellschaft mbH apart from dividends paid.
The business relations with joint ventures were as follows:
Income statement in € millions 2011 2010
Revenue 6.2 21.8
Cost of materials -7.5 -12.5
Balance sheet in € millions 31/12/2011 31/12/2010
Other loans 0.0 11.2
Receivables 0.9 2.8
Liabilities 2.0 1.5
Payments on account received 0.1 0.1
Contingent liabilities and financial commitments in € millions 31/12/2011 31/12/2010
Guarantees and collateral 56.1 45.2
Other financial commitments 0.0 6.6
Total 56.1 51.8
The revenue and cost of materials mainly result from electricity supply and electricity procurement agreements. Receivables and liabilities are due within one year. All business relations with joint ventures were at arm’s length.

200 _
In the course of ordinary business activities, relationships also exist with associates, including among others municipal entities – public utilities, in particular – that are accounted for using the equity method. Goods and service transactions with these entities took place at arm’s length and had the following impact on the income statement and balance sheet of the EnBW group:
Income statement in € millions 2011 2010
Revenue 297.2 252.7
Cost of materials -232.0 -210.1
Financial result -0.8 -4.9
Balance sheet in € millions 31/12/2011 31/12/2010
Other loans 9.9 10.1
Receivables 32.1 26.7
Liabilities 35.9 110.0
Payments on account received 0.0 0.2
Contingent liabilities and financial commitments in € millions 31/12/2011 31/12/2010
Electricity purchase commitments 337.5 302.3
Financial commitments from business combinations 0.0 0.3
Other financial commitments 0.4 4.0
Total 337.9 306.6
The receivables and liabilities of the reporting year are generally due within one year.
(37) Related parties (individuals) The EnBW group has not entered into any significant transactions with individuals that are related parties.
The basic principles of the remuneration system and amount of remuneration for the Board of Management, the Supervisory Board and former members of the Board of Management are presented in the remuneration report, which is part of the combined management report.
Total remuneration paid to the Board of Management for the fiscal year 2011 amounted to € 4.5 million (prior year: € 7.9 million). Short-term benefits amount to € 4.5 million (prior year: € 7.5 million) and long-term benefits to € 0.0 million (prior year: € 0.4 million). The addition to the pension obligations for this group of persons came to € 0.7 million in the fiscal year 2011 (prior year: € 0.6 million) including service and interest cost.
There are defined benefit obligations in accordance with IFRSs of € 5.5 million (prior year: € 4.0 million) for the current members of the Board of Management.
Former members of the Board of Management and their surviving dependants received € 5.4 million (prior year: € 5.3 million). There are defined benefit obligations to former members of the Board of Management and their surviving dependants in accordance with IFRSs of € 51.2 million (prior year: € 52.1 million).
As in the prior year, no loans or advances were granted to members of the Board of Management in the reporting year.
The remuneration system of the Supervisory Board is also presented in the remuneration report, which is part of the combined management report.
The members of the Supervisory Board will receive total remuneration of € 0.9 million (prior year: € 1.1 million) for the fiscal year 2011. The remuneration includes fixed and variable components, attendance fees and board remuneration of subsidiaries.
As in the prior year, no loans or advances were granted to members of the Supervisory Board in the fiscal year 2011.

Time to act
Management report
Financial statements
Notes of the EnBW group ‹
Corporate governance
Service
_ 201
(38) Additional disclosures List of shareholdings pursuant to Sec. 313 (2) HGB as of 31 December 2011
Footnote Capital share1
(%)
Equity2 (in
€ thousands)
Earnings2
(in € thousands)
Electricity generation and trading segment
Fully consolidated entities
1 EnAlpin AG, Visp/Switzerland 6 100.00 177,638 21,245
2 EnBW Kraftwerk Lippendorf Beteiligungsgesellschaft mbH, Stuttgart 3 100.00 297,640 -
3 EnBW Kraftwerke AG, Stuttgart 3 100.00 1,063,141 -
4 EnBW Trading GmbH, Karlsruhe 3 100.00 3,401 -
5 Energiedienst AG, Rheinfelden 100.00 194,340 34,317
6 KMS Kraftwerke Grundbesitzmanagement und -service GmbH & Co. KG, Karlsruhe 100.00 235,319 4,175
7 TWS Kernkraft GmbH, Gemmrigheim 3 100.00 149,297 -
8 EnBW Holding A.S., Gümüssuyu-Istanbul/Turkey 99.99 92,955 126
9 EnBW Kernkraft GmbH, Obrigheim 3 99.80 10,000 -
10 Energiedienst Holding AG, Laufenburg/Switzerland 6, 11 66.67 710,898 96,783
Proportionately consolidated entities
11 Borusan EnBW Enerji yatırımları ve Üretim Anonim Şirketi, Istanbul/Turkey 6, 10 50.00 163,969 -30,650
12 Rheinkraftwerk Iffezheim GmbH, Iffezheim 10 50.00 94,023 1,995
Associates
13 Bayerische-Schwäbische Wasserkraftwerke Beteiligungsgesellschaft mbH, Grundremmingen - 37.80 86,870 8,509
14 Elektrownia Rybnik S.A., Rybnik/Poland 5 32.45 313,444 81,471
15 Großkraftwerk Mannheim AG, Mannheim 5 32.00 114,142 6,647
16 Mátrai Erömü ZRt. (MATRA), Visonta/Hungary 5 21.71 309,035 71,914
Electricity grid and sales segment
Fully consolidated entities
17 EnBW Regional AG, Stuttgart 3 100.00 415,814 -
18 EnBW Transportnetze AG, Stuttgart 3 100.00 178,141 -
19 EnBW Vertrieb GmbH, Stuttgart 3 100.00 349,131 -
20 Energiedienst Netze GmbH, Rheinfelden 100.00 30,165 -6,990
21 EVGA Grundstücks- und Gebäudemanagement GmbH & Co. KG, Obrigheim 100.00 91,621 12,560
22 Facilma Grundbesitzmanagement und -service GmbH & Co. Besitz KG, Obrigheim 100.00 199,595 8,751
23 NaturEnergie AG, Grenzach-Whylen 6 100.00 6,815 -729
24 Netzgesellschaft Ostwürttemberg GmbH, Ellwangen 3 100.00 135 -
25 NWS Grundstücksmanagement GmbH & Co. KG, Obrigheim 100.00 320,933 47,873

202 _
Footnote Capital
share1
(%)
Equity2 (in
€ thousands)
Earnings2 (in
€ thousands)
26 PREdistribuce a.s., Prague/Czech Republic 5 100.00 755,436 35,982
27 Stadtwerke Düsseldorf Netz GmbH, Düsseldorf 3, 5 100.00 1,000 -
28 Watt Deutschland GmbH, Frankfurt am Main 3 100.00 4,896 -
29 Yello Strom GmbH, Cologne 3 100.00 1,100 -
30 EnBW Ostwürttemberg DonauRies AG, Ellwangen 3 99.73 115,439 -
31 ZEAG Energie AG, Heilbronn 98.26 156,379 13,573
32 Stadtwerke Düsseldorf AG, Düsseldorf 5 54.95 370,470 61,054
33 Pražská energetika a.s., Prague/Czech Republic 9 41.40 377,517 87,740
Proportionately consolidated entities
34 Pražská energetika Holding a.s., Prague/Czech Republic 5, 10 49.00 277,616 49,505
Associates
35 Budapesti Elektromos Müvek Nyrt. (ELMÜ), Budapest/Hungary 5 27.25 892,346 27,142
36 Eszak-Magyarországi Áramszolgáltató Nyrt. (EMASZ), Miskolc/Hungary 5 26.83 311,753 19,983
37 FairEnergie GmbH, Reutlingen 4, 5 24.90 90,766 -
38 Stadtwerke Karlsruhe GmbH, Karlsruhe 4, 5 20.00 165,710 -
Gas segment
Fully consolidated entities
39 EnBW Gas GmbH, Stuttgart 3 100.00 129,722 -
40 GasVersorgung Süddeutschland GmbH, Stuttgart (formerly: Erdgas-Beteiligungsgesellschaft Süd mbH, Stuttgart) 3, 8 100.00 65,000 -
41 Erdgas Südwest GmbH, Karlsruhe 79.00 40,238 8,412
Proportionately consolidated entities
42 Friedeburger Speicherbetriebsgesellschaft mbH "Crystal", Friedeburg 10 50.00 151,147 -4,139
Energy and environmental services segment
Fully consolidated entities
43 EnBW City GmbH & Co. KG, Stuttgart 100.00 8,885 9,523
44 EnBW Immobilienbeteiligungen GmbH, Stuttgart 100.00 400,144 9,295
45 EnBW Kommunale Beteiligungen GmbH, Stuttgart 3 100.00 995,226 -
46 EnBW Operations GmbH, Karlsruhe 3 100.00 10,200 -
47 EnBW Systeme Infrastruktur Support GmbH, Karlsruhe 3 100.00 16,500 -
48 U-plus Umweltservice AG, Karlsruhe 3 100.00 167,533 1,842
49 AWISTA Gesellschaft für Abfallwirtschaft und Stadtreinigung mbH, Düsseldorf 5 51.00 40,124 9,596
Associates
50 Zweckverband Landeswasserversorgung, Stuttgart 5 27.20 108,240 170
51 Zweckverband Bodensee-Wasserversorgung, Stuttgart 5 22.16 145,077 0

Time to act
Management report
Financial statements
Notes of the EnBW group ‹
Corporate governance
Service
_ 203
Footnote Capital
share1 (%)
Equity2 (in
€ thousands)
Earnings2
(in € thousands)
Financial and other holdings
Fully consolidated entities
52 EnBW International Finance B.V., Amersfoort/Netherlands 100.00 857,027 26,845
53 Neckarwerke Stuttgart GmbH, Stuttgart 3 100.00 1,099,156 34,142
Associates
54 EVN AG, Maria Enzersdorf/Austria 7 32.47 1,819,450 193,890
55 EWE Aktiengesellschaft, Oldenburg 5 26.00 2,252,500 46,200
1 Shares of the respective parent company calculated pursuant to Sec. 313 (2) German Commercial Code (HGB) (as of 31 December 2011). 2 In the case of separate entities, the figures stem from financial statements prepared pursuant to local principles and do not show the contributions of each company to
the consolidated financial statements. For financial statements in foreign currency, equity is translated at the mean rate on the reporting date, while earnings and revenue are translated at average annual rates.
3 Profit and loss transfer agreement and/or domination agreement. 4 Profit and loss transfer agreement with third parties. 5 Prior-year figures. 6 Preliminary figures. 7 Diverging fiscal year. 8 Held via EnBW Eni Verwaltungsgesellschaft mbH, Karlsruhe (EnBWshareholding: 50%), which is fully consolidated by virtue of the casting vote regulation. 9 Control due to contractual agreement. 10 Joint control. 11 Before taking treasury shares of the company into account.
204 _
(39) Disclosures concerning franchises Franchise agreements in the areas of electricity, gas, district heating and water are in place between the individual entities in the EnBW group and the municipalities. The majority of the franchise agreements have a term of 20 years. There are obligations governed by law to connect to the supply networks. Under the franchise agreements, the EnBW group is obliged to provide and maintain the facilities required to satisfy the general supply needs. In addition, it is required to pay a franchise fee to the municipalities. Upon expiry of a franchise agreement, the facilities must be returned or transferred to the municipalities or the successor network operator in return for reasonable compensation, unless the franchise agreement is extended.
(40) Subsequent events There were no events after 31 December 2011 which would be significant for assessing the net assets, financial position and results of operations of EnBW.
(41) Future-oriented statements This report contains statements relating to the future that are based on current assumptions and projections of the management of EnBW. Such statements are subject to risks and uncertainties. These and other factors mean that the actual results, financial position, development or performance of the company may diverge materially from the estimates made here. EnBW assumes no obligation of any kind to update future-oriented statements or to adjust them to reflect future events or developments. Karlsruhe, 15 February 2012 EnBW Energie Baden-Württemberg AG
Villis Dr. Beck Kusterer
Dr. Mausbeck Dr. Zimmer

Time to act
Management report
Financial statements
Audit opinion ‹
Corporate governance
Service
_ 205
We have audited the consolidated financial statements prepared by EnBW Energie Baden-Württemberg AG, Karlsruhe, comprising the income statement, the statement of comprehensive income, the balance sheet, the cash flow statement, the statement of changes in equity as well as the notes to the financial statements, together with the combined management report of the company and the group, for the fiscal year from 1 January to 31 December 2011. The preparation of the consolidated financial statements and the combined management report in accordance with IFRSs as adopted by the EU, and the additional requirements of German commercial law pursuant to Sec. 315a (1) HGB [“Handelsgesetzbuch”: German Commercial Code] is the responsibility of the company’s Board of Management. Our responsibility is to express an opinion on the consolidated financial statements and on the combined management report based on our audit.
We conducted our audit of the consolidated financial statements in accordance with Sec. 317 HGB and German generally accepted standards for the audit of financial statements promulgated by the Institut der Wirtschaftsprüfer [Institute of Public Auditors in Germany] (IDW). Those standards require that we plan and perform the audit such that misstatements materially affecting the presentation of the net assets, financial position and results of operations in the consolidated financial statements in accordance with the applicable financial reporting framework and in the combined management report are detected with reasonable assurance. Knowledge of the business activities and the economic and legal environment of the group and expectations as to possible misstatements are taken into account in the determination of audit procedures. The effectiveness of the accounting-related internal control system and the evidence supporting the disclosures in the consolidated financial statements and the combined management report are examined primarily on a test basis within the framework of the audit. The audit includes assessing the annual financial statements of those entities included in consolidation, the determination of entities to be included in consolidation, the accounting and consolidation principles used and significant estimates made by the Board of Management, as well as evaluating the overall presentation of the consolidated financial statements and the combined management report. We believe that our audit provides a reasonable basis for our opinion.
Our audit has not led to any reservations.
In our opinion, based on the findings of our audit, the consolidated financial statements comply with IFRSs as adopted by the EU, the additional requirements of German commercial law pursuant to Sec. 315a (1) HGB and give a true and fair view of the net assets, financial position and results of operations of the group in accordance with these requirements. The combined management report is consistent with the consolidated financial statements and as a whole provides a suitable view of the group’s position and suitably presents the opportunities and risks of future development. Mannheim, 15 February 2012 KPMG AG Wirtschaftsprüfungsgesellschaft
Walter Woche Wirtschaftsprüfer Wirtschaftsprüfer [German Public Auditor] [German Public Auditor]
Audit opinion

206 _
We assure to the best of our knowledge that, in accordance with the applicable accounting principles, the consolidated financial statements give a true and fair view of the net assets, financial position and results of operations of the group and that the group management report, which has been combined with the management report of the company, gives a true and fair view of the business development including the result and situation of the group and also describes the significant opportunities and risks relating to the anticipated development of the group for the remaining fiscal year. Karlsruhe, 15 February 2012 EnBW Energie Baden-Württemberg AG
Villis Dr. Beck Kusterer
Dr. Mausbeck Dr. Zimmer
Declaration of the legal representatives

_ 207
Corporate governance
208 Declaration of compliance and corporate governance report
208 Board of Management and Supervisory Board
210 Compliance
211 Remuneration report
217 Transparency
217 Financial reporting and annual audit
217 Declaration of compliance
218 Comments on the suggestions of the German Corporate Governance Code
219 The Supervisory Board
222 Offices held by members of the Board of Management
223 Other offices held by members of the Supervisory Board

208 _
Responsible and transparent management forms the basis and guiding principle for all our activities. We are convinced that good corporate governance builds the trust placed in the company by investors, customers, employees and the general public and leads to sustainable value added. Observing the principles of the social market economy, EnBW’s Board of Management and Supervisory Board consequently make sure that the company is able to continue as a going concern and generate sustainable value added.
As in past years, Dr. Bernhard Beck, the corporate governance officer at the level of the Board of Management, monitored compliance at EnBW with the German Corporate Governance Code and reported extensively on current corporate governance issues to the Board of Management and the Supervisory Board. Both boards acknowledged his report and thereupon issued the declaration of compliance that is reprinted in full at the end of this report.
Board of Management and
Supervisory Board
Close and trusting cooperation between the Board of Management and the Supervisory Board in the interest of the company is an essential part of EnBW’s corporate culture.
The Board of Management that is currently made up of five persons manages the company jointly at its own responsibility. More information on the members of the Board of Management and the allocation of responsibilities on the board can be found on pages 8 and 9 of the annual report and in the “Management and supervision” section of the management report on pages 43 and 44 of the annual report. The Supervisory Board also considers diversity when selecting the members of the Board of Management and most of all aims to appropriately consider women in its choice for new appointments to the Board of Management. Attention will therefore be paid to a corresponding selection of candidates.
The duty of the Board of Management is to develop the strategy of the EnBW group, to coordinate it with the Supervisory Board and correspondingly implement the same. In addition, it ensures group-wide compliance with the law as well as appropriate risk management and risk controlling. Key aspects of the work on the Board of Management are set forth in the board’s rules of procedure. Among other things, these govern the regular weekly board meetings chaired by
the CEO and stipulate that all issues of relevance for the management of the group and cross-functional matters be addressed at those meetings. In addition, the rules of procedure include a regulation that resolutions are taken by the Board of Management according to the majority principle, with the CEO casting the decisive vote in accordance with Art. 7 (2) of the articles of incorporation and bylaws in the event of a tie.
There is an age limit of 63 years for members of the Board of Management at EnBW. The members of EnBW’s Board of Management did not sit on more than three supervisory boards of listed companies outside the group or supervisory bodies with comparable duties. As in the past. there was again no conflict of interest regarding members of the Board of Management in the fiscal year 2011.
With regard to appointments to management positions in the EnBW group, the Board of Management gives due consideration to diversity and most of all aims to appropriately consider women in its choice. In practice, EnBW understands diversity to mean, among other things, the company respecting the different spheres and phases of our managers’ lives, and seeing and promoting each individual as an asset to the company. EnBW considers it wise and worthwhile to employ women at all levels of the hierarchy and has defined increasing the share of women in managerial positions as a strategic personnel objective of the group. In order to successively increase the share of women at all management levels, attention is paid that there is at least one female candidate among the final selection for management levels through to middle management. Further measures aimed at achieving this objective include providing targeted encouragement and support for women, for instance by establishing a women’s network. As part of this network, a mentoring programme was held for the first time for women aiming for a management career.
The Supervisory Board has 20 members, and is made up of an equal number of shareholder and employee representatives. More information on the members of the Supervisory Board can be found on pages 225 and 226 of the annual report and in the “Management and supervision” section of the management report on page 44 of the annual report.
In line with the dual management and control structure prescribed by the German Stock Corporations Act (AktG), the basic duty of the Supervisory Board is to advise and monitor the Board of Management in its management of the
Declaration of compliance and corporate governance report

Time to act
Management report
Financial statements
Corporate governance
Declaration of compliance and corporate governance report ‹
Service
_ 209
company on an ongoing basis. All members of the Supervisory Board generally have the same rights and duties. They are not bound by orders or instructions. The Supervisory Board has set forth key aspects of cooperation in its rules of procedure. They provide for the Supervisory Board to be convened on a regular basis for ordinary meetings and, as necessary, for extraordinary meetings that are led by the chairperson. The members of the Board of Management attend the meetings, unless stipulated otherwise by the chair of the Supervisory Board or the committee. The Board of Management keeps the Supervisory Board informed regularly, without delay and comprehensively, in accordance with the Supervisory Board’s rules of procedure, in particular of any matters pursuant to Sec. 90 German Stock Corporations Act, all key financial indicators and risks of the company and the group as well as their development, risk management, the internal control system, compliance and any other significant events. As a rule, the reports are issued in writing, but the Board of Management does also provide oral reports at the Supervisory Board meetings. The Supervisory Board’s rules of procedure specify certain transactions and measures that the Board of Management may only undertake subject to the approval of the Supervisory Board. In addition, the Supervisory Board’s rules of procedure regulate that resolutions are taken according to the majority principle, with the chairman of the Supervisory Board casting the decisive vote in accordance with Art. 12 (4) of the articles of incorporation and bylaws in the event of a tie. At the request of the chairman of the Supervisory Board, resolutions may also be taken between meetings unless the majority of the Supervisory Board members object. The Supervisory Board provides detailed information about the focus of its work and deliberations in fiscal 2011 in its report to the annual general meeting on pages 10 to 15 of the annual report.
In the interest of enhancing the efficiency of its work and to deal with complex matters, the Supervisory Board has created committees with appropriately qualified members. There is a personnel committee, a finance and investment committee, a nomination committee, an audit committee, an ad hoc committee and the mediation committee required pursuant to Sec. 27 (3) German Co-determination Act (MitbestG). A list of the Supervisory Board committees and their members can be found on page 227 of the annual report. The chair of a committee or a designated member reports to meetings of the full Supervisory Board on the resolutions, recommendations and conclusions reached by that committee. The Supervisory Board committees do not have any rules of procedure of their own; the rules contained in the Supervisory Board’s rules of procedure apply to them by analogy.
Since 28 July 2011, the audit committee has been chaired by Gunda Röstel who, as long-term managing director of Stadtentwässerung Dresden GmbH and authorised signatory
at Gelsenwasser AG, has specific knowledge and experience with the application of accounting principles and internal control systems. Gunda Röstel is independent and not a former member of EnBW’s Board of Management. The other members with specific knowledge and experience with the application of accounting principles and internal control systems are Thomas Piquemal, chair of the audit committee from 4 February 2011 to 17 February 2011, who gained knowledge and experience as Group Senior Executive Vice President, Finance, at Electricité de France (EDF), and Heinz Seiffert, chair of the audit committee from 18 April 2011 to 19 April 2011, who gained knowledge and experience as long-term district administrator of the Alb-Donau district and former financial affairs spokesman of the CDU/CSU parliamentary group in the lower house of the German parliament. Thomas Piquemal and Heinz Seiffert were also independent and neither is a former member of EnBW's Board of Management.
Once again in the reporting period, the Supervisory Board dealt with the independence criteria of the German Stock Corporations Act (AktG) and the German Corporate Governance Code. It reached the conclusion that these are satisfied, as was already the case in the past. In addition, there were no consulting or other service agreements or contracts to produce a work between EnBW and its group companies, on the one hand, and members of the Supervisory Board and parties related to them, on the other, in the reporting year.
The Supervisory Board has defined concrete goals as to its own composition, which are adjusted to the company’s specific situation. These goals are primarily intended to ensure that its members, seen as a whole, have the necessary knowledge, skills and professional experience to properly perform their duties. The members of the Supervisory Board should further have wide-ranging specialist expertise in the fields of competence of significance for the company. In this context, the Supervisory Board aims to increase the share of women on the Supervisory Board as a whole to 20% by 2016, while taking into account the company’s specific shareholder composition, which mainly consists of municipal authorities with democratically elected representatives. Appropriate consideration is given to the company’s international activities with the current appointments to the Supervisory Board. The Supervisory Board strives to maintain this situation and will, to this end, take into consideration in proposals to the annual general meeting those candidates who, on account of their origins, education or professional activities, have special international skills and experience. Nevertheless, with regard to the structure and business operations of the company, the Supervisory Board does not deem it necessary to set targets as to the numbers of international members. In order to permit independent advice to and supervision of the Board of Management, the Supervisory Board pays attention to avoiding potential conflicts of interest. The Supervisory Board may not have

210 _
more than two former members of the Board of Management at any time. The Supervisory Board members may not be on any board or act in an advisory capacity at any of the company’s major competitors. In addition, the rules of procedure of the Supervisory Board stipulate that when proposing candidates to the annual general meeting attention should be paid to the fact that the candidates are no older than 70 years of age at the time of their election.
When making its proposals to the annual general meeting, the Supervisory Board ensures that the candidates for election to the Supervisory Board have the necessary knowledge and skills and takes into account the aforementioned goals. No former members of the Board of Management are members of EnBW’s Supervisory Board.
The company provides appropriate support to the members of the Supervisory Board in the performance of their duties with the necessary training measures. For example, EnBW keeps them informed of current legal or economic developments and, as necessary, any other topics relevant to their work on the Supervisory Board. Furthermore, as part of a separate event, the company provides newly appointed members with documents containing all important regulations relating to the work of the Supervisory Board and all material information on the company and the EnBW group.
Our actions are governed by compliance with the provisions of the law and regulations as well as voluntary principles and group policy. In the fiscal year 2011, as was already the case in the prior year, the Board of Management debated compliance issues on an ongoing basis and discussed them in depth with the Supervisory Board and the audit committee. Further details are provided in the section below. It also gives an overview of relevant key corporate governance practices that go beyond the legal requirements and the recommendations and suggestions of the German Corporate Governance Code.
More information on the procedures of the Board of Management and of the Supervisory Board, including its committees, can be found in the “Management and supervision” section in the management report on pages 43 to 44 of the annual report, the report of the Supervisory Board on pages 10 to 15 of the annual report and also in Art. 7 to 13 and 19 of the company’s articles of incorporation and bylaws that can be accessed on EnBW’s website (www.enbw.com) under “Corporate governance” in the “Investors” section.
Prior to the annual general meeting, EnBW publishes the agenda and all reports and documents of relevance for an assessment, including the current annual report, in readily accessible form on its internet pages at www.enbw.com. Countermotions to the annual general meeting’s agenda received before the deadline are also made available on the website together with a statement by the Board of
Management. Our shareholders also have the possibility of delegating their rights to proxies appointed by the company if they are not able to attend the annual general meeting in person. In the past few years, the annual general meeting has been broadcast live via the internet until the end of the CEO’s speech.
Compliance
The topic of compliance, i.e. with the law and corporate guidelines, was once again given high priority at EnBW in the fiscal year 2011. The corporate governance function created in 2009 drafts the annual compliance programme on the basis of a thorough risk analysis, monitors implementation of the defined measures throughout the group and reports on a regular basis to the Board of Management, Supervisory Board and audit committee. At the level of the holding company, the corporate compliance function is supported by a compliance committee and at the level of the group entities by local compliance officers. A task force was set up within the compliance committee to handle compliance issues and suspected violations in standardised procedure. Cooperation between the corporate compliance function and the internal control system, group audit department and group risk management functions was further intensified in the fiscal year 2011.
The EnBW group’s code of conduct gives all employees an overview of the most important external and internal regulations. Since its publication in 2009, ongoing communication measures and a group-wide training campaign have been central to imparting the message. In 2011, the corporate compliance function organised a large number of face-to-face training events for sensitive areas. In addition, special training was provided for the managing directors, members of the Board of Management and Supervisory Board members of group entities.
The establishment of a centrally controlled guideline management system has provided corporate governance with greater transparency regarding the company’s internal regulations. All existing regulations were reviewed as part of a simplification process that continued until the end of 2011. This made it possible to update and significantly streamline the content of the regulations.
New regulations on how to review business partners came into effect at EnBW in 2011. These provide for careful selection and review of business partners with regard to the risk of corruption and infringements of social and environmental standards. The objective of the regulations is to avoid financial damage and reputational risks to EnBW, in particular in connection with its international activities.
Since 2009, all employees and executives have been able to use the corporate compliance function’s advice hotline to
Time to act
Management report
Financial statements
Corporate governance
Declaration of compliance and corporate governance report ‹
Service
_ 211
obtain answers to their compliance questions. This hotline was very well used in 2011. The questions received mainly related to the taking and granting of benefits as well as the issue of donations and sponsoring. The extensive use of the advice hotline is a sign that the measures to sensitise employees have had the desired effect.
Remuneration report
The remuneration report summarises the principles applied to determine the remuneration of members of the Board of Management and explains the structure and amount of the board remuneration and the remuneration of the Supervisory Board.
The remuneration report takes into consideration the recommendations of the German Corporate Governance Code and the requirements of the German Accounting Standard (GAS) 17 (amended in 2010). It further contains the disclosures required by German commercial law and the supplementary provisions of the German Act on the Appropriateness of Management Board Remuneration (VorstAG) in the notes to the financial statements in accordance with Sec. 314 German Commercial Code (HGB) and the management report in accordance with Sec. 315 HGB.
The remuneration report is included in the management report and is reprinted in the annual report as part of the corporate governance report.
Remuneration of the Board of Management Based on a proposal of the personnel committee, the Supervisory Board passes a resolution on the remuneration of the Board of Management including the main contract elements and reviews it on a regular basis. The criteria for determining appropriate remuneration include the responsibilities and performance of the members of the Board of Management, the economic situation, the company’s performance and its sustainable development.
The Board of Management’s remuneration consists of the following main components:
Fixed remuneration This comprises a fixed basic annual salary, of which only a part counts towards pension claims, as well as other remuneration and the minimum bonus (30% of the basic annual salary) agreed as part of the short-term incentive (STI). The minimum bonus no longer applies in the case of new appointments and reappointments since 7 July 2010.
Variable remuneration › STI (contracts prior to implementation of the VorstAG): The
variable component of the STI is disclosed as variable remuneration. The STI depends on the extent to which annual targets are met. These include financial targets at
group level measured using the performance indicators EBITDA and ROCE in addition to individual targets. The Supervisory Board performed a weighting of these targets at the beginning of the fiscal year. The STI may not exceed 200% of the average fixed annual basic remuneration.
› Performance bonus (for new appointments and reappointments as of 7 July 2010): The performance bonus depends on the extent to which annual targets were met. These include financial targets at group level measured using the performance indicators EBITDA and ROCE in addition to individual targets. The Supervisory Board performed a weighting of these targets at the beginning of the fiscal year. The performance bonus may not exceed 200% of the average fixed annual basic remuneration. The performance bonus is based on targets being reached over an overall period of three years: The share of the performance bonus for individual targets (30%) for the respective assessment year is paid out right away; the share of the performance bonus for corporate targets (70%) is divided into three. The first third is likewise paid out immediately. The remaining two shares (deferral 1 and deferral 2) are adjusted to reflect the extent to which corporate targets are met in subsequent years. Interest of 3% per annum is paid on these shares, which are then paid out following ratification of the respective financial statements for subsequent year 1 and subsequent year 2. Payment is made subject to the condition that a minimum level is achieved.
› Long-term incentive (LTI): The LTI depends on the relative increase in value of the group. This is determined by reference to the increase in value of net equity. This is determined by comparing the mean averages of net equity for two three-year periods. The LTI can range between 0% and 85% of a member of the Board of Management’s average fixed annual basic remuneration and between 0% and 100% for the chair of the Board of Management. This is supplemented by a component that measures the relative performance of the group against a peer group of competitors based on the net equity. This can lead to a change of ±20% on the LTI determined by reference to the net equity value. The payment is made after ratification of the annual financial statements, but not before three years’ service on the Board of Management.

212 _
The remuneration of the members of the Board of Management in fiscal year 2011 (prior-year figures in brackets):
in € Fixed remuneration Variable remuneration Total
Basic remuneration
Other remuneration1
Minimum bonus (STI)
Without long-term
incentive (STI/perform-
ance bonus)2
Long-term incentive (LTI)2
Hans-Peter Villis, chairman 850,000 (850,000)
13,977(16,528)
255,000(255,000)
789,900(1,285,025)
187,533 (754,833)
2,096,410(3,161,386)
Dr. Bernhard Beck, LL.M. 500,000 (500,000)
50,477(48,364)
150,000(150,000)
374,500(750,500)
99,000 (425,127)
1,173,977(1,873,991)
Thomas Kusterer (since 1 April 2011)
337,500 (-)
11,040(-)
-(-)
195,413(-)
-3 (-)
543,953(-)
Dr. Dirk Mausbeck (since 1 October 2011)
100,000 (-)
4,869(-)
-(-)
56,300(-)
-3 (-)
161,169(-)
Christian Buchel (until 31 May 2011)
187,500 (445,833)
8,363(19,014)
56,250(133,750)
128,586(677,279)
83,934 (354,833)
464,633(1,630,709)
Dr. Rudolf Schulten (until 11 March 2010)
- (88,306)
-(19,778)
-(129,452)
-(– 10,800)
- (76,500)
-(303,237)
Dr. Hans-Josef Zimmer (until 20 July 2010)
- (249,194)
-(21,639)
-(74,758)
4,622(376,967)
37,400 (248,195)
42,022(970,753)
Total 1,975,000 (2,133,333)
88,726(125,323)
461,250(742,960)
1,549,320(3,078,971)
407,867 (1,859,488)
4,482,163(7,940,076)
1 Other remuneration includes fringe benefits, specifically from company cars of € 86,660 (prior year: € 106,181) and from expense allowances of € 2,066 (prior year: € 2,413). 2 Differences between the amounts included in prior years and the actually agreed amounts are included in the total remuneration for 2011. If the actually agreed amounts are lower than the
provisions set up in the prior year, this can produce negative amounts. 3 The deferrals for Thomas Kusterer and Dr. Dirk Mausbeck currently amount to € 98,795 and € 29,273, respectively.
Compensation agreed with the Board of Management in the event of termination of service During their first term of office, members of the Board of Management are generally not entitled to retirement benefits or termination benefits. There is a special arrangement with Hans-Peter Villis for payment of a fixed amount of € 130,000 p.a. already in his first term of office in the following three cases: upon reaching the age of 63, in the event that he becomes permanently disabled, or if the contractual relationship is terminated or not extended before he reaches the age of 63, provided the reason for the termination or non-extension is not related to his person. Half of any other remuneration is credited until retirement age is reached. For this purpose, € 1,009,845 was added to provisions in the fiscal year. This amount corresponds to the present value of the obligation.
As of his first term of office, Thomas Kusterer has a vested right to retirement benefits. In the case of Dr. Dirk Mausbeck, the entitlement to retirement benefits arises from the contractual provisions relating to his prior work within the group.
From the second term of office onwards, the pension entitlements from the age of 63 or in the event of permanent disability are as follows: The vested benefits rise in proportion to the term of office on the Board of Management and are capped at 60% of the pensionable basic annual salary. Unless benefits have already become vested by operation of law, they become vested as of the second term of office. The rates of increase are generally set such that the maximum post-employment benefit is reached at the same time as the contractually agreed age limit. Other company pension entitlements acquired are credited once the maximum pensionable basic annual salary has been exceeded.
When the benefit obligations become due for payment, the payments are indexed in accordance with the German Company Pensions Act (BetrAVG).
In the event that a member of the Board of Management dies, the surviving dependants are entitled to continued payment of the remuneration for three months. For as long as they live, widows receive 60% of the benefits that the member of the Board of Management received or would have received on the day they died if the pensions had been due for payment on that day. Children of the member of the

Time to act
Management report
Financial statements
Corporate governance
Declaration of compliance and corporate governance report ‹
Service
_ 213
Board of Management receive an orphan’s allowance until they reach the age of 25 (20% if they have lost both parents, 12% if they have lost one parent). The surviving dependants’ benefits are limited to 100% of the pension entitlements.
In the event that the contract with Dr. Bernhard Beck were terminated prematurely by EnBW AG, a two-year ban on competition has been arranged with Dr. Bernhard Beck. In return, Dr. Bernhard Beck is entitled to a waiting allowance during that period, amounting to 60% of his total remuneration. The total remuneration is the last basic annual remuneration plus the average variable remuneration of the last three years.
There are no termination benefit obligations in the event of premature termination of service on the Board of Management. However, termination benefits may be payable on the basis of a cancellation agreement made with the individual. In concluding management board contracts, care is taken to ensure that payments made to a member of the Board of Management on premature termination of his contract without good cause do not exceed the value of two years’ compensation (severance payment cap) and compensate no more than the remaining term of the contract.
In the event that service on the Board of Management is terminated prematurely on account of a change of control, it is agreed when signing or extending the management board contract that compensation or severance payments may not exceed more than one and a half times the settlement cap.
Thomas Kusterer and Dr. Dirk Mausbeck have been given the following change-of-control assurance: In the event of a member of the Board of Management resigning or terminating in connection with a change of control, such member will be entitled to the outstanding basic annual salary until the end of the intended term of contract but no more, however, than three basic annual salaries. This entitlement is due upon premature termination of the service agreement.
In the event of temporary unavailability for work on the part of a member of the Board of Management on account of illness or any other reason for which the member of the Board of Management is not responsible, remuneration will be paid for the first six months. The amount of the variable remuneration will be calculated from the average of the last three years and basic remuneration will be paid for a further six months. The payments in the event of unavailability for work will be made no longer than until the end of the term of the service agreement.
Diverging from this, Dr. Bernhard Beck is entitled to continued payment of his remuneration for the duration of twelve months. If he is prevented from performing his duties for more than twelve months, he is entitled to continued payment of the basic remuneration but no longer than until the end of the term of the service agreement. Hans-Peter Villis is entitled to continued payment of his remuneration for a period of no longer than until the end of the contractual term of the service agreement.
For the duration of continued payments, Hans-Peter Villis and Dr. Bernhard Beck assign to the company any claims against third parties to support payments to which they are entitled on account of the reason preventing them from performing their duties.
Christian Buchel resigned from his office effective as of 31 May 2011. His service agreement ends by mutual agreement at the end of 31 May 2011. All entitlements arise from the service agreement; no additional agreements were made in connection with the termination of Christian Buchel’s work on the Board of Management. Christian Buchel has not earned any entitlement to retirement benefits.
The disclosures for the fiscal year 2011 concerning post-employment benefits (prior-year figures in brackets) are presented below. The presentation complies with the requirements of Sec. 285 No. 9a German Commercial Code (HGB). The disclosures include the vested right as of the end of the reporting period, the annual expenses for pension obligations and the present value of the pension obligations vested as of the end of the reporting period (including pension commitments financed by the board members themselves by converting part of their salary).

214 _
Vested benefit as of 31 December 2011
Annual expenses for pension obligations (€)
Present value of the pension obligations
(defined benefit obligation) (€)
Hans-Peter Villis, chairman € 130,000(€ 130,000)
325,128 (269,081)
1,208,304(883,921)
Dr. Bernhard Beck, LL.M. 57.5%1
(55%)322,9022
(297,476) 3,229,927
(3,075,633)
Thomas Kusterer (since 1 April 2011) 30%1
(-)85,395
(-) 799,005
(-)
Dr. Dirk Mausbeck3 (since 1 October 2011) 7%4
(-)4,673
(-) 249,429
(-)
Christian Buchel3 (until 31 May 2011) 0(0)
0 (0)
0(0)
Dr. Hans-Josef Zimmer (until 20 July 2010) -(23.25%)
- (54,424)
-(879,786)
Dr. Rudolf Schulten (until 11 March 2010) -(0)
- (0)
-(0)
1 Basis for entitlement as a per cent of the pensionable annual basic remuneration currently € 350,000. 2 Including an addition to capital for pension benefits of € 33,304 (prior year: € 31,749). This is deferred compensation. 3 From the second term of office, the percentage of pensionable basic salary acquired each year is 2.5%, retroactively to the beginning of the service agreement. 4 Basis for entitlement as a per cent of the pensionable annual basic remuneration currently € 250,000.
Annual expenses for pension obligations include the service cost as well as interest cost. There are defined benefit obligations in accordance with IFRSs of € 5.5 million (prior year: € 4.0 million) for the current members of the Board of Management.
The benefits paid to former members of the Board of Management and their surviving dependants amounted to € 5.4 million (prior year: € 5.3 million). These pension payments are indexed to the percentage change in remuneration according to the collective bargaining agreement.
There are defined benefit obligations to former members of the Board of Management of EnBW and their surviving dependants in accordance with IFRSs of € 51.2 million (prior year: € 52.1 million).
As in the prior year, no loans or advances had been granted to members of the Board of Management as of the end of the fiscal year.
Remuneration of the Supervisory Board The members of the Supervisory Board each receive fixed remuneration of € 15,000 payable at the end of a fiscal year in addition to reimbursement of their expenses for the entire fiscal year 2011 and for subsequent fiscal years. They also receive variable remuneration each fiscal year based on the respective EBITDA generated by the EnBW group each fiscal year. For each full € 10 million that the EBITDA achieved in the respective fiscal year exceeds the assessment base of € 1,500 million, each member of the Supervisory Board receives remuneration of € 250. The amount of the
variable remuneration is capped, however, at € 20,000 per annum. The payment of the variable remuneration is made following the annual general meeting at which the resolution is passed on exoneration of the members of the Supervisory Board for the past fiscal year. The chairman of the Supervisory Board receives twice the above amounts and the deputy chairman of the Supervisory Board receives one-and-a-half times the above amounts.
Members of the Supervisory Board receive fixed remuneration of € 5,000 per fiscal year to offset the additional work involved in any activities in one or more Supervisory Board committees. The chair of one or more committees receives twice the amount of the remuneration for the committee work, unless the respective committee has not met in the fiscal year concerned.
Supervisory Board members who belong to the Supervisory Board or a committee or acted as chair for only part of the fiscal year are paid remuneration proportionately to the duration of their office or their position in that fiscal year.

Time to act
Management report
Financial statements
Corporate governance
Declaration of compliance and corporate governance report ‹
Service
_ 215
In addition, the Supervisory Board members receive an attendance fee of € 500 for Supervisory Board meetings and committee meetings. Attendance at preliminary meetings is remunerated with € 250 per meeting, however only for one preliminary meeting per Supervisory Board meeting.
According to this remuneration system, the members of the Supervisory Board will receive the following total remuneration for fiscal 2011 (including attendance fees and remuneration for offices held at subsidiaries):
Remuneration of the members of the Supervisory Board of
EnBW AG in 2011 in € (prior-year figures in brackets)
Fixed remuneration
(incl. attendance
fees)
Variable remuneration1
Board remuneration
of subsidiaries
Total
Dr. Claus Dieter Hoffmann, chairman 55,000(54,000)
15,000 (40,000)
0 (0)
70,000(94,000)
Dietrich Herd, deputy chairman 47,000(43,500)
11,250 (30,000)
23,800 (19,600)
82,050(93,100)
Marc Boudier2 (until 16 January 2011) 657(33,699)
329 (20,000)
0 (0)
986(53,699)
Dr. Daniel Camus2 (until 9 January 2011) 370(30,397)
185 (20,000)
0 (0)
555(50,397)
Günther Cramer (since 10 July 2011) 11,980(0)
3,596 (0)
0 (0)
15,576(0)
Dr.-Ing. Rainer Dulger (21 February 2011 until 30 June 2011) 9,240(0)
2,671 (0)
0 (0)
11,911(0)
Prof. Dr. Dr. h.c. mult. Wolfgang Franz (21 February 2011 until 19 April 2011)
5,295(0)
1,192 (0)
0 (0)
6,487(0)
Dirk Gaerte3 27,000(22,438)
7,500 (20,000)
0 (3,988)
34,500(46,426)
Josef Götz (until 19 April 2011) 11,723(34,000)
2,240 (20,000)
0 (5,603)
13,963(59,603)
Prof. Dr. Ulrich Goll (10 March 2011 until 9 July 2011) 10,534(0)
2,507 (0)
0 (0)
13,041(0)
Reiner Koch4 24,250(20,000)
7,500 (20,000)
14,400 (9,467)
46,150(49,467)
Silke Krebs5 (since 10 July 2011) 12,979(0)
3,596 (0)
0 (0)
16,575(0)
Marianne Kugler-Wendt4 31,500(26,250)
7,500 (20,000)
17,092 (14,000)
56,092(60,250)
Marianne Laigneau2 (12 January 2011 until 17 February 2011) 1,521(0)
760 (0)
0 (0)
2,281(0)
Wolfgang Lang 30,000(26,000)
7,500 (20,000)
11,787 (9,500)
49,287(55,500)
Pierre Lederer2 (until 17 February 2011) 2,630(9,808)
986 (20,000)
0 (0)
3,616(29,808)
Dr. Hubert Lienhard (since 21 February 2011) 22,822(0)
6,452 (0)
0 (0)
29,274(0)
Serge Massart2 (17 January 2011 until 17 February 2011) 1,315(0)
658 (0)
467 (0)
2,440(0)
Arnold Messner (since 19 April 2011) 23,832(0)
5,281 (0)
5,764 (0)
34,877(0)
Bodo Moray4 31,500(5,859)
7,500 (14,184)
16,613 (4,340)
55,613(24,383)
Bernd Munding (since 19 April 2011) 16,312(0)
5,280 (0)
6,700 (0)
28,292(0)

216 _
Remuneration of the members of the Supervisory Board of
EnBW AG in 2011 in € (prior-year figures in brackets)
Fixed remuneration
(incl. attendance
fees)
Variable remuneration1
Board remuneration
of subsidiaries
Total
Thomas Piquemal2 (until 17 February 2011) 3,322(10,363)
986(20,000)
0 (0)
4,308(30,363)
Helmut Rau (8 March 2011 until 9 July 2011) 12,616(0)
2,548(0)
0 (0)
15,164(0)
Gunda Röstel (since 19 April 2011) 21,233(0)
5,281(0)
0 (0)
26,514(0)
Gérard Roth2 (until 17 February 2011) 6,130(27,500)
986(20,000)
0 (0)
7,116(47,500)
Dr. Nils Schmid5 (since 1 July 2011) 14,849(0)
3,781(0)
0 (0)
18,630(0)
Klaus Schörnich4 28,771(20,000)
7,500(20,000)
12,925 (14,175)
49,196(54,175)
Heinz Seiffert3 30,027(26,000)
7,500(20,000)
0 (0)
37,527(46,000)
Gerhard Stratthaus 27,418(18,500)
7,500(20,000)
0 (0)
34,918(38,500)
Laurent Stricker2 (until 7 June 2010) 0(6,494)
0(19,155)
0 (0)
0(25,649)
Werner Vorderwülbecke4 (until 18 June 2010) 0(12,010)
0(20,000)
0 (9,766)
0(41,776)
Christoph Walther (until 19 April 2011) 10,722(26,000)
2,240(20,000)
0 (0)
12,962(46,000)
Dietmar Weber 31,500(26,500)
7,500(20,000)
7,325 (10,700)
46,325(57,200)
Kurt Widmaier3 32,000(29,000)
7,500(20,000)
0 (0)
39,500(49,000)
Dr.-Ing. Gérard Wolf2 (until 7 June 2010) 0(6,994)
0(19,155)
0 (0)
0(26,149)
Dr. Bernd-Michael Zinow 40,000(32,938)
7,500(20,000)
7,300 (6,400)
54,800(59,338)
Total 636,048(548,250)
160,305(482,494)
124,173 (107,539)
920,526(1,138,283)
1 The variable remuneration for the fiscal year 2011 is not paid out until the annual general meeting has passed a resolution on exoneration of the members of the Supervisory Board in fiscal 2012. 2 The remuneration is transferred to EDF. 3 Pursuant to Secs. 82 – 88 Civil Service Act (LBG) in conjunction with Sec. 5 Ancillary Activities Ordinance (LNTVO), remuneration is transferred to the district. 4 In accordance with the regulations of the ver.di trade union and the German Federation of Trade Unions (DGB) on the transfer of supervisory board remuneration, the remuneration is transferred
to the Hans-Böckler-Stiftung foundation and ver.di GewerkschaftsPolitische Bildung gGmbH. 5 The members of the state government have agreed to transfer any remuneration received for membership of supervisory boards, advisory boards and all other comparable boards to which they
have been appointed in connection with their office or to which they are assigned as a member of the state government, applying Sec. 5 Ancillary Activities Ordinance (LNTVO) by analogy, to the extent that the remuneration received in the calendar year exceeds a gross total of € 6,100 (council of ministers resolution dated 24 May 2011).
The above disclosures include attendance fees of the members of the Supervisory Board amounting to € 218,000 in the fixed remuneration (prior year: € 145,750) and attendance fees totalling € 39,504 in the board remuneration of subsidiaries (prior year: € 26,075).
No other remuneration or benefits for services rendered personally, in particular consulting or mediation services,
were paid to members of the Supervisory Board. Nor did they receive any loans or advances in the reporting year.
The members of the Board of Management and the Supervisory Board are covered by adequate D&O insurance taken out in the interest of EnBW. An appropriate deductible has been arranged for this D&O insurance – three basic monthly salaries for members of the Board of Management

Time to act
Management report
Financial statements
Corporate governance
Declaration of compliance and corporate governance report ‹
Service
_ 217
monthly salaries for members of the Board of Management and half of the annual remuneration for members of the Supervisory Board. Since 1 July 2010, the deductible for D&O insurance for members of the Board of Management and Supervisory Board has been 10% of the claims, but no more than one-and-a-half times the fixed annual compensation.
Transparency
EnBW ensures that the transparency required by the German Corporate Governance Code is in place at all times by informing its shareholders, the capital market, financial analysts, shareholder associations and interested members of the general public promptly about any major business changes in the company. We mainly use the internet to ensure that all interested parties are informed on an equal and timely basis.
Information on EnBW’s business development is primarily provided in the annual report and the quarterly, six-monthly and nine-monthly financial reports, at the press briefing on annual results, in conference calls in connection with the results for the quarter and for the year as well as at events with analysts. The financial calendar published on our website contains all the dates of important regular publications.
When details of events that are not in the public domain become known between the regular reporting dates that relate to the EnBW share and could potentially have a material influence on the quoted market price of the EnBW share, such insider information is announced in ad hoc reports. In the fiscal year 2011, ad hoc announcements were made on 21 July 2011 and 6 December 2011.
EnBW did not receive any notices on directors’ dealings in fiscal 2011 from persons in managerial positions or persons closely related to them on transactions with EnBW shares or related financial instruments. There were similarly no reportable shareholdings of members of the Board of Management or the Supervisory Board.
Financial reporting and annual audit
The financial reporting of EnBW is prepared according to International Financial Reporting Standards (IFRSs). After the annual general meeting elected KPMG AG Wirtschafts-prüfungsgesellschaft, Berlin, as independent auditor for the separate financial statements and the consolidated financial statements for the fiscal year 2011, and as independent auditor for the review of the condensed financial statements and interim management report contained in the six-monthly financial report, the audit committee, or its chair,
engaged the audit firm accordingly. The committee satisfied itself in the run-up to the annual general meeting that there were no doubts as to the independence of the audit firm being engaged and examined the additional services rendered by it.
The audit committee discusses the quarterly, six-monthly and nine-monthly financial reports with the Board of Management prior to their publication as recommended by a new provision of the German Corporate Governance Code.
There are currently no stock option plans or similar securities-based incentive programmes at EnBW.
Declaration of compliance
The Board of Management and Supervisory Board of EnBW Energie Baden-Württemberg AG declare in accordance with Sec. 161 German Stock Corporations Act (AktG):
“Since its last declaration of compliance on 9 December 2010, EnBW Energie Baden-Württemberg AG has complied with the recommendations made by the government commission on the German Corporate Governance Code as amended on 26 May 2010 and published in the Electronic German Federal Gazette (elektronischer Bundesanzeiger) with the following exception:
No. 5.4.1 (2) and (3) of the code: The Supervisory Board should stipulate concrete targets with regard to its own composition that, while taking account of the company’s current situation, reflect the international operations of the group, potential conflicts of interest, an age limit for supervisory board members and diversity and provide for appropriate participation of women.
Nominations by the Supervisory Board to the bodies responsible for electing candidates should take these targets into account. The Supervisory Board’s targets and the extent to which they have been implemented are to be published in the corporate governance report.
On 6 December 2010, E.D.F INTERNATIONAL SA (EDF), which was a shareholder at that time, concluded an agreement with NECKARPRI GmbH, an entity wholly owned by the federal state of Baden-Württemberg, on the purchase of the EnBW shares previously held by EDF of around 45% of the capital stock. The Supervisory Board welcomed the recommendation of the code to stipulate targets for the composition of the Supervisory Board. In light of the change in one of the major shareholders, the Supervisory Board was, however, of the opinion when the last declaration of compliance was issued on 9 December 2010 that it was at that time not appropriate to set concrete targets for the composition of the Supervisory Board. This was to be debated in the newly formed Supervisory Board.

218 _
With immediate effect, EnBW Energie Baden-Württemberg AG will comply without exception with the recommendations of the government commission for the German Corporate Governance Code as amended on 26 May 2010.”
Comments on the suggestions of the
German Corporate Governance Code
Pursuant to No. 3.10 Sentence 3 of the German Corporate Governance Code, the Board of Management and Supervisory Board state the two exceptions with which EnBW complied with the suggestions of the code in the past year and with which it will in future comply with them:
No. 2.3.4 of the code: Broadcast of the annual general meeting via modern communication media.
In accordance with widespread practice, EnBW broadcasts the annual general meeting via the internet until the end of the report of the CEO. In view of the small free float of the EnBW share and the fact that a large number EnBW’s shareholders are usually present at the annual general meeting, the additional expense involved in broadcasting the entire annual general meeting would not be justified.
No. 5.4.6 of the code: Components of the remuneration of the Supervisory Board based on the long-term performance of the company.
The incentive-based remuneration of the Supervisory Board members does not include any components based on the long-term performance of the company. In contrast to the remuneration system for the Board of Management, such components would make the remuneration system for the Supervisory Board excessively complex.
The listed subsidiary ZEAG Energie AG also implements the German Corporate Governance Code. Deviations from the recommendations of the Code are set forth in ZEAG Energie AG’s declaration of compliance, which can be viewed on its website (www.zeag-energie.de). Karlsruhe, 6 March 2012 EnBW Energie Baden-Württemberg AG
The Board of Management The Supervisory Board

Time to act
Management report
Financial statements
Corporate governance
The Supervisory Board ‹
Service
_ 219
Members
Dr. Claus Dieter Hoffmann, Stuttgart Managing partner of
H + H Senior Advisors GmbH
Chairman
Dietrich Herd, Philippsburg Chair of the central works council of
EnBW Kraftwerke AG
Deputy chairman
Günther Cramer, Kassel Supervisory board chairman of
SMA Solar Technology AG
Member since 10 July 2011
Dirk Gaerte, Sigmaringendorf District administrator of the Sigmaringen
district
Reiner Koch, Glienicke/Nordbahn Responsible for supply and waste disposal divisions at ver.di head office
Silke Krebs, Stuttgart Minister at the state ministry of Baden-Württemberg Member since 10 July 2011
Marianne Kugler-Wendt, Heilbronn Regional director at ver.di,
Heilbronn-Neckar-Franconia district
Wolfgang Lang, Karlsruhe Chair of the central works council of
EnBW Systeme Infrastruktur Support GmbH
Dr. Hubert Lienhard, Heidenheim CEO of Voith GmbH Member since 21 February 2011
Arnold Messner, Aichwald Chair of the central works council of EnBW Regional AG Member since 19 April 2011
Bodo Moray, Mannheim ver.di trade union secretary responsible for
supply and waste disposal divisions in
Baden-Württemberg
Bernd Munding, Hochdorf Deputy chairman of the works council of EnBW Operations GmbH Member since 19 April 2011
Gunda Röstel, Flöha Managing director of Stadtentwässerung Dresden GmbH and authorised signatory at Gelsenwasser AG Member since 19 April 2011
Dr. Nils Schmid MdL, Nürtingen Deputy prime minister and minister of finance and economy of the state of Baden-Württemberg Member since 1 July 2011
Klaus Schörnich, Düsseldorf Chairman of the works council of
Stadtwerke Düsseldorf AG
Heinz Seiffert, Ehingen District administrator of the Alb-Donau district
Gerhard Stratthaus MdL, Brühl Former finance minister of the state of Baden-Württemberg
Dietmar Weber, Esslingen Chair of the central works council of
EnBW Operations GmbH
Kurt Widmaier, Ravensburg District administrator of the Ravensburg
district
Dr. Bernd-Michael Zinow, Pfinztal Senior vice president public affairs at
EnBW Energie Baden-Württemberg AG
The Supervisory Board

220 _
Marc Boudier, Sèvres Advisor to the president at
Electricité de France SA
Member until 16 January 2011
Dr. Daniel Camus, Croissy-sur-Seine Strategy advisor
Member until 9 January 2011
Dr.-Ing. Rainer Dulger, Heidelberg Executive Vice President ProMinent
Dosiertechnik GmbH
Member from 21 February 2011 until
30 June 2011
Prof. Dr. Dr. h. c. mult. Wolfgang Franz, Mannheim President of Zentrum für Europäische
Wirtschaftsforschung GmbH (ZEW)
Member from 21 February 2011 until
19 April 2011
Josef Götz, Stuttgart Officer with special responsibilities at
EnBW Technische Dienste und
kaufmännische Leistungen GmbH
Member until 19 April 2011
Prof. Dr. Ulrich Goll MdL, Waiblingen Former minister of justice and deputy prime
minister of the state of Baden-Württemberg
Member from 10 March 2011 until 9 July 2011
Marianne Laigneau, Chelles Group Senior Executive Vice President,
Human Resources at Electricité de France SA
Member from 12 January 2011 to
17 February 2011
Pierre Lederer, Paris Group Senior Executive Vice President
Customers, Optimisation, Trading
at Electricité de France SA
Member until 17 February 2011
Serge Massart, Paris Senior Vice President reporting to the Group
Senior Executive Vice President in charge of
Generation and Engineering at Electricité de
France SA
Member since 17 January 2011 until
17 February 2011
Thomas Piquemal, Paris Group Senior Executive Vice President,
Finance at Electricité de France SA
Member until 17 February 2011
Helmut Rau MdL, Ettenheim Former minister at the state ministry of
Baden-Württemberg
Member from 8 March 2011 until 9 July 2011
Gérard Roth, Bois d’Arcy Director for Continental Europe at
Electricité de France SA
Member until 17 February 2011
Christoph Walther, Langebrück Deputy chair of the works council of
ENSO Energie Sachsen Ost AG
Member until 19 April 2011
Key
Active member
Inactive member
As of 15 February 2012

Time to act
Management report
Financial statements
Corporate governance
The Supervisory Board ‹
Service
_ 221
Committees
Personnel committee
› Dr. Claus Dieter Hoffmann
Chair
› Dietrich Herd
› Arnold Messner
(since 19 April 2011)
› Dr. Nils Schmid
(since 18 July 2011)
› Josef Götz
(until 19 April 2011)
› Helmut Rau
(21 March 2011 to 9 July 2011)
› Gérard Roth
(until 17 February 2011)
Finance and investment committee
› Dr. Claus Dieter Hoffmann
Chair
› Dietrich Herd
› Silke Krebs
(since 18 July 2011)
› Dr. Hubert Lienhard
(since 21 March 2011)
› Arnold Messner
(since 19 April 2011)
› Bodo Moray
› Kurt Widmaier
› Dr. Bernd-Michael Zinow
› Josef Götz
(until 19 April 2011)
› Thomas Piquemal
(until 17 February 2011)
› Helmut Rau
(21 March 2011 to 9 July 2011)
› Gérard Roth
(until 17 February 2011)
Audit committee
› Gunda Röstel
(since 19 April 2011,
chair since 28 July 2011)
› Marianne Kugler-Wendt
› Wolfgang Lang
› Dr. Nils Schmid
(since 18 July 2011)
› Klaus Schörnich
(since 19 April 2011)
› Heinz Seiffert
(chair from 18 to 19 April 2011)
› Dietmar Weber
› Kurt Widmaier
› Prof. Dr. Dr. h. c. mult. Wolfgang Franz
(21 March 2011 to 19 April 2011)
› Prof. Dr. Ulrich Goll
(21 March 2011 to 9 July 2011)
› Thomas Piquemal
(until 17 February 2011,
chair from 4 to 17 February 2011)
› Gérard Roth
(until 17 February 2011)
› Christoph Walther
(until 19 April 2011)
Nomination committee
› Dr. Claus Dieter Hoffmann
Chair
› Günther Cramer
(since 18 July 2011)
› Silke Krebs
(since 18 July 2011)
› Gunda Röstel
(since 19 April 2011)
› Heinz Seiffert
› Kurt Widmaier
› Dr.-Ing. Rainer Dulger
(21 March 2011 to 30 June 2011)
› Prof. Dr. Dr. h. c. mult. Wolfgang Franz
(21 March 2011 to 19 April 2011)
› Prof. Dr. Ulrich Goll
(21 March 2011 to 9 July 2011)
› Pierre Lederer
(until 17 February 2011)
› Thomas Piquemal
(until 17 February 2011)
› Gérard Roth
(until 17 February 2011)
Ad hoc committee (since 7 June 2010)
› Dr. Bernd Michael Zinow
Chair
› Dirk Gaerte
› Dietrich Herd
› Gerhard Stratthaus
(since 21 March 2011)
› Gérard Roth
Deputy chair
(until 17 February 2011)
Mediation committee (committee pursuant
to Sec. 27 (3) German Co-determination Act
(MitbestG))
› Dr. Claus Dieter Hoffmann
Chair
› Dietrich Herd
› Bernd Munding
(since 19 April 2011)
› Dr. Nils Schmid
(since 18 July 2011)
› Helmut Rau
(21 March 2011 to 9 July 2011)
› Gérard Roth
(until 17 February 2011)
› Klaus Schörnich
(until 19 April 2011)
Key
Active member
Inactive member
As of 15 February 2012

222 _
Hans-Peter Villis › EVN AG
› EWE Aktiengesellschaft
› GasVersorgung Süddeutschland GmbH
(chair)
› GVS Netz GmbH (chair)
› Stadtwerke Düsseldorf AG (chair)
› Pražská energetika a.s.
Dr. Bernhard Beck › EnBW Kernkraft GmbH (chair)
› EnBW Kraftwerke AG (chair)
› EnBW Systeme Infrastruktur Support
GmbH (chair)
› EnBW Technische Dienste und
kaufmännische Leistungen GmbH (chair)
› EnBW Vertrieb GmbH (until 24 March 2011)
› Energiedienst AG
› SOMENTEC Software AG (chair)
› Stadtwerke Düsseldorf AG
› BKK VerbundPlus, Körperschaft des
öffentlichen Rechts
› EnBW Akademie Gesellschaft für
Personal- und Managemententwicklung
mbH (chair)
› EnBW Operations GmbH
› Energiedienst Holding AG
› Teweratio GmbH (chair)
Thomas Kusterer (Member since 1 April 2011) › EnBW Kernkraft GmbH
› EnBW Kraftwerke AG
› EnBW Regional AG
Dr. Dirk Mausbeck (Member since 1 October 2011) › EnBW Regional AG (since 23 November
2011, chair) › EnBW Vertrieb GmbH (member, chair
since 21 November 2011) › European Energy Exchange AG
› GasVersorgung Süddeutschland GmbH › GVS Netz GmbH › Stadtwerke Düsseldorf AG
› EnBW Operations GmbH (chair)
Dr. Hans-Josef Zimmer (Member since 1 January 2012) › EWE Aktiengesellschaft
› EnBW Transportnetze AG (chair)
› Gesellschaft für Nuklear-Service mbH
› Vorarlberger Illwerke AG
Christian Buchel (Member until 31 May 2011) › EnBW Regional AG (chair)
› EnBW Transportnetze AG (chair)
› EnBW Vertrieb GmbH (chair)
› Energiedienst AG
› GasVersorgung Süddeutschland GmbH
› EnBW Energy Solutions GmbH (chair)
› EnBW Operations GmbH (chair)
› EnBW Trading GmbH (chair)
› Energiedienst Holding AG
Key
› Membership in other statutory supervisory
boards during the the term of office
› Membership in comparable domestic and
foreign control bodies of business
organisations during the term of office
Disclosures of office holders pursuant to
Sec. 285 No. 10 HGB
As of 15 February 2012
Offices held by members of the Board of Management

Time to act
Management report
Financial statements
Corporate governance
Other offices held by members of the Supervisory Board
‹
Service
_ 223
Dr. Claus Dieter Hoffmann (chair)
› ING-DiBa AG
› C. A. Leuze GmbH + Co. KG
› De Boer Holding NV
› EJOT Holding GmbH & Co. KG
Dietrich Herd (deputy chair)
› EnBW Kernkraft GmbH
› EnBW Kraftwerke AG
Günther Cramer (since 10 July 2011) › SMA Solar Technology AG (chair)
Dirk Gaerte › GVV-Privatversicherung AG
› Hohenzollerische Landesbahn AG
› SV Sparkassen Versicherung AG
› Wirtschaftsförderungs- und
Standortmarketinggesellschaft Landkreis
Sigmaringen mbH (chair)
› Erdgas Südwest GmbH (chair)
› Flugplatz Mengen-Hohentengen GmbH
(chair)
› Hohenzollerische Landesbank
Kreissparkasse Sigmaringen, Anstalt des
öffentlichen Rechts (chair)
› Kliniken Landkreis Sigmaringen GmbH
(chair)
› Technologie- und Innovationszentrum
Pfullendorf GmbH (TIP)
› Sparkassenverband Baden-Württemberg,
Körperschaft des öffentlichen Rechts
› Verkehrsverbund Neckar-Alb-Donau
GmbH (naldo)
› Zweckverband Oberschwäbische
Elektrizitätswerke
› Zweckverband Thermische Abfall-
verwertung Donautal
› Zweckverband Tierkörperbeseitigung
Warthausen
› Zweckverband Protec Orsingen
Reiner Koch › Stadtwerke Düsseldorf AG
› EnBW Operations GmbH
Silke Krebs (since 10 July 2011) › MFG Medien- und Filmgesellschaft
Baden-Württemberg mbH
› SWR Media Services GmbH
› Südwestrundfunk, Anstalt des öffentlichen
Rechts
Marianne Kugler-Wendt › Bausparkasse Schwäbisch-Hall AG
› EnBW Kernkraft GmbH
› EnBW Kraftwerke AG
› SLK-Kliniken Heilbronn GmbH
› Heilbronner Versorgungs GmbH
› Regionale Gesundheitsholding Heilbronn-
Franken GmbH
› Stadtwerke Heilbronn GmbH
Wolfgang Lang › EnBW Systeme Infrastruktur Support GmbH
› EnBW Akademie Gesellschaft für Personal-
und Managemententwicklung mbH
Dr. Hubert Lienhard (since 21 February 2011) › Heraeus Holding GmbH
(since 8 November 2011)
› SGL Carbon SE
› Voith Turbo Beteiligungs GmbH
(until 31 December 2011, chair)
› Voith Hydro Holding GmbH & Co. KG (chair)
› Voith Industrial Services Holding GmbH &
Co. KG (chair)
› Voith Paper Holding GmbH & Co. KG (chair)
Arnold Messner (since 19 April 2011) › EnBW Regional AG
› EnBW Akademie Gesellschaft für Personal-
und Managemententwicklung mbH
Bodo Moray › EnBW Kraftwerke AG
› EnBW Regional AG
Bernd Munding (since 19 April 2011) › EnBW Operations GmbH
Gunda Röstel (since 19 April 2011) › Universitätsklinikum Carl Gustav Carus
Dresden an der Technischen Universität
Dresden, Anstalt des öffentlichen Rechts
(since 1 September 2011)
› Hochschulrat der Technischen Universität
Dresden, Körperschaft des öffentlichen
Rechts (chair)
› Sächsische Aufbaubank, Anstalt des
öffentlichen Rechts
› Stadtwerke Burg GmbH
Dr. Nils Schmid (since 1 July 2011) › Landesbank Baden-Württemberg, Anstalt
des öffentlichen Rechts (since 22 July 2011)
› Baden-Württemberg International –
Gesellschaft für internationale
wirtschaftliche und wissenschaftliche
Zusammenarbeit mbH (chair)
› Baden-Württemberg Stiftung gGmbH
› e-mobil BW GmbH (since 20 July 2011, chair)
› Landeskreditbank Baden-Württemberg –
Förderbank des öffentlichen Rechts (since
5 July 2011, chair)
› Kreditanstalt für Wiederaufbau (KfW),
Anstalt des öffentlichen Rechts
(since 4 November 2011)
› Zentrum für Europäische
Wirtschaftsforschung GmbH
(14 September 2011 to 23 October 2011)
Klaus Schörnich › Awista GmbH
› Stadtwerke Düsseldorf AG
› Stadtwerke Düsseldorf Netz GmbH
(since 30 May 2011)
Other offices held by members of the Supervisory Board

224 _
Heinz Seiffert › Krankenhaus GmbH Alb-Donau-Kreis (chair)
› ADK GmbH für Gesundheit und Soziales
(chair)
› Donau-Iller-Nahverkehrsverbund GmbH
› Fernwärme Ulm GmbH
› Kreisbaugesellschaft mbH Alb-Donau (chair)
› Pflegeheim GmbH Alb-Donau-Kreis (chair)
› Sparkasse Ulm, Anstalt des öffentlichen
Rechts (chair)
› Zweckverband Oberschwäbische
Elektrizitätswerke
› Zweckverband Thermische
Abfallverwertung Donautal (chair)
Gerhard Stratthaus › Badische Staatsbrauerei Rothaus AG (chair)
› Zentrum für Europäische
Wirtschaftsforschung GmbH (chair)
Dietmar Weber › EnBW Operations GmbH
Kurt Widmaier › Oberschwabenklinik GmbH (chair)
› Bodensee-Oberschwaben-Bahn GmbH &
Co. KG (member, chair from 1 January 2012)
› Bodensee-Oberschwaben
Verkehrsverbundgesellschaft mbH
(member, chair until 31 December 2011)
› Kreissparkasse Ravensburg (chair)
› LBS Landesbausparkasse Baden-
Württemberg
› REAG Ravensburger Entsorgungsanlagen
GmbH (chair)
› WIR – Gesellschaft für Wirtschafts- und
Innovationsförderung Landkreis
Ravensburg mbH (chair)
› Zentrum für Psychiatrie Weissenau,
Anstalt des öffentlichen Rechts
› Zweckverband Oberschwäbische
Elektrizitätswerke (chair)
› Zweckverband Tierkörperbeseitigung
Warthausen
Dr. Bernd-Michael Zinow › EnBW Kernkraft GmbH
› EnBW Transportnetze AG
Marc Boudier (until 16 January 2011) › ALPIQ Holding AG › EDF Belgium SA (chair)
› E.D.F. INTERNATIONAL SA
(until 10 January 2011)
› EDF Peninsula Ibérica SLU (chair)
› Edison SpA (until 14 January 2011)
› S.P.E. SA
› SPE POWER Co SA
› Transalpina di Energia SRL
(until 14 January 2011)
Dr. Daniel Camus (until 9 January 2011) › Morphosys AG
› SGL Carbon SE
› Valeo SA
› Vivendi SA
Dr.-Ing. Rainer Dulger (21 February 2011 to 30 June 2011) › Weidmüller AG
› ProMinent Fluid Controls China Co. Ltd.
(chair)
› ProMinent Fluid Controls Ltd.
› ProMinent France S.A.S.
› ProMinent Japan Ltd.
› ProMinent Systems spol. s.r.o.
Prof. Dr. Dr. h. c. mult. Wolfgang Franz (21 February 2011 to 19 April 2011) › Ernst & Young GmbH
Josef Götz (until 19 April 2011) › No further offices
Prof. Dr. Ulrich Goll (10 March 2011 to 9 July 2011) › Landesbank Baden-Württemberg, Anstalt
des öffentlichen Rechts (until 30 June 2011)
Marianne Laigneau (12 January 2011 to 17 February 2011) › EDF Energy Holdings Limited › EDF Trading Limited
› ERDF SA
Pierre Lederer (until 17 February 2011) › EDF Energy Holdings Limited
› EDF Trading Limited (chair) › Fondation EDF Diversiterre
Serge Massart (17 January 2011 to 17 February 2011) › EnBW Kernkraft GmbH
› EDF Energy Nuclear Generation Group
Limited
Thomas Piquemal (until 17 February 2011) › EDF Energy Holdings Limited › EDF Energies Nouvelles SA
› ERDF SA
› Edison SpA
› F. Marc de Lacharrière SA (FIMALAC)
› RTE EDF Transport SA
› Transalpina di Energia SRL
Helmut Rau (8 March 2011 to 9 July 2011) › Baden-Württembergische Bank,
unselbstständige Anstalt der Landesbank
Baden-Württemberg
Gérard Roth (until 17 February 2011) › EDF Deutschland GmbH (chair) › Elektrownia Rybnik SA
Christoph Walther (until 19 April 2011) › ENSO Energie Sachsen Ost AG
Key
› Membership in other statutory supervisory
boards during the term of office
› Membership in comparable domestic and
foreign control bodies of business
organisations during the term of office
As of 15 February 2012

_ 225
Service
226 Glossary
228 Our locations
230 Five-year summary
232 Important note
Top issues
Financial calendar
226 _
B Backup power station Also known as “shadow” or “reserve” power
stations. These are characterised by their
ability to start up quickly and be deployed at
short notice when necessary. Backup power
stations are often pumped storage power or
gas and steam turbine plants.
Balancing zones The task of German transmission system
operators (TSO) is to maintain at all times a
supply balance between power generation
and consumption in the balancing zone, and
to provide balancing grids (electricity
generators and consumers) with balancing
energy from the secondary balancing energy
reserve and the minutes reserve. The close
cooperation between the German TSOs
makes a contribution to keeping total demand
for balancing energy to a minimum.
Base Base load product. Constant purchase/supply
throughout the period.
C CER – Certified Emission Reductions Certified emission reductions from CDM
projects. Investors from industrialised
countries generate these in developing
countries with CDM emission reduction
projects pursuant to the Kyoto Protocol. 1 CER
corresponds to 1 t CO2. CER can be used by
companies to meet the obligation to return
allowances under the European emissions
trading system (> Emissions trading).
CHP – Combined heat and power The waste heat of a power plant can be used
as process heat or to heat buildings in the
surrounding area. In this case, additional
output of energy is obtained with the same
amount of fuel. A power plant that generates
both electricity and heat from a single
source is called a CHP station.
CO2 allowances CO2 allowances have been traded on the
Leipzig electricity exchange since 2005.
Purchasing one CO2 allowance entitles a
company to emit 1 t of CO2 (> Emissions trading)
Contracting Outsourcing, for a specific period and for a
specific area, of tasks relating to the
provision and supply of energy to a third
party (contractor) acting on its own behalf
and on its own account. Forms of energy are,
for example, cooling, heating, electricity and
compressed air.
Contra-directional (non-harmonised) use of balancing energy Simultaneous use of balancing energy in
opposing directions. In a > balancing zone,
negative balancing energy is used to balance
out excess electricity being fed in while, in
another balancing zone, positive balancing
energy is used to balance out a shortfall.
D Downstream Designates business activities in connection
with distribution, sales and marketing of
natural gas.
E EEX – European Energy Exchange Energy exchange based in Leipzig where the
energy sources of electricity, natural gas
and coal, as well as emission allowances,
are traded.
EFET – European Federation of Energy Traders Association of more than 90 energy trading
businesses and financial institutions from 23
European countries. The association’s
objective essentially is to promote energy
trading with electricity, gas, heating and coal
as well as derivative trading throughout
Europe.
Electromobility The use of electric vehicles for passenger
and goods transportation. The German
federal government adopted a National
Electromobility Development Plan in August
2009 with the aim of speeding up research
and development into battery-powered
electric vehicles and their market
preparation and launch in Germany. EnBW’s
participation in this initiative includes
the > MeRegioMobil project.
Emissions trading Environmental policy instrument with the
aim of climate protection. Emission
allowances permit countries to emit certain
quantities of gases that impact the climate.
These allowances can be traded between
countries. Companies requiring more
allowances than they have been issued with
have to buy the difference, while those
companies that receive more than they need
are free to sell them. Every market
participant is free to purchase emission
allowances or, alternatively, implement
measures to reduce emissions.
Energies Act The amendment to the German Renewable
Energies Act comes into force in 2012.
According to the amended act, around 35% of
electricity in Germany is to be generated from
renewable energy sources already by 2020.
Energy efficiency directive The planned EU energy efficiency directive is
intended to contribute to achieving the
objective of boosting energy efficiency by
20% still before 2020.
EUA – EU Allowance Smallest trading unit in > emissions trading
in the EU. 1 EUA corresponds to 1 t CO2.
F Flue gas cleaning Extensive reduction in the amounts of
nitrous oxide, dust and sulphur oxide
Glossary

Time to act
Management report
Financial statements
Corporate governance
Service
Glossary ‹
_ 227
contained in flue gas arising from the
combustion of solid fuels such as coal. For
this purpose, the flue gases emanating from
the boiler pass through various stages of
treatment.
Fuel cells Converts chemical energy into electrical
current and heat based on the principle of
inverse electrolysis. Efficient technology
suitable for local energy generation. Can be
employed for electricity supplies to devices
and vehicles and for supplying electricity and
heat to buildings and for industrial purposes.
Fuel switch Switching to lower CO2-emitting generation
methods.
H H gas/L gas The composition of natural gas depends on
its origins. For this reason, two qualities of
gas with different energy values are on offer
in Germany: high calorific H gas with a
higher methane content of 87 to 98.9 vol. %
and low calorific L gas with a lower methane
content of 80.1 to 87% vol.%.
I IETA – International Emissions Trading Association International Group Organization Formed in
1999 with the aim of creating a functioning
international framework for trading with
greenhouse gas emissions and developing
an emissions trading system (> Emissions trading) that will bring about a genuine,
verifiable reduction in greenhouse gas
emissions and a balance between economic
efficiency on the one hand and
environmental integrity and social equity on
the other.
L LNG – Liquefied Natural Gas Natural gas liquefied by cooling to –161 °C.
Its smaller volume – around 1/600th of the
normal volume of gaseous natural gas –
provides great advantages particularly for
transmission and storage.
M MeRegio – Minimum Emission Region This involves making the use of energy more
efficient and reducing CO2 emissions. The
aim of the MeRegioMobil project is to
develop and build up extensive infrastructure
in Baden-Württemberg for the use of
electric vehicles (> Electromobility).
Midstream Designates business activities in connection
with the import, trade and storage of natural
gas.
N Nuclear fuel rod tax
This is imposed from 2011 to 2016 at a tax
rate of € 145/g of nuclear fuel. According to
the government’s coalition agreement, the
anticipated revenue of € 2.3 billion will be
used to consolidate the federal budget.
Energy companies may deduct this levy for
tax purposes.
O OTC trading Over the counter trading.
P Peak Peak load product. In Germany, this refers to
purchase/supply Monday to Friday, 8 a.m. to
8 p.m.
Photovoltaics Converting luminous energy directly into
electrical energy by means of solar cells.
Photovoltaic plants for electricity generation
are, as a rule, installed on roofs or open
ground.
Pumped storage power station Pumped storage power stations act as a
buffer in the event of grid disruptions and
balance out daily peaks in demand. In
addition they are incresingly being used to
balance out the fluctuating quanities of
electricity from wind power being fed in.
These power stations are also used to
maintain the stability of the frequency of the
current in network system by deploying the
machinery in a targeted manner.
S Smart grid A network that uses information technology
to monitor and optimise operation of its
interconnected elements – from electricity
generators, storage systems, electrical
consumers and network operating
equipment in energy transmission and
distribution networks. The aim is to optimise
energy supplies in an efficient, reliable and
cost-effective system.
Smart home Refers to solutions in private households
using devices, systems and technologies to
enhance energy efficiency, convenience,
viability, flexibility and security.
Smart metering System for measuring and communicating
consumption data. Provides EnBW’s
customers with transparency regarding their
energy consumption.
U Unbundling Ownership unbundling. The ownership
unbundling required under the German
Energy Industry Act relating to electricity
generation and sales in Europe, i.e.,
separation of the grid-related activities from
the market-related activities of vertically
integrated power companies.
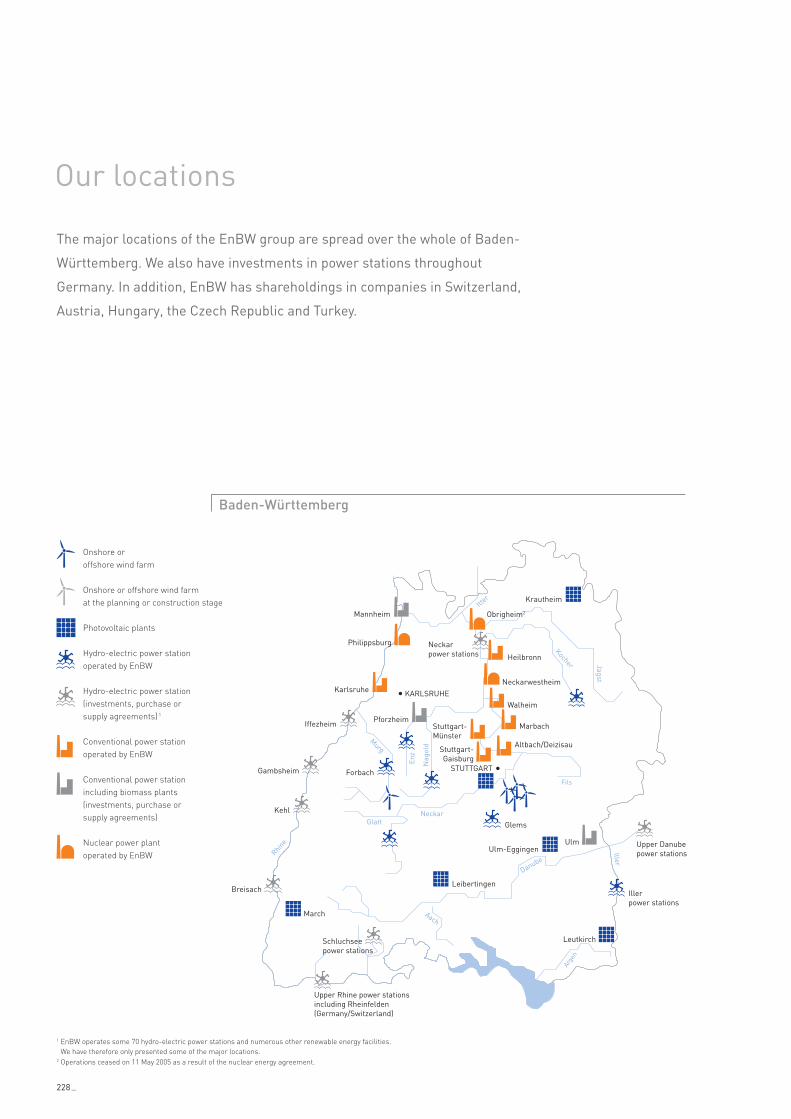
Onshore or offshore wind farm
Onshore or offshore wind farm at the planning or construction stage
Photovoltaic plants
Hydro-electric power stationoperated by EnBW
Hydro-electric power station(investments, purchase or supply agreements) 1
Conventional power stationoperated by EnBW
Conventional power stationincluding biomass plants(investments, purchase or supply agreements)
Nuclear power plantoperated by EnBW
The major locations of the EnBW group are spread over the whole of Baden-
Württemberg. We also have investments in power stations throughout
Germany. In addition, EnBW has shareholdings in companies in Switzerland,
Austria, Hungary, the Czech Republic and Turkey.
1 EnBW operates some 70 hydro-electric power stations and numerous other renewable energy facilities. We have therefore only presented some of the major locations.
2 Operations ceased on 11 May 2005 as a result of the nuclear energy agreement.
Baden-Württemberg
Our locations
Neckar
Enz
Nag
old
Glatt
Murg
Kocher Jagst
Itter
Danube
Arge
n
Aach
Rhine
Fils
Iller
Marbach
STUTTGART
Iffezheim Pforzheim
Karlsruhe
Neckarpower stations
Stuttgart-Münster
Stuttgart-Gaisburg
Philippsburg
Mannheim Obrigheim2
Neckarwestheim
Walheim
Heilbronn
Altbach/Deizisau
Gambsheim
Glems
Iller power stations
Upper Danube power stations
LeibertingenBreisach
Ulm-Eggingen
Krautheim
March
Leutkirch
Upper Rhine power stationsincluding Rheinfelden (Germany/Switzerland)
Schluchseepower stations
Forbach
Kehl
Ulm
KARLSRUHE
228 _

Rostock
Düsseldorf
Buschhaus
Lippendorf
Bexbach
BERLIN
HANOVER
COLOGNE
FRANKFURT ON THE MAIN
MUNICH
D
CZ
AU
HUCH
Miskolc
Budapest VisontaLaufenburg
Visp
Prague
Maria Enzersdorf
Germany
Europe
TR
Istanbul
_ 229
Time to act
Management report
Financial statements
Corporate governance
ServiceOur locations ‹

230 _
EnBW group
Earnings
Revenue € millions
EBITDA1 € millions
EBIT1 € millions
Adjusted EBIT1 € millions
Group net loss/profit1, 2 € millions
Earnings per share from group net loss/profit1, 2 €
Balance sheet
Non-current assets1 € millions
Total assets1 € millions
Equity1 € millions
Equity ratio1 %
Recognised net financial liabilities3 € millions
Cash flow
Cash flow from operating activities € millions
Capital expenditures on intangible assets and property, plant and equipment € millions
Free cash flow € millions
Profitability
ROCE1 %
Value added1 € millions
Capital market
Dividends per share €
Distribution € millions
Market capitalisation5 € billions
Electricity
Electricity sales, retail customers (B2C) billions of kWh
Electricity sales, industry and redistributors (B2B) billions of kWh
Electricity sales, trade billions of kWh
Revenue € millions
EBIT1 € millions
Gas
Gas sales, retail customers (B2C) billions of kWh
Gas sales, industry and redistributors (B2B) billions of kWh
Gas sales, trading billions of kWh
Revenue € millions
EBIT € millions
Energy and environmental services
Revenue € millions
EBIT € millions
Energy generated6 by the EnBW group in its core business by primary source of energy
Conventional energy %
Nuclear power %
Renewable energies7 %
Other %
Employees
Annual average number of employees in the EnBW group8 Number
Personnel expenses € millions
1 The 2010 figures have been restated. 2 In relation to the loss/profit shares attributable to the equity holders of EnBW AG. 3 Without cash and cash equivalents of the special funds and short-term investments to cover the pension and nuclear power provisions. 4 As proposed to the annual general meeting.
Five-year summary

Time to act
Management report
Financial statements
Corporate governance
Service
Five-year summary ‹
_ 231
2011 2010 2009 2008 2007
18,790 17,509 15,564 16,305 14,712
1,809 3,315 2,748 2,540 2,336
671 2,125 1,889 1,468 1,559
1,598 1,926 1,794 1,794 1,563
– 867 1,157 768 879 1,364
– 3.55 4.74 3.15 3.60 5.58
24,420 25,883 23,191 20,267 20,753
35,821 35,780 34,639 32,759 28,436
6,133 7,603 6,408 5,592 6,002
17.1 21.2 18.5 17.1 21.1
5,354 5,641 5,812 2,951 2,952
1,740 2,561 2,443 1,524 1,559
1,172 1,625 1,309 1,257 816
691 1,060 1,292 405 853
11.7 14.2 15.5 17.1 16.2
472 801 841 963 828
0.854 1.53 1.53 2.01 1.51
2084 374 374 491 369
9.5 10.0 9.8 9.2 14.7
19 21 22 23 22
50 48 51 61 62
87 78 47 46 55
16,192 15,010 12,389 12,736 11,540
687 2,040 1,794 1,540 1,378
9 12 12 13 12
46 42 54 57 63
3 0 0 0 0
1,818 1,788 2,453 2,881 2,479
– 53 79 151 – 50 172
780 711 722 688 693
85 96 87 86 132
38 34 29 28 30
48 51 55 57 54
11 11 11 11 10
3 4 5 4 6
20,959 20,450 20,914 20,357 20,499
1,615 1,670 1,618 1,480 1,476
5 Number of shares outstanding at the end of the fiscal year multiplied by the closing price. 6 Own generation includes long-term procurement agreements and generation from partly owned power stations. 7 By analogy to the disclosure pursuant to Sec. 42 German Energy Industry Act (EnWG). 8 Number of employees without apprentices and without inactive employees.

232 _
Published by EnBW Energie Baden-Württemberg AG Durlacher Allee 93 76131 Karlsruhe www.enbw.com
Coordination and editor Corporate Communications, Karlsruhe
Concept and design IR-One AG & Co. KG, Hamburg
Typesetting In-house using FIRE.sys
Printed by Elanders Germany GmbH, Waiblingen
Paper 400 g/m2, 200 g/m2, 150 g/m2 BVS, 120 g/m2 Amber Graphic
ISBA: R.2979.1203
Publication of the EnBW Annual Report 2011: 7 March 2012
Photos Cover Roland Horn, Berlin Board of Management and Supervisory Board pp. 4-7, 8-9, 11 Catrin Moritz, Essen Top issues EnBW Energie Baden-Württemberg AG Photo pages Juri Junkov, Wittlingen Tom Kohler, Karlsruhe Dominik Obertreis, Althütte
No offer or investment recommendation This report has been prepared for information purposes only. It does not constitute an offer, an invitation or a recommendation to purchase or sell securities issued by EnBW Energie Baden-Württemberg AG (EnBW), a company of the EnBW group or any other company. This report does not constitute a request, instruction or recommendation to vote or give consent. All descriptions, examples and calculations are included in this report for illustration purposes only.
Future-oriented statements This report contains future-oriented statements that are based on current assumptions, plans, estimates and forecasts of the management of EnBW. Such future-oriented statements are therefore only valid at the time at which they are published for the first time. Future-oriented statements are indicated by the context, but may also be identified by the use of the words “may”, “will”, “should”, “plans”, “intends”, “expects”, “believes”, “assumes”, “forecasts”, “potentially” or “continued” and similar expressions.
By nature, future-oriented statements are subject to risks and uncertainties that cannot be controlled or accurately predicted by EnBW. Actual events, future results, the financial position, development or performance of EnBW and the companies of the EnBW group may therefore diverge considerably from the future-oriented statements made in this report. Therefore it cannot be guaranteed nor can any liability be assumed otherwise that these future-oriented statements will prove complete, correct or precise or that expected and forecast results will actually occur in the future.
No obligation to update the information EnBW assumes no obligation of any kind to update the information contained in this report or to adjust or update future-oriented statements to future events or developments. This annual report can also be downloaded from the internet in German or English. In the event of variances, the German version shall take precedence over the English translation.
Shareholder Hotline/Investor Relations Phone: 0800 1020030 or
0800 AKTIEENBW (only in Germany)
Fax: 0800 3629111 (only in Germany) E-mail: [email protected] Internet: www.enbw.com
Important note

March
GKN I and KKP 1 go offlineFollowing the damage at Japanese
nuclear power plants as a result of a
severe earthquake in combination with
a tsunami, the federal government de-
cides to suspend for a period of three
months the extension of the term of
nuclear power plants’ working lives that
had been agreed in autumn 2010. This
also affects unit I of Neckarwestheim
nuclear power plant (GKN I) and unit 1 of
Philippsburg nuclear power plant (KKP 1),
which EnBW takes offline before the
end of March. In July, the upper house
January
New solar farm goes onlineThe 900 kW photovoltaic plant in March-
Neuershausen makes a contribution
to environmental protection in Baden-
Württemberg: The volume of electricity
of around 930,000 kWh per year is suf-
ficient to supply 270 households with
energy from the sun. This allows 540 t of
CO2 to be saved each year.
In November, EnBW will commence con-
struction of an additional solar farm in
Krautheim in the district of Hohen lohe.
An abandoned landfill site will become
the site for a photovoltaic power plant
which will go online at the end of the year
with an output of 507 kW. This is EnBW’s
fourth solar farm already in Baden-
Württemberg.
February
New smart grid competence centreEnBW creates a new competence centre
to bundle its many competencies in the
field of smart grids. Representatives
from eight subsidiaries and investees
contribute their specialist knowledge to
gear the development of the electricity
distribution grids to the changing tasks
of the future.
May
EnBW Baltic 1 officially commissionedCommercial use of offshore wind power
in Germany is heralded in on the Baltic
Sea in the presence of Federal Chan-
cellor Dr. Angela Merkel, Prime Minis-
ter Erwin Sellering and representatives
from business and politics. The electricity
from EnBW‘s Baltic 1 wind farm, 185 mil-
lion kWh a year, is enough to supply
50,000 households.
June
Onshore activities reinforcedEnBW buys another onshore wind farm
with 6 MW near Friedberg in the federal
state of Hesse. EnBW likewise rein forces
its commitment to this technology in
Baden-Württemberg: In July, it constructs
the first wind turbines with a hub height of
138 m in Schopfloch near Dornstetten in
the Freudenstadt district in the northern
Black Forest. They have a nominal out-
put of 2 MW and will generate electricity
for some 1,180 households each year. In
November, EnBW acquires a wind farm
in Christinendorf in Brandenburg with an
output of 6 MW. Contracts for the project
development of two further wind farms
are concluded in 2011. Further locations
are being reviewed.
Top issues 2011
vTo
p is
sues
201
1
of the German parliament approves the
gradual phase-out of nuclear power in
Germany by the year 2022. Following
this decision, the eight German nuclear
power plants affected by the temporary
shutdown will not be put back online.
The nine nuclear power plants still in
operation will be issued dates by which
they must be closed down at the latest.
April
EnBW is main electricity partner for municipalities in the stateIn a Europe-wide tender process by
the Association of the Municipalities of
Baden-Württemberg, EnBW is awarded
the contract to supply 262 million kWh
of electricity to more than 14,000 town
halls, kindergartens, schools and other
municipal facilities throughout Baden-
Württemberg in 2012 and 2013.

October
Public participation in Forbach and LeutkirchIn Forbach, EnBW Kraftwerke AG pre-
sents the latest update to the public on
its expansion plans for the planned new
pumped storage power plant. The first
meeting regarding public participation
for the “Sustainable town of Leutkirch”
project is held. In Leutkirch, EnBW
develops a concept of an energy- efficient,
low-emission and locally supplied
municipality with partners and municipal-
ities. By offering local solutions such as
the “sustainable town”, EnBW supports
municipalities in the development and
economic implementation of individual
energy services. Both public events are
very well received.
November
Construction work begins on EnBW Baltic 2 offshore wind farmIn Kiel, construction begins on the sub-
station and foundation for the offshore
wind farm EnBW Baltic 2. The substa-
tion is the heart of the wind farm, which,
once complete, will harness the electricity
generated by 80 wind turbines, thus
raising the voltage from 33 kV to 150 kV
and transporting it to land via two under-
sea cables. It is due to be completed by
the end of 2012.
December
EnBW investmentsThe supervisory board of Stadtwerke
Düsseldorf, with EnBW as the majority
shareholder, approves the construction
of a highly efficient gas and steam tur-
bine plant. It is scheduled to generate
environmentally friendly electricity and
district heating as of 2016 in Lausward
at Düsseldorf port.
EnBW parts with its non-controlling
interests in Poland and sells these to
Electricité de France (EDF). EDF acquires
EnBW’s 32.45% shareholding in the Polish
coal-fired power station in Rybnik in
southern Poland and its 15.59% share-
holding in the Kogeneracja CHP plant
in Wroclaw. The sale is still subject to
the approval of the antitrust authorities.
EnBW sells a share of 15.05% in its Swiss
subsidiary Energiedienst Holding (EDH) to
Services Industriels de Genève (SIG). With
66.67%, however, EnBW continues to have
economic control of EDH.
July
Last stage of Neckar hydro-electric power station com-pletedIn Esslingen, EnBW Kraftwerke AG puts
the new run-of-the-river power station into
operation. It has an installed cap a city of
1.25 MW and will supply some 4,500 people
with CO2-free electricity in the future. The
operator Neckar-AG, an 82% subsidiary
of EnBW Kraftwerke AG, has invested
€ 5.2 million in the power station.
August
New 380,000 volt switchgear inauguratedAfter a three-year construction period,
the new switchgear installed in the Gross-
gartach transformer substation will in the
future form one of the most important
connection points in EnBW Transport-
netze AG’s network. Electricity transits
from electricity trading across Europe and
wind power in the north of Germany will
flow through this transformer substation.
September
Rheinfelden hydro-electric power station officially com-missionedAfter some eight years’ construction at
an investment cost of € 380 million, the
newly constructed run-of-the-river power
station in Rheinfelden now generates
green electricity for approximately
170,000 households. The new plant has an
installed capacity of 100 MW, four times
that of the old plant.

Financial calendar
7 | 3 | 2012Publication of the Annual Report 2011
26 | 4 | 20122012 annual general meeting
8 | 5 | 2012Publication of the Quarterly Financial Report January to March 2012
27 | 7 | 2012Publication of the Six-Monthly Financial Report January to June 2012
9 | 11 | 2012Publication of the Nine-Monthly Financial Report January to September 2012
Cover photo: Our cover shows work on the runner of a turbine during con-struction of the new run-of-the-river power station in Rheinfelden. The new plant, which was commissioned in September 2011 following an almost eight-year construction period, has four times the capacity of the previous power station. Energiedienst AG, an investment company of EnBW’s, is the building principal and operator.
EnBW EnergieBaden-Württemberg AGDurlacher Allee 9376131 Karlsruhewww.enbw.com