adapting transportation systems to climate … transportation systems to climate change: ... model...
TRANSCRIPT

April 11, 2014
Discussion Document
Adapting Transportation Systems to Climate Change: a Multi-Modal Approach
1
Table of Contents
Background and Objective of the Study
Climate Change Impacts on Transportation
Macroeconomic Analysis: Northeast Corridor (NEC)
Business Analysis: Passenger Rail and Air
Multi-modal Challenges and Solutions

2
How do we define systemic impacts of climate change on multi-modal transportation systems?
“Systemic impacts of climate change are those that affect the performance or scope of the transportation system. These impacts effect transportation operations, planning, and
infrastructure design, and may influence national-scale estimates of transportation costs.”
Categories of systemic impacts include:
1) Changes in transportation systems induced by climate – induced changes in the economy or society
2) Changes in system capacity or reliability induced directly by climate effects
3) Changes in system capacity or reliability induced indirectly by damages to infrastructure
SOURCE: U.S. Department of Transportation, Systemic Impacts of climate change on transportation, Workshop, October 11-12, 2012
Background and Objective Climate and Transportation Macroeconomic Analysis Business Analysis Challenges and Solutions

3
Our systemic impact study consisted of two separate analyses looking at the economic and business impacts of climate change
Questions guiding the study:
1. How might climate change disrupt the multi-modal transportation system?
2. What are the external and internal consequences of these disruptions on the system?
3. Are there collaborative solutions to these multi-modal impacts?
4. What are the challenges to addressing these impacts collaboratively?
1. Macroeconomic Analysis Objective: Evaluate the
macroeconomic consequences of transportation disruptions due to climate change and extreme weather. • Regional GDP • Regional Employment
2. Business Analysis Objective: Consider the business
consequences of passenger rail and air transportation disruptions due to climate change and extreme weather. • Passenger and Revenue Flow • System as an industry
Background and Objective Climate and Transportation Macroeconomic Analysis Business Analysis Challenges and Solutions

4
Climate change has the potential to impact railroad infrastructure and operations under a variety of extreme weather scenarios
Scenarios Infrastructure Impacts
Operational Impacts
Extreme Heat • Sun kinks and track warping
• Power failures
• Derailments • Signal Outages
Extreme Cold • Brittle track • Track fracturing
• Derailments • Signal outages
Sea Level Rise/Storm Surge
• Track flooding • Soil and coastal
erosion to track beds
• Track impassibility • Road impassibility for
safety and maintenance vehicles
Increased Precipitation (rain/snow/ice)
• Track flooding • Snow impassibility • Catenary damage • Tunnel flooding
• Track impassibility • Need for train
rerouting
Increased frequency of hurricanes
• Track flooding • Catenary damage • Locomotive stability
in high cross-winds • Damage to bridges
• Scheduling disruptions
• Route Cancellations
Background and Objective Climate and Transportation Macroeconomic Analysis Business Mockups Challenges and Opportunities

5
Climate change has the potential to impact aviation infrastructure and operations under a variety of extreme weather scenarios
Scenarios Infrastructure Impacts
Operations Impacts
Extreme Heat • Limits to airport construction due to health and safety concerns
• Aircraft performance limitations (e.g. take off field length)
• Cargo weight restrictions
Extreme Cold • Infrastructure/systems reliability
• De-icing • Operational
disruptions
Sea Level Rise/Storm Surge
• Vulnerability to inundation
• Airport closures
Increased Precipitation (rain/snow/ice)
• Runway/taxiway system flooding
• Need for additional de-icing of aircraft
• Grounding of aircraft causes delays and cancellations
Increased frequency of Hurricanes
• Airport infrastructure and Naiads damages
• Grounding of aircraft causes delays and cancellations
• Aircraft damage
Background and Objective Climate and Transportation Macroeconomic Analysis Business Mockups Challenges and Opportunities

6
The Northeast Megaregion
The Northeast Megaregion is one of the economic powerhouses of the nation: • Population 2010: 52,332,123 • Percent of U.S. Population: 17% • Population 2025: 58.4 million • Population 2050: 70.8 million • Projected Growth (2010 - 2050): 35.2
percent (18.4 million) • Gross Domestic Product (2010):
$2.92 trillion • Percent of U.S. GDP (2010): 20%
Background and Objective Climate and Transportation Macroeconomic Analysis Business Analysis Challenges and Opportunities
SOURCE: http://www.america2050.org/northeast.html

7
The Northeast macroeconomic analysis focused on the impact of increased storms on rail, road, air and maritime transportation
The Northeast Megaregion connects the Northeast Corridor via road (I-95), rail and air for freight and passenger movement – all of these are highly vulnerable to disruption from storms
Currently, approximately ten major storms hit the Northeast Megaregion each year
Based on data from NOAA these storms vary in seriousness and impact on the transportation industry:
Intensity of Storm Probability of Occurrence, 1958 to
2010
Number of Days Transportation was
Impacted
Extreme 0.05 7
Crippling 0.24 5
Major 0.32 3
Significant 0.19 2
Notable 0.19 1
Background and Objective Climate and Transportation Macroeconomic Analysis Business Analysis Challenges and Opportunities

8
Scientific reports and case studies were reviewed to determine the percentage increase of storms in the region between 2015-2050
Based on NOAA and Union of Concerned Scientists modeling, the number of storms in all categories should increase by 9 %in the period 2015-2050 due to climate change:
Intensity of Storm Probability of Occurrence, 1958 to 2010
1958 to 2010 2015-2050
Extreme 0.05 0.06
Crippling 0.24 0.27
Major 0.32 0.35
Significant 0.19 0.21
Notable 0.19 0.21
SOURCES: NOAA, Coastal impacts, adaptations, and vulnerabilities, 2012 Union of Concerned Scientists, The changing northeast climate, 2006
Background and Objective Climate and Transportation Macroeconomic Analysis Business Analysis Challenges and Opportunities

9
Booz Allen used DIME (Dynamic Impact Macroeconomic) model to analyze economic and employment losses from storm impacts
Background and Objective Climate and Transportation Macroeconomic Analysis Business Analysis Challenges and Opportunities
What is DIME? – DIME is Booz Allen’s derivation of REMI (Regional Economics Model, Inc.) – Dynamic economic and gravity models explore the impacts of a shock to a system
What are the component of the model? – Input-Output: inter-industry relationships and transactions between industries – General Equilibrium: stabilization of an economic system – Econometric: measure speed of economic response – Economic Geography: spatial dimension of economic system
Assumptions – Study limited to intense storms, did not account for other climate change scenarios – All estimates developed by regional macroeconomic input/output models – Storm estimates based on current available data
SOURCE: http://www.remi.com/the-remi-model

10
The analysis used a baseline of 2005 economic and employment data to estimate regional impacts from storms between 2015-2050
Using DIME, we estimated the economic impacts on the region between 2015-2050 under both existing storm probabilities, and the 9% increase in probability.
GDP Employment
Regions Fixed 2005 $B % Change Jobs (thousands) % Change
Baseline – Current Pattern of Storms without 9% increase
Northeast Corridor -16.2 -0.0033 -111.5 -0.0026
Climate Change Scenario – 9% Increase in Storms Compared to Baseline
Northeast Corridor -17.7 -0.0036 -121.5 -0.0028
Change Between Baseline and Climate Change Scenario
Northeast Corridor -1.5 -0.0003 -10.0 -0.0002
Background and Objective Climate and Transportation Macroeconomic Analysis Business Analysis Challenges and Opportunities
11
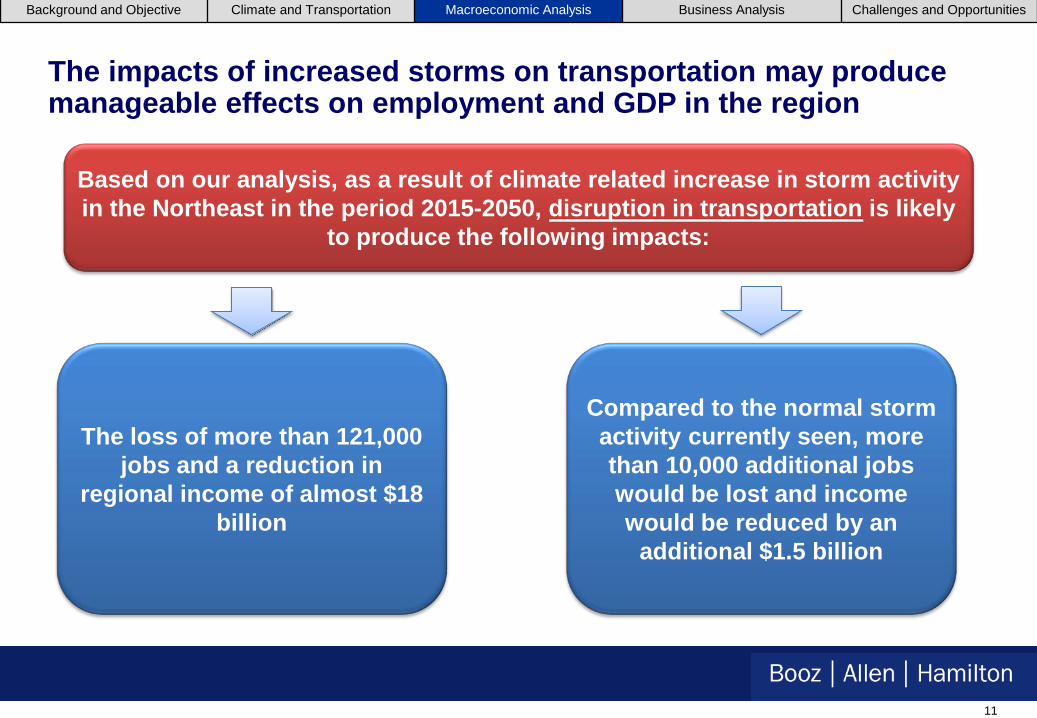
The impacts of increased storms on transportation may produce manageable effects on employment and GDP in the region
Based on our analysis, as a result of climate related increase in storm activity in the Northeast in the period 2015-2050, disruption in transportation is likely
to produce the following impacts:
The loss of more than 121,000 jobs and a reduction in
regional income of almost $18 billion
Compared to the normal storm activity currently seen, more than 10,000 additional jobs would be lost and income would be reduced by an
additional $1.5 billion
Background and Objective Climate and Transportation Macroeconomic Analysis Business Analysis Challenges and Opportunities

12
The second analysis concerns the business impacts various climate scenarios will have on two modes - passenger rail and air
What are the emerging business risks / opportunities on these modes due to climate change? – Loss/gain of passenger revenue – Public perceptions of mode reliability over time
What are the long-term business considerations due to climate change? Integration of climate change considerations into : – Service Availability: Extending existing services to accommodate displaced passengers from
other mode, contracting services due to loss of passengers within mode – Existing Operations and Infrastructure: Operations and Maintenance (O&M) budgets,
retrofitting existing infrastructure for greater resiliency – New Operations and Infrastructure: Airport Master Plans and Amtrak’s State of Good Repair
(SOGR) schedules (decision-making documents) – Safety and Emergency Preparedness: Airport Emergency Plans (AEPs), Amtrak’s Emergency
Management and Corporate Security Department With the impacts of climate change, will there emerge a transportation mode within the system that is considered most reliable? Does one mode hold an advantage over the other?
Background and Objectives Climate and Transportation Macroeconomic Analysis Business Analysis Challenges and Opportunities

13
Each scenario causing systemic impacts may lead to mode shifting between passenger rail and air
Scenario Systemic Impact
Rail Aviation
Extreme Heat
Passengers from rail expected to shift to aviation due to catenary failures
and track warping
High Costs Low Costs
Extreme Cold
Unlikely to cause major disruptions for either mode
Low Costs Low Costs
Sea Level Rise/Storm
Surge
Likely to cause major service disruptions and impacts to
infrastructure for both modes
High Costs High Costs
Increased Precipitation
Passengers from air expected to shift to rail due to grounded flights
Low Costs High Costs
Increased frequency of hurricanes
Both modes expected to suffer passenger loss and infrastructure
damage
High Costs High Costs
Potential Mode Shift
Potential Mode Shift
Background and Objectives Climate and Transportation Macroeconomic Analysis Business Analysis Challenges and Opportunities

14
The proposed study is a collaboration with Amtrak to determine any correlation between ridership and certain climate scenarios Purpose of the Study: Determine how extreme weather events in the northeast region impact ridership along Amtrak’s NEC passenger lines, and subsequent revenue generated from those lines.
Jan-11 2,126,429 Feb-11 2,099,010 Mar-11 2,610,567 Apr-11 2,688,955
May-11 2,691,371 Jun-11 2,812,202 Jul-11 2,890,763
Aug-11 2,719,462 Sep-11 2,521,110 Oct-11 2,389,179 Nov-11 2,631,290 Dec-11 2,515,467
Multimodal Transportation Indicators Title Amtrak Ridership Subject Passenger Usage Mode Rail Source http://safetydata.fra.dot.gov/OfficeofSafety/ Date October 26, 2012
AMTRAK RIDERSHIP
unit passengers month Number of Passengers
Data Needs:
Data Source Number of cancellations due to weather conditions (NEC)
Amtrak
Daily ridership data Amtrak
Daily weather reports in northeast region
NOAA
Questions: – What happens to ridership given various extreme weather
events? (decrease or increase) – What is the revenue lost or gained during those occurrences? – Based on this baseline, can future losses and gains be
extrapolated given extreme weather predictions over the next 50-100 years?
– When do these losses or gains in revenue necessitate the need for changes in operations and or service? **Would conduct a similar study using airline
data to evaluate multi-modal impacts
Background and Objectives Climate and Transportation Macroeconomic Analysis Business Analysis Challenges and Opportunities

15
Given that extreme events will impact multi-modal systems, how can we build resiliency and adapt to climate change as a system?
Challenges:
Funding of Transportation Studies: funding for transportation studies are often silohed by mode, creating difficulty in coordinating across modes to explore multi-modal solutions
Multiple Stakeholders: variety of stakeholders with competing interests adds complexity to multi-modal solutions (Amtrak, airlines, transit authorities, port authorities, state and local governments, etc.)
Mode Competition: profit-making industry, air and rail passenger companies won’t necessarily concede revenue opportunities to the other mode under a multi-modal solution
Climate Change Data: difficult to assess multi-modal solutions in the absence of granular climate change data at the transportation planning level
Opportunities:
Climate Change Data: united transportation industry demonstrates a strong need for the data at the planning level
Sustainable Communities: encourage regional, smart growth that accounts for climate impacts of the multi-modal transportation system
Transfer Points: development of transfer points between air and rail has a revenue generating advantage, and can accommodate weather induced passenger shifts when necessary
Background and Objective Climate and Transportation Macroeconomic Analysis Business Analysis Challenges and Opportunities