add-on module steel
TRANSCRIPT

Program STEEL © 2013 Dlubal Engineering Software
Add-on Module
STEEL Stress Analysis Cross-section Optimization
Program Description
Version July 2013
All rights, including those of translations, are reserved.
No portion of this book may be reproduced – mechanically, electronically, or by any other means, including photocopying – without written permission of DLUBAL ENGINEERING SOFTWARE. © Ing.-Software Dlubal Am Zellweg 2 D-93464 Tiefenbach
Tel.: +49 (0) 9673 9203-0 Fax: +49 (0) 9673 9203-51 E-mail: [email protected] Web: www.dlubal.com


3
Content
Content Page
Content Page
Program STEEL © 2013 Dlubal Engineering Software
1. Introduction 4 1.1 Add-on Module STEEL 4 1.2 STEEL Team 5 1.3 Using the Manual 6 1.4 Open the Add-on Module STEEL 6 2. Input Data 8 2.1 General Data 8 2.2 Materials 10 2.3 Cross-Sections 15 3. Calculation 19 3.1 Detail Settings 19 3.2 Stresses and Ratio 22 3.3 Start Calculation 27 4. Results 28 4.1 Stresses by Cross-Section 29 4.2 Stresses by Set of Members 31 4.3 Stresses by Member 32 4.4 Stresses by x-Location 33 4.5 Stresses at Every Stress Point 34 4.6 Governing Internal Forces by Member 35 4.7 Governing Internal Forces by Set of
Members 36 4.8 Parts List by Member 37 4.9 Parts List by Set of Members 38
5. Results Evaluation 39 5.1 Selection of Stresses 40 5.2 Results on Cross-section 41 5.3 Results in RSTAB Model 43 5.4 Result Diagrams 46 5.5 Filter for Results 47 6. Printout 49 6.1 Printout Report 49 6.2 Printing STEEL Graphics 49 6.2.1 Results on Cross-Section 49 6.2.2 Results in the RSTAB Model 50 6.2.3 Result Diagrams 52 7. General Functions 53 7.1 Design Cases 53 7.2 Cross-Section Optimization 55 7.3 Units and Decimal Places 57 7.4 Data Transfer 58 7.4.1 Material Export to RSTAB 58 7.4.2 Export of Results 58 A Literature 60
B Index 61

1 Introduction
4 Program STEEL © 2013 Dlubal Engineering Software
1. Introduction
1.1 Add-on Module STEEL
The RSTAB add-on module STEEL performs general stress designs by calculating normal, shear, and equivalent stresses and comparing them with the limit stresses. The add-on module pro-vides a comprehensive library for cross-sections and materials with standard-specific limit stresses that can be adjusted and expanded. All cross-sections are provided with design rele-vant stress points. The results of these points can also be used for graphical evaluations.
As STEEL is integrated in the graphical user interface of the main program, you can use all in-put data of the model as well as the internal forces for the design. You can evaluate the stress-es and stress ratios in the RSTAB work window graphically and include them in the global printout report.
The internal forces that are found to be governing for the design are indicated for each mem-ber. During the stress analysis, you can also determine the maximum stresses of sets of mem-bers. In addition, STEEL offers you an automatic cross-section optimization including an export option for modified cross-sections to RSTAB.
Using the so-called design cases, you can analyze the different types of stress designs. A parts list with quantity surveying completes the design.
The following useful features facilitate the work with STEEL:
• Display of maximum stress ratios in the cross-section table, helping you to decide how to optimize the cross-section
• Connection between STEEL tables and RSTAB work window, thus selecting, for example, the current member of the table in the background graphic
• View mode to change the view in the RSTAB work window
• Colored relation scales in results windows
• Info icon for successful or failed stress design
• Representation of STEEL stresses and ratios in the form of result diagrams
• Filter options for the stresses displayed in the RSTAB graphic
• Display of stresses and stress ratios on rendered model
• Export of modified cross-sections and materials to RSTAB
• Data export to MS Excel and OpenOffice.org Calc or as a CSV file
Therefore, STEEL is the appropriate program for general stress analyses. However, stability analyses, as required for example in EN 1993-1-1 or DIN 18000 part 2, cannot be performed. For such analyses, the add-on modules STEEL EC3 or KAPPA and LTB are recommended.
We hope you will enjoy working with the add-on module STEEL.
Your DLUBALTeam

1 Introduction
5 Program STEEL © 2013 Dlubal Engineering Software
1.2 STEEL Team The following people were involved in the development of STEEL:
Program coordination Dipl.-Ing. Georg Dlubal Dipl.-Ing.(FH) Younes El Frem
Programming Ing. Ing. Zdeněk Kosáček Dipl.-Ing. Georg Dlubal Ing. Martin Budáč
Mgr. Petr Oulehle Zbyněk Zámečník
Cross-section and material database Ing. Ph.D. Jan Rybín Mgr. Petr Oulehle
Ing. Jiří Kubíček
Program design, dialog figures and icons Dipl.-Ing. Georg Dlubal MgA. Robert Kolouch
Ing. Jan Miléř
Program supervision Ing. Martin Vasek M.Eng. Dipl.-Ing.(BA) Andreas Niemeier
Localization, manual Ing. Fabio Borriello Ing. Dmitry Bystrov Eng.º Rafael Duarte Ing. Jana Duníková Ing. Lara Freyer Alessandra Grosso Bc. Chelsea Jennings Jan Jeřábek Ing. Ladislav Kábrt Ing. Aleksandra Kociołek Mgr. Michaela Kryšková Dipl.-Ing. Tingting Ling
Ing. Roberto Lombino Eng.º Nilton Lopes Mgr. Ing. Hana Macková Ing. Téc. Ind. José Martínez MA SKT Anton Mitleider Dipl.-Ü. Gundel Pietzcker Mgr. Petra Pokorná Ing. Zoja Rendlová Dipl.-Ing. Jing Sun Ing. Marcela Svitáková Dipl.-Ing. (FH) Robert Vogl Ing. Marcin Wardyn
Technical support and quality management M.Eng. Cosme Asseya Dipl.-Ing. (BA) Markus Baumgärtel Dipl.-Ing. Moritz Bertram M.Sc. Sonja von Bloh Dipl.-Ing. (FH) Steffen Clauß Dipl.-Ing. Frank Faulstich Dipl.-Ing. (FH) René Flori Dipl.-Ing. (FH) Stefan Frenzel Dipl.-Ing. (FH) Walter Fröhlich Dipl.-Ing. Wieland Götzler Dipl.-Ing. (FH) Andreas Hörold Dipl.-Ing. (FH) Paul Kieloch
Dipl.-Ing. (FH) Bastian Kuhn Dipl.-Ing. (FH) Ulrich Lex Dipl.-Ing. (BA) Sandy Matula Dipl.-Ing. (FH) Alexander Meierhofer M.Eng. Dipl.-Ing. (BA) Andreas Niemeier Dipl.-Ing. (FH) Gerhard Rehm M.Eng. Dipl.-Ing. (FH) Walter Rustler M.Sc. Dipl.-Ing. (FH) Frank Sonntag Dipl.-Ing. (FH) Christian Stautner Dipl.-Ing. (FH) Lukas Sühnel Dipl.-Ing. (FH) Robert Vogl

1 Introduction
6 Program STEEL © 2013 Dlubal Engineering Software
1.3 Using the Manual Topics like installation, graphical user interface, results evaluation, and printout are described in detail in the manual of the main program RSTAB. The present manual focuses on typical fea-tures of the STEEL add-on module.
The descriptions in this manual follow the sequence of the module's input and results windows as well as their structure. The text of the manual shows the described buttons in square brack-ets, for example [View mode]. At the same time, they are pictured on the left. Expressions ap-pearing in dialog boxes, windows, and menus are set in italics to clarify the explanations.
At the end of the manual, you find the index. However, if you don’t find what you are looking for, please check our website www.dlubal.com where you can go through our comprehensive FAQ pages by selecting particular criteria.
1.4 Open the Add-on Module STEEL RSTAB provides the following options to start the add-on module STEEL.
Menu To start the program in the RSTAB menu bar, click
Add-on Modules → Design - Steel → STEEL.
Figure 1.1: Menu: Add-on Modules → Design - Steel → STEEL

1 Introduction
7 Program STEEL © 2013 Dlubal Engineering Software
Navigator As an alternative, you can start the add-on module STEEL in the Data navigator by clicking the corresponding entry.
Add-on Modules → STEEL.
Figure 1.2: Data navigator: Add-on Modules → STEEL
Panel In case STEEL results are already available in the RSTAB model, you can also open the design module in the panel:
Set the relevant STEEL design case in the load case list of the RSTAB toolbar. To display the stresses and design ratios graphically, click [Show Results].
When the results display is activated, the panel is available, too. Now you can use the button [STEEL] to open the module.
Figure 1.3: Panel button [STEEL]

2 Input Data
8 Program STEEL © 2013 Dlubal Engineering Software
2. Input Data When you have started the add-on module, a new window opens. In this window, a Navigator is displayed on the left, managing the tables that can be selected currently. The drop-down list above the navigator contains the design cases (see chapter7.1, page 53).
The design relevant data is defined in three input windows. When you open STEEL for the first time, the following parameters are imported automatically:
• Members and sets of members
• Load cases as well as load, result, and super combinations
• Materials
• Cross-sections
• Internal forces (in background, if calculated)
To select a table, click the corresponding entry in the navigator. To set the previous or next in-put window, use the button shown on the left. You can also use the function keys to select the previous [F3] or next [F2] window.
Click [OK] to save the results. Quit STEEL and return to the main program. When you click [Cancel], you exit the module but without saving the data.
2.1 General Data In window 1.1 General Data, you select the members, sets of members, and actions that you want to design. The design standard will be specified in window 1.2 because the material properties are related to the standard.
Figure 2.1: Window 1.1: General Data

2 Input Data
9 Program STEEL © 2013 Dlubal Engineering Software
Design of
Figure 2.2: Design of members and sets of members
The design can be carried out for Members as well as for Sets of Members. If you want to design only selected objects, clear the All check boxes. Then you can access the input fields to enter the relevant members or sets of members. The list of the numbers preset in the field can be se-lected by double-clicking and overwritten by entering the data manually. Use the button [] if you want to display the objects graphically.
When you design a set of members, STEEL determines the maximum stress ratio of all mem-bers contained in the set of members. The results are shown in the window 2.2 Stresses by Set of Members, 3.2 Governing Internal Forces by Set of Members and 4.2 Parts List by Set of Members.
Click [New] to create a new set of members. The dialog box that you already know from RSTAB appears where you can specify the parameters for a set of members.
Existing Load Cases In this column, all load cases as well as load and result combinations that have been created in RSTAB are listed.
Furthermore, STEEL is able to design super combinations and dynamic load cases from the add-on module DYNAM.
Use the button [] to transfer selected entries to the list Selected for Design on the right. You can also double-click the entries. To transfer the complete list to the right, use the button [].
To transfer multiple entries of load cases, click the entries while pressing the [Ctrl] key, as common for Windows applications. Thus, you can transfer several load cases at the same time.
Load cases that are marked by an asterisk (*), like load case 6 and 7 in Figure 2.1, cannot be de-signed: This happens when the load cases are defined without any load data or the load case contains imperfections. Then, when you transfer the load cases, a corresponding warning ap-pears.
At the end of the list, there are several filter options available. They will help you assign the en-tries sorted according to load cases and combinations or action categories. The buttons are re-served for the following functions:
Select all cases in the list.
Invert selection of load cases.
Table 2.1: Buttons in dialog section Existing Load Cases
Selected for Design The column on the right lists the load cases as well as the load and result combinations select-ed for the design. Click [] or double-click the entries to remove selected items from the list. With the button [], you can transfer the entire list to the left.
The design of an enveloping max/min result combination is performed faster than the analysis of all load cases and load combinations that have been globally set. However, when analyzing a result combination, the influence of the contained loads is difficult to infer.

2 Input Data
10 Program STEEL © 2013 Dlubal Engineering Software
Comment
Figure 2.3: User-defined comment
In this input field, you can enter user-defined notes describing in detail, for example, the cur-rent STEEL design case.
2.2 Materials The window is subdivided into two parts. In the upper part, all materials created in RSTAB are listed. In the Material Properties section, the properties of the current material, that is the table row currently selected in the upper section, are displayed.
Figure 2.4: Table 1.2 Materials
Materials that won't be used in the design appear in gray lettering. Materials that are not al-lowed are highlighted red. Modified materials are displayed in blue.
The material properties required for the determination of internal forces are described in chap-ter 4.2 of the RSTAB manual (Main Properties). The material properties required for design are stored in the global material library. The values are preset (Additional Properties).
To adjust the units and decimal places of material properties and stresses, select in the mod-ule's Settings → menu Units and Decimal Places (see chapter 7.3, page 57).

2 Input Data
11 Program STEEL © 2013 Dlubal Engineering Software
Material Description The materials defined in RSTAB are already preset, but it is always possible to modify them. To activate the field, click the material in column A. Then click the button [] or press function key [F7] to open the material list.
Figure 2.5: List of materials
Only "Steel" materials are available in the list. In principle, you can carry out the design with dif-ferent materials if their stress design concept is based on the comparison of existing normal, shear, and equivalent stresses with allowable stresses (for example the design of cross-sections consisting of aluminum or stainless steel). Of course, you must additionally take into account further standard specifications.
When you have imported a material, the design relevant Material Properties are updated.
Limit stresses of a material that is not allowed (for example coniferous timber) can be defined by means of Yield Strength (column C) or by ticking the check box Manually (column D) and entering user-defined specifications. When you have defined the allowable stresses in the col-umns E to G, the red color will disappear.
If you change the material description manually and the entry is stored in the material library, STEEL will import the material properties, too.
The import of materials from the library is described later.
Safety Factor γM
This factor describes the safety factor contained in the design values of the material stiffnesses. Therefore, M is indicated. By means of the factor γM, the characteristic value of the yield strength fyk is reduced in order to determine the limit normal stress σR,d (see Equation 2.1) and the limit shear stress τR,d (Equation 2.2).
Thus, for example for DIN 18800, the factor γM is considered twice for the design if the calcu-lation is carried out according to second-order or large deformation analysis: According to DIN 18800 part 2, el. (116) you must consider the influence of deformations by a stiffness that is reduced about 10 % when determining internal forces. Moreover, you must reduce the de-sign values of the stiffnesses by the safety factor γM when you design the ultimate limit state.
Yield Strength fy,k
The yield strength describes the limit to which the material can be strained without plastic deformation. The characteristic values of several steel grades can be found for example in EN 1993-1-1, section 3 or DIN 18800 part 1, section 4.
When modifying the yield strength, the limit stresses in columns E, F, and G are adjusted au-tomatically.
For some materials, there is a relation between the characteristic yield strength fy,k and the thickness t of the relevant structural component. In the section Material Properties, the Thick-ness Range of the material selected above is shown with the corresponding yield strength.

2 Input Data
12 Program STEEL © 2013 Dlubal Engineering Software
The zones of the yield strength are specified in the standards, for example DIN 18800 part 1, table 1. To control and, if required, adjust the thickness of structural components including yield strength, click [Edit] (see Figure 2.7, page 14).
Limit Stresses The limit stresses of materials that are stored in the material library are preset automatically.
If you want to adjust the limit stresses, you can use the check box Manually or the button [Edit Material] (see Figure 2.7, page 14).
Manually
If the check box is ticked, you can define the limit stresses in columns E to G manually.
Modified material properties are marked by an asterisk in the column Material Description.
Limit σx
The limit normal stress represents the allowable stress for actions due to bending and axial force. According to DIN 18800 part 1, el. (746), it is determined by the characteristic value of the yield strength, reduced by the partial safety factor γM.
M
ykd,R,x
fγ
=σ
Equation 2.1
Limit τ
The limit shear stress indicates the allowable shear stress due to shear and torsion. To deter-mine the limit shear stress according to DIN 18800 part 1, el. (746), the partial safety factor γM is also taken into account by the equation used to determine the limit shear stress.
3
f
M
ykd,R
⋅γ=τ
Equation 2.2
Limit σeqv
The limit equivalent stress represents the allowable equivalent stress for the simultaneous ef-fect of several stresses. According to DIN 18800 part 1, el. (746), it is determined by Equation 2.1.

2 Input Data
13 Program STEEL © 2013 Dlubal Engineering Software
Material Library Numerous materials are already available in the library. To open the corresponding dialog box, click
Edit → Material Library
or use the button shown on the left.
Figure 2.6: Dialog box Material Library
In the section Filter, the current Standard group is preset. Select the material quality that you want to use for the design in the list Material to Select. The corresponding properties can be checked in the dialog section below.
Click [OK] or use the [↵] key to transfer the selected material to window 1.2 of the add-on module STEEL.
Chapter 4.2 in the RSTAB manual describes in detail how materials can be filtered, added, or re-arranged.
You can also select materials of categories like Cast Iron or Stainless Steel. Please check, however, whether these materials are allowed by the standard's design concept.

2 Input Data
14 Program STEEL © 2013 Dlubal Engineering Software
Edit Material To adjust the yield strengths and limit stresses of the currently selected material, click the button shown on the left. The following dialog box appears:
Figure 2.7: Dialog box Edit Material
In the table Yield Strengths and Limit Stresses Subject to Component Thicknesses the limits of the Component Thickness t can be shifted by entering values manually in column B. The number of ranges is defined in the standards.
If the check box User-defined, independent definition of limit stresses is ticked, you can define the limit stresses for each range individually. If this check box is not active, the limit stresses are de-termined by the yield strength fy,k (column C) and the safety factor γM according to Equation 2.1 and Equation 2.2.

2 Input Data
15 Program STEEL © 2013 Dlubal Engineering Software
2.3 Cross-Sections This window lists the cross-sections that are used for the design. In addition, the window al-lows you to specify optimization parameters.
Figure 2.8: Window 1.3 Cross-Sections
Cross-Section Description The cross-sections defined in RSTAB are preset together with the assigned material numbers.
If you want to modify a cross-section, click the entry in column B to activate this field. Click [Cross-section Library] or [...] in the field or press function key [F7] to open the cross section table of the current input field (see figure on the left).
In this dialog box, you can select a different cross-section or a different row. To select a differ-ent cross-section category, click [Back to Cross-section Library] and access the general cross-section library.
Chapter 4.3 of the RSTAB manual describes how cross-sections can be selected from the library.

2 Input Data
16 Program STEEL © 2013 Dlubal Engineering Software
Figure 2.9: IS section types in the cross-section library
The new cross-section description can be entered directly in the input field. If the data base contains an entry, STEEL imports these cross-section parameters, too.
A modified cross-section will be highlighted in blue.
If the STEEL cross-sections are different from the ones used in RSTAB, both cross-sections are displayed in the graphic in the right part of the window. The stress analysis will be performed with the internal forces from RSTAB for the cross-section selected in STEEL.
Max. Design Ratio This column will be shown after the calculation. It is a decision support for the optimization. By means of the displayed design ratio and colored relation scales, you can see which cross-sections are little utilized and thus oversized, or overloaded and thus undersized.
Optimize You can optimize every cross-section from the library: Search for the cross-section in the same row that comes as close as possible to a user-defined maximum ratio. The maximum ratio can be defined in the dialog box Details (see Figure 3.1, page 19).
If you want to optimize a cross-section, open the corresponding drop-down list in column D or E and select the relevant entry: From current row or, if available, From favorites 'description'. Recommendations for the cross-section optimization can be found in chapter 7.2 on page 55.
Remark This column shows remarks in the form of footers that are described in detail below the cross-section list.
A warning might appear before the calculation: Incorrect type of cross-section! In this case, there is a cross-section that is not registered in the data base. This may be a user-defined section or a SHAPE-THIN section that has not been calculated yet. To select an appropriate section for the design, use the [Library] button (see description in Figure 2.8).
2 Input Data
17 Program STEEL © 2013 Dlubal Engineering Software
Member with tapered cross-section For tapered members with different cross-sections at the member start and member end, the module displays both cross-section numbers, in accordance with the definition in RSTAB, in two table rows.
STEEL also designs tapered members, provided that the cross-section at the member's start has the same number of stress points as the cross-section at the end of the member. The nor-mal stresses, for example, are determined from the moments of inertia and the centroidal dis-tances of the stress points. If the start and the end cross-section of a tapered member have not the same number of stress points, the intermediate values cannot be interpolated. A calcula-tion won't be possible neither in RSTAB nor in STEEL.
To produce the same number of stress points, you can, for example, define the second cross-section as a copy of the cross-section start with adjusted geometry parameters. The easiest way to do this is to describe both cross-sections as parametric cross-sections. In such a case, the cross-section group IVU I-Section Plus Lower Flange is recommended.
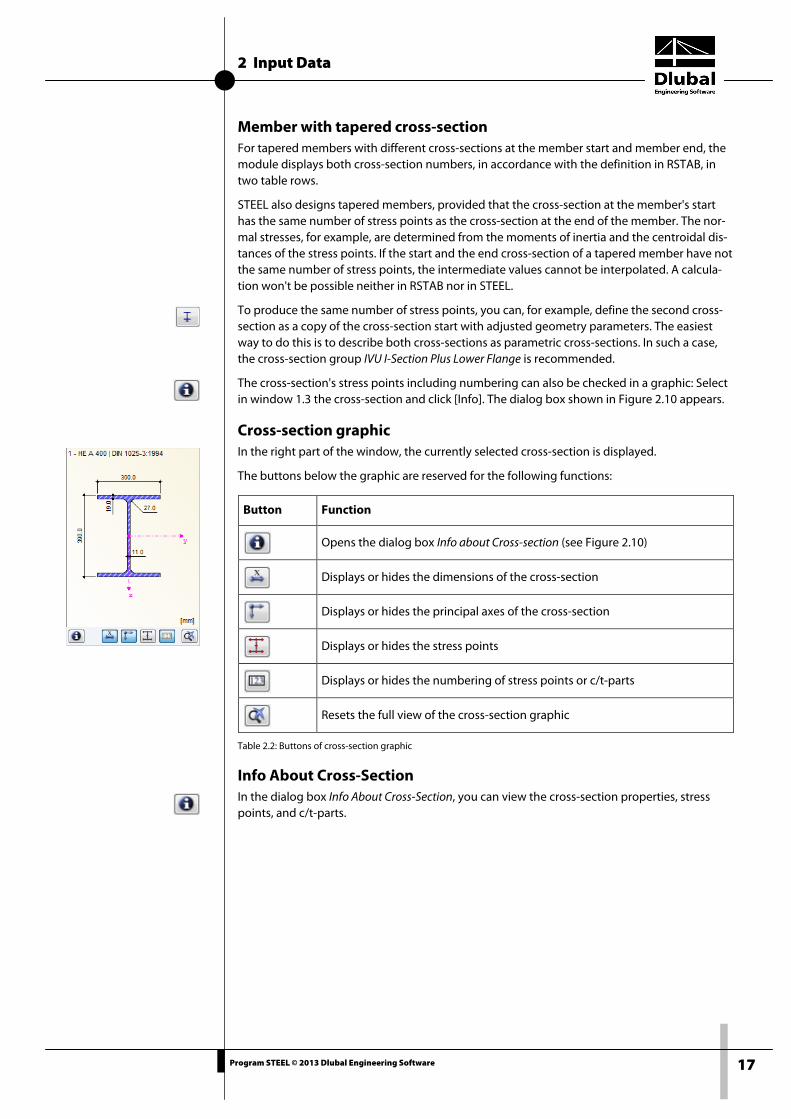
The cross-section's stress points including numbering can also be checked in a graphic: Select in window 1.3 the cross-section and click [Info]. The dialog box shown in Figure 2.10 appears.
Cross-section graphic In the right part of the window, the currently selected cross-section is displayed.
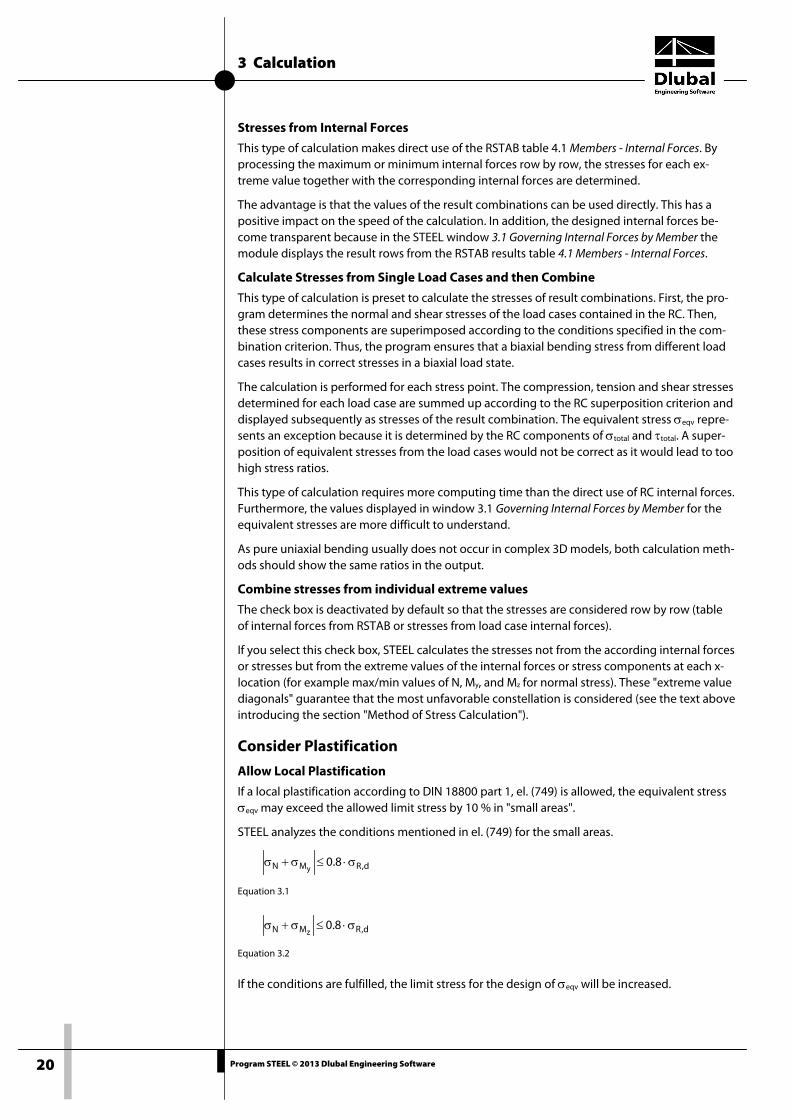
The buttons below the graphic are reserved for the following functions:
Table 2.2: Buttons of cross-section graphic
Info About Cross-Section In the dialog box Info About Cross-Section, you can view the cross-section properties, stress points, and c/t-parts.
Button Function
Opens the dialog box Info about Cross-section (see Figure 2.10)
Displays or hides the dimensions of the cross-section
Displays or hides the principal axes of the cross-section
Displays or hides the stress points
Displays or hides the numbering of stress points or c/t-parts
Resets the full view of the cross-section graphic

2 Input Data
18 Program STEEL © 2013 Dlubal Engineering Software
Figure 2.10: Dialog box Info About Cross-section
Click the button [Details] to receive detailed information on stress points (distance to center of gravity, statical moments of area, normalized warping constants etc.) and c/t-parts.
Figure 2.11: Dialog box Stress Points of HE A 400

3 Calculation
19 Program STEEL © 2013 Dlubal Engineering Software
3. Calculation
3.1 Detail Settings Before you start the calculation by clicking [Calculation], it is recommended to check the design details. The corresponding dialog box can be accessed in all windows of the add-on module by clicking the [Details] button.
Figure 3.1: Dialog Details
Display Result Tables In this dialog section, you can select the results windows including parts list that you want to be displayed. The windows are described in chapter 4 Results.
Window 2.5 Stresses by Stress Point is inactive by default because the stress graphic can also provide an evaluation of the results in the stress points. For a check of stress points listed in tables, activate the display of this window.
The values displayed in window 3.1 Governing Internal Forces are related to the maximum equivalent stress σeqv (default setting). If you want to evaluate the results specifically, you can select a different stress type in the list.
Method of Stress Calculation for Result Combinations A biaxial loading in different load cases may result in the fact that the combined member in-ternal forces do not produce the maximum stresses. This is the case, for example, when the first load case with vertical load has only My moments but no Mz moments, and the second load case with horizontal load has only Mz moments but no My moments. If you superimpose the load cases with the value "permanent" in a result combination, RSTAB will display in the table 4.1 Members - Internal Forces that the moment Mz is not classified as belonging to the maximum moment My: The horizontal load does not contribute to the increase of the moment due to vertical load. The RC design is then carried out separately for the maximum moments My and Mz so that the simultaneous effect of both moments for the combined analysis of the bending stresses is not taken into account.
3 Calculation
20 Program STEEL © 2013 Dlubal Engineering Software
Stresses from Internal Forces
This type of calculation makes direct use of the RSTAB table 4.1 Members - Internal Forces. By processing the maximum or minimum internal forces row by row, the stresses for each ex-treme value together with the corresponding internal forces are determined.
The advantage is that the values of the result combinations can be used directly. This has a positive impact on the speed of the calculation. In addition, the designed internal forces be-come transparent because in the STEEL window 3.1 Governing Internal Forces by Member the module displays the result rows from the RSTAB results table 4.1 Members - Internal Forces.
Calculate Stresses from Single Load Cases and then Combine
This type of calculation is preset to calculate the stresses of result combinations. First, the pro-gram determines the normal and shear stresses of the load cases contained in the RC. Then, these stress components are superimposed according to the conditions specified in the com-bination criterion. Thus, the program ensures that a biaxial bending stress from different load cases results in correct stresses in a biaxial load state.
The calculation is performed for each stress point. The compression, tension and shear stresses determined for each load case are summed up according to the RC superposition criterion and displayed subsequently as stresses of the result combination. The equivalent stress σeqv repre-sents an exception because it is determined by the RC components of σtotal and τtotal. A super-position of equivalent stresses from the load cases would not be correct as it would lead to too high stress ratios.
This type of calculation requires more computing time than the direct use of RC internal forces. Furthermore, the values displayed in window 3.1 Governing Internal Forces by Member for the equivalent stresses are more difficult to understand.
As pure uniaxial bending usually does not occur in complex 3D models, both calculation meth-ods should show the same ratios in the output.
Combine stresses from individual extreme values
The check box is deactivated by default so that the stresses are considered row by row (table of internal forces from RSTAB or stresses from load case internal forces).
If you select this check box, STEEL calculates the stresses not from the according internal forces or stresses but from the extreme values of the internal forces or stress components at each x-location (for example max/min values of N, My, and Mz for normal stress). These "extreme value diagonals" guarantee that the most unfavorable constellation is considered (see the text above introducing the section "Method of Stress Calculation").
Consider Plastification
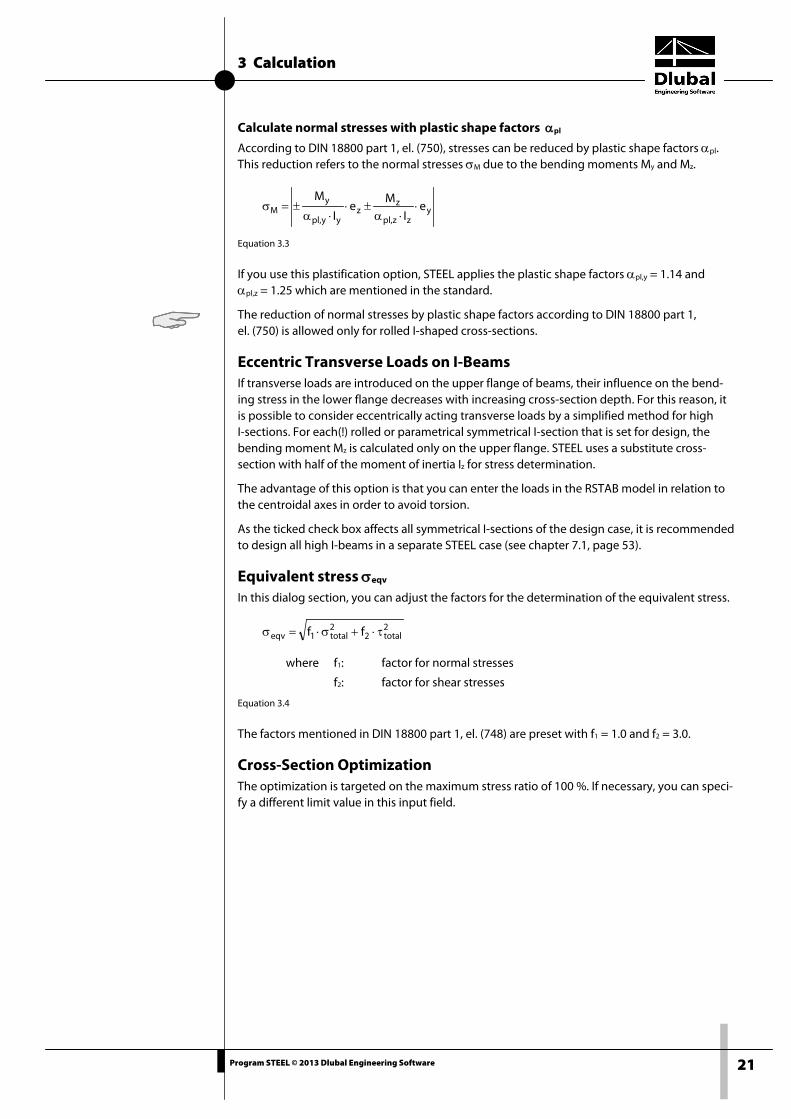
Allow Local Plastification
If a local plastification according to DIN 18800 part 1, el. (749) is allowed, the equivalent stress σeqv may exceed the allowed limit stress by 10 % in "small areas".
STEEL analyzes the conditions mentioned in el. (749) for the small areas.
d,RMN 8.0y
σ⋅≤σ+σ
Equation 3.1
d,RMN 8.0z
σ⋅≤σ+σ
Equation 3.2
If the conditions are fulfilled, the limit stress for the design of σeqv will be increased.
3 Calculation
21 Program STEEL © 2013 Dlubal Engineering Software
Calculate normal stresses with plastic shape factors αpl
According to DIN 18800 part 1, el. (750), stresses can be reduced by plastic shape factors αpl. This reduction refers to the normal stresses σM due to the bending moments My and Mz.
yzz,pl
zz
yy,pl
yM e
IM
eI
M⋅
⋅α±⋅
⋅α±=σ
Equation 3.3
If you use this plastification option, STEEL applies the plastic shape factors αpl,y = 1.14 and αpl,z = 1.25 which are mentioned in the standard.
The reduction of normal stresses by plastic shape factors according to DIN 18800 part 1, el. (750) is allowed only for rolled I-shaped cross-sections.
Eccentric Transverse Loads on I-Beams If transverse loads are introduced on the upper flange of beams, their influence on the bend-ing stress in the lower flange decreases with increasing cross-section depth. For this reason, it is possible to consider eccentrically acting transverse loads by a simplified method for high I-sections. For each(!) rolled or parametrical symmetrical I-section that is set for design, the bending moment Mz is calculated only on the upper flange. STEEL uses a substitute cross-section with half of the moment of inertia Iz for stress determination.
The advantage of this option is that you can enter the loads in the RSTAB model in relation to the centroidal axes in order to avoid torsion.
As the ticked check box affects all symmetrical I-sections of the design case, it is recommended to design all high I-beams in a separate STEEL case (see chapter 7.1, page 53).
Equivalent stress σeqv In this dialog section, you can adjust the factors for the determination of the equivalent stress.
2total2
2total1eqv ff τ⋅+σ⋅=σ
where f1: factor for normal stresses
f2: factor for shear stresses
Equation 3.4
The factors mentioned in DIN 18800 part 1, el. (748) are preset with f1 = 1.0 and f2 = 3.0.
Cross-Section Optimization The optimization is targeted on the maximum stress ratio of 100 %. If necessary, you can speci-fy a different limit value in this input field.
3 Calculation
22 Program STEEL © 2013 Dlubal Engineering Software
3.2 Stresses and Ratio The normal stresses σtotal, τtotal, and σeqv are displayed as presettings in the windows 2.1 to 2.5. To display further stress components, click [Select Stresses to Show] and [Extended Stress Diagram] (see Figure 5.1, page 39).
Normal stresses For signs, the following rule applies in STEEL: Tensile stresses are indicated by positive signs and compressive stresses by negative signs (see Figure 3.2).
The analysis is carried out for each single stress point. Therefore, the components of the maxi-mum stresses for a combined calculation (for example σtotal) must not be summed up: Often, the maximum stresses occur at different stress points. You have to superimpose the stress components that are available in the same stress point.
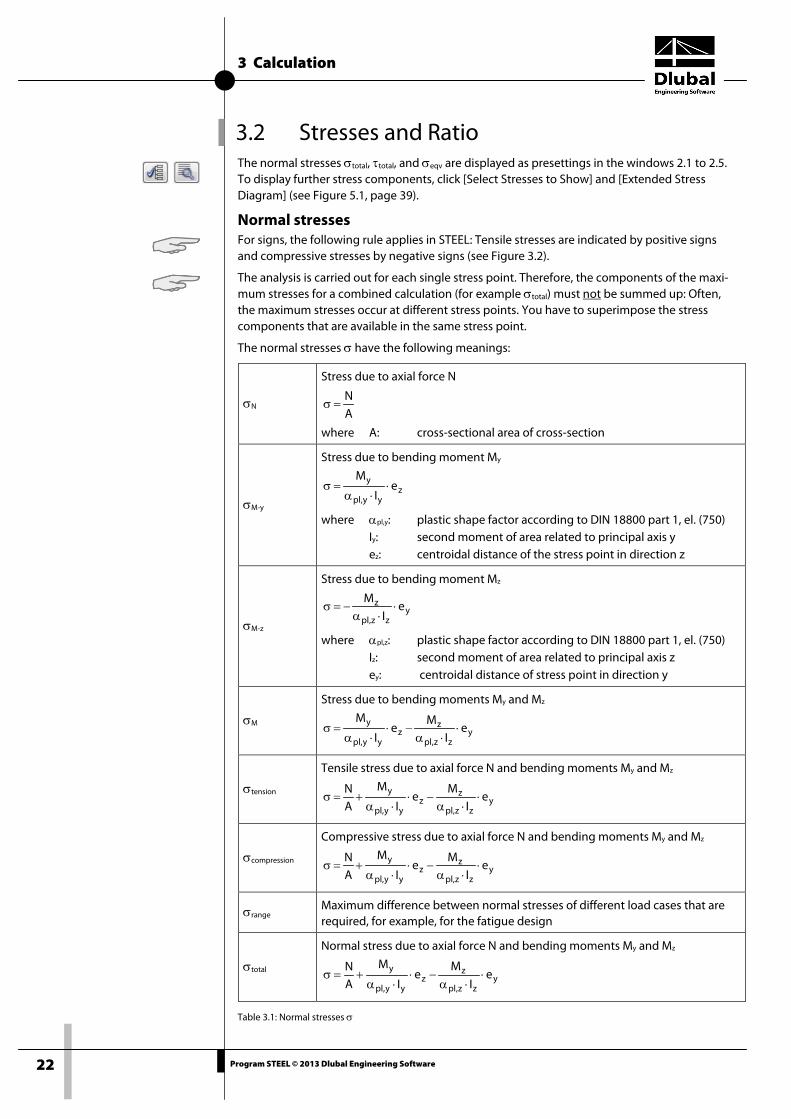
The normal stresses σ have the following meanings:
σN
Stress due to axial force N
AN
=σ
where A: cross-sectional area of cross-section
σM-y
Stress due to bending moment My
zyy,pl
y eI
M⋅
⋅α=σ
where αpl,y: plastic shape factor according to DIN 18800 part 1, el. (750) Iy: second moment of area related to principal axis y ez: centroidal distance of the stress point in direction z
σM-z
Stress due to bending moment Mz
yzz,pl
z eI
M⋅
⋅α−=σ
where αpl,z: plastic shape factor according to DIN 18800 part 1, el. (750) Iz: second moment of area related to principal axis z ey: centroidal distance of stress point in direction y
σM
Stress due to bending moments My and Mz
yzz,pl
zz
yy,pl
y eI
Me
I
M⋅
⋅α−⋅
⋅α=σ
σtension
Tensile stress due to axial force N and bending moments My and Mz
yzz,pl
zz
yy,pl
y eI
Me
I
M
AN
⋅⋅α
−⋅⋅α
+=σ
σcompression
Compressive stress due to axial force N and bending moments My and Mz
yzz,pl
zz
yy,pl
y eI
Me
I
M
AN
⋅⋅α
−⋅⋅α
+=σ
σrange Maximum difference between normal stresses of different load cases that are required, for example, for the fatigue design
σtotal
Normal stress due to axial force N and bending moments My and Mz
yzz,pl
zz
yy,pl
y eI
Me
I
M
AN
⋅⋅α
−⋅⋅α
+=σ
Table 3.1: Normal stresses σ

3 Calculation
23 Program STEEL © 2013 Dlubal Engineering Software
The local member axis system has a certain impact on the signs of the internal forces and stresses.
Figure 3.2: Positive definition of internal forces
The bending moment My is positive if tensile stresses are generated on the positive member side (in direction of the z-axis). Mz is positive if compressive stresses occur on the positive member side (in direction of the y-axis). The sign definition for torsional moments, axial forces, and shear forces conforms to the following convention. These internal forces are positive if they act in a positive direction.
If the Type of Model was defined as 2D in the General Data of RSTAB, the design of unsymmet-rical cross-sections like angles or C-sections needs to be handled with care. In a plane model, only moments about the member axis y are possible so that RSTAB performs a division of the moment in the direction of the principal axes u and v. STEEL designs only the part of the moment about the y-axis. Therefore, systems with unsymmetrical cross-sections should be checked by means of a spatial model (model type 3D).
3 Calculation
24 Program STEEL © 2013 Dlubal Engineering Software
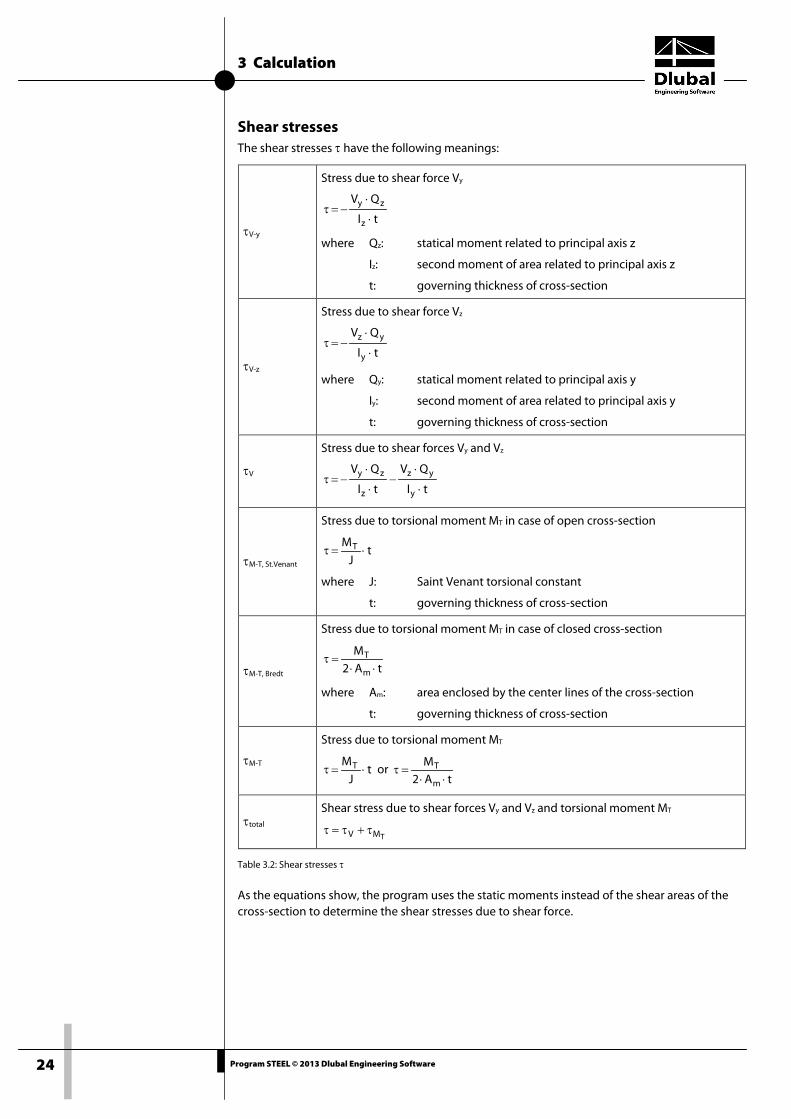
Shear stresses The shear stresses τ have the following meanings:
τV-y
Stress due to shear force Vy
tI
QV
z
zy
⋅
⋅−=τ
where Qz: statical moment related to principal axis z
Iz: second moment of area related to principal axis z
t: governing thickness of cross-section
τV-z
Stress due to shear force Vz
tI
QV
y
yz
⋅
⋅−=τ
where Qy: statical moment related to principal axis y
Iy: second moment of area related to principal axis y
t: governing thickness of cross-section
τV
Stress due to shear forces Vy and Vz
tI
QV
tI
QV
y
yz
z
zy
⋅
⋅−
⋅
⋅−=τ
τM-T, St.Venant
Stress due to torsional moment MT in case of open cross-section
tJ
MT ⋅=τ
where J: Saint Venant torsional constant
t: governing thickness of cross-section
τM-T, Bredt
Stress due to torsional moment MT in case of closed cross-section
tA2M
m
T
⋅⋅=τ
where Am: area enclosed by the center lines of the cross-section
t: governing thickness of cross-section
τM-T
Stress due to torsional moment MT
tJ
MT ⋅=τ or tA2
M
m
T
⋅⋅=τ
τtotal Shear stress due to shear forces Vy and Vz and torsional moment MT
TMV τ+τ=τ
Table 3.2: Shear stresses τ
As the equations show, the program uses the static moments instead of the shear areas of the cross-section to determine the shear stresses due to shear force.

3 Calculation
25 Program STEEL © 2013 Dlubal Engineering Software
Twin stress points
For shear stresses due to torsion, please note:
• If you have a cross-section that is partially open but has one closed cell, the program will classify the entire cross-section as closed. The shear stress will be determined exclusively according to the Bredt formula. Thus, STEEL won't perform any pro-rata analysis for MT,St.Venant and MT,Bredt like it is done in the cross-section module SHAPE-THIN.
• The influence of the warping torsion is not considered in STEEL. The design, like the de-termination of internal forces in RSTAB, is limited to the primary torsional moment. How-ever, if you have to consider warping stresses due to the secondary torsional moment or the warping bimoment, it is recommended to use the add-on module FE-LTB for the analysis.
For thin-walled cross-sections, we can assume as a simplification that the shear stress runs par-allel to the wall of the cross-section. Therefore, the parts of the shear stresses resulting from both the components of the shear forces are added. The sign of the statical moments defines here which parts are applied positively and which negatively.
The shear stress due to the torsional moment is to be considered differently for the total shear stress, depending on whether it is an open or a closed cross-section. For an open cross-section, the torsion shear stress is added with the sign to that sum from the individual shear stresses that results in the greatest absolute value of the sum.
For a closed cross-section, on the other hand, the torsional shear stress is simply added to the sum from the individual shear stresses. Here, the signs for core area and statical moments are set in such a way that they correspond to the program-specific sign conventions of the shear stress that is dependent on the loading.
Shear stresses within the cross-section
Stress points lying within the cross-section do not permit the assumption mentioned above that the shear stress runs parallel to the wall of the cross-section. Here, a special method with twin stress points is used that creates two stress points with identical coordinates in the cross-section.
The one stress point considers the statical moment about the y-axis (parameter for the shear stress due to vertical shear force), the other considers the statical moment about the z-axis (parameter for shear stress due to horizontal shear force). For these stress points, the comple-mentary statical moment is zero, respectively. It is possible to assign different thicknesses to the twin stress points that have an influence on the calculation of the shear stress. The shear stresses are considered as interdependent components acting perpendicularly to each other: they are components of one stress state. For the determination of the total shear stress, both parts are quadratically added. The shear stress due to the torsional moment is not considered in these points.
The shear stresses of result combinations in the twin stress points may not be combined linear-ly. Therefore, the extreme values of both components are evaluated with the corresponding complementary shear stresses in order to determine the greatest total shear stress.

3 Calculation
26 Program STEEL © 2013 Dlubal Engineering Software
Equivalent stress The equivalent stress σeqv, for example according to DIN 18800 part 1, el. (748), is determined as follows:
σeqv
Equivalent stress from normal stresses σ and shear stresses τ
2total2
2total1eqv ff τ⋅+σ⋅=σ
where f1: factor for normal stresses
f2: factor for shear stresses
Table 3.3: Equivalent stress σeqv
Factors f1 and f2 can be defined in the dialog box Details (see Figure 3.1, page 19). The factors f1 = 1.0 and f2 = 3.0 are preset according to DIN 18800 part 1, el. (748).
Stress ratio For stress designs, as described for example in DIN 18800 part 1, el. (747), STEEL determines the quotient from the existing and the limit stress.
1d,R≤
σσ
Equation 3.5: Design condition for normal stresses
1d,R≤
ττ
Equation 3.6: Design condition for shear stresses
1d,R
eqv ≤σ
σ
Equation 3.7: Design condition for equivalent stresses
For each internal force component, you can display the cross-section's stress ratio on the re-spective stress point (see chapter 5.1, page 40). The ratios due to normal, shear, and equivalent stress are displayed in the table output by default.
If the limit stress is not exceeded, the ratio is less than or equal to 1 and the stress design was carried out successfully.

3 Calculation
27 Program STEEL © 2013 Dlubal Engineering Software
3.3 Start Calculation To start the calculation, click the [Calculation] button that is available in all input windows of the STEEL add-on module.
STEEL searches for the results of the load cases, load combinations, and result combinations you want to design. If they cannot be found, the program starts the RSTAB calculation to de-termine the design relevant internal forces.
You can also start the calculation in the RSTAB user interface: In the dialog box To Calculate (menu Calculate → To Calculate) design cases of the add-on modules like load cases and load combinations are listed.
Figure 3.3: Dialog box To Calculate
If the STEEL design cases are missing in the Not Calculated list, select All or Add-on Modules in the drop-down list below the list.
To transfer the selected STEEL cases to the list on the right, click []. Click [OK] to start the cal-culation.
To calculate a design case directly, use the list in the toolbar. Select the STEEL design case in the toolbar list and click [Show Results].
Figure 3.4: Direct calculation of a STEEL design case in RSTAB
Subsequently, you can observe the design process in a separate dialog box.

4 Results
28 Program STEEL © 2013 Dlubal Engineering Software
4. Results The window 2.1 Stresses by Cross-Section is displayed immediately after the calculation.
Figure 4.1: Results window with stresses and stress ratios
The designs are shown in the results windows 2.1 to 2.5, sorted by different criteria.
The windows 3.1 and 3.2 list the governing internal forces. In the last two results windows 4.1 and 4.2, parts lists are displayed by members and set of members.
Every window can be selected by clicking the corresponding entry in the navigator. To set the previous or next input window, use the buttons shown on the left. You can also use the func-tion keys to select the previous [F3] or next [F2] window.
Click [OK] to save the results. You exit STEEL and return to the main program.
Chapter 4 Results describes the different results windows one after the other. Evaluating and checking results is described in chapter 5 Results Evaluation, page 39 ff.

4 Results
29 Program STEEL © 2013 Dlubal Engineering Software
4.1 Stresses by Cross-Section In this results window, the maximum stress ratios of all designed members and actions are listed by cross-sections. The ratios for the internal forces of the governing load cases and com-binations are sorted by stress types.
Figure 4.2: Window 2.1 Stresses by Cross-Section
Section No. The results are listed by cross-section numbers. The description of the cross-section is displayed to the right of the cross-section number.
Member No. It shows the number of the member that bears the maximum stress ratio within the set of members indicated in column E.
Location x This column shows the respective x-location where the member's maximum stress ratio occurs. For the table output, the program uses the following member locations x:
• Start and end node
• Dividing points according to possibly defined member division (see RSTAB table 1.6)
• Member division according to specification for member results (RSTAB dialog box Calculation Parameters, tab Global Register Parameters)
• Extreme values of internal forces
S-Point No. The design is carried out on certain stress points of the cross-section. These points are defined by centroidal distances, statical moments, and cross-section thicknesses, which allow for a de-sign according to Table 3.1 and Table 3.2 (see page 22).
4 Results
30 Program STEEL © 2013 Dlubal Engineering Software
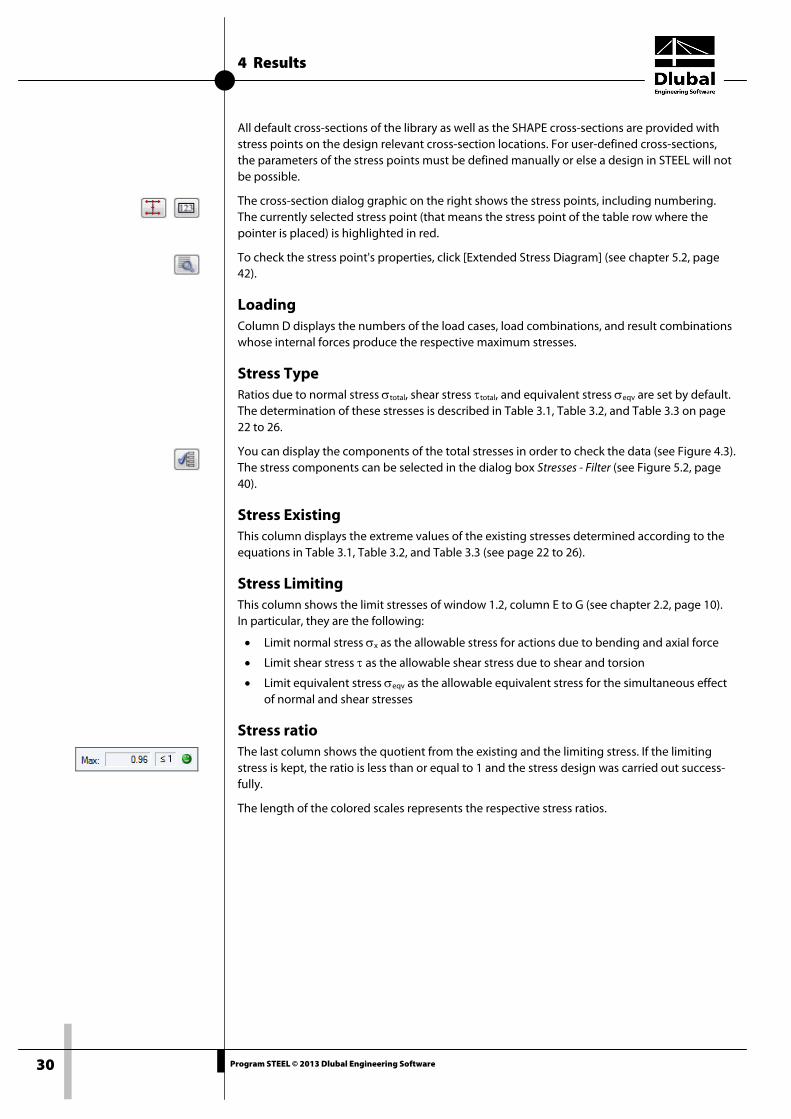
All default cross-sections of the library as well as the SHAPE cross-sections are provided with stress points on the design relevant cross-section locations. For user-defined cross-sections, the parameters of the stress points must be defined manually or else a design in STEEL will not be possible.
The cross-section dialog graphic on the right shows the stress points, including numbering. The currently selected stress point (that means the stress point of the table row where the pointer is placed) is highlighted in red.
To check the stress point's properties, click [Extended Stress Diagram] (see chapter 5.2, page 42).
Loading Column D displays the numbers of the load cases, load combinations, and result combinations whose internal forces produce the respective maximum stresses.
Stress Type Ratios due to normal stress σtotal, shear stress τtotal, and equivalent stress σeqv are set by default. The determination of these stresses is described in Table 3.1, Table 3.2, and Table 3.3 on page 22 to 26.
You can display the components of the total stresses in order to check the data (see Figure 4.3). The stress components can be selected in the dialog box Stresses - Filter (see Figure 5.2, page 40).
Stress Existing This column displays the extreme values of the existing stresses determined according to the equations in Table 3.1, Table 3.2, and Table 3.3 (see page 22 to 26).
Stress Limiting This column shows the limit stresses of window 1.2, column E to G (see chapter 2.2, page 10). In particular, they are the following:
• Limit normal stress σx as the allowable stress for actions due to bending and axial force
• Limit shear stress τ as the allowable shear stress due to shear and torsion
• Limit equivalent stress σeqv as the allowable equivalent stress for the simultaneous effect of normal and shear stresses
Stress ratio The last column shows the quotient from the existing and the limiting stress. If the limiting stress is kept, the ratio is less than or equal to 1 and the stress design was carried out success-fully.
The length of the colored scales represents the respective stress ratios.

4 Results
31 Program STEEL © 2013 Dlubal Engineering Software
4.2 Stresses by Set of Members
Figure 4.3: Window 2.2 Stresses by Set of Members
This results window is displayed when you have selected at least one set of members for the design. The table lists the maximum ratios sorted by sets of members.
Column Member No. shows the number of the one member within the set of members that bears the maximum stress ratio for the respective stress type.
The output by sets of members clearly presents the design for an entire structural group (for example a frame).

4 Results
32 Program STEEL © 2013 Dlubal Engineering Software
4.3 Stresses by Member
Figure 4.4: Window 2.3 Stresses by Member
This results window presents the maximum ratios for different stress types sorted by member numbers. The columns are described in detail in chapter 4.1 on page 29.
If you have a tapered member, both cross-section descriptions are displayed in the table row next to the section number.

4 Results
33 Program STEEL © 2013 Dlubal Engineering Software
4.4 Stresses by x-Location
Figure 4.5: Window 2.4 Stresses by x-Location
This results window lists the maximum stresses for each member at all locations x resulting from the division points defined in RSTAB:
• Start and end node
• Dividing points according to possibly defined member division (see RSTAB table 1.6)
• Member division according to specification for member results (RSTAB dialog box Calculation Parameters, tab Global Register Parameters)
• Extreme values of internal forces

4 Results
34 Program STEEL © 2013 Dlubal Engineering Software
4.5 Stresses at Every Stress Point
Figure 4.6: Window 2.5 Stresses at Every Stress Point
This results window is inactive by default because STEEL determines the maximum stresses, and thus the governing stress points, automatically. In addition, the windows 2.1 to 2.4 allow you to check the results of each stress point graphically and numerically by clicking the button [Extended Stress Diagram] (see chapter 5.2, page 42).
If a results evaluation by stress points is required, you can display the window by opening the dialog box Details (see Figure 3.1, page 19). The dialog box can be opened in every window by clicking [Details].
The stresses in window 2.5 are listed for each member according to Location x and S-Point No. The different columns of this window are described in detail in chapter 4.1 on page 29.

4 Results
35 Program STEEL © 2013 Dlubal Engineering Software
4.6 Governing Internal Forces by Member
Figure 4.7: Window 3.1 Governing Internal Forces by Member
This window displays for each member the governing internal forces, whose stresses result in maximum stress ratios. They refer to the maximum equivalent stress σeqv by default. In the dia-log box Details (see Figure 3.1, page 19), which can be accessed by using the [Details] button, you can set another stress type.
If you Calculate stresses from single load cases in RC and then combine stresses according to RC cri-teria (see Figure 3.1, page 19), you disable the direct evaluation of the RC result rows of RSTAB table 4.1 Members - Internal Forces. Instead, compression, tension, and shear stresses deter-mined for each load case are summed up according to the RC superposition criterion. The equivalent stress σeqv represents an exception because it is determined by the RC components of σtotal and τtotal. Therefore, the governing internal forces for result combinations are not im-mediately transparent.
Location x This column shows the respective x-location where the member's maximum stress ratio occurs.
Loading Column B displays the numbers of the load case or the load and result combinations whose in-ternal forces produce maximum stresses.
Forces / Moments For each member, the normal and shear forces as well as the torsional and bending moments producing maximum stresses are displayed.

4 Results
36 Program STEEL © 2013 Dlubal Engineering Software
4.7 Governing Internal Forces by Set of Members
Figure 4.8: Window 3.2 Governing Internal Forces by Set of Members
This window shows the internal forces that result in the maximum stress ratios for each set of members.

4 Results
37 Program STEEL © 2013 Dlubal Engineering Software
4.8 Parts List by Member Finally, STEEL provides a summary of all cross-sections that are included in the design case.
Figure 4.9: Window 4.1 Parts List by Member
By default, this list contains only the designed members. If you need a parts list with all mem-bers of the model, select the corresponding option in the Details dialog box (see Figure 3.1, page 19).
Part No. The program assigns automatically item numbers for similar members.
Cross-Section Description This column lists the cross-section numbers and descriptions.
Number Members This column shows for each part how many similar members are used.
Length This column displays the respective length of an individual member.
Total Length This column shows the product that is determined from the two previous columns.
Surface Area For each part, the program indicates the surface area related to the total length. The surface area is determined from the Surface of the cross-sections that can be seen in windows 1.3 and 2.1 to 2.5 in the cross-section information (see Figure 2.10, page 18).

4 Results
38 Program STEEL © 2013 Dlubal Engineering Software
Volume The volume of a part is determined from the cross-sectional area and the total length.
Cross-Section Mass The cross-section mass represents the unit mass of the cross-section in relation to the length of one meter. For tapered cross-sections, the program averages both cross-section properties.
Mass The values of this column are determined from the respective product of the entries in columns C and G.
Total Mass The final column indicates the total mass of each part.
Sum At the bottom of the list, you find a summary of the summed up values of columns B, D, E, F, and I. The last data field of the column Total Mass shows the total amount of steel required.
4.9 Parts List by Set of Members
Figure 4.10: Window 4.2 Parts List by Set of Members
The last results window is displayed when you have selected at least one set of members for the design. The window summarizes an entire structural group (for example a horizontal beam) in a parts list.
Details on the various columns can be found in the previous chapter. When different cross-sections are used in the set of members, the program averages the surface area, the volume, and the cross-section mass.

5 Results Evaluation
39 Program STEEL © 2013 Dlubal Engineering Software
5. Results Evaluation To evaluate the results, use the buttons at the end of the table.
Figure 5.1: Buttons for results evaluation in the windows
The buttons are reserved for the following functions:
Button Description Function
Cross-section info Opens the dialog box Info about Cross-section Figure 2.10, page 18
Stress selection Opens the dialog box Stresses - Filter Chapter 5.1, page 40
Extended stress diagram Opens the dialog box Cross-Section Values and Stress Diagram Chapter 5.2, page 42
Show color bars Turns on and off the colored relation scales in the results tables
Exceeding Displays only the rows where the ratio is more than 1, and thus the design is failed
Result diagrams Opens the window Result Diagram on Member Chapter 5.4, page 46
Excel export Opens the dialog box Export - MS Excel Chapter 7.4.2, page 59
Member selection Enables the graphical selection of a member to display its results in the module window
View mode Jumps to the RSTAB work window to change the view
Table 5.1: Buttons of results windows 2.1 to 2.5

5 Results Evaluation
40 Program STEEL © 2013 Dlubal Engineering Software
5.1 Selection of Stresses The following stress types are displayed by default in the results windows:
• Normal stress σtotal
• Shear stress τtotal
• Equivalent stress σeqv
Click [Select Stresses to Show] to activate further stress components. In this way, you can check the components affecting the total stress. The button is at the bottom of the table (see Figure 5.1).
The dialog box Stresses - Filter appears where you can select the stress types.
Figure 5.2: Dialog box Stresses - Filter
The stress types are described in Table 3.1 and Table 3.2 on page 22 to 24.
The buttons in the dialog section To Show facilitate the selection of the stress types.
Button Description Function
Select All Ticks all stress type check boxes
Deselect All Deactivates all check boxes
Table 5.2: Buttons in the dialog box Stresses - Filter
The analysis is carried out for each single stress point. Therefore, the components of the maxi-mum stresses for a combined calculation (for example σtotal) must not be summed up: Often, the maximum stresses occur at different stress points. You have to superimpose the stress components that are available in the same stress point.
The specifications in the dialog box Stresses - Filter affect also the printout report: The report displays only stress types shown in the results windows.

5 Results Evaluation
41 Program STEEL © 2013 Dlubal Engineering Software
5.2 Results on Cross-section The results from the table are visualized by a dynamic stress graphic. This graphic shows the stress distribution on the cross-section for the current x-location of the selected stress type. If a different x-location or stress type is selected by mouse-click, this is shown in the graphic. The governing stress point is highlighted in red.
The graphic can display stresses as well as stress ratios.
Figure 5.3: Diagram of normal stresses on cross-section
The buttons below the graphic are reserved for the following functions:
Button Description Function
Stress diagram Displays or hides the stress points
Stress ratio Displays or hides the ratios
Values Switches on and off the result values
Cross-section outlines Displays or hides the cross-section outlines
Stress points Displays or hides the stress points
Numbering Switches on and off the numbering of stress points
Show all graphic Resets the full view of the results graphic
Table 5.3: Buttons of graphic in results windows 2.1 to 2.5

5 Results Evaluation
42 Program STEEL © 2013 Dlubal Engineering Software
Use the wheel button to maximize or minimize the display. Use the drag-and-drop function to move the stress graphic. The button [Show All Graphic] resets the graphic's full view.
Extended Diagram of stresses and ratios To evaluate every stress point specifically, click [Extended Stress Diagram]. The dialog box Cross-Section Values and Stress Diagram opens.
Figure 5.4: Dialog box Cross-Section Values and Stress Diagram
The current Member No. and the x-location on the member are already preset in the dialog sec-tion Position. To select another member or x-location, use the list.
The dialog section Stress Points lists all stress points of the cross-section. The two Coordinates columns show the respective centroidal distances ey and ez. The Static Moments columns dis-play the corresponding first moments of area Qy and Qz. The final column indicates the Thick-ness t of the cross-section part which is required to determine the shear stresses.
In the Stresses dialog section, all stresses are displayed for the stress point that is currently se-lected in the dialog section above. In this dialog, you can also select a stress type by mouse-click to display its diagrams in the graphic.
Most of the buttons below the graphic are identical with the buttons in the results windows (see Table 5.3, page 41). As usual, they are described by ScreenTips. To print the current stress graphic, click [Print] (see chapter 6.2.1, page 49).

5 Results Evaluation
43 Program STEEL © 2013 Dlubal Engineering Software
5.3 Results in RSTAB Model To evaluate the design results, you can also use the RSTAB work window.
RSTAB background graphic and view mode The RSTAB work window in the background is useful when you want to find the position of a particular member in the model: The member selected in the STEEL results window is high-lighted in the selection color in the background graphic. Furthermore, an arrow indicates the member's x-location that is displayed in the active table row.
Figure 5.5: Indication of member and current Location x in RSTAB model
In case you cannot improve the display by moving the STEEL module window, click [Jump to Graphic] to activate the view mode: The program hides the STEEL window so that you can modify the display in the RSTAB user interface. The view mode provides the functions of the View menu, for example zooming, moving, or rotating the display. The pointer remains visible.
Click [Back] to return to the add-on module STEEL.

5 Results Evaluation
44 Program STEEL © 2013 Dlubal Engineering Software
RSTAB work window The stresses and stress ratios can also be checked graphically in the RSTAB model. Click [Graphics] to exit the design module. Now, the design results are displayed in the RSTAB work window like the internal forces of a load case.
The Results navigator is aligned with the results from the add-on module STEEL. You can choose various stress types as well as the stress ratios in relation to the individual stress components.
Figure 5.6: Results Navigator for STEEL
To turn the display of design results on or off, use the button [Show Results], as you know it from the display of internal forces in RSTAB. To display the result values, use the toolbar button [Show Result Values] to the right.
As the RSTAB tables are of no relevance for the evaluation of design results, you can hide them.
The design cases can be set by means of the list in the RSTAB menu bar.

5 Results Evaluation
45 Program STEEL © 2013 Dlubal Engineering Software
The graphical representation of the results can be set in the Display navigator by clicking Results → Members. Stresses and stress ratios are displayed Two-Colored by default.
Figure 5.7: Display navigator: Results → Members
In case of a multicolor representation (options With/Without Diagram or Cross-Sections), the color panel is available, providing common control functions. The functions are described in detail in the RSTAB manual, chapter 3.4.6.
Figure 5.8: Stress ratios with display type Without Diagram
The graphics of stresses and stress ratios can be transferred to the printout report (see chapter 6.2, page 49).
You can return to the add-on module by using the panel button [STEEL].

5 Results Evaluation
46 Program STEEL © 2013 Dlubal Engineering Software
5.4 Result Diagrams You can also evaluate a member's result distributions in the result diagram graphically.
To do this, select the member (or set of members) in the STEEL results window by clicking in the table row of the member. Then open the dialog box Result Diagram on Member by clicking on the button shown on the left. You find the button below the table (see Figure 5.1, page 39).
The result diagrams are available in the RSTAB graphic. To display the diagrams, click
Results → Result Diagrams for Selected Members
or use the button in the RSTAB toolbar shown on the left.
A window opens, graphically showing the distribution of the results on the member or set of members.
Figure 5.9: Dialog box Result Diagram on Member
Use the list in the toolbar above to choose the relevant STEEL design case.
The dialog box Result Diagram on Member is described in detail in the RSTAB manual, chapter 9.5.

5 Results Evaluation
47 Program STEEL © 2013 Dlubal Engineering Software
5.5 Filter for Results The STEEL results windows allow you to sort the results by various criteria. In addition, you can use the filter options described in chapter 9.7 of the RSTAB manual to evaluate the design results graphically.
You can use the option Visibility also for STEEL (see RSTAB manual, chapter 9.7.1), to filter the members for evaluation.
Filtering designs The stresses and stress ratios can be used easily as filter criteria in the RSTAB work window, which can be accessed by clicking [Graphics]. To apply this filter function, the panel must be displayed. If the panel is not active, you can activate it in the RSTAB menu by clicking
View → Control Panel (Color Scale, Factors, Filter)
or use the toolbar button shown on the left.
The panel is described in the RSTAB manual, chapter 3.4.6. The filter settings for the results must be defined in the first panel tab (Color spectrum). As this register is not available for the two-colored results display, you have to set the display option Colored or Cross-Sections in the Display navigator first.
Figure 5.10: Filtering equivalent stresses with adjusted color spectrum
As the figure above shows, the color spectrum can be set in such a way that the equivalent stresses greater than 100 N/mm2 are shown in a color range between blue and red. Further-more, the color spectrum can also be adjusted in such a way that a color range covers exactly 10 N/mm2, for example.

5 Results Evaluation
48 Program STEEL © 2013 Dlubal Engineering Software
With the option Display Hidden Result Diagram in the Display navigator (under Results → Members) you can display all stress diagrams that are not within this value spectrum. Those diagrams will be represented by dotted lines.
Filtering members In the Filter tab of the control panel, we can specify the numbers of particular members to dis-play their results exclusively, that means filtered. That function is described in detail in the RSTAB manual, chapter 9.7.3.
Figure 5.11: Member filter for normal stresses of a hall frame
In contrast to the visibility function, the model will be displayed completely in the graphic. The figure above shows the normal stresses of a hall frame. The remaining designed members are displayed in the model but are shown without stresses.
6 Printout
49 Program STEEL © 2013 Dlubal Engineering Software
6. Printout
6.1 Printout Report Similar to RSTAB, the program generates a printout report for the STEEL results to which graphics and descriptions can be added. In this printout report, you decide which data from the design module should appear in the final printout.
The printout report is described in the RSTAB manual. In particular, chapter 10.1.3.4 Selecting Data of Add-on Modules provides information concerning the selection of input and output data in add-on modules.
The printout report shows the stress types that are displayed in the STEEL results windows. Therefore, if you want to print, for example, the stresses due to axial force, activate the stresses σN for display. The selection of the stresses is described in chapter 5.1 on page 40.
For large structures with many design cases, it is recommended to split the data into several printout reports, thus allowing for a clearly-arranged printout.
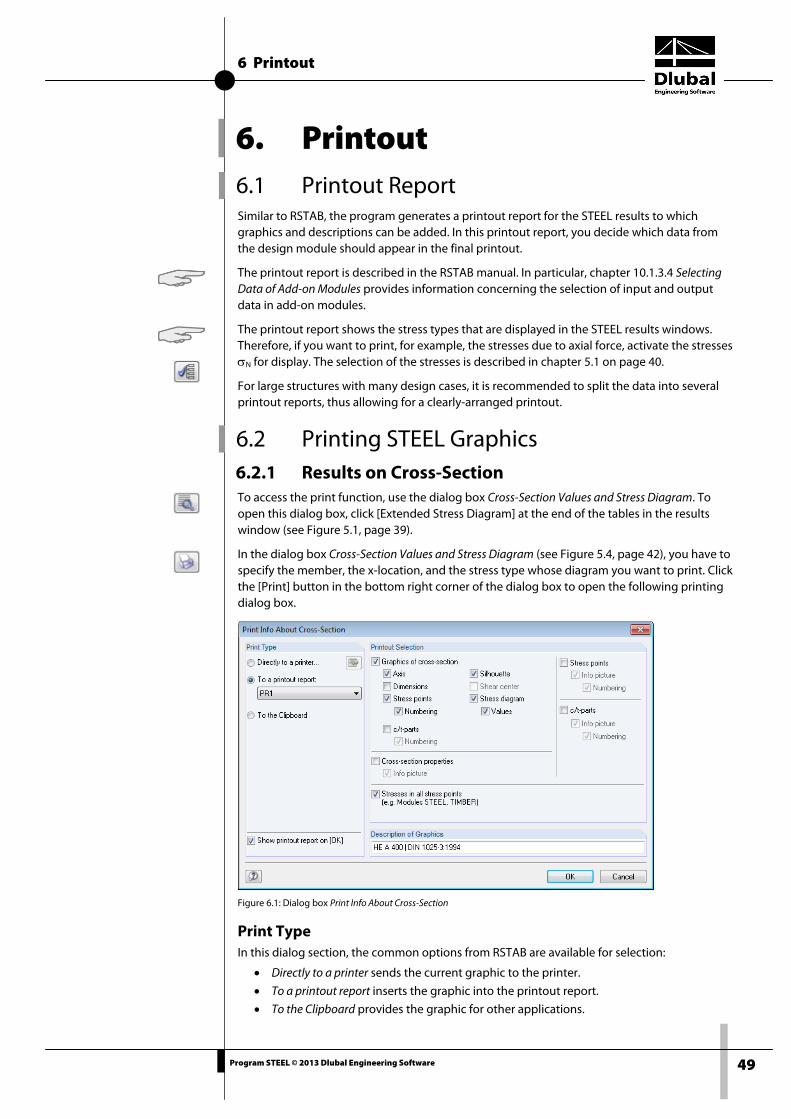
6.2 Printing STEEL Graphics 6.2.1 Results on Cross-Section To access the print function, use the dialog box Cross-Section Values and Stress Diagram. To open this dialog box, click [Extended Stress Diagram] at the end of the tables in the results window (see Figure 5.1, page 39).
In the dialog box Cross-Section Values and Stress Diagram (see Figure 5.4, page 42), you have to specify the member, the x-location, and the stress type whose diagram you want to print. Click the [Print] button in the bottom right corner of the dialog box to open the following printing dialog box.
Figure 6.1: Dialog box Print Info About Cross-Section
Print Type In this dialog section, the common options from RSTAB are available for selection:
• Directly to a printer sends the current graphic to the printer.
• To a printout report inserts the graphic into the printout report.
• To the Clipboard provides the graphic for other applications.

6 Printout
50 Program STEEL © 2013 Dlubal Engineering Software
If several printout reports are available, you can select the number of the target report in the selection field.
Printout Selection In this dialog section, you decide which details should appear in the print graphic and in the output table. The check boxes for Graphics of cross-section are self-explanatory. If you tick Cross-section properties, the properties will be printed as a table, to which you can add an Info picture in the margin. In the same way, you can integrate the properties of the Stress points and c/t-parts as well as the Stresses in all stress points in the printout.
If you want to import several graphics consecutively into the printout report, clear the check box Show printout report on [OK].
Figure 6.2: Stress graphic in printout report
6.2.2 Results in the RSTAB Model In RSTAB, every picture that is displayed in the work window can be included in the printout report or send directly to a printer. Thus, the stresses and stress ratios displayed in the RSTAB model can be prepared for the printout, too.
The printing of graphics is described in chapter 10.2 of the RSTAB manual.
To print the currently displayed graphic of the STEEL results directly, click the menu
File → Print Graphic
or use the toolbar button shown on the left.
Figure 6.3: Button Print Graphic in RSTAB toolbar
6 Printout
51 Program STEEL © 2013 Dlubal Engineering Software
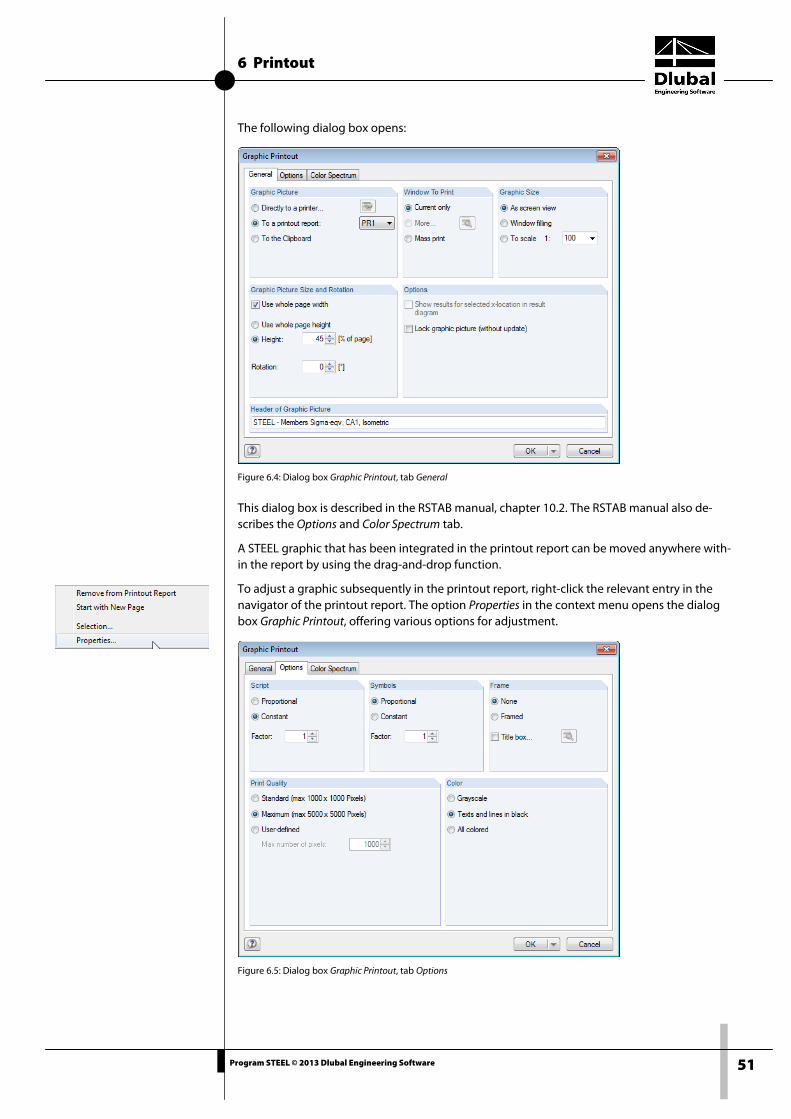
The following dialog box opens:
Figure 6.4: Dialog box Graphic Printout, tab General
This dialog box is described in the RSTAB manual, chapter 10.2. The RSTAB manual also de-scribes the Options and Color Spectrum tab.
A STEEL graphic that has been integrated in the printout report can be moved anywhere with-in the report by using the drag-and-drop function.
To adjust a graphic subsequently in the printout report, right-click the relevant entry in the navigator of the printout report. The option Properties in the context menu opens the dialog box Graphic Printout, offering various options for adjustment.
Figure 6.5: Dialog box Graphic Printout, tab Options
6 Printout
52 Program STEEL © 2013 Dlubal Engineering Software
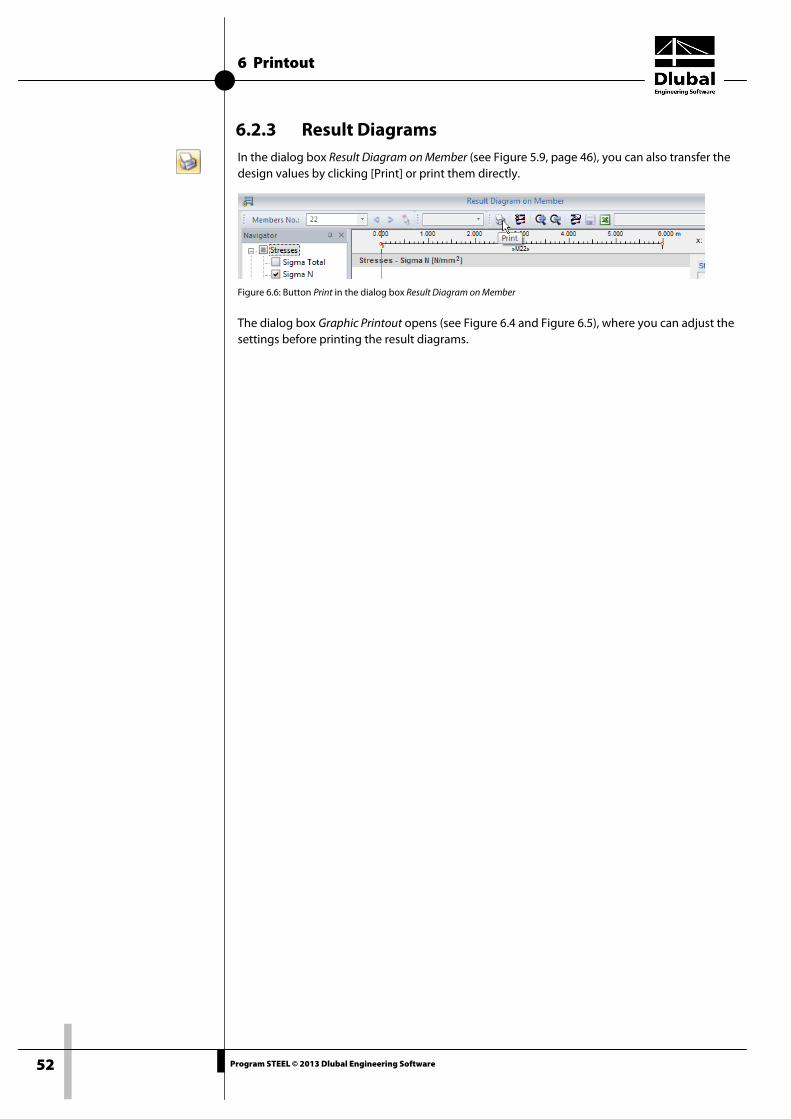
6.2.3 Result Diagrams In the dialog box Result Diagram on Member (see Figure 5.9, page 46), you can also transfer the design values by clicking [Print] or print them directly.
Figure 6.6: Button Print in the dialog box Result Diagram on Member
The dialog box Graphic Printout opens (see Figure 6.4 and Figure 6.5), where you can adjust the settings before printing the result diagrams.
7 General Functions
53 Program STEEL © 2013 Dlubal Engineering Software
7. General Functions The final chapter describes useful menu functions as well as export options for the designs.
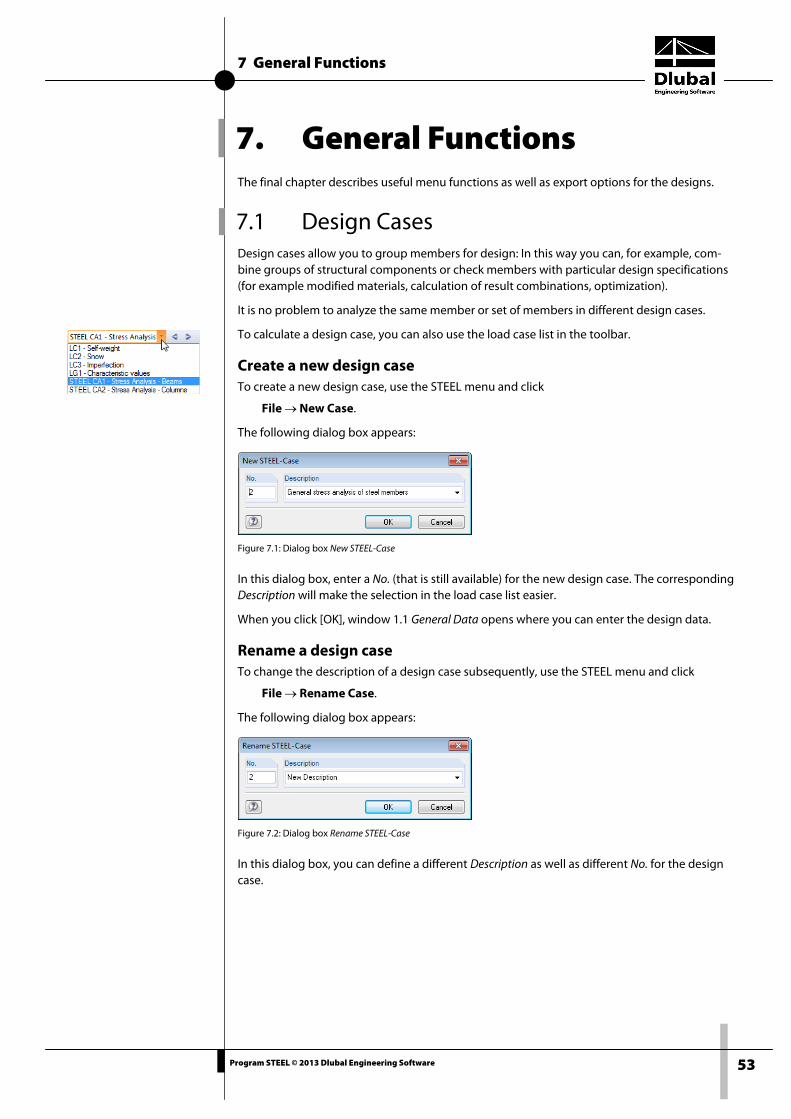
7.1 Design Cases Design cases allow you to group members for design: In this way you can, for example, com-bine groups of structural components or check members with particular design specifications (for example modified materials, calculation of result combinations, optimization).
It is no problem to analyze the same member or set of members in different design cases.
To calculate a design case, you can also use the load case list in the toolbar.
Create a new design case To create a new design case, use the STEEL menu and click
File → New Case.
The following dialog box appears:
Figure 7.1: Dialog box New STEEL-Case
In this dialog box, enter a No. (that is still available) for the new design case. The corresponding Description will make the selection in the load case list easier.
When you click [OK], window 1.1 General Data opens where you can enter the design data.
Rename a design case To change the description of a design case subsequently, use the STEEL menu and click
File → Rename Case.
The following dialog box appears:
Figure 7.2: Dialog box Rename STEEL-Case
In this dialog box, you can define a different Description as well as different No. for the design case.

7 General Functions
54 Program STEEL © 2013 Dlubal Engineering Software
Copy a design case To copy the input data of the current design case, use the STEEL menu and click
File → Copy Case.
The following dialog box appears:
Figure 7.3: Dialog box Copy STEEL-Case
Define the No. and, if necessary, a Description for the new case.
Delete a design case To delete design cases, use the STEEL menu and click
File → Delete Case.
The following dialog box appears:
Figure 7.4: Dialog box Delete Case
The design case can be selected in the list Available Cases. To delete the selected case, click [OK].

7 General Functions
55 Program STEEL © 2013 Dlubal Engineering Software
7.2 Cross-Section Optimization The design module offers you the possibility to optimize overloaded or little utilized cross-sections. To do this, open the drop-down lists in columns D or E of the corresponding cross-sections in the window 1.3 Cross-Sections and select whether the cross-sections should be de-termined From the current row or from user-defined Favorites (see Figure 2.8, page 15). You can also start the cross-section optimization out of the results windows by using the context menu.
Figure 7.5: Context menu for cross-section optimization
During the optimization process, STEEL determines the cross-section that fulfills the analysis requirements in the most optimal way, that is, comes as close as possible to the maximum al-lowable ratio specified in the Details dialog box (see Figure 3.1, page 19). The required cross-section properties will be determined with the internal forces from RSTAB. If another cross-section proves to be more favorable, this cross-section will be used for the design. Then the graphic in window 1.3 will show two cross-sections: the original cross-section from RSTAB and the optimized one (see Figure 7.7).
When optimizing a parameterized cross-section, the dialog box Optimization appears.
Figure 7.6: Dialog box Welded Cross-Sections - I symmetric: Optimize
By ticking the check boxes in the Optimize column, you decide which parameter(s) you want to modify. The ticked check box activates the Minimum and Maximum columns where you can specify the upper and lower limits of the parameter. The Increment column determines the in-terval in which the size of the parameter varies during the optimization process.
If you want to Keep current side proportions, tick the corresponding check box. In addition, you have to select at least two parameters for optimization.

7 General Functions
56 Program STEEL © 2013 Dlubal Engineering Software
Cross-sections based on combined rolled cross-sections cannot be optimized.
Please note that the internal forces won't be recalculated automatically with the modified cross-sections: It is up to you to decide which cross-sections should be transferred to RSTAB for a new calculation. As a result of optimized cross-sections, the internal forces may differ signifi-cantly because of the changed stiffnesses in the structural system. Therefore, it is recommend-ed to recalculate the internal forces of the modified cross-sections after the first optimization and then to optimize the cross-sections once again.
The modified cross-sections can be exported to RSTAB: Set window 1.3 Cross-Sections and use the menu
Edit → Export All Cross-Sections to RSTAB.
The context menu in window 1.3 provides options to export optimized cross-sections to RSTAB.
Figure 7.7: Context menu in window 1.3 Cross-Sections
When data has been modified, a security query appears as to whether the results of RSTAB should be deleted.
Figure 7.8: Query before transfer of modified cross-sections to RSTAB
When you confirm the query and start the [Calculation] subsequently in the STEEL add-on module, the RSTAB internal forces as well as the design will be determined and performed in one single calculation run.

7 General Functions
57 Program STEEL © 2013 Dlubal Engineering Software
If the modified cross-sections were not exported to RSTAB yet, you can import the original cross-sections in the design module by using the options shown in Figure 7.7. Please note that this option is only available in window 1.3 Cross-Sections.
If you optimize a tapered member, the program modifies the member's start and end and inter-polates the second moments of area for the intermediate locations linearly. As these moments are considered with the fourth power, the designs may be inaccurate if the depths of the start and end cross-section differs considerably. In such a case, it is recommended to divide the taper into several members, thus modeling the taper layout manually.
7.3 Units and Decimal Places Units and decimal places for RSTAB and the add-on modules are managed in one dialog box. In the add-on module STEEL, you can use the menu to adjust the units. To open the corre-sponding dialog box, click
Settings → Units and Decimal Places.
The following dialog box appears which you already know from RSTAB. STEEL is preset in the list Program / Module.
Figure 7.9: Dialog box Units and Decimal Places
The settings can be saved as user profile to reuse them in other models. These functions are described in chapter 11.1.3 of the RSTAB manual.

7 General Functions
58 Program STEEL © 2013 Dlubal Engineering Software
7.4 Data Transfer
7.4.1 Material Export to RSTAB When you have adjusted the materials in STEEL for the design, you can export the modified materials to RSTAB, similar to the export of cross-sections: Set window 1.2 Materials and then click the menu
Edit → Export All Materials to RSTAB.
The modified materials can also be exported to RSTAB by using the context menu of window 1.2.
Figure 7.10: Context menu of window 1.2 Materials
Before the modified materials are transferred to RSTAB, a security query appears as to whether the results of RSTAB should be deleted. When you confirm the query and start the calculation subsequently in the STEEL add-on module, the RSTAB internal forces as well as the design will be determined in one single calculation run.
If the modified materials were not yet exported to RSTAB, you can transfer the original materi-als to the design module, using the options shown in Figure 7.10. Please note that this option is only available in window 1.2 Materials.
7.4.2 Export of Results The STEEL results can also be used by other programs.
Clipboard To copy cells selected in the results windows to the clipboard, use the keys [Ctrl]+[C]. To insert the cells, for example in a word processing program, press [Ctrl]+[V]. The headers of the table columns won't be transferred.
Printout report The data of the STEEL add-on module can be printed into the global printout report (see chap-ter 6.1, page 49) to export them subsequently. Then, in the printout report, click
File → Export to RTF.
The function is described in the RSTAB manual, chapter 10.1.11.
Excel / OpenOffice STEEL provides a function for the direct data export to MS Excel, OpenOffice.org Calc, or the file format CSV. To open the corresponding dialog box, click
File → Export Tables.
The following export dialog box appears.
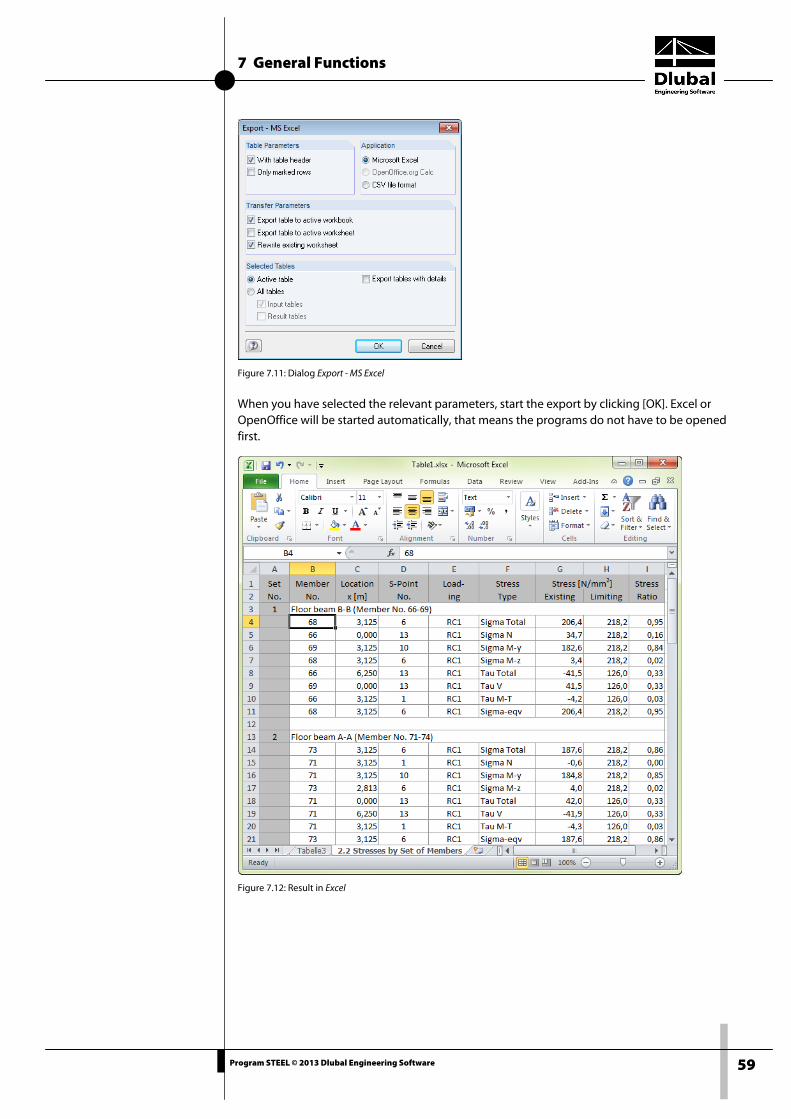
7 General Functions
59 Program STEEL © 2013 Dlubal Engineering Software
Figure 7.11: Dialog Export - MS Excel
When you have selected the relevant parameters, start the export by clicking [OK]. Excel or OpenOffice will be started automatically, that means the programs do not have to be opened first.
Figure 7.12: Result in Excel

A Literature
60 Program STEEL © 2013 Dlubal Engineering Software
A Literature
[1] DIN 18800 Teil 1: Stahlbauten, Bemessung und Konstruktion, 1990
[2] Erläuterungen zu DIN 18800 Teil 1 bis 4, Beuth-Kommentar, Beuth Verlag, 2. Auflage 1994
[3] PETERSEN, Chr.: Stahlbau, Vieweg und Sohn, Braunschweig/Wiesbaden, 3. Auflage 1993
[4] SCHNEIDER Bautabellen, Werner Verlag, 20. Auflage 2012
[5] STAHLBAU Handbuch, Band 1, Stahlbau-Verlagsgesellschaft mbH, Köln 1993
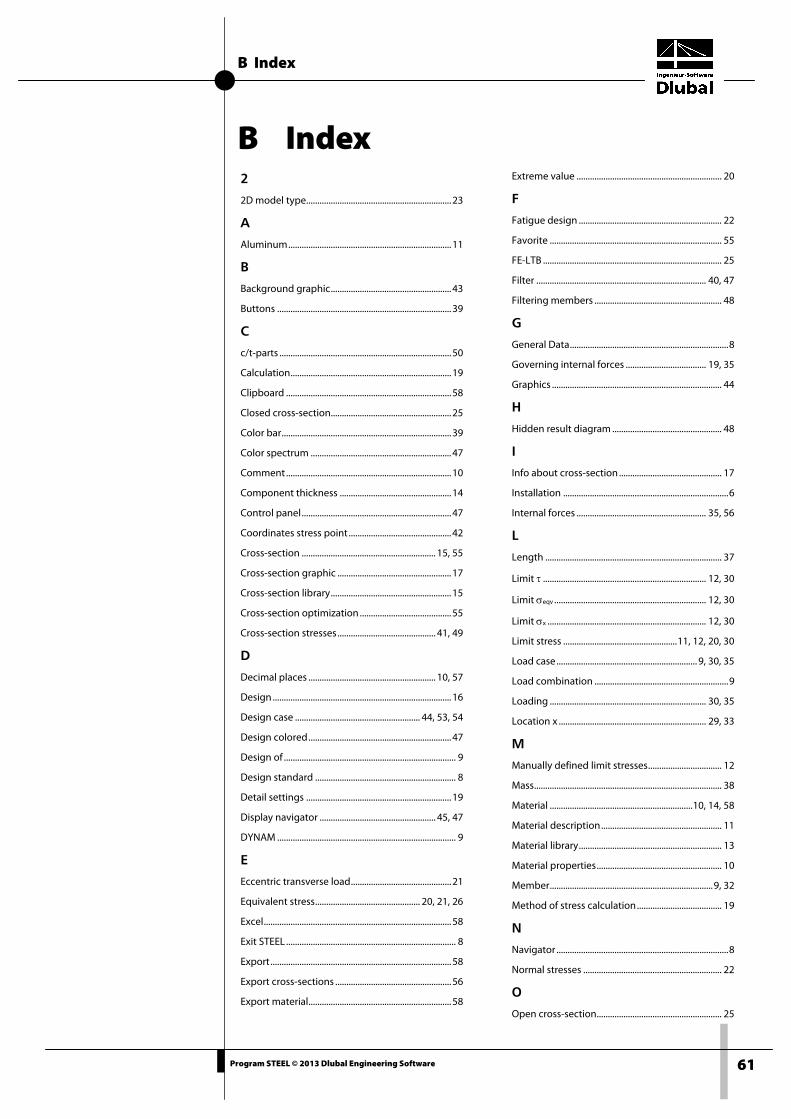
B Index
61 Program STEEL © 2013 Dlubal Engineering Software
B Index 2 2D model type ................................................................. 23
A Aluminum ......................................................................... 11
B Background graphic ...................................................... 43
Buttons .............................................................................. 39
C c/t-parts ............................................................................. 50
Calculation ........................................................................ 19
Clipboard .......................................................................... 58
Closed cross-section...................................................... 25
Color bar ............................................................................ 39
Color spectrum ............................................................... 47
Comment .......................................................................... 10
Component thickness .................................................. 14
Control panel ................................................................... 47
Coordinates stress point .............................................. 42
Cross-section ............................................................ 15, 55
Cross-section graphic ................................................... 17
Cross-section library ...................................................... 15
Cross-section optimization ......................................... 55
Cross-section stresses ............................................ 41, 49
D Decimal places ......................................................... 10, 57
Design ................................................................................ 16
Design case ........................................................ 44, 53, 54
Design colored ................................................................ 47
Design of ............................................................................. 9
Design standard ............................................................... 8
Detail settings ................................................................. 19
Display navigator .................................................... 45, 47
DYNAM ................................................................................ 9
E Eccentric transverse load ............................................. 21
Equivalent stress ............................................... 20, 21, 26
Excel .................................................................................... 58
Exit STEEL ............................................................................ 8
Export ................................................................................. 58
Export cross-sections .................................................... 56
Export material ................................................................ 58
Extreme value ................................................................. 20
F Fatigue design ................................................................ 22
Favorite ............................................................................. 55
FE-LTB ................................................................................ 25
Filter ............................................................................ 40, 47
Filtering members ......................................................... 48
G General Data ....................................................................... 8
Governing internal forces .................................... 19, 35
Graphics ............................................................................ 44
H Hidden result diagram ................................................. 48
I Info about cross-section .............................................. 17
Installation .......................................................................... 6
Internal forces .......................................................... 35, 56
L Length ............................................................................... 37
Limit τ ......................................................................... 12, 30
Limit σeqv .................................................................... 12, 30
Limit σx ....................................................................... 12, 30
Limit stress ................................................... 11, 12, 20, 30
Load case ............................................................... 9, 30, 35
Load combination ............................................................ 9
Loading ...................................................................... 30, 35
Location x .................................................................. 29, 33
M Manually defined limit stresses ................................. 12
Mass .................................................................................... 38
Material ................................................................ 10, 14, 58
Material description ...................................................... 11
Material library ................................................................ 13
Material properties ........................................................ 10
Member ......................................................................... 9, 32
Method of stress calculation ...................................... 19
N Navigator ............................................................................. 8
Normal stresses .............................................................. 22
O Open cross-section ........................................................ 25

B Index
62 Program STEEL © 2013 Dlubal Engineering Software
OpenOffice ....................................................................... 58
Optimization ...................................................... 16, 21, 55
P Panel ........................................................................ 7, 45, 47
Parametric cross-section .............................................. 55
Part No. .............................................................................. 37
Partial safety factor γM ............................................ 11, 14
Parts list ...................................................................... 37, 38
Plastic shape factor αpl .......................................... 21, 22
Plastification .................................................................... 20
Print ............................................................................. 49, 50
Print graphic .................................................................... 49
Printout report ......................................................... 49, 51
Printout selection ........................................................... 50
R Remark ............................................................................... 16
Rendering ......................................................................... 47
Result combination .............................. 9, 19, 20, 25, 35
Result diagrams ....................................................... 46, 52
Result graphic .................................................................. 45
Result values .................................................................... 44
Results evaluation .......................................................... 39
Results navigator ............................................................ 44
Results tables ................................................................... 28
RSTAB graphic ................................................................. 50
RSTAB work window ..................................................... 43
S Selecting windows ........................................................... 8
Selection of stresses ...................................................... 40
Set of members ............................................. 9, 31, 36, 38
SHAPE-MASSIVE .............................................................. 30
SHAPE-THIN ..................................................................... 30
Shear stresses .................................................... 24, 25, 42
Signs ............................................................................ 22, 23
Stainless steel ........................................................... 11, 13
Start calculation .............................................................. 27
Start program .................................................................... 6
Start STEEL .......................................................................... 6
Statical moment ............................................................. 42
STEEL case ........................................................................ 21
Stress components ................................................. 40, 44
Stress design ............................................................ 26, 30
Stress diagram ................................................... 39, 41, 49
Stress graphic .................................................................. 41
Stress point ........ 18, 19, 22, 25, 29, 34, 40, 41, 42, 50
Stress ratio ........................................................... 26, 30, 41
Stress type ........................................................................ 30
Stresses ................................................... 22, 24, 28, 30, 32
Sum ..................................................................................... 38
Super combination .......................................................... 9
Surface area ..................................................................... 37
T Taper ..................................................................... 17, 32, 57
Thickness of structural components ....................... 42
Torsion .................................................................. 21, 24, 25
Transverse load............................................................... 21
Twin stress point ............................................................ 25
U Units ............................................................................ 10, 57
Unsymmetrical cross-section ..................................... 23
User profile ....................................................................... 57
User-defined cross-section ......................................... 30
V View mode ................................................................ 39, 43
Visibility ............................................................................. 47
Volume .............................................................................. 38
W Warping torsion ............................................................. 25
Windows .............................................................................. 8
X x-Location ......................................................................... 33
Y Yield strength fy,k ..................................................... 11, 14