adult - willamette workforce partnership · rescare measure annual goal quarter goal (75%) actual...
TRANSCRIPT


ResCare Measure Annual GoalQuarter Goal
(75%)Actual Goal attainment Progress (YTD)
PY 16 YTD Comparison
Variance Notes
Enrollment 570 428 442 78% 671 -34%
Workshops 240 180 225 94% 180 25%
Training 80 60 98 123% 68 44%
Sector Training 25 19 69 276% 42 64%
On-the-Job Training 106 80 130 123% 275 -53%OJT Complete 85 64 85 100% 188 -55%
CSC-Adult
Measure Annual Goal Quarter Goal Actual Goal achieved Progress (YTD)
Enrollment 190 143 121 64% 231 -48%
Workshops 120 90 112 93% 90 24%
Training 24 18 27 113% 17 59%
Sector Training 10 8 19 190% 13 46%
Linn Youth
Measure Annual Goal Quarter Goal Actual Goal attainment Progress (YTD)
Served 75 75 70 93% 67 4%
Education Rengagement 90% 90% 100% 111% 100% 0%
Financial Literacy 90% 90% 85% 94% 89% -4%
Work Experience 80% 80% 98% 122% 0%
ELY Measure Annual Goal Quarter Goal Actual Goal attainment Progress (YTD)
Served 125 125 115 92% 150 -23%
Education Rengagement 90% 90% 98% 109% 100% -2%
Financial Literacy 90% 80% 98% 109% 100% -2%
Work Experience 80% 90% 86% 108% 0%YOOP Measure Annual Goal Quarter Goal Actual Goal attainment Progress (YTD)
Served 115 115 143 124% 153 -7%
Education Rengagement 90% 90% 100% 111% 100% 0%
Financial Literacy 90% 90% 94% 104% 90% 4%
Work Experience 80% 80% 72% 90% 0%
CSC-Polk Measure Annual Goal Quarter Goal Actual Goal attainment Progress (YTD)
Served 105 105 81 77% 91 -11%
Education Rengagement 90% 90% 100% 111% 100% 0%
Financial Literacy 90% 90% 78% 87% 76% 3%
Work Experience 80% 80% 66% 83% 0%
Program Delivery by Provider (Quarter 3)

ResCare Fund Stream Budget Expended Balance Progress YTD Notes
889,564.00$ 683,460.73$ 206,103.27$ 77%
1,154,229.00$ 791,218.15$ 363,010.85$ 69%
159,542.00$ 140,890.14$ 18,651.86$ 88%
2,203,335.00$ 1,615,569.02$ 587,765.98$ 73%
CSC-Adult Fund Stream Budget Expended Balance Progress YTD Notes184,349.00$ 139,872.00$ 44,477.00$ 76%
240,786.00$ 180,102.00$ 60,684.00$ 75%
11,618.00$ 7,150.00$ 4,468.00$ 62%
436,753.00$ 327,124.00$ 109,629.00$ 75%
CSC-Youth Fund Stream Budget Expended Balance Progress YTD Notes
326,766.00$ 280,709.00$ 46,057.00$ 86%
335,786.00$ 215,453.00$ 120,333.00$ 64%
662,552.00$ 496,162.00$ 166,390.00$ 75%
ELY Fund Stream Budget Expended Balance Progress YTD Notes
377,972.00$ 278,873.88$ 99,098.12$ 74%
YOOP Fund Stream Budget Expended Balance Progress YTD Notes
322,112.00$ 221,292.10$ 100,819.90$ 69%
g p g g p g 800,081.00 579,157.50 220,923.50 338,208.00 244,087.42 94,120.58
Actual 72% Actual 72%Remainder 28% Remainder 28%
Training Spending (July-March)
SP NEG
Total
Adult
Dislocated Worker (DW)
Contract Expenditures by Provider (Quarter 3)
Youth
Adult
Dislocated Worker (DW)
SP NEG
Total
Youth-Linn
Youth-Polk
Total
Youth
Budget,$ 800,081.00
Spent, $ 579,157.50
Remaining$ 220,923.50
Adult
72%Budget,
$ 338,208.00
Spent, $ 244,087.42
Remaining, $ 94,120.58
Youth
72%

WIOA Funds:
WIOA Administration 638,044 328,499 58,844 - 250,700 408,622 659,322
WIOA Adult 1,657,573 984,629 275,639 - 397,305 1,194,158 1,591,463
WIOA Dislocated Worker 2,157,186 1,174,586 466,063 - 516,538 1,130,059 1,646,597
WIOA Youth 2,089,640 1,059,775 402,939 - 626,926 1,353,403 1,980,329
WIOA NEG - Sector Partnerships 193,721 170,177 23,543 - 0 - 0
Subtotal 6,736,163$ 3,717,666$ 1,227,028$ -$ 1,791,470$ 4,086,241$ 5,877,711$
Other Funds:
WIF (Rethinking) 1,444,685 595,767 248,236 - 600,682 - 600,682
Board Support 212,520 24,567 58,844 - 129,109 - 129,109
Sector Strategies 212,258 9,379 25,000 - 177,879 - 177,879
Back to Work 715,229 1,789 2,000 - 711,440 - 711,440
Unrestricted 56,130 8,290 - - 47,840 16,130 63,970
Subtotal: 2,640,822$ 639,792$ 334,080$ -$ 1,666,950$ 16,130$ 1,683,080$
Resources Total: 9,376,985$ 4,357,457$ 1,561,108$ -$ 3,458,420$ 4,102,371$ 7,560,791$
2018-19
Projected
RESOURCE PROJECTIONS
as of March 31, 2018
Title 2017-18
Resources
2017-18 to
Date
2017-18
Projected
Expiring
Funds
Resources
Carried
2018-19
Estimated
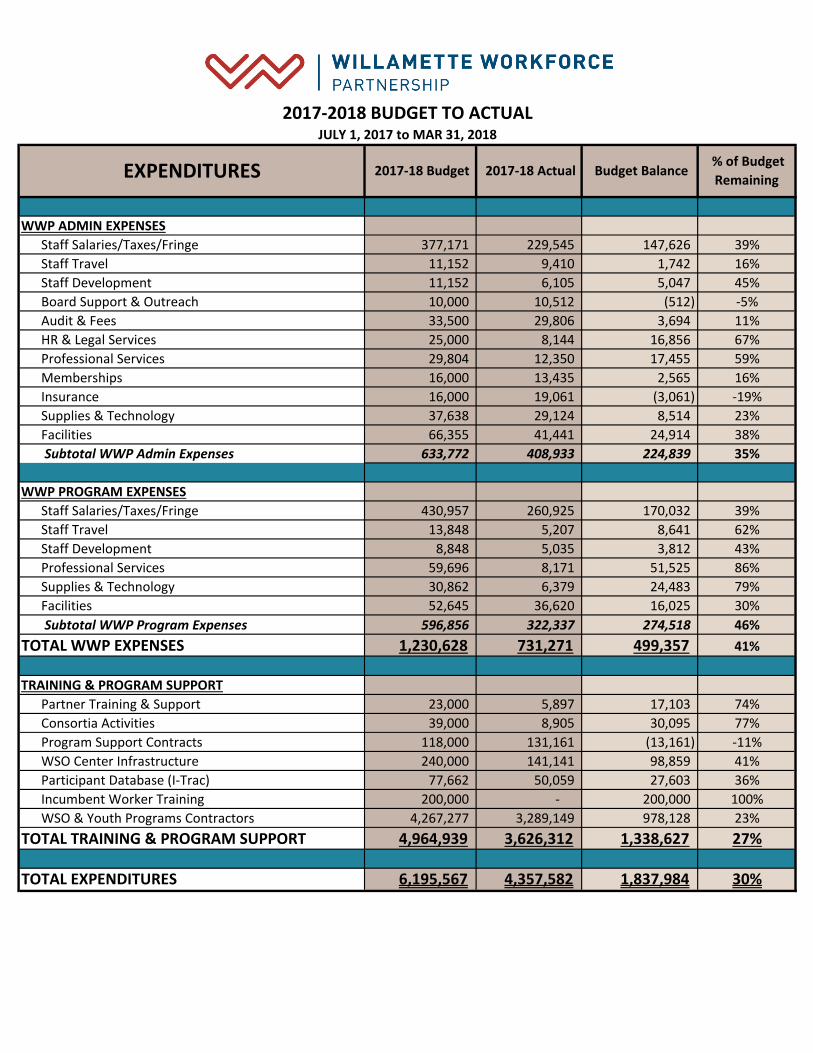
WWP ADMIN EXPENSES
Staff Salaries/Taxes/Fringe 377,171 229,545 147,626 39%
Staff Travel 11,152 9,410 1,742 16%
Staff Development 11,152 6,105 5,047 45%
Board Support & Outreach 10,000 10,512 (512) -5%
Audit & Fees 33,500 29,806 3,694 11%
HR & Legal Services 25,000 8,144 16,856 67%
Professional Services 29,804 12,350 17,455 59%
Memberships 16,000 13,435 2,565 16%
Insurance 16,000 19,061 (3,061) -19%
Supplies & Technology 37,638 29,124 8,514 23%
Facilities 66,355 41,441 24,914 38%
Subtotal WWP Admin Expenses 633,772 408,933 224,839 35%
WWP PROGRAM EXPENSES
Staff Salaries/Taxes/Fringe 430,957 260,925 170,032 39%
Staff Travel 13,848 5,207 8,641 62%
Staff Development 8,848 5,035 3,812 43%
Professional Services 59,696 8,171 51,525 86%
Supplies & Technology 30,862 6,379 24,483 79%
Facilities 52,645 36,620 16,025 30%
Subtotal WWP Program Expenses 596,856 322,337 274,518 46%
TOTAL WWP EXPENSES 1,230,628 731,271 499,357 41%
TRAINING & PROGRAM SUPPORT
Partner Training & Support 23,000 5,897 17,103 74%
Consortia Activities 39,000 8,905 30,095 77%
Program Support Contracts 118,000 131,161 (13,161) -11%
WSO Center Infrastructure 240,000 141,141 98,859 41%
Participant Database (I-Trac) 77,662 50,059 27,603 36%
Incumbent Worker Training 200,000 - 200,000 100%
WSO & Youth Programs Contractors 4,267,277 3,289,149 978,128 23%
TOTAL TRAINING & PROGRAM SUPPORT 4,964,939 3,626,312 1,338,627 27%
TOTAL EXPENDITURES 6,195,567 4,357,582 1,837,984 30%
2017-2018 BUDGET TO ACTUALJULY 1, 2017 to MAR 31, 2018
EXPENDITURES 2017-18 Budget 2017-18 Actual Budget Balance % of Budget
Remaining
Rethinking Job Search Success Continues May 2018
Overview The Rethinking Job Search project is an innovative approach aimed at preparing Oregonians who receive unemployment insurance benefits to build their confidence, motivation and accountability to find and retain employment. The program is structured as a workshop series of 12, 2-hour classes delivered over 4 weeks. The focus is on learning and applying cognitive behavioral techniques and tools to enhance the ability to think and act effectively in managing the challenge of job-seeking, and ultimately to reduce the duration of time unemployed. Results to Date
The Rethinking implementation period runs approximately 2.75 years – from January 1, 2016 through September 30, 2018.
The grant requires us to serve 1,000 Oregonians. We are well on our way to exceeding this goal.
As of May 1, 2018, with more than 4 months of implementation time remaining, 1,132 participants across the State of Oregon have participated in Rethinking Job Search workshops.
An extraordinary 97% of participants responding to an exit survey say they would recommend Rethinking to other people.
o 95% of completers reported being motivated to search for jobs.
o 87% of completers reported being confident in their job search. Preliminary employment outcomes for entering employment (55%) and retention (85%) have
greatly exceeded program goals, though it should be noted that the goals were set unrealistically low due to the high unemployment rate when the grant proposal was written.
o Grant goals are stated as 20% of participants will enter employment 3 months after program participation and 15% will retain employment 12 months after participation.
Participants report they are transforming the way they search for work and as a result, gaining employment.
Public Policy Associates (PPA), our third party evaluators, will publish the results of this experimental project in September 2019.
Rethinking’s Future
PPA surveyed all Rethinking past participants to learn of their interest in a Rethinking web-based platform that would provide additional information and tools to support job searching and sustain employment. The results are being analyzed and will be available by June 1, 2018.
There is enormous potential to market and sell Rethinking Job Search and generate unrestricted revenue. We are in discussion with participating workforce boards to determine their interest in a post-grant implementation pilot. This pilot will give us the experience we need to implement the program across the State of Oregon.
The program is gaining national recognition and for the second year in a row we are presenting at The National Association of Workforce Development Professionals (NAWDP) conference. We are also presenting at the International Association of Workforce Professionals (IAWP) conference and recently presented at the National Association of Workforce Boards (NAWB) conference.
In addition, Rethinking Job Search has been nominated for IAWP’s 2018 Innovation in Workforce Development award.

Role of the Workforce Development Board as defined in the
Workforce Innovation and Opportunity Act
13 key functions
Provide program oversight including selection of one‐stop operators and service providers
Develop strategies for technology use that maximizes effectiveness and accessibility
Certify WorkSource Centers including assessing the physical and programmatic accessibility
Negotiate and execute memoranda of understanding and cost sharing agreements with workforce system partners
Lead efforts to engage employers
Identify and promote proven and promising practices in workforce development
Provide analysis of regional labor market conditions
Coordinate services with education and training partners
Convene, broker and leverage efforts with local workforce stakeholders
Lead efforts to develop and implement career pathways
Develop a local plan in accordance with Workforce Innovation and Opportunity Act requirements
Negotiate local performance accountability with state and federal funders
Develop and manage the Workforce Development Board including budget and administration