aerostat 2006 geo - athens international airport emphasis on information management and...
TRANSCRIPT

20062006A E R O S T A T
exo|_stau 5/2/07 6:59 PM Page 3

CONTENTS
FOREWORD 1
KEY DEVELOPMENTS 2006 2
PASSENGER TRAFFIC 6
AIRCRAFT MOVEMENTS 14
CARGO UPLIFT 24
NETWORK 30
PUNCTUALITY 36
SERVICE PERFORMANCE 42
PASSENGER PROFILE 46
TOURISM DEVELOPMENT 52
THE GREEK AVIATION MARKET 58
THE EUROPEAN AND GLOBAL AVIATION INDUSTRY 62
DEFINITIONS & NOTES 66
P A G E
exo|_stau 5/2/07 6:59 PM Page 6
2006 was another milestone year for Athens International Airport (AIA).
With traffic exceeding the 15 million-passenger threshold, and after 6 years of
operational excellence, AIA entered the league of the large and most successful
airports in Europe.
In a favourable year for the global aviation industry, and thanks to the persistent implementation of
AIA's policy for sustainable traffic development, the airport achieved considerable traffic growth,
breaking previous records. For a third consecutive year, AIA presented special awards to the airlines
recording the highest passenger development in 2006, in recognition of their contribution to the
airport's overall robust growth.
The fifth edition of AIA's annual traffic report,“Aerostat 2006”, provides a comprehensive picture
of the airport's traffic evolution during the year 2006, presenting key market trends and
characteristics. The main developments in typical traffic segments (network, passenger traffic,
aircraft movements, flight punctuality, cargo uplift) are analytically presented. In addition, the report
portrays the performance of services offered to air travellers, the demographic profile and
travelling behaviour of AIA passengers, as well as the development of incoming and outgoing
tourism passing through Athens International Airport. The major market trends in Greece and
worldwide are also presented.
Having established AIA as a market intelligence focal point on the Greek travel market, we place
special emphasis on information management and communication.“Aerostat 2006” is one of AIA's
corporate publications serving as an information tool for our customers and business partners.We
look forward to offering you valid, customised and comprehensive knowledge on the Athens
aviation market.
George KaramanosDirector, Communications & Marketing
1
aerostat 2006_geo.qxd 5/2/07 6:56 PM Page 1
key developments 2006
aerostat 2006_geo.qxd 5/2/07 6:56 PM Page 2
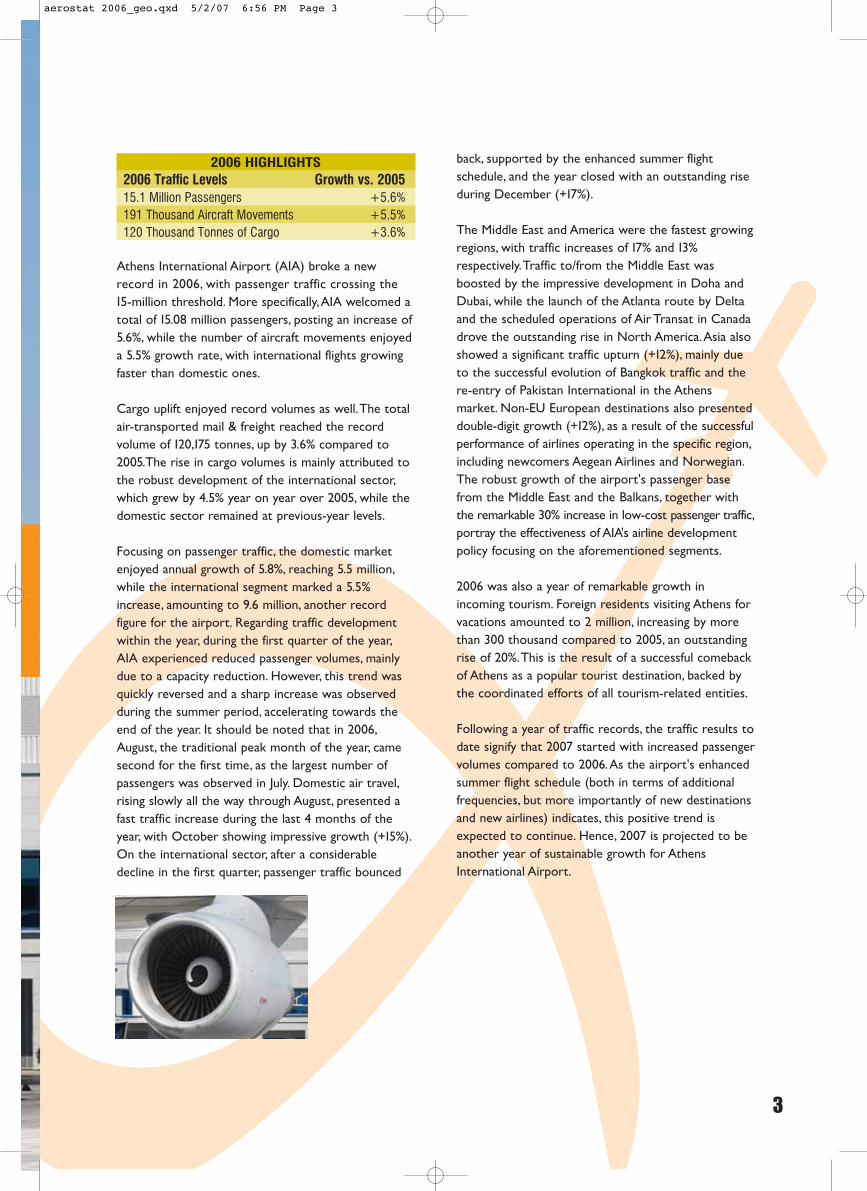
2006 HIGHLIGHTS2006 Traffic Levels Growth vs. 200515.1 Million Passengers +5.6%191 Thousand Aircraft Movements +5.5%120 Thousand Tonnes of Cargo +3.6%
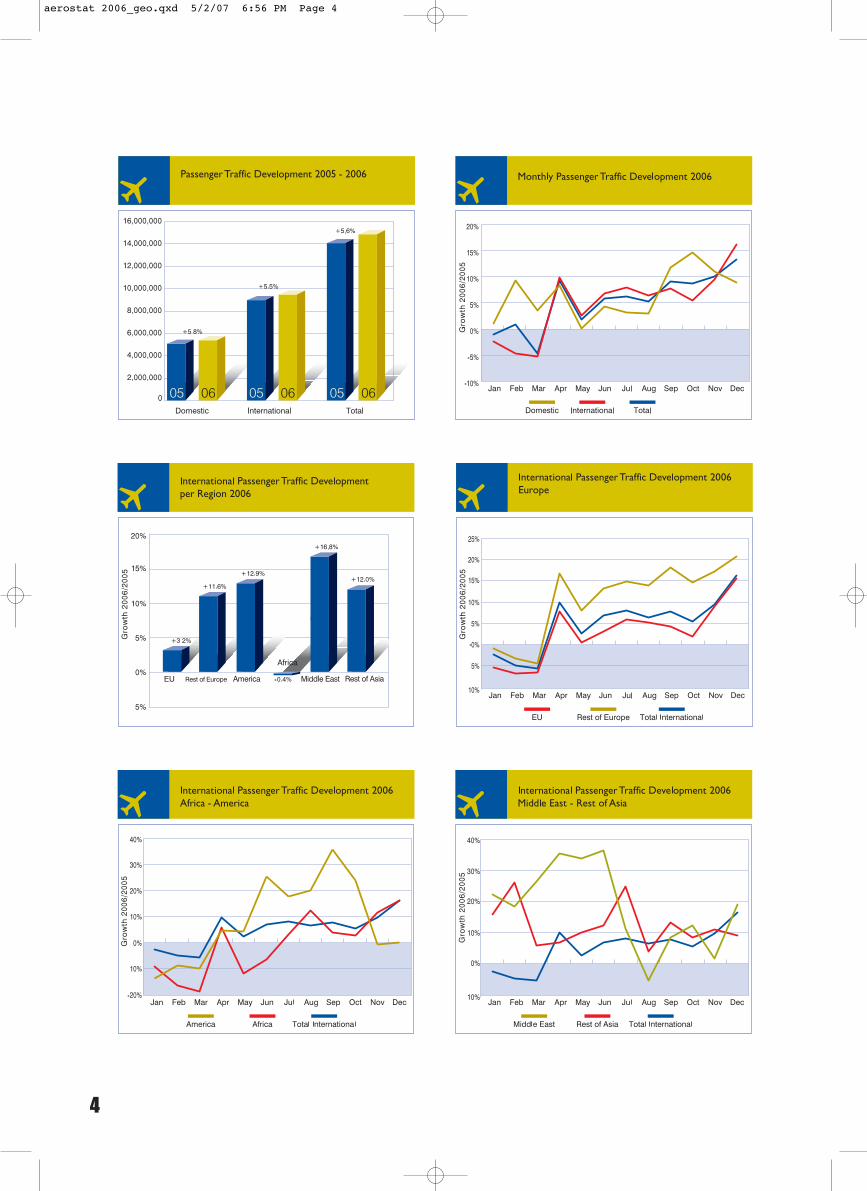
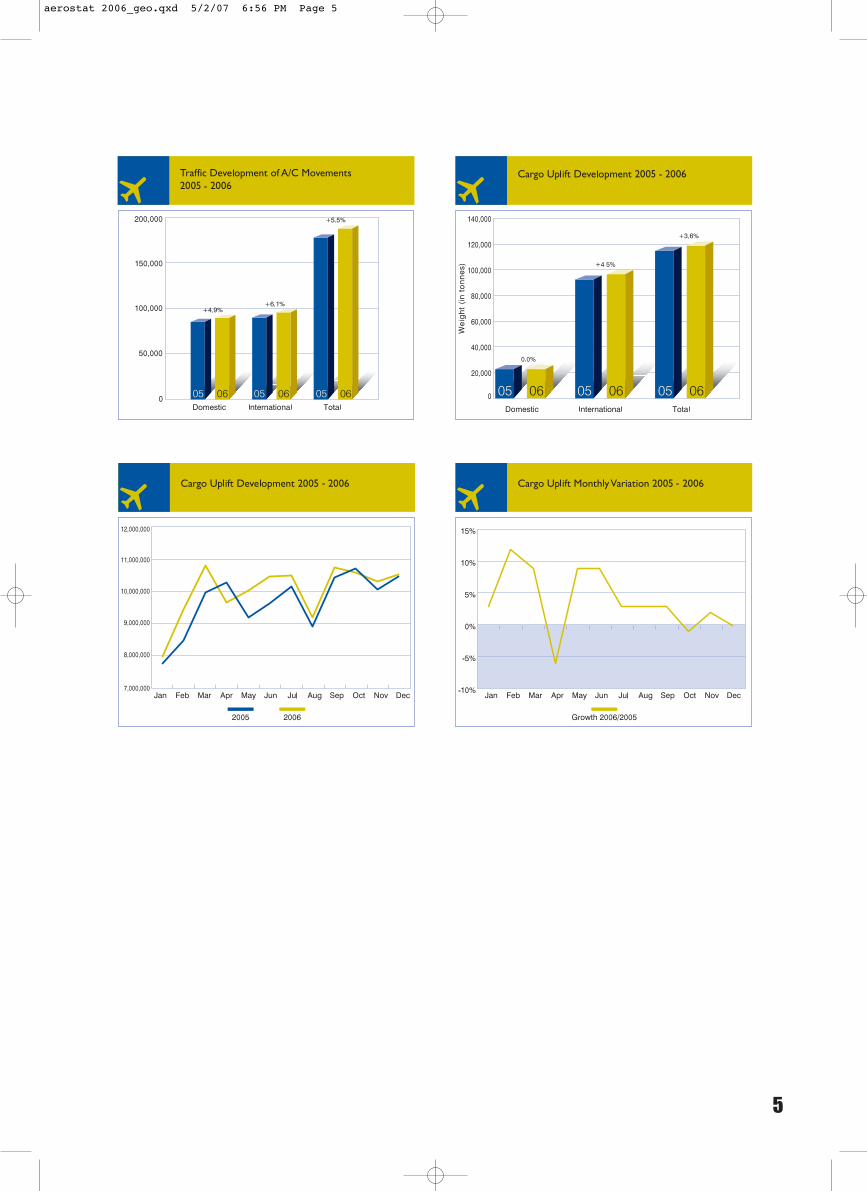
Athens International Airport (AIA) broke a newrecord in 2006, with passenger traffic crossing the15-million threshold. More specifically,AIA welcomed atotal of 15.08 million passengers, posting an increase of5.6%, while the number of aircraft movements enjoyeda 5.5% growth rate, with international flights growingfaster than domestic ones.
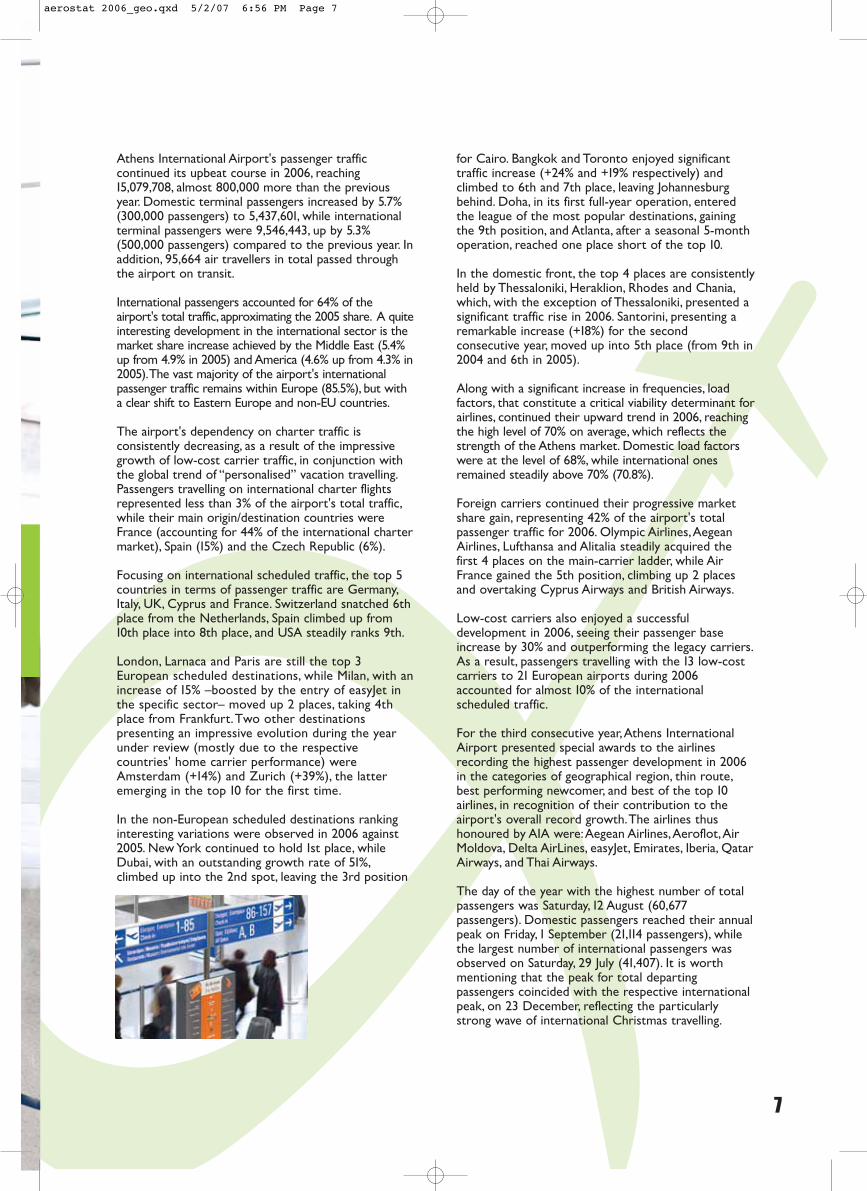
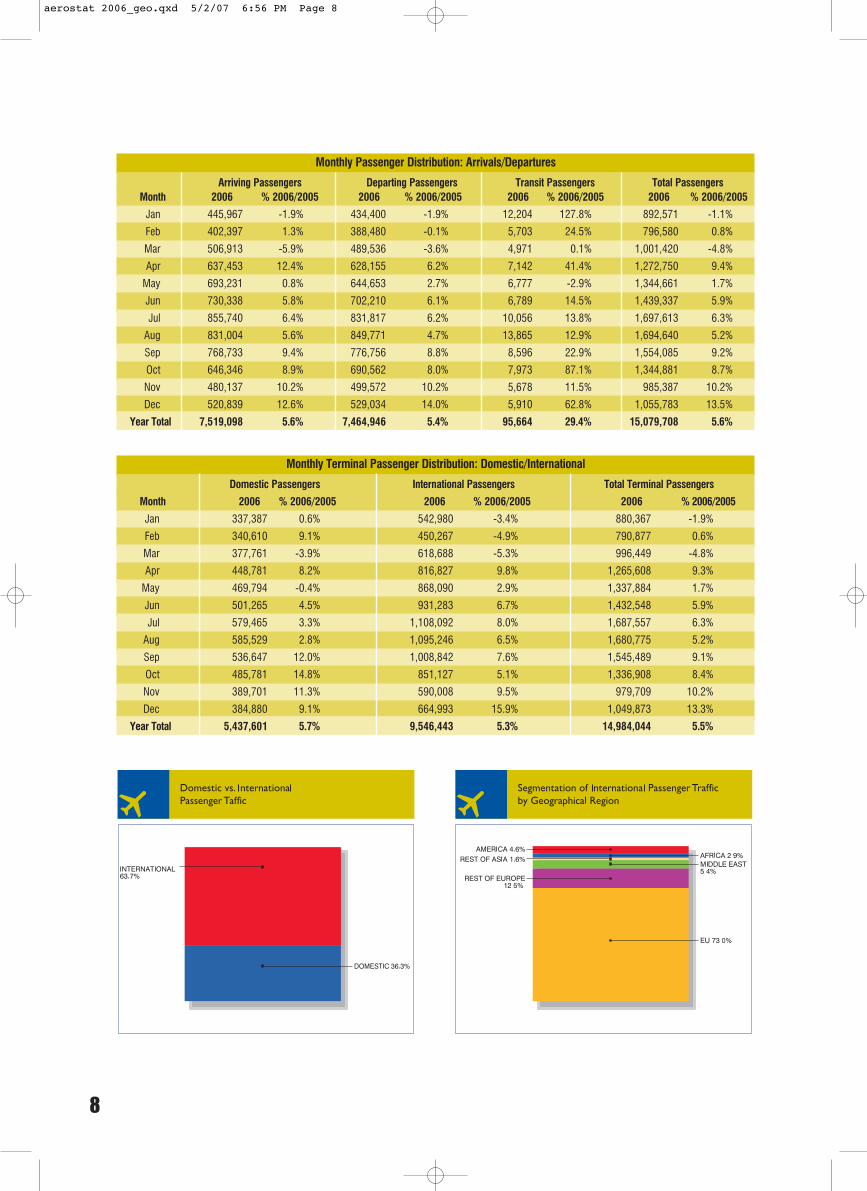
Cargo uplift enjoyed record volumes as well.The totalair-transported mail & freight reached the recordvolume of 120,175 tonnes, up by 3.6% compared to2005.The rise in cargo volumes is mainly attributed tothe robust development of the international sector,which grew by 4.5% year on year over 2005, while thedomestic sector remained at previous-year levels.
Focusing on passenger traffic, the domestic marketenjoyed annual growth of 5.8%, reaching 5.5 million,while the international segment marked a 5.5%increase, amounting to 9.6 million, another recordfigure for the airport. Regarding traffic developmentwithin the year, during the first quarter of the year,AIA experienced reduced passenger volumes, mainlydue to a capacity reduction. However, this trend wasquickly reversed and a sharp increase was observedduring the summer period, accelerating towards theend of the year. It should be noted that in 2006,August, the traditional peak month of the year, camesecond for the first time, as the largest number ofpassengers was observed in July. Domestic air travel,rising slowly all the way through August, presented afast traffic increase during the last 4 months of theyear, with October showing impressive growth (+15%).On the international sector, after a considerabledecline in the first quarter, passenger traffic bounced
back, supported by the enhanced summer flightschedule, and the year closed with an outstanding riseduring December (+17%).
The Middle East and America were the fastest growingregions, with traffic increases of 17% and 13%respectively.Traffic to/from the Middle East wasboosted by the impressive development in Doha andDubai, while the launch of the Atlanta route by Deltaand the scheduled operations of Air Transat in Canadadrove the outstanding rise in North America.Asia alsoshowed a significant traffic upturn (+12%), mainly dueto the successful evolution of Bangkok traffic and there-entry of Pakistan International in the Athensmarket. Non-EU European destinations also presenteddouble-digit growth (+12%), as a result of the successfulperformance of airlines operating in the specific region,including newcomers Aegean Airlines and Norwegian.The robust growth of the airport's passenger basefrom the Middle East and the Balkans, together withthe remarkable 30% increase in low-cost passenger traffic,portray the effectiveness of AIA's airline developmentpolicy focusing on the aforementioned segments.
2006 was also a year of remarkable growth inincoming tourism. Foreign residents visiting Athens forvacations amounted to 2 million, increasing by morethan 300 thousand compared to 2005, an outstandingrise of 20%.This is the result of a successful comebackof Athens as a popular tourist destination, backed bythe coordinated efforts of all tourism-related entities.
Following a year of traffic records, the traffic results todate signify that 2007 started with increased passengervolumes compared to 2006.As the airport's enhancedsummer flight schedule (both in terms of additionalfrequencies, but more importantly of new destinationsand new airlines) indicates, this positive trend isexpected to continue. Hence, 2007 is projected to beanother year of sustainable growth for AthensInternational Airport.
3
aerostat 2006_geo.qxd 5/2/07 6:56 PM Page 3
4
aerostat 2006_geo.qxd 5/2/07 6:56 PM Page 4
5
aerostat 2006_geo.qxd 5/2/07 6:56 PM Page 5

passenger traffic
aerostat 2006_geo.qxd 5/2/07 6:56 PM Page 6
Athens International Airport's passenger trafficcontinued its upbeat course in 2006, reaching15,079,708, almost 800,000 more than the previousyear. Domestic terminal passengers increased by 5.7%(300,000 passengers) to 5,437,601, while internationalterminal passengers were 9,546,443, up by 5.3%(500,000 passengers) compared to the previous year. Inaddition, 95,664 air travellers in total passed throughthe airport on transit.
International passengers accounted for 64% of theairport's total traffic, approximating the 2005 share. A quiteinteresting development in the international sector is themarket share increase achieved by the Middle East (5.4%up from 4.9% in 2005) and America (4.6% up from 4.3% in2005).The vast majority of the airport's internationalpassenger traffic remains within Europe (85.5%), but witha clear shift to Eastern Europe and non-EU countries.
The airport's dependency on charter traffic isconsistently decreasing, as a result of the impressivegrowth of low-cost carrier traffic, in conjunction withthe global trend of “personalised” vacation travelling.Passengers travelling on international charter flightsrepresented less than 3% of the airport's total traffic,while their main origin/destination countries wereFrance (accounting for 44% of the international chartermarket), Spain (15%) and the Czech Republic (6%).
Focusing on international scheduled traffic, the top 5countries in terms of passenger traffic are Germany,Italy, UK, Cyprus and France. Switzerland snatched 6thplace from the Netherlands, Spain climbed up from10th place into 8th place, and USA steadily ranks 9th.
London, Larnaca and Paris are still the top 3European scheduled destinations, while Milan, with anincrease of 15% –boosted by the entry of easyJet inthe specific sector– moved up 2 places, taking 4thplace from Frankfurt.Two other destinationspresenting an impressive evolution during the yearunder review (mostly due to the respectivecountries' home carrier performance) wereAmsterdam (+14%) and Zurich (+39%), the latteremerging in the top 10 for the first time.
In the non-European scheduled destinations rankinginteresting variations were observed in 2006 against2005. New York continued to hold 1st place, whileDubai, with an outstanding growth rate of 51%,climbed up into the 2nd spot, leaving the 3rd position
for Cairo. Bangkok and Toronto enjoyed significanttraffic increase (+24% and +19% respectively) andclimbed to 6th and 7th place, leaving Johannesburgbehind. Doha, in its first full-year operation, enteredthe league of the most popular destinations, gainingthe 9th position, and Atlanta, after a seasonal 5-monthoperation, reached one place short of the top 10.
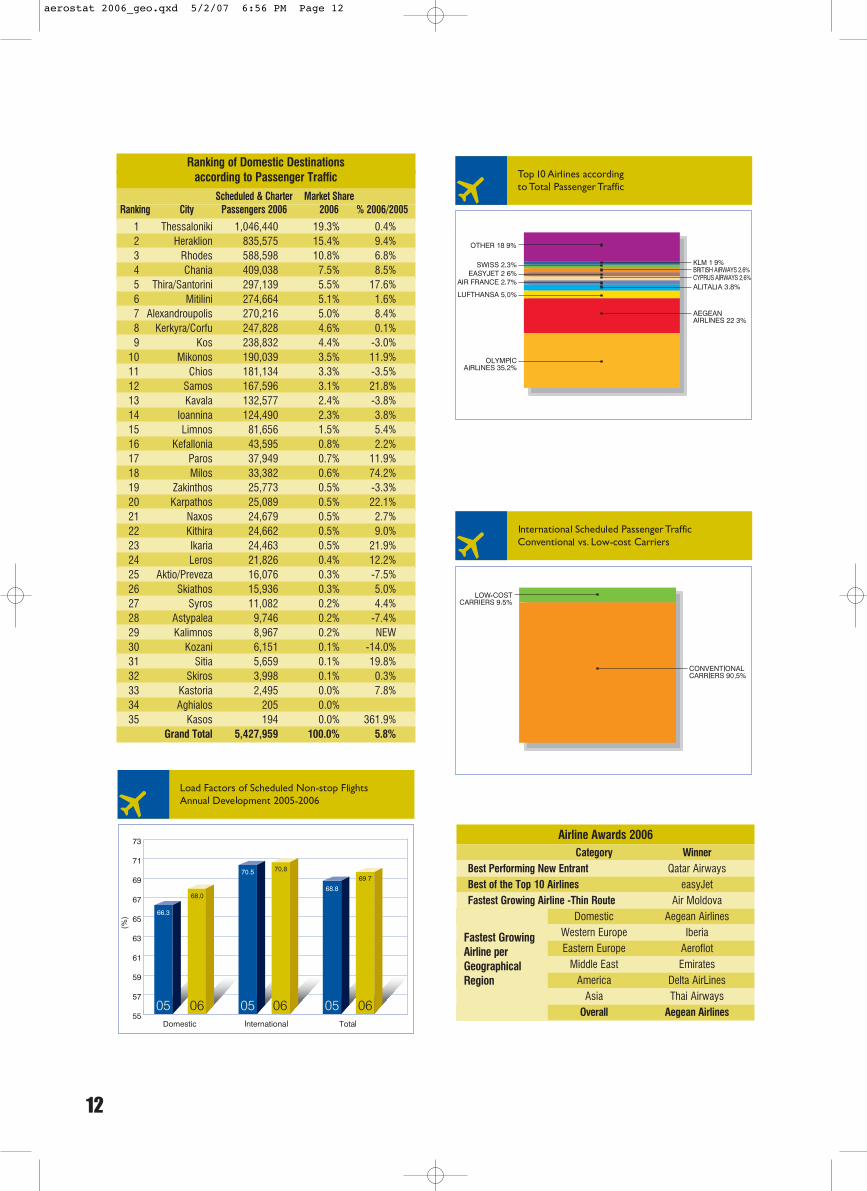
In the domestic front, the top 4 places are consistentlyheld by Thessaloniki, Heraklion, Rhodes and Chania,which, with the exception of Thessaloniki, presented asignificant traffic rise in 2006. Santorini, presenting aremarkable increase (+18%) for the secondconsecutive year, moved up into 5th place (from 9th in2004 and 6th in 2005).
Along with a significant increase in frequencies, loadfactors, that constitute a critical viability determinant forairlines, continued their upward trend in 2006, reachingthe high level of 70% on average, which reflects thestrength of the Athens market. Domestic load factorswere at the level of 68%, while international onesremained steadily above 70% (70.8%).
Foreign carriers continued their progressive marketshare gain, representing 42% of the airport's totalpassenger traffic for 2006. Olympic Airlines,AegeanAirlines, Lufthansa and Alitalia steadily acquired thefirst 4 places on the main-carrier ladder, while AirFrance gained the 5th position, climbing up 2 placesand overtaking Cyprus Airways and British Airways.
Low-cost carriers also enjoyed a successfuldevelopment in 2006, seeing their passenger baseincrease by 30% and outperforming the legacy carriers.As a result, passengers travelling with the 13 low-costcarriers to 21 European airports during 2006accounted for almost 10% of the internationalscheduled traffic.
For the third consecutive year,Athens InternationalAirport presented special awards to the airlinesrecording the highest passenger development in 2006in the categories of geographical region, thin route,best performing newcomer, and best of the top 10airlines, in recognition of their contribution to theairport's overall record growth.The airlines thushonoured by AIA were:Aegean Airlines,Aeroflot,AirMoldova, Delta AirLines, easyJet, Emirates, Iberia, QatarAirways, and Thai Airways.
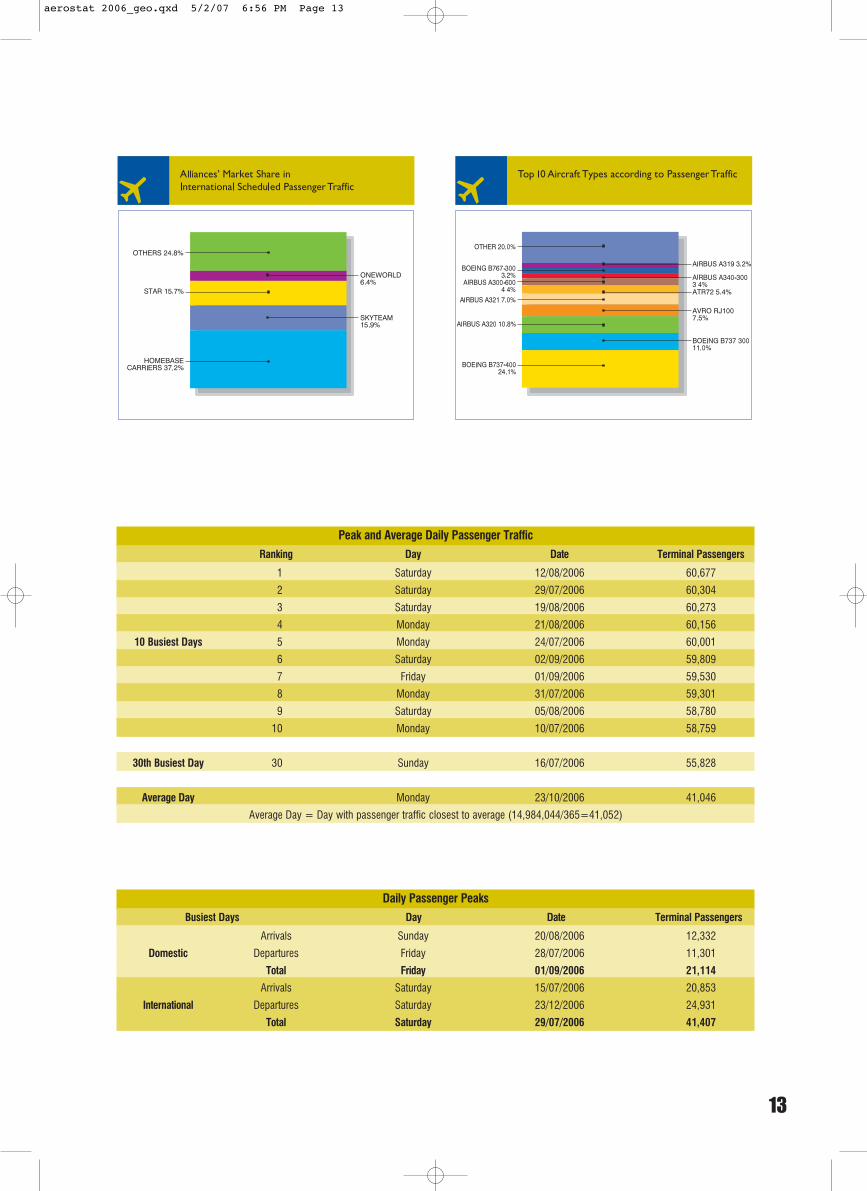
The day of the year with the highest number of totalpassengers was Saturday, 12 August (60,677passengers). Domestic passengers reached their annualpeak on Friday, 1 September (21,114 passengers), whilethe largest number of international passengers wasobserved on Saturday, 29 July (41,407). It is worthmentioning that the peak for total departingpassengers coincided with the respective internationalpeak, on 23 December, reflecting the particularlystrong wave of international Christmas travelling.
7
aerostat 2006_geo.qxd 5/2/07 6:56 PM Page 7
Monthly Passenger Distribution: Arrivals/Departures
Arriving Passengers Departing Passengers Transit Passengers Total PassengersMonth 2006 % 2006/2005 2006 % 2006/2005 2006 % 2006/2005 2006 % 2006/2005
Jan 445,967 -1.9% 434,400 -1.9% 12,204 127.8% 892,571 -1.1%
Feb 402,397 1.3% 388,480 -0.1% 5,703 24.5% 796,580 0.8%
Mar 506,913 -5.9% 489,536 -3.6% 4,971 0.1% 1,001,420 -4.8%
Apr 637,453 12.4% 628,155 6.2% 7,142 41.4% 1,272,750 9.4%
May 693,231 0.8% 644,653 2.7% 6,777 -2.9% 1,344,661 1.7%
Jun 730,338 5.8% 702,210 6.1% 6,789 14.5% 1,439,337 5.9%
Jul 855,740 6.4% 831,817 6.2% 10,056 13.8% 1,697,613 6.3%
Aug 831,004 5.6% 849,771 4.7% 13,865 12.9% 1,694,640 5.2%
Sep 768,733 9.4% 776,756 8.8% 8,596 22.9% 1,554,085 9.2%
Oct 646,346 8.9% 690,562 8.0% 7,973 87.1% 1,344,881 8.7%
Nov 480,137 10.2% 499,572 10.2% 5,678 11.5% 985,387 10.2%
Dec 520,839 12.6% 529,034 14.0% 5,910 62.8% 1,055,783 13.5%
Year Total 7,519,098 5.6% 7,464,946 5.4% 95,664 29.4% 15,079,708 5.6%
Monthly Terminal Passenger Distribution: Domestic/International
Domestic Passengers International Passengers Total Terminal Passengers
Month 2006 % 2006/2005 2006 % 2006/2005 2006 % 2006/2005
Jan 337,387 0.6% 542,980 -3.4% 880,367 -1.9%
Feb 340,610 9.1% 450,267 -4.9% 790,877 0.6%
Mar 377,761 -3.9% 618,688 -5.3% 996,449 -4.8%
Apr 448,781 8.2% 816,827 9.8% 1,265,608 9.3%
May 469,794 -0.4% 868,090 2.9% 1,337,884 1.7%
Jun 501,265 4.5% 931,283 6.7% 1,432,548 5.9%
Jul 579,465 3.3% 1,108,092 8.0% 1,687,557 6.3%
Aug 585,529 2.8% 1,095,246 6.5% 1,680,775 5.2%
Sep 536,647 12.0% 1,008,842 7.6% 1,545,489 9.1%
Oct 485,781 14.8% 851,127 5.1% 1,336,908 8.4%
Nov 389,701 11.3% 590,008 9.5% 979,709 10.2%
Dec 384,880 9.1% 664,993 15.9% 1,049,873 13.3%
Year Total 5,437,601 5.7% 9,546,443 5.3% 14,984,044 5.5%
8
aerostat 2006_geo.qxd 5/2/07 6:56 PM Page 8

Monthly Terminal Passenger Distribution: Scheduled/Non-scheduledCommercial Non-commercial
Scheduled Non-scheduled Other Commercial
Month 2006 % 2006/2005 2006 % 2006/2005 2006 % 2006/2005 2006 % 2006/2005Jan 865,293 -1.8% 13,762 -14.8% 139 1,173 142.4%Feb 788,513 2.0% 1,698 -86.0% 235 63.2% 431 -23.6%Mar 985,287 -4.5% 10,159 -26.5% 28 833.3% 975 28.8%Apr 1,226,542 9.2% 38,106 9.4% 197 763 1.2%
May 1,283,937 2.2% 52,882 -7.8% 220 -21.7% 845 -8.3%Jun 1,379,656 7.5% 51,405 -24.7% 6 -96.7% 1,481 13.3%Jul 1,612,151 7.5% 73,908 -14.2% 7 250.0% 1,491 4.7%
Aug 1,598,310 6.3% 81,165 -12.4% 0 -100.0% 1,300 -2.1%Sep 1,485,573 10.3% 58,679 -14.2% 0 1,237 1.3%Oct 1,299,236 9.3% 36,552 -14.3% 90 -44.8% 1,030 7.4%Nov 973,944 10.4% 4,833 -21.0% 217 715 31.4%Dec 1,009,090 11.8% 40,015 71.6% 233 -4.1% 535 12.2%
Year Total 14,507,532 6.1% 463,164 -11.2% 1,372 -26.4% 11,976 11.5%
Monthly Terminal Passenger Distribution: Intra-/Extra-SchengenIntra-Schengen Extra-Schengen Total Terminal Passengers
Month 2006 % 2006/2005 2006 % 2006/2005 2006 % 2006/2005Jan 591,211 -1.7% 289,156 -2.2% 880,367 -1.9%Feb 562,605 3.4% 228,272 -5.5% 790,877 0.6%Mar 686,020 -3.9% 310,429 -6.6% 996,449 -4.8%Apr 872,325 9.2% 393,283 9.4% 1,265,608 9.3%May 933,091 1.2% 404,793 3.0% 1,337,884 1.7%Jun 989,497 5.1% 443,051 7.9% 1,432,548 5.9%Jul 1,164,329 5.8% 523,228 7.4% 1,687,557 6.3%Aug 1,153,277 5.7% 527,498 4.0% 1,680,775 5.2%Sep 1,062,963 8.4% 482,526 10.7% 1,545,489 9.1%Oct 925,560 9.5% 411,348 6.1% 1,336,908 8.4%Nov 671,571 9.1% 308,138 12.6% 979,709 10.2%Dec 696,218 11.9% 353,655 16.3% 1,049,873 13.3%
Year Total 10,308,667 5.4% 4,675,377 5.6% 14,984,044 5.5%
9
aerostat 2006_geo.qxd 5/2/07 6:56 PM Page 9

Top 10 InternationalScheduled Markets/Countries
Scheduled Market Share % 2006/Ranking Country Passengers 2006 2006 2005
1 Germany 1,387,912 15.3% 0.6%2 Italy 1,173,163 12.9% 9.6%3 United Kingdom 1,006,224 11.1% -0.4%4 Cyprus 767,140 8.4% -3.4%5 France 633,093 7.0% 4.9%6 Switzerland 377,307 4.1% 25.2%7 Netherlands 362,446 4.0% 13.9%8 Spain 328,125 3.6% 27.5%9 USA 319,146 3.5% 22.6%
10 Belgium 269,516 3.0% -3.1%Other 2,472,429 27.2% 8.6%
Total International Scheduled 9,096,501 100.0% 6.4%
Top 10 InternationalCharter Markets/Countries
Charter Market Share Ranking Country Passengers 2006 2006 % 2006/2005
1 France 188,984 43.7% -19.1%2 Spain 66,351 15.3% 9.6%3 Czech Republic 25,809 6.0% 8.6%4 Italy 23,751 5.5% 18.6%5 Sweden 18,167 4.2% -6.8%6 Austria 17,461 4.0% 48.1%7 United Kingdom 13,813 3.2% 61.4%8 Israel 11,056 2.6% 2412.7%9 Tunisia 7,171 1.7% 179.9%
10 Netherlands 6,977 1.6% 0.2%Other 52,969 12.2% -53.2%
Total International Charter 432,509 100.0% -13.7%
Top 10 European InternationalScheduled Destinations
Scheduled Market Share Ranking City Passengers 2006 2006 % 2006/2005
1 London 970,989 12.5% 1.5%2 Larnaca 760,323 9.8% -3.3%3 Paris 630,209 8.1% 4.5%4 Milan 576,503 7.5% 15.4%5 Rome 553,515 7.2% 2.9%6 Frankfurt 551,667 7.1% -0.3%7 Munich 438,984 5.7% 7.7%8 Amsterdam 362,446 4.7% 13.9%9 Brussels 269,516 3.5% -3.1%
10 Zurich 265,654 3.4% 39.1%Other 2,357,349 30.5% 6.3%
Total EuropeanInternational Scheduled 7,737,155 100.0% 5.3%
10
aerostat 2006_geo.qxd 5/2/07 6:56 PM Page 10
Top 10 Non-European InternationalScheduled Destinations
Scheduled Market Share % 2006/Ranking Country Passengers 2006 2006 2005
1 New York 263,327 19.4% 1.1%2 Dubai 156,680 11.5% 50.8%3 Cairo 156,503 11.5% -2.6%4 Tel Aviv 109,004 8.0% -4.7%5 Bahrain 80,748 5.9% -5.9%6 Bangkok 80,730 5.9% 24.5%7 Toronto 72,941 5.4% 18.8%8 Johannesburg 63,686 4.7% -2.3%9 Doha 57,206 4.2% 124.7%
10 Singapore 56,363 4.1% -5.3%Other 262,158 19.3% 32.0%
Total Non-European International Scheduled 1,359,346 100.0% 13.3%
Ranking of International Destinationsaccording to Passenger Traffic
Scheduled & Charter Market Share % 2006/ Ranking Country Passengers 2006 2006 2005
1 Germany 1,390,549 15.4% 0.3%2 Italy 1,196,914 13.2% 9.8%3 United Kingdom 1,020,037 11.3% 0.1%4 France 822,077 9.1% -1.8%5 Cyprus 771,626 8.5% -3.2%6 Spain 394,476 4.4% 24.1%7 Switzerland 380,369 4.2% 25.6%8 Netherlands 369,423 4.1% 13.6%9 USA 319,333 3.5% 20.8%
10 Belgium 274,102 3.0% -4.3%11 Turkey 235,938 2.6% -9.8%12 Egypt 188,613 2.1% -1.3%13 Austria 161,699 1.8% 8.5%14 United Arab Emirates 156,982 1.7% 50.6%15 Czech Republic 136,708 1.5% 19.5%16 Denmark 135,505 1.5% -9.4%17 Romania 132,082 1.5% 8.7%18 Israel 120,060 1.3% 4.5%19 Canada 117,611 1.3% -4.2%20 Russian Federation 107,355 1.2% 19.5%21 Hungary 99,217 1.1% 7.2%22 Bulgaria 99,117 1.1% 11.9%23 Bahrain 80,881 0.9% -5.7%24 Thailand 80,730 0.9% 24.5%25 Poland 69,214 0.8% -3.3%26 S Africa 63,686 0.7% -2.3%27 Albania 59,127 0.7% -3.2%28 Qatar 57,206 0.6% 124.7%29 Singapore 56,363 0.6% -5.3%30 Ukraine 54,104 0.6% 10.1%31 Sweden 50,695 0.6% 23.9%32 Serbia 48,431 0.5% 17.6%33 Lebanon 43,699 0.5% -24.8%34 Norway 38,932 0.4% 117.9%35 Finland 26,128 0.3% 90.5%36 Tunisia 21,690 0.2% 19.3%37 Jordan 19,824 0.2% 9.3%38 Syria 19,283 0.2% 8.5%39 Malta 16,320 0.2% -5.7%40 Moldova 14,964 0.2% 16.5%41 Kuwait 14,248 0.2% 0.8%42 Uzbekistan 12,862 0.1% -19.0%43 Georgia 9,166 0.1% 0.3%44 Slovakia 8,484 0.1% 3.6%45 Armenia 8,340 0.1% 3.8%46 Republic of Ireland 7,982 0.1% 23.8%47 Pakistan 6,368 0.1% NEW48 Portugal 4,818 0.1% 4.2%49 Estonia 2,709 0.0% -15.6%50 Croatia 833 0.0% 4.8%51 Slovenia 700 0.0% 11.1%52 Oman 562 0.0%53 Iraq 255 0.0% 2.4%54 Bosnia and Herzegovina 185 0.0% 189.1%55 Afghanistan 133 0.0%56 Saudi Arabia 108 0.0% -92.0%57 Japan 96 0.0%58 Lithuania 80 0.0% -68.3%59 FYROM 11 0.0%
Grand Total 9,529,010 100.0% 5.3%
11
aerostat 2006_geo.qxd 5/2/07 6:56 PM Page 11
Ranking of Domestic Destinationsaccording to Passenger Traffic
Scheduled & Charter Market Share Ranking City Passengers 2006 2006 % 2006/2005
1 Thessaloniki 1,046,440 19.3% 0.4%2 Heraklion 835,575 15.4% 9.4%3 Rhodes 588,598 10.8% 6.8%4 Chania 409,038 7.5% 8.5%5 Thira/Santorini 297,139 5.5% 17.6%6 Mitilini 274,664 5.1% 1.6%7 Alexandroupolis 270,216 5.0% 8.4%8 Kerkyra/Corfu 247,828 4.6% 0.1%9 Kos 238,832 4.4% -3.0%
10 Mikonos 190,039 3.5% 11.9%11 Chios 181,134 3.3% -3.5%12 Samos 167,596 3.1% 21.8%13 Kavala 132,577 2.4% -3.8%14 Ioannina 124,490 2.3% 3.8%15 Limnos 81,656 1.5% 5.4%16 Kefallonia 43,595 0.8% 2.2%17 Paros 37,949 0.7% 11.9%18 Milos 33,382 0.6% 74.2%19 Zakinthos 25,773 0.5% -3.3%20 Karpathos 25,089 0.5% 22.1%21 Naxos 24,679 0.5% 2.7%22 Kithira 24,662 0.5% 9.0%23 Ikaria 24,463 0.5% 21.9%24 Leros 21,826 0.4% 12.2%25 Aktio/Preveza 16,076 0.3% -7.5%26 Skiathos 15,936 0.3% 5.0%27 Syros 11,082 0.2% 4.4%28 Astypalea 9,746 0.2% -7.4%29 Kalimnos 8,967 0.2% NEW30 Kozani 6,151 0.1% -14.0%31 Sitia 5,659 0.1% 19.8%32 Skiros 3,998 0.1% 0.3%33 Kastoria 2,495 0.0% 7.8%34 Aghialos 205 0.0%35 Kasos 194 0.0% 361.9%
Grand Total 5,427,959 100.0% 5.8%
Airline Awards 2006Category Winner
Best Performing New Entrant Qatar AirwaysBest of the Top 10 Airlines easyJetFastest Growing Airline -Thin Route Air Moldova
Domestic Aegean AirlinesWestern Europe IberiaEastern Europe Aeroflot
Middle East EmiratesAmerica Delta AirLines
Asia Thai AirwaysOverall Aegean Airlines
12
Fastest GrowingAirline perGeographicalRegion
aerostat 2006_geo.qxd 5/2/07 6:56 PM Page 12
13
Peak and Average Daily Passenger Traffic
Ranking Day Date Terminal Passengers
1 Saturday 12/08/2006 60,677
2 Saturday 29/07/2006 60,304
3 Saturday 19/08/2006 60,273
4 Monday 21/08/2006 60,156
10 Busiest Days 5 Monday 24/07/2006 60,001
6 Saturday 02/09/2006 59,809
7 Friday 01/09/2006 59,530
8 Monday 31/07/2006 59,301
9 Saturday 05/08/2006 58,780
10 Monday 10/07/2006 58,759
30th Busiest Day 30 Sunday 16/07/2006 55,828
Average Day Monday 23/10/2006 41,046
Average Day = Day with passenger traffic closest to average (14,984,044/365=41,052)
Daily Passenger Peaks
Busiest Days Day Date Terminal Passengers
Arrivals Sunday 20/08/2006 12,332
Domestic Departures Friday 28/07/2006 11,301
Total Friday 01/09/2006 21,114
Arrivals Saturday 15/07/2006 20,853
International Departures Saturday 23/12/2006 24,931
Total Saturday 29/07/2006 41,407
aerostat 2006_geo.qxd 5/2/07 6:56 PM Page 13
aircraft movements
aerostat 2006_geo.qxd 5/2/07 6:56 PM Page 14
15
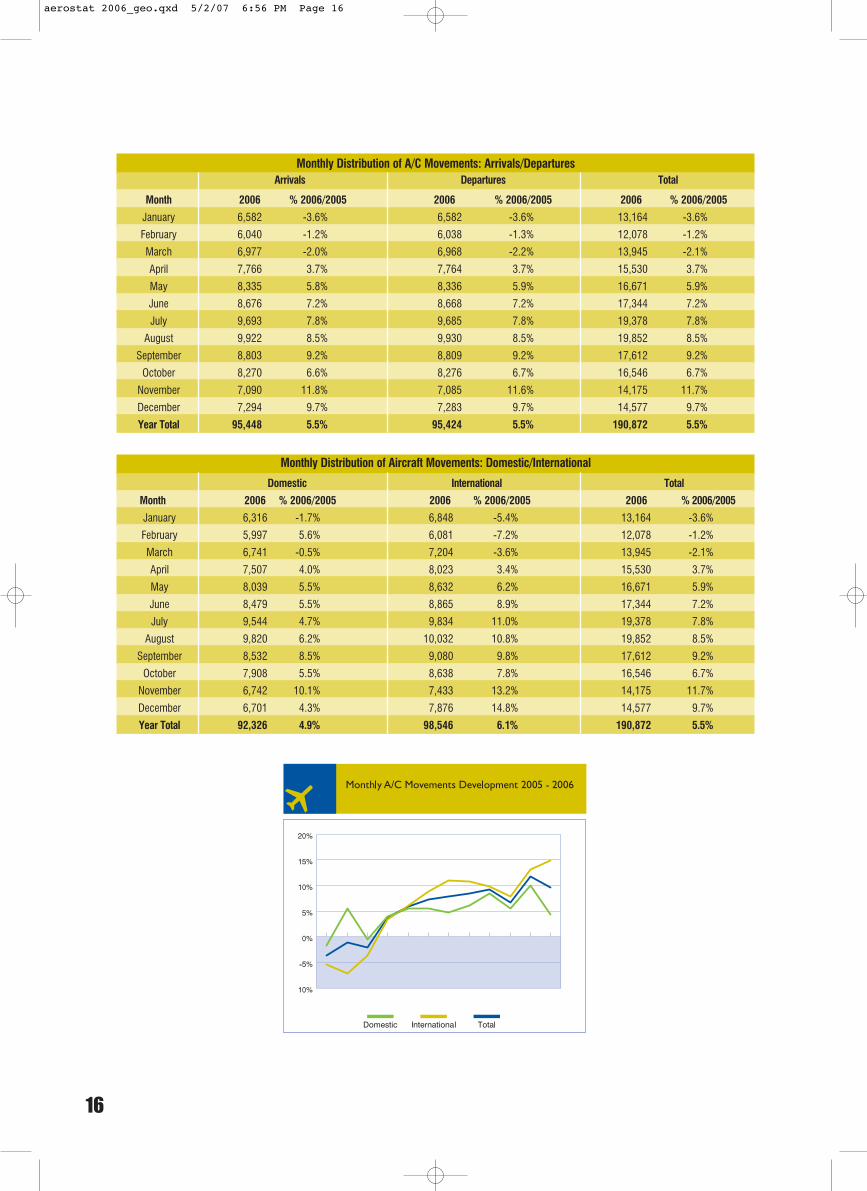
During 2006, the number of aircraft movements atAthens International Airport amounted to 190,872,raised by 5.5% over 2005, almost reaching the “OlympicYear” record. Domestic operations grew by 4.9%,presenting a considerable increase from April onwards,with November presenting the highest growth at 10%.International operations were enhanced by 6.1%, havingpresented double-digit growth during the peak summermonths of July and August, but also during the last twomonths of the year, with December presenting thelargest increase of 15%.
International scheduled passenger movements enjoyeda robust 6% growth, with Germany, Italy, Cyprus, UKand France consistently being the top 5 markets in thesector. Cyprus was the only major market toexperience a decline in the course of 2006, due to thereduced number of services by all carriers operating inthe particular market. Flights to/from Switzerlandincreased by almost 20%, bringing the country up into6th place, while Spain, with a remarkable growth of27%, entered the top 10, ranking 8th.The number ofinternational charter passenger flights decreasedconsiderably by 11%, mainly due to the steep decline(-26%) in the services for France, which leads theinternational charter market.
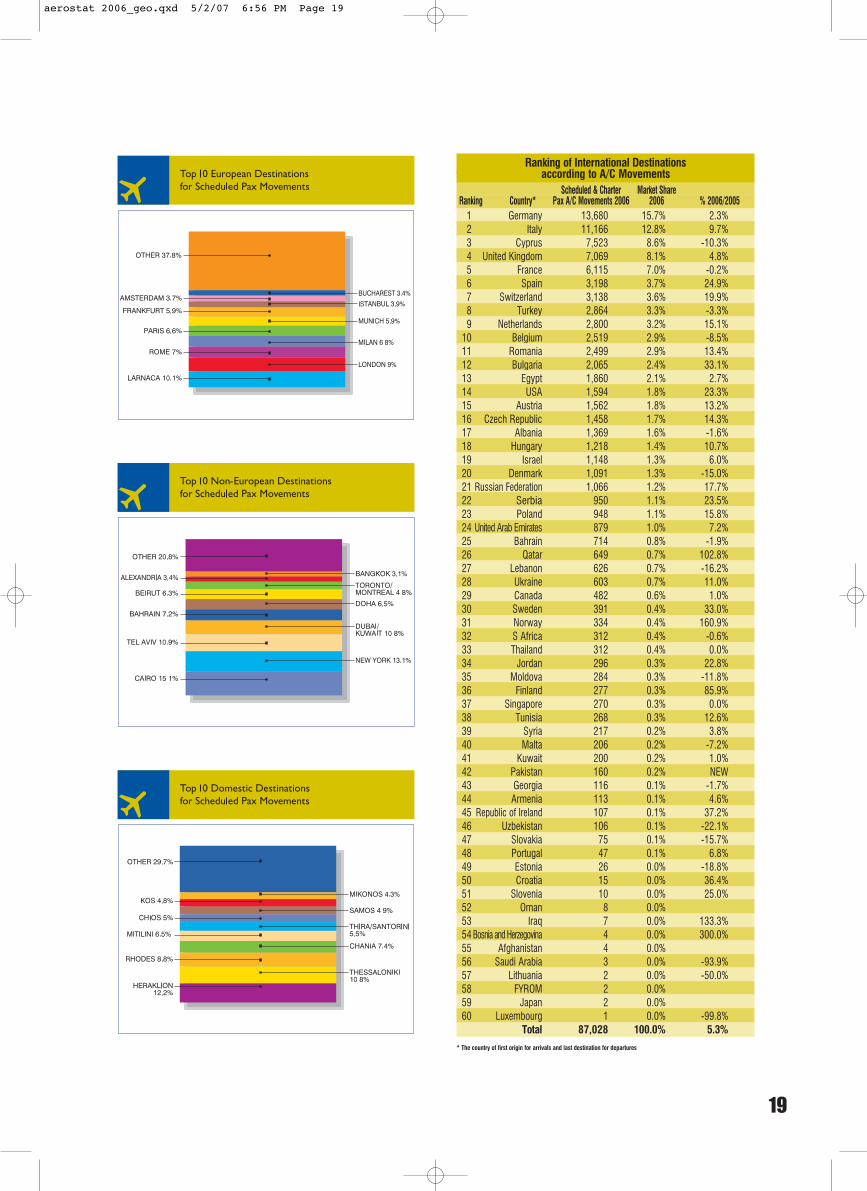
Focusing on the European destinations ranking forscheduled passenger movements, the higher positionsachieved by Milan and Munich (4th and 6th respectively),and the entrance of Bucharest in the top 10 areworth noting. Bahrain's and Doha's placement on the5th and 6th position respectively, as well asAlexandria's entry in the highest-frequency routecategory are the most important developments in thenon-European destinations ranking. Heraklion leadsthe domestic scheduled movements for the first time,trailed by Thessaloniki, while Samos has made the top10, moving up into 8th place.
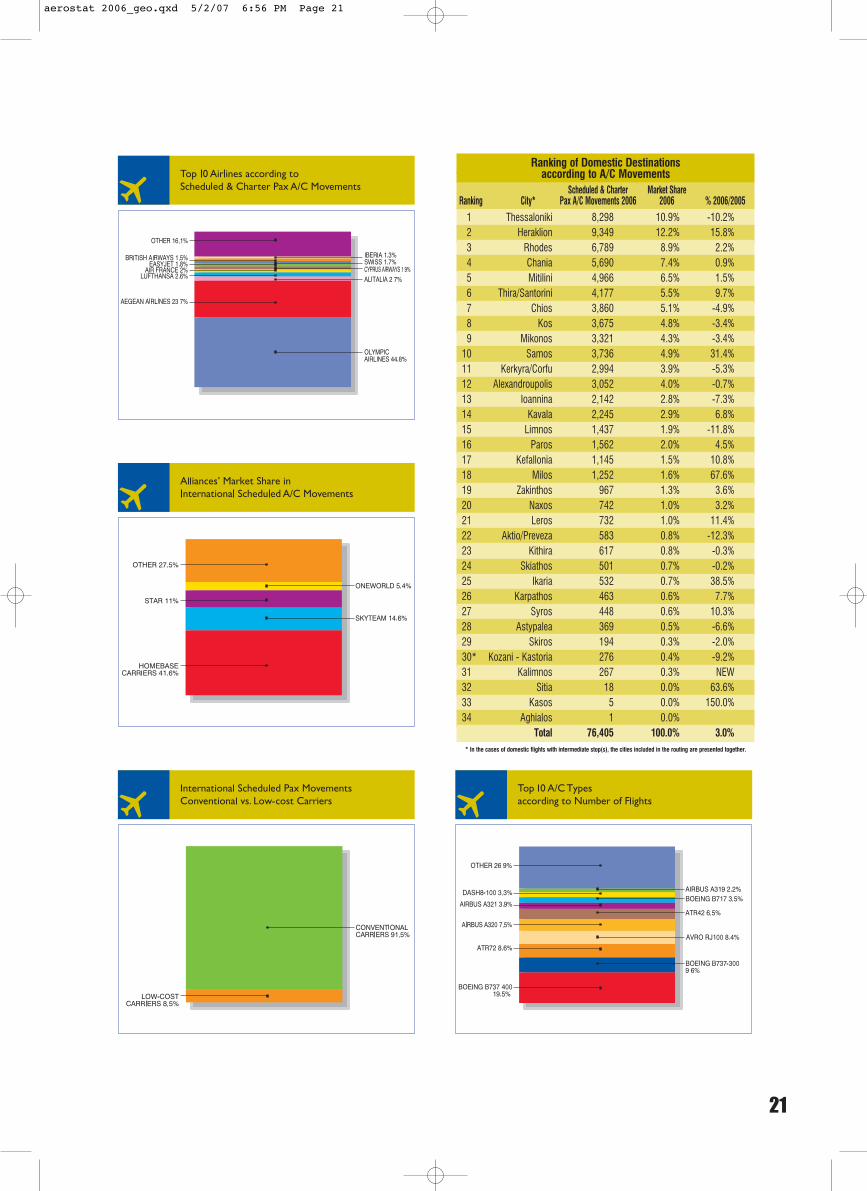
Home base carriers, Olympic Airlines and AegeanAirlines, account for 68.5% of passenger movements atAthens International Airport, holding the top 2positions in the respective airline ranking. MajorEuropean carriers make a dynamic appearance, withIberia entering the top 10, and Air France taking 5thplace over Cyprus Airways.
The number of scheduled flights operated by low-costcarriers presented an outstanding 32% increase in2006, amounting to 9% of the international scheduledmovements.All three alliances in the Athens aviationmarket (Skyteam, Star and Oneworld) intensified theiroperation in 2006, gaining market share in theinternational scheduled segment, against the non-alliedhome-base and foreign carriers.
Boeing 737-400 remains the most popular aircraft typefor airlines operating at Athens International Airport,representing 20% of the airport's total movements.Boeing 737-300 follows with 10%, with ATR 72 andAvro RJ100 trailing.
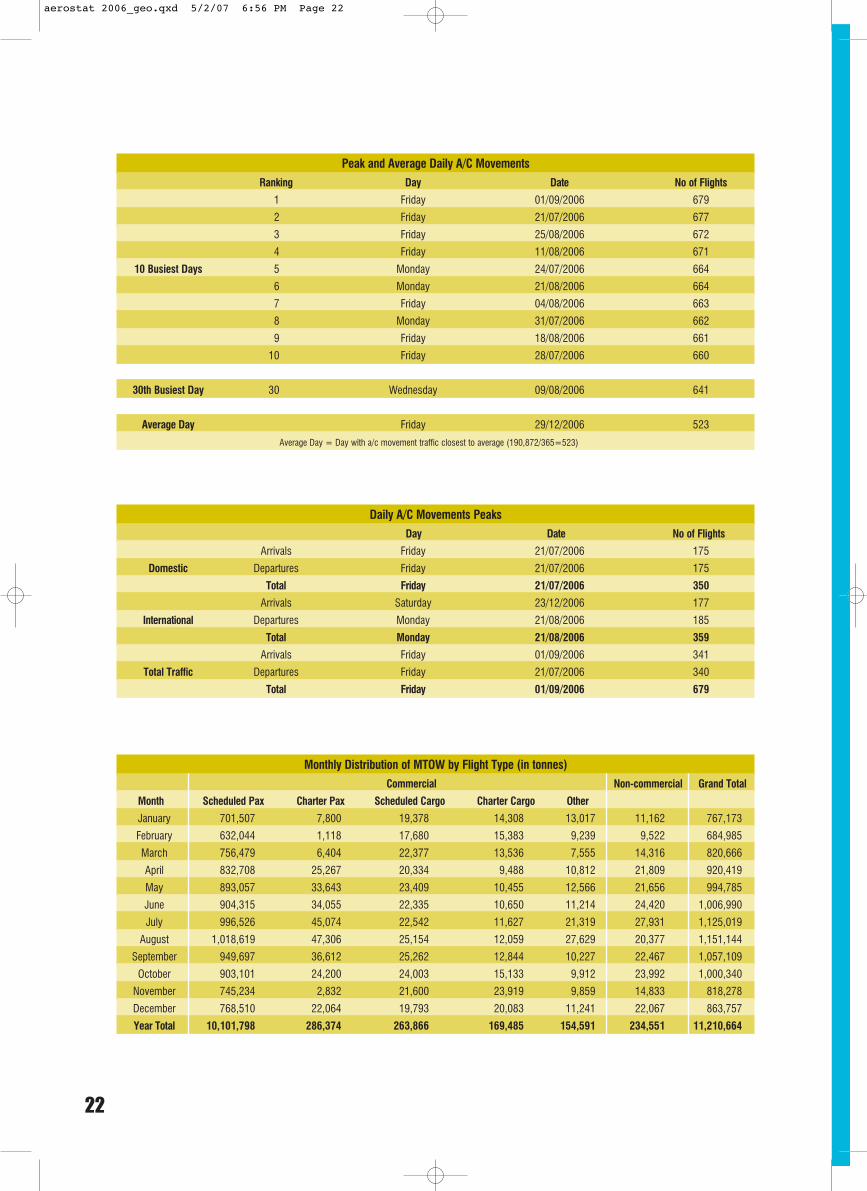
The busiest day of the year in terms of aircraftmovements was Friday, 1 September, with 679movements. Domestic flights peaked on Friday, 21 July,with 350 movements, while the day with the highestnumber of international flights was Monday, 21 August,with 359 movements.
aerostat 2006_geo.qxd 5/2/07 6:56 PM Page 15
16
Monthly Distribution of A/C Movements: Arrivals/DeparturesArrivals Departures Total
Month 2006 % 2006/2005 2006 % 2006/2005 2006 % 2006/2005
January 6,582 -3.6% 6,582 -3.6% 13,164 -3.6%
February 6,040 -1.2% 6,038 -1.3% 12,078 -1.2%
March 6,977 -2.0% 6,968 -2.2% 13,945 -2.1%
April 7,766 3.7% 7,764 3.7% 15,530 3.7%
May 8,335 5.8% 8,336 5.9% 16,671 5.9%
June 8,676 7.2% 8,668 7.2% 17,344 7.2%
July 9,693 7.8% 9,685 7.8% 19,378 7.8%
August 9,922 8.5% 9,930 8.5% 19,852 8.5%
September 8,803 9.2% 8,809 9.2% 17,612 9.2%
October 8,270 6.6% 8,276 6.7% 16,546 6.7%
November 7,090 11.8% 7,085 11.6% 14,175 11.7%
December 7,294 9.7% 7,283 9.7% 14,577 9.7%
Year Total 95,448 5.5% 95,424 5.5% 190,872 5.5%
Monthly Distribution of Aircraft Movements: Domestic/International
Domestic International Total
Month 2006 % 2006/2005 2006 % 2006/2005 2006 % 2006/2005
January 6,316 -1.7% 6,848 -5.4% 13,164 -3.6%
February 5,997 5.6% 6,081 -7.2% 12,078 -1.2%
March 6,741 -0.5% 7,204 -3.6% 13,945 -2.1%
April 7,507 4.0% 8,023 3.4% 15,530 3.7%
May 8,039 5.5% 8,632 6.2% 16,671 5.9%
June 8,479 5.5% 8,865 8.9% 17,344 7.2%
July 9,544 4.7% 9,834 11.0% 19,378 7.8%
August 9,820 6.2% 10,032 10.8% 19,852 8.5%
September 8,532 8.5% 9,080 9.8% 17,612 9.2%
October 7,908 5.5% 8,638 7.8% 16,546 6.7%
November 6,742 10.1% 7,433 13.2% 14,175 11.7%
December 6,701 4.3% 7,876 14.8% 14,577 9.7%
Year Total 92,326 4.9% 98,546 6.1% 190,872 5.5%
aerostat 2006_geo.qxd 5/2/07 6:56 PM Page 16
17
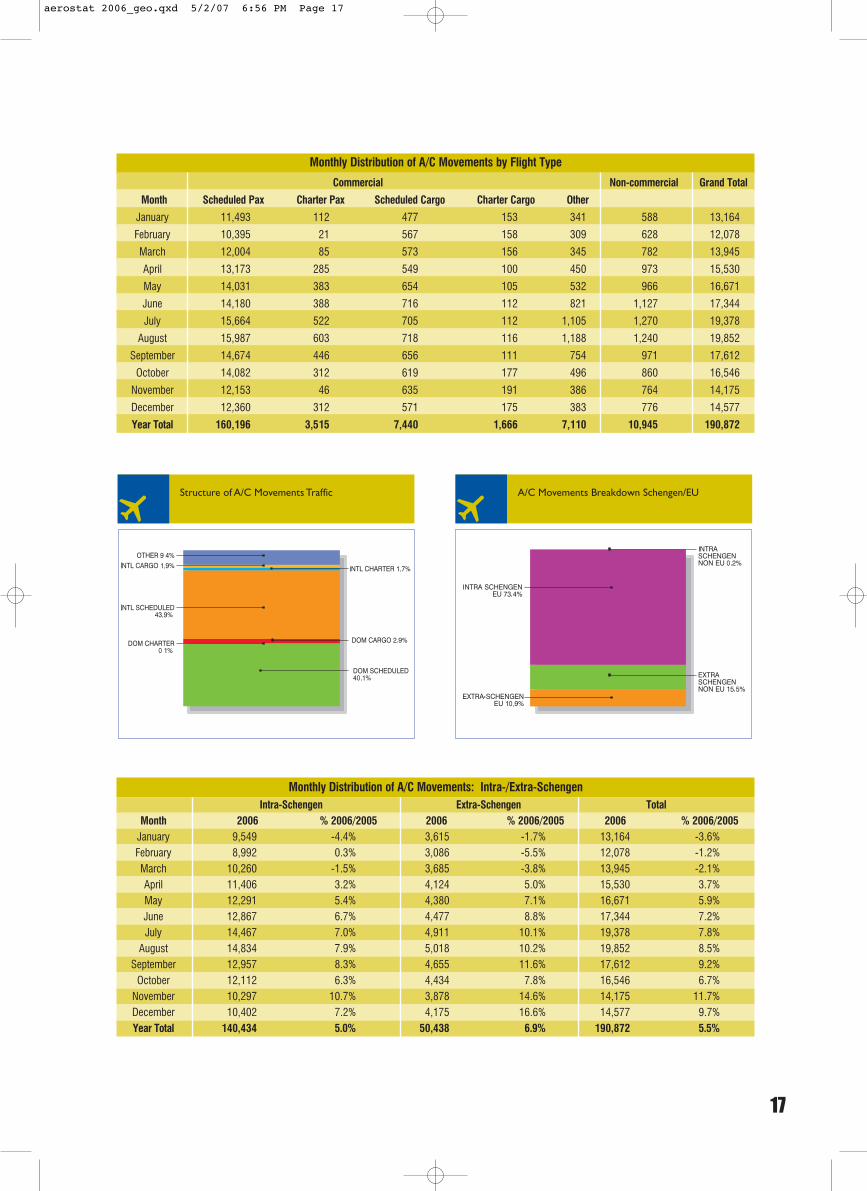
Monthly Distribution of A/C Movements by Flight Type
Commercial Non-commercial Grand Total
Month Scheduled Pax Charter Pax Scheduled Cargo Charter Cargo Other
January 11,493 112 477 153 341 588 13,164
February 10,395 21 567 158 309 628 12,078
March 12,004 85 573 156 345 782 13,945
April 13,173 285 549 100 450 973 15,530
May 14,031 383 654 105 532 966 16,671
June 14,180 388 716 112 821 1,127 17,344
July 15,664 522 705 112 1,105 1,270 19,378
August 15,987 603 718 116 1,188 1,240 19,852
September 14,674 446 656 111 754 971 17,612
October 14,082 312 619 177 496 860 16,546
November 12,153 46 635 191 386 764 14,175
December 12,360 312 571 175 383 776 14,577
Year Total 160,196 3,515 7,440 1,666 7,110 10,945 190,872
Monthly Distribution of A/C Movements: Intra-/Extra-SchengenIntra-Schengen Extra-Schengen Total
Month 2006 % 2006/2005 2006 % 2006/2005 2006 % 2006/2005January 9,549 -4.4% 3,615 -1.7% 13,164 -3.6%February 8,992 0.3% 3,086 -5.5% 12,078 -1.2%March 10,260 -1.5% 3,685 -3.8% 13,945 -2.1%April 11,406 3.2% 4,124 5.0% 15,530 3.7%May 12,291 5.4% 4,380 7.1% 16,671 5.9%June 12,867 6.7% 4,477 8.8% 17,344 7.2%July 14,467 7.0% 4,911 10.1% 19,378 7.8%
August 14,834 7.9% 5,018 10.2% 19,852 8.5%September 12,957 8.3% 4,655 11.6% 17,612 9.2%
October 12,112 6.3% 4,434 7.8% 16,546 6.7%November 10,297 10.7% 3,878 14.6% 14,175 11.7%December 10,402 7.2% 4,175 16.6% 14,577 9.7%Year Total 140,434 5.0% 50,438 6.9% 190,872 5.5%
aerostat 2006_geo.qxd 5/2/07 6:56 PM Page 17

Top 10 International Markets/Countriesfor Scheduled Pax Movements
A/C Movements Market Share Ranking Country 2006 2006 % 2006/2005
1 Germany 13,642 16.3% 2.5%2 Italy 10,962 13.1% 9.4%3 Cyprus 7,482 8.9% -10.5%4 United Kingdom 6,972 8.3% 4.3%5 France 4,873 5.8% 9.7%6 Switzerland 3,115 3.7% 19.7%7 Turkey 2,840 3.4% 1.0%8 Spain 2,764 3.3% 26.7%9 Netherlands 2,702 3.2% 15.6%
10 Romania 2,493 3.0% 13.5%Other 25,910 30.9% 7.7%Total 83,755 100.0% 6.0%
Top 10 International Markets/Countriesfor Charter Pax Movements
A/C Movements Market Share Ranking Country 2006 2006 % 2006/2005
1 France 1,242 37.9% -26.2%2 Spain 434 13.3% 14.8%3 Italy 204 6.2% 32.5%4 Czech Republic 190 5.8% 15.2%5 Sweden 163 5.0% 23.5%6 Austria 136 4.2% 51.1%7 Netherlands 98 3.0% 3.2%8 United Kingdom 97 3.0% 59.0%9 Belgium 85 2.6% -28.0%
10 Israel 61 1.9% 771.4%Other 563 17.2% -29.4%Total 3,273 100.0% -11.1%
18
aerostat 2006_geo.qxd 5/2/07 6:56 PM Page 18
19
Ranking of International Destinationsaccording to A/C Movements
Scheduled & Charter Market Share Ranking Country* Pax A/C Movements 2006 2006 % 2006/2005
1 Germany 13,680 15.7% 2.3%2 Italy 11,166 12.8% 9.7%3 Cyprus 7,523 8.6% -10.3%4 United Kingdom 7,069 8.1% 4.8%5 France 6,115 7.0% -0.2%6 Spain 3,198 3.7% 24.9%7 Switzerland 3,138 3.6% 19.9%8 Turkey 2,864 3.3% -3.3%9 Netherlands 2,800 3.2% 15.1%
10 Belgium 2,519 2.9% -8.5%11 Romania 2,499 2.9% 13.4%12 Bulgaria 2,065 2.4% 33.1%13 Egypt 1,860 2.1% 2.7%14 USA 1,594 1.8% 23.3%15 Austria 1,562 1.8% 13.2%16 Czech Republic 1,458 1.7% 14.3%17 Albania 1,369 1.6% -1.6%18 Hungary 1,218 1.4% 10.7%19 Israel 1,148 1.3% 6.0%20 Denmark 1,091 1.3% -15.0%21 Russian Federation 1,066 1.2% 17.7%22 Serbia 950 1.1% 23.5%23 Poland 948 1.1% 15.8%24 United Arab Emirates 879 1.0% 7.2%25 Bahrain 714 0.8% -1.9%26 Qatar 649 0.7% 102.8%27 Lebanon 626 0.7% -16.2%28 Ukraine 603 0.7% 11.0%29 Canada 482 0.6% 1.0%30 Sweden 391 0.4% 33.0%31 Norway 334 0.4% 160.9%32 S Africa 312 0.4% -0.6%33 Thailand 312 0.4% 0.0%34 Jordan 296 0.3% 22.8%35 Moldova 284 0.3% -11.8%36 Finland 277 0.3% 85.9%37 Singapore 270 0.3% 0.0%38 Tunisia 268 0.3% 12.6%39 Syria 217 0.2% 3.8%40 Malta 206 0.2% -7.2%41 Kuwait 200 0.2% 1.0%42 Pakistan 160 0.2% NEW43 Georgia 116 0.1% -1.7%44 Armenia 113 0.1% 4.6%45 Republic of Ireland 107 0.1% 37.2%46 Uzbekistan 106 0.1% -22.1%47 Slovakia 75 0.1% -15.7%48 Portugal 47 0.1% 6.8%49 Estonia 26 0.0% -18.8%50 Croatia 15 0.0% 36.4%51 Slovenia 10 0.0% 25.0%52 Oman 8 0.0%53 Iraq 7 0.0% 133.3%54 Bosnia and Herzegovina 4 0.0% 300.0%55 Afghanistan 4 0.0%56 Saudi Arabia 3 0.0% -93.9%57 Lithuania 2 0.0% -50.0%58 FYROM 2 0.0%59 Japan 2 0.0%60 Luxembourg 1 0.0% -99.8%
Total 87,028 100.0% 5.3%
* The country of first origin for arrivals and last destination for departures
aerostat 2006_geo.qxd 5/2/07 6:56 PM Page 19

Ranking of International Destinationsaccording to A/C Movements
Scheduled & Charter Market Share Ranking City* Pax A/C Movements 2006 2006 % 2006/2005
1* Larnaca - Paphos 7,523 8.6% -10.3%2 London 6,654 7.6% 6.2%3 Paris 5,372 6.2% 5.2%4 Rome 5,229 6.0% 2.5%5 Milan 5,093 5.9% 15.6%6 Munich 4,404 5.1% 16.0%7 Frankfurt 4,336 5.0% 0.6%8 Istanbul 2,855 3.3% -3.3%9 Amsterdam 2,798 3.2% 15.1%
10 Brussels 2,519 2.9% -8.5%11 Bucharest 2,498 2.9% 13.5%12 Madrid 2,315 2.7% -1.0%13 Sofia 2,065 2.4% 33.1%14 Zurich 1,994 2.3% 35.6%15 Dusseldorf 1,875 2.2% -8.0%16 Vienna 1,530 1.8% 12.4%17 Cairo 1,518 1.7% 1.3%18 Berlin 1,469 1.7% 0.5%19 Prague 1,438 1.7% 14.7%20 Tirana 1,369 1.6% -1.6%21 New York 1,305 1.5% 0.9%22 Budapest 1,218 1.4% 10.7%23 Stuttgart 1,162 1.3% -8.6%24 Tel Aviv 1,148 1.3% 6.0%25 Geneva 1,143 1.3% -0.2%26 Copenhagen 1,060 1.2% -17.4%27 Belgrade 950 1.1% 24.0%28 Moscow 894 1.0% 18.3%29* Dubai - Kuwait 11,075 1.2% 5.9%30 Barcelona (ES) 813 0.9% 389.8%31 Warsaw 774 0.9% 40.7%32 Bahrain 714 0.8% -1.9%33 Doha 649 0.7% 102.8%34 Beirut 626 0.7% -16.2%35 Venice 506 0.6% -12.2%36* Toronto - Montreal 482 0.6% 1.0%37* Kiev - Odessa 400 0.5% 5.8%38 Stockholm 365 0.4% 49.0%39 Alexandria (EG) 340 0.4% 10.7%40 Cologne 333 0.4% -11.4%41 Oslo 330 0.4% 184.5%42 Johannesburg 312 0.4% -0.6%43 Bangkok 312 0.4% 0.0%44 Manchester (GB) 302 0.3% -2.9%45 Amman 296 0.3% 22.8%46 Atlanta 288 0.3% NEW47 Chisinau 284 0.3% -11.8%48 Singapore 270 0.3% 0.0%49 Helsinki 263 0.3% 96.3%50 Tunis 232 0.3% 2.2%51* Damascus - Aleppo 217 0.2% 3.8%52* Bologna - Naples 213 0.2% 353.2%53 Malta 206 0.2% -7.2%54 Lyon 182 0.2% -18.8%55 Nantes 179 0.2% -27.2%56 Donetsk 154 0.2% 11.6%57 Krakow 120 0.1% NEW58 Toulouse 119 0.1% -27.9%59 Tbilisi 116 0.1% -1.7%60 Yerevan 113 0.1% 4.6%61 St Petersburg (RU) 109 0.1% 28.2%62 Marseille 108 0.1% -32.9%63 Dublin 107 0.1% 37.2%64 Tashkent 106 0.1% -22.1%65 Glasgow (GB) 98 0.1% -37.2%66 Nuremberg 98 0.1% 0.0%67* Karachi - Islamabad - Lahore 160 0.2% NEW68 Bratislava 75 0.1% -15.7%69* Turin - Naples 65 0.1% NEW70 Krasnodar 62 0.1% -3.1%
71 Bordeaux 57 0.1% 0.0%72 Katowice 54 0.1% -79.2%73 Lisbon 47 0.1% 6.8%74 Chernovtsy 43 0.0% NEW75 Mulhouse 37 0.0% -61.1%76 Salzburg 32 0.0% 77.8%77 Strasbourg 31 0.0% 3.3%78 Billund 30 0.0% NEW79 Gothenburg 26 0.0% -44.7%80 Tallinn 26 0.0% -18.8%81 Palma Mallorca 24 0.0% 20.0%82 Metz/Nancy 22 0.0% -18.5%83 Monastir 21 0.0% 600.0%84 Brno 20 0.0% -9.1%85 Bilbao 19 0.0%86 Catania 15 0.0% 400.0%87 Bari 14 0.0%88 Djerba 12 0.0% 50.0%89 Seville 11 0.0% -26.7%90 Rovaniemi 11 0.0% -8.3%91 LjubljanaB 10 0.0% 25.0%92 Palermo 8 0.0% -27.3%93 Muscat 8 0.0%94 Cagliari 7 0.0% -46.2%95 Erbil 7 0.0% 133.3%96 Zagreb 7 0.0% 133.3%97 Florence (IT) 7 0.0% 600.0%98 Birmingham (GB) 6 0.0% 20.0%99 Valencia (ES) 6 0.0% 200.0%
100 Dubrovnik 5 0.0% -16.7%101 Edinburgh 5 0.0% 150.0%102 Lille 5 0.0% 150.0%103 Malaga 5 0.0% 150.0%104 Simferopol 4 0.0% 33.3%105 Abu Dhabi 4 0.0% 100.0%106 Kayseri 4 0.0% 100.0%107 Sarajevo 4 0.0% 300.0%108 Kabul 4 0.0%109 Riyadh 3 0.0% -93.9%110 Kemi/Tornio 3 0.0% 50.0%111 Split 3 0.0% 50.0%112 Verona 3 0.0% 50.0%113 Izmir 3 0.0% 200.0%114 Tozeur 3 0.0%115 Newcastle (GB) 2 0.0% -71.4%116 Trieste 2 0.0% -66.7%117 Limoges 2 0.0% -60.0%118 Vitoria (ES) 2 0.0% -50.0%119 Kaunas 2 0.0% 0.0%120 Rotterdam 2 0.0% 0.0%121 Antalya 2 0.0% 100.0%122 Genoa 2 0.0% 100.0%123 Dresden 2 0.0%124 Skopje 2 0.0%125 Tokyo 2 0.0%126 Treviso 2 0.0%127 Zaporozhye 2 0.0%128 Luxembourg 1 0.0% -99.8%129 Sharm el Sheikh 1 0.0% -75.0%130 Hanover 1 0.0% -50.0%131 Timisoara 1 0.0% -50.0%132 Basel 1 0.0% 0.0%133 Ekaterinburg 1 0.0% 0.0%134 Aalborg 1 0.0%135 Bristol 1 0.0%136 East Midlands 1 0.0%137 Hurghada 1 0.0%138 Kristiansand 1 0.0%139 Menorca 1 0.0%140 Newark 1 0.0%141 Nice 1 0.0%142 Stavanger 1 0.0%
Total 87,028 100.0% 5.3%
* In the cases of international flights with intermediate stop(s), the cities included in the routing are presented together.
20
aerostat 2006_geo.qxd 5/2/07 6:56 PM Page 20
Ranking of Domestic Destinationsaccording to A/C Movements
Scheduled & Charter Market Share Ranking City* Pax A/C Movements 2006 2006 % 2006/2005
1 Thessaloniki 8,298 10.9% -10.2%2 Heraklion 9,349 12.2% 15.8%3 Rhodes 6,789 8.9% 2.2%4 Chania 5,690 7.4% 0.9%5 Mitilini 4,966 6.5% 1.5%6 Thira/Santorini 4,177 5.5% 9.7%7 Chios 3,860 5.1% -4.9%8 Kos 3,675 4.8% -3.4%9 Mikonos 3,321 4.3% -3.4%
10 Samos 3,736 4.9% 31.4%11 Kerkyra/Corfu 2,994 3.9% -5.3%12 Alexandroupolis 3,052 4.0% -0.7%13 Ioannina 2,142 2.8% -7.3%14 Kavala 2,245 2.9% 6.8%15 Limnos 1,437 1.9% -11.8%16 Paros 1,562 2.0% 4.5%17 Kefallonia 1,145 1.5% 10.8%18 Milos 1,252 1.6% 67.6%19 Zakinthos 967 1.3% 3.6%20 Naxos 742 1.0% 3.2%21 Leros 732 1.0% 11.4%22 Aktio/Preveza 583 0.8% -12.3%23 Kithira 617 0.8% -0.3%24 Skiathos 501 0.7% -0.2%25 Ikaria 532 0.7% 38.5%26 Karpathos 463 0.6% 7.7%27 Syros 448 0.6% 10.3%28 Astypalea 369 0.5% -6.6%29 Skiros 194 0.3% -2.0%30* Kozani - Kastoria 276 0.4% -9.2%31 Kalimnos 267 0.3% NEW32 Sitia 18 0.0% 63.6%33 Kasos 5 0.0% 150.0%34 Aghialos 1 0.0%
Total 76,405 100.0% 3.0%* In the cases of domestic flights with intermediate stop(s), the cities included in the routing are presented together.
21
aerostat 2006_geo.qxd 5/2/07 6:56 PM Page 21
22
Peak and Average Daily A/C Movements
Ranking Day Date No of Flights
1 Friday 01/09/2006 679
2 Friday 21/07/2006 677
3 Friday 25/08/2006 672
4 Friday 11/08/2006 671
10 Busiest Days 5 Monday 24/07/2006 664
6 Monday 21/08/2006 664
7 Friday 04/08/2006 663
8 Monday 31/07/2006 662
9 Friday 18/08/2006 661
10 Friday 28/07/2006 660
30th Busiest Day 30 Wednesday 09/08/2006 641
Average Day Friday 29/12/2006 523
Average Day = Day with a/c movement traffic closest to average (190,872/365=523)
Daily A/C Movements Peaks
Day Date No of Flights
Arrivals Friday 21/07/2006 175
Domestic Departures Friday 21/07/2006 175
Total Friday 21/07/2006 350
Arrivals Saturday 23/12/2006 177
International Departures Monday 21/08/2006 185
Total Monday 21/08/2006 359
Arrivals Friday 01/09/2006 341
Total Traffic Departures Friday 21/07/2006 340
Total Friday 01/09/2006 679
Monthly Distribution of MTOW by Flight Type (in tonnes)
Commercial Non-commercial Grand Total
Month Scheduled Pax Charter Pax Scheduled Cargo Charter Cargo Other
January 701,507 7,800 19,378 14,308 13,017 11,162 767,173
February 632,044 1,118 17,680 15,383 9,239 9,522 684,985
March 756,479 6,404 22,377 13,536 7,555 14,316 820,666
April 832,708 25,267 20,334 9,488 10,812 21,809 920,419
May 893,057 33,643 23,409 10,455 12,566 21,656 994,785
June 904,315 34,055 22,335 10,650 11,214 24,420 1,006,990
July 996,526 45,074 22,542 11,627 21,319 27,931 1,125,019
August 1,018,619 47,306 25,154 12,059 27,629 20,377 1,151,144
September 949,697 36,612 25,262 12,844 10,227 22,467 1,057,109
October 903,101 24,200 24,003 15,133 9,912 23,992 1,000,340
November 745,234 2,832 21,600 23,919 9,859 14,833 818,278
December 768,510 22,064 19,793 20,083 11,241 22,067 863,757
Year Total 10,101,798 286,374 263,866 169,485 154,591 234,551 11,210,664
aerostat 2006_geo.qxd 5/2/07 6:56 PM Page 22
23
aerostat 2006_geo.qxd 5/2/07 6:56 PM Page 23

cargo uplift
aerostat 2006_geo.qxd 5/2/07 6:56 PM Page 24

25
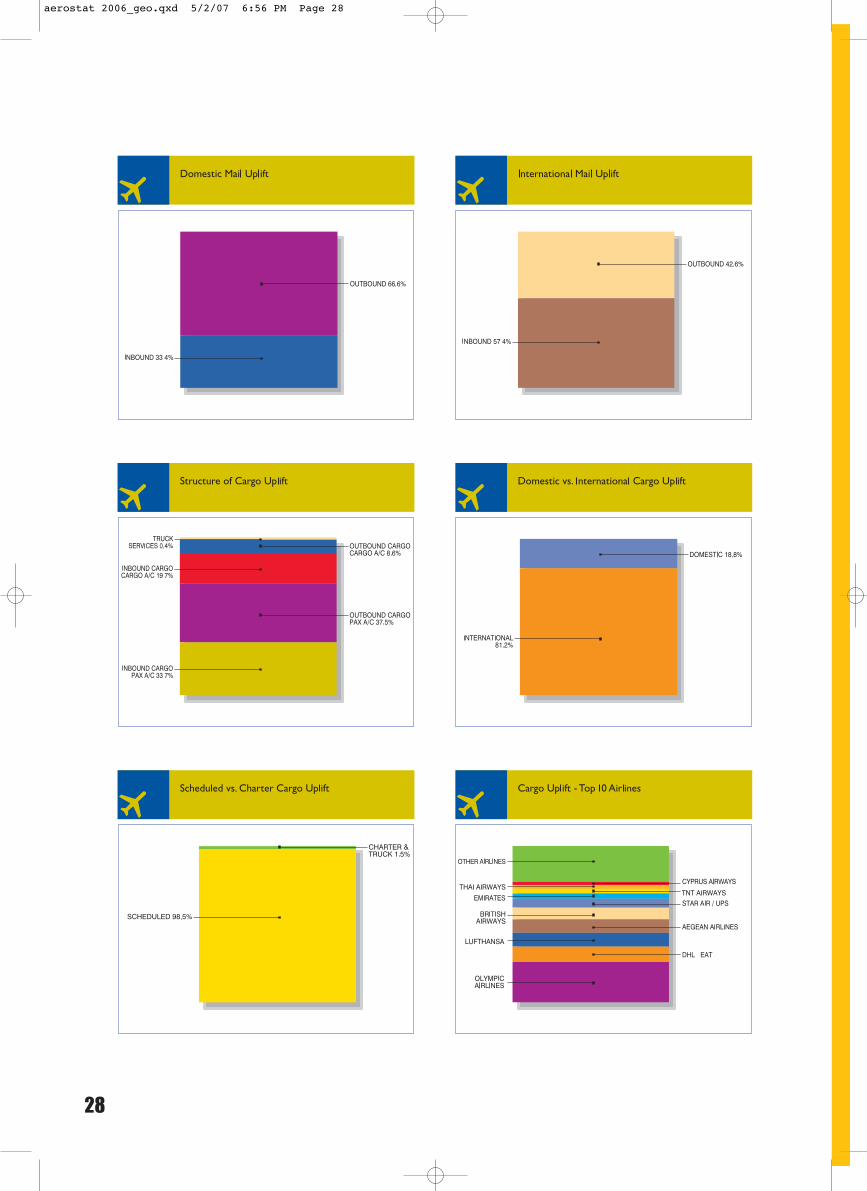
The total cargo volume handled through the airportduring 2006 reached 120,175 tonnes (+3.6% comparedto 2005), the highest uplift recorded since theairport's opening.The rise in cargo volumes is mainlyattributed to the robust development of theinternational sector.
In 2006, the total uplift of freight (90% of the market)increased by 3.4%, while the total uplift of mail (10% ofthe market) increased by 6.4%. In addition, total cargocarried on freighter aircraft grew by 7.5%, representinga 28% portion of the market.
Total domestic mail and freight traffic (representing19.5% of the market) amounted to 22,587 tonnes,remaining at previous year level. More specifically:
• Domestic freight volume experienced a 0.6%decrease, continuing its downward trend due to thecompetition faced by the high-speed ferries, offeringsimilar transit times at more competitive prices.
• Domestic mail volume sustained its positivedevelopment, with a 4.2% growth rate, once againposting a traffic record.
• Domestic cargo movements increased byapproximately 38% as a result of the diferrent aircrafttypes employed in 2006 (with lower uplift capacity),and the increased volumes transported by freighteraircraft. Specifically, the freighter aircraft upliftpresented a 32.7% increase compared to 2005, gainingmarket share over the passenger aircraft uplift.
• Three of the five airlines sharing the domestic traffic,namely Aeroland, Swiftair Hellas (former MediterraneanAir Freight) and Veravia, exclusively operated cargoflights. Olympic Airlines and Aegean Airlines remainedthe leaders of the particular market, operatingpassenger aircraft only.
Total international mail and freight traffic (representing80.5% of the market) amounted to 97,587 tonnes(+4.5% compared to 2005), achieving the highestvolumes since the airport's opening. In particular:
• International freight volume increased by 4.3% withinternational outbound freight presenting robustgrowth of 8% compared to 2005.Among the mainreasons for this development are the increasedexports to Cyprus and New York, as well as newtraffic destined to the Far East and the Pacific. Inaddition, due to the strike-driven slowdown of seatraffic at Piraeus Port during the last months of 2006,several express shipments were shifted to the airport.
• International mail volume maintained its upwardcourse enjoying a considerable rise of 7% andreaching a new record volume.
• International total cargo movements presented a slightincrease of 0.8% compared to 2005. However, thescheduled cargo movements posted a significantgrowth rate of 22.5%, which together with the 5%increase in the volumes carried by freighter aircraftindicate a healthy development in this market segment.
• Focusing on the international freight market, the fourintegrators (DHL-European Air Transport, FedExExpress,TNT and UPS) held a 26.6% market share,posting a marginal decrease compared to 2005, due tothe more rapid growth of the other cargo aircraft traffic.
• Ten airlines carried almost 76% of the totalinternational traffic, with OA in the lead over DHL -European Air Transport, Lufthansa, British Airways,UPS, Emirates,TNT,Thai Airways, Cyprus Airways,and Aegean Airlines. DHL-European Air Transport,UPS and TNT only operated cargo flights, whileLufthansa and British Airways included bothpassenger and cargo flights in their schedules.
aerostat 2006_geo.qxd 5/2/07 6:56 PM Page 25
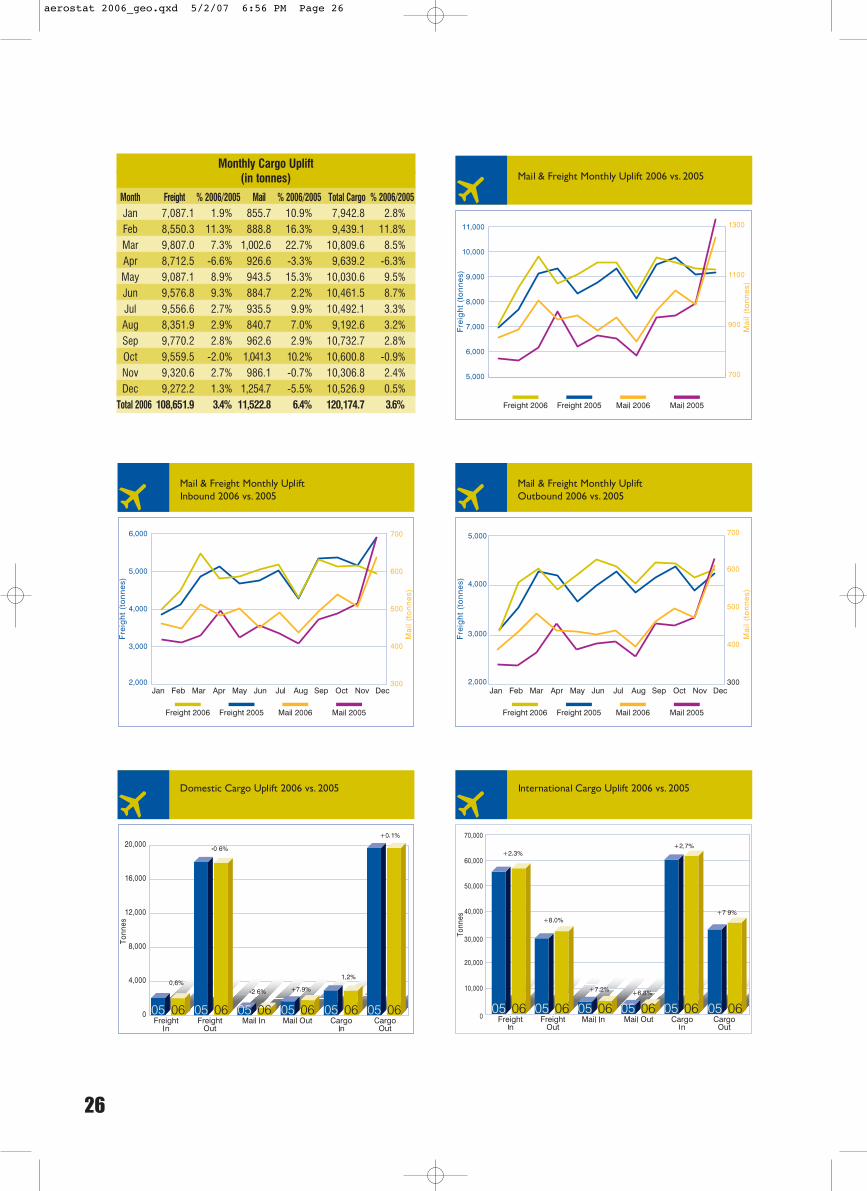
Monthly Cargo Uplift(in tonnes)
Month Freight % 2006/2005 Mail % 2006/2005 Total Cargo % 2006/2005Jan 7,087.1 1.9% 855.7 10.9% 7,942.8 2.8%Feb 8,550.3 11.3% 888.8 16.3% 9,439.1 11.8%Mar 9,807.0 7.3% 1,002.6 22.7% 10,809.6 8.5%Apr 8,712.5 -6.6% 926.6 -3.3% 9,639.2 -6.3%May 9,087.1 8.9% 943.5 15.3% 10,030.6 9.5%Jun 9,576.8 9.3% 884.7 2.2% 10,461.5 8.7%Jul 9,556.6 2.7% 935.5 9.9% 10,492.1 3.3%Aug 8,351.9 2.9% 840.7 7.0% 9,192.6 3.2%Sep 9,770.2 2.8% 962.6 2.9% 10,732.7 2.8%Oct 9,559.5 -2.0% 1,041.3 10.2% 10,600.8 -0.9%Nov 9,320.6 2.7% 986.1 -0.7% 10,306.8 2.4%Dec 9,272.2 1.3% 1,254.7 -5.5% 10,526.9 0.5%
Total 2006 108,651.9 3.4% 11,522.8 6.4% 120,174.7 3.6%
26
aerostat 2006_geo.qxd 5/2/07 6:56 PM Page 26
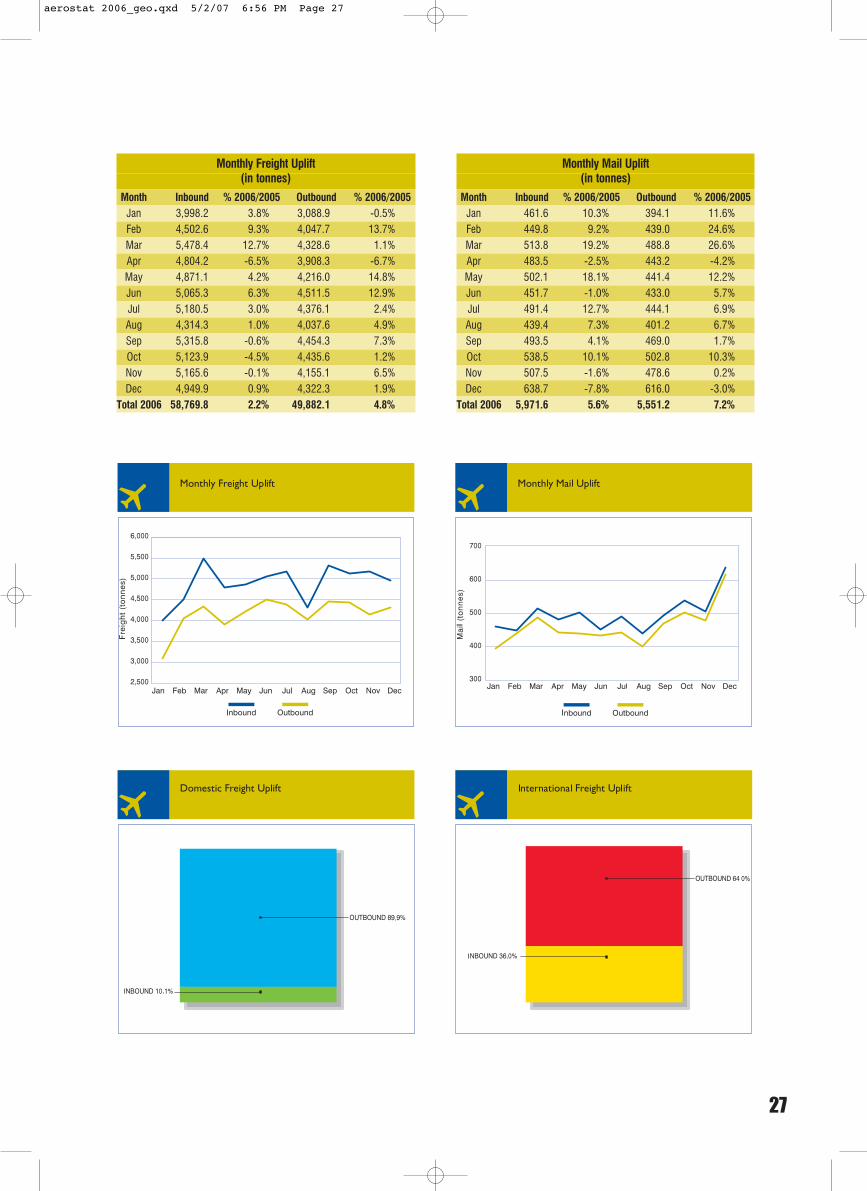
Monthly Freight Uplift(in tonnes)
Month Inbound % 2006/2005 Outbound % 2006/2005Jan 3,998.2 3.8% 3,088.9 -0.5%Feb 4,502.6 9.3% 4,047.7 13.7%Mar 5,478.4 12.7% 4,328.6 1.1%Apr 4,804.2 -6.5% 3,908.3 -6.7%May 4,871.1 4.2% 4,216.0 14.8%Jun 5,065.3 6.3% 4,511.5 12.9%Jul 5,180.5 3.0% 4,376.1 2.4%Aug 4,314.3 1.0% 4,037.6 4.9%Sep 5,315.8 -0.6% 4,454.3 7.3%Oct 5,123.9 -4.5% 4,435.6 1.2%Nov 5,165.6 -0.1% 4,155.1 6.5%Dec 4,949.9 0.9% 4,322.3 1.9%
Total 2006 58,769.8 2.2% 49,882.1 4.8%
Monthly Mail Uplift(in tonnes)
Month Inbound % 2006/2005 Outbound % 2006/2005Jan 461.6 10.3% 394.1 11.6%Feb 449.8 9.2% 439.0 24.6%Mar 513.8 19.2% 488.8 26.6%Apr 483.5 -2.5% 443.2 -4.2%May 502.1 18.1% 441.4 12.2%Jun 451.7 -1.0% 433.0 5.7%Jul 491.4 12.7% 444.1 6.9%Aug 439.4 7.3% 401.2 6.7%Sep 493.5 4.1% 469.0 1.7%Oct 538.5 10.1% 502.8 10.3%Nov 507.5 -1.6% 478.6 0.2%Dec 638.7 -7.8% 616.0 -3.0%
Total 2006 5,971.6 5.6% 5,551.2 7.2%
27
aerostat 2006_geo.qxd 5/2/07 6:56 PM Page 27
28
aerostat 2006_geo.qxd 5/2/07 6:56 PM Page 28

29
aerostat 2006_geo.qxd 5/2/07 6:56 PM Page 29

network
aerostat 2006_geo.qxd 5/2/07 6:56 PM Page 30
31
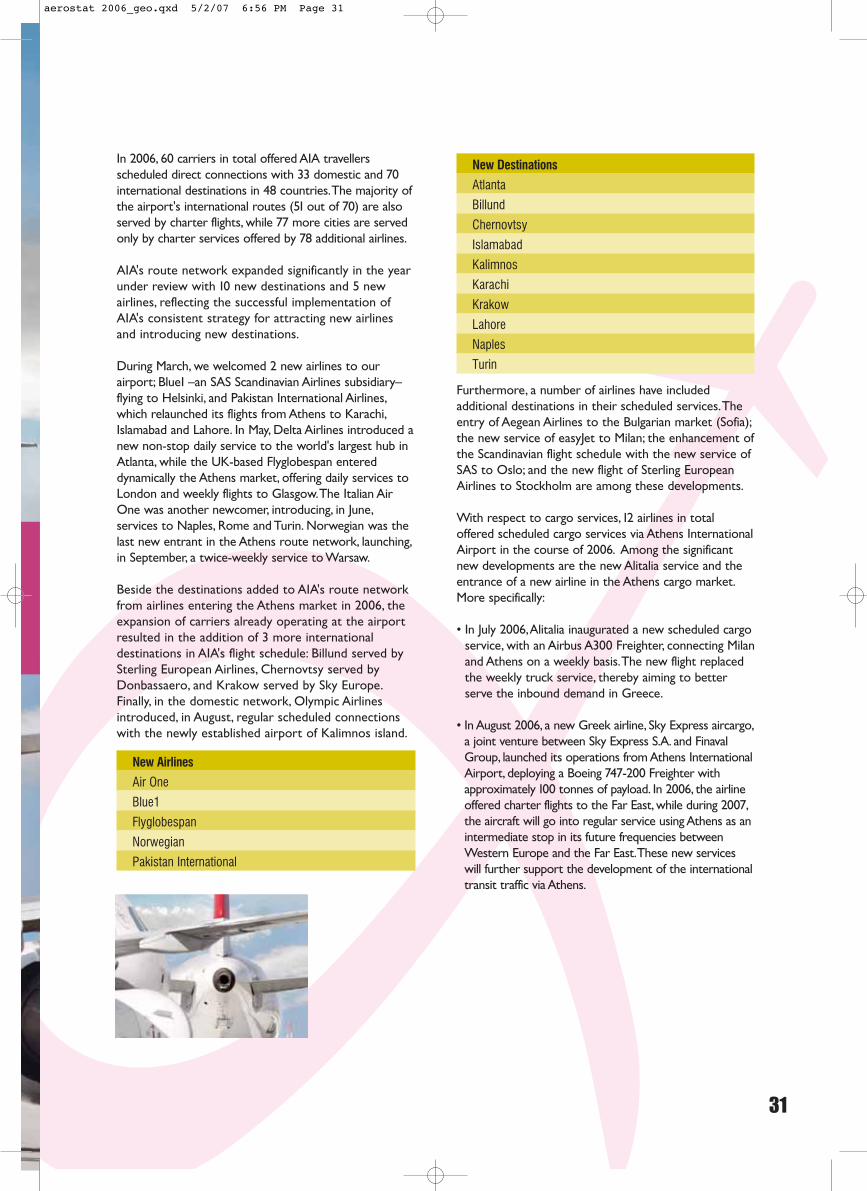
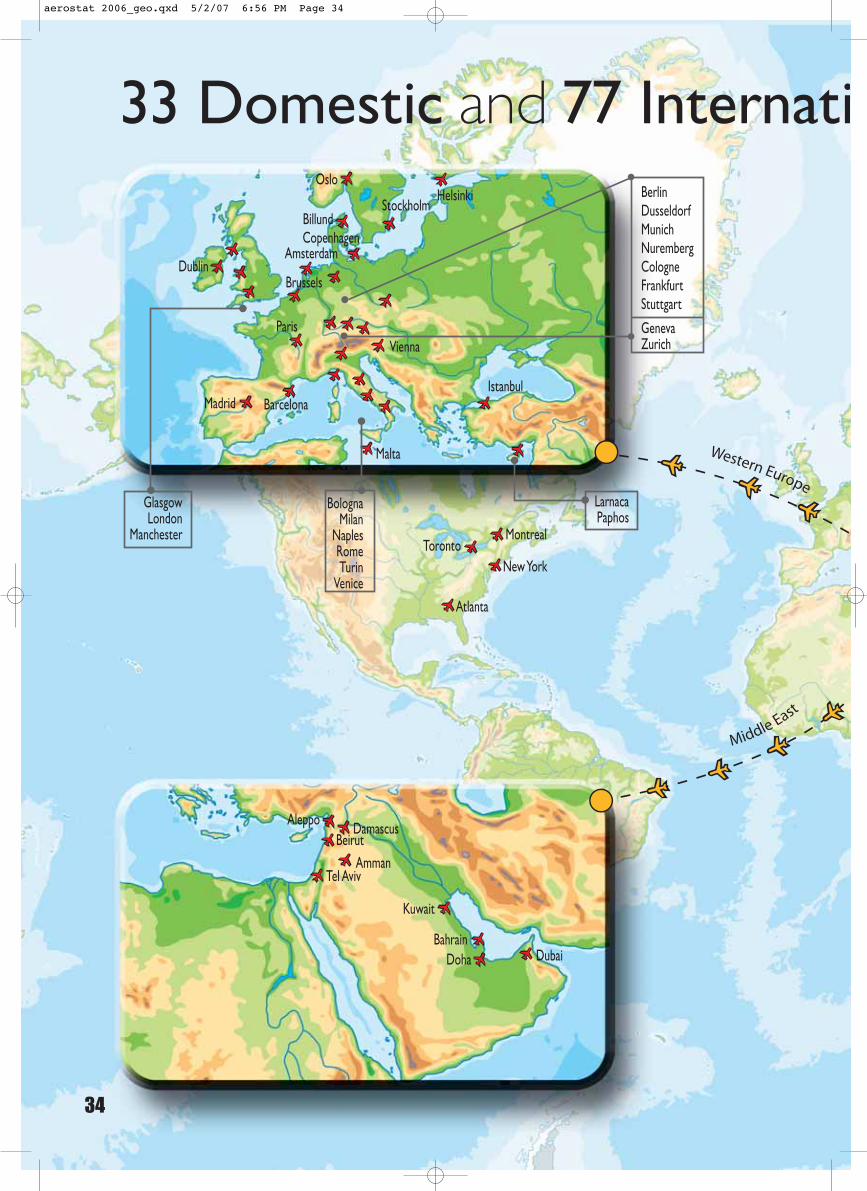
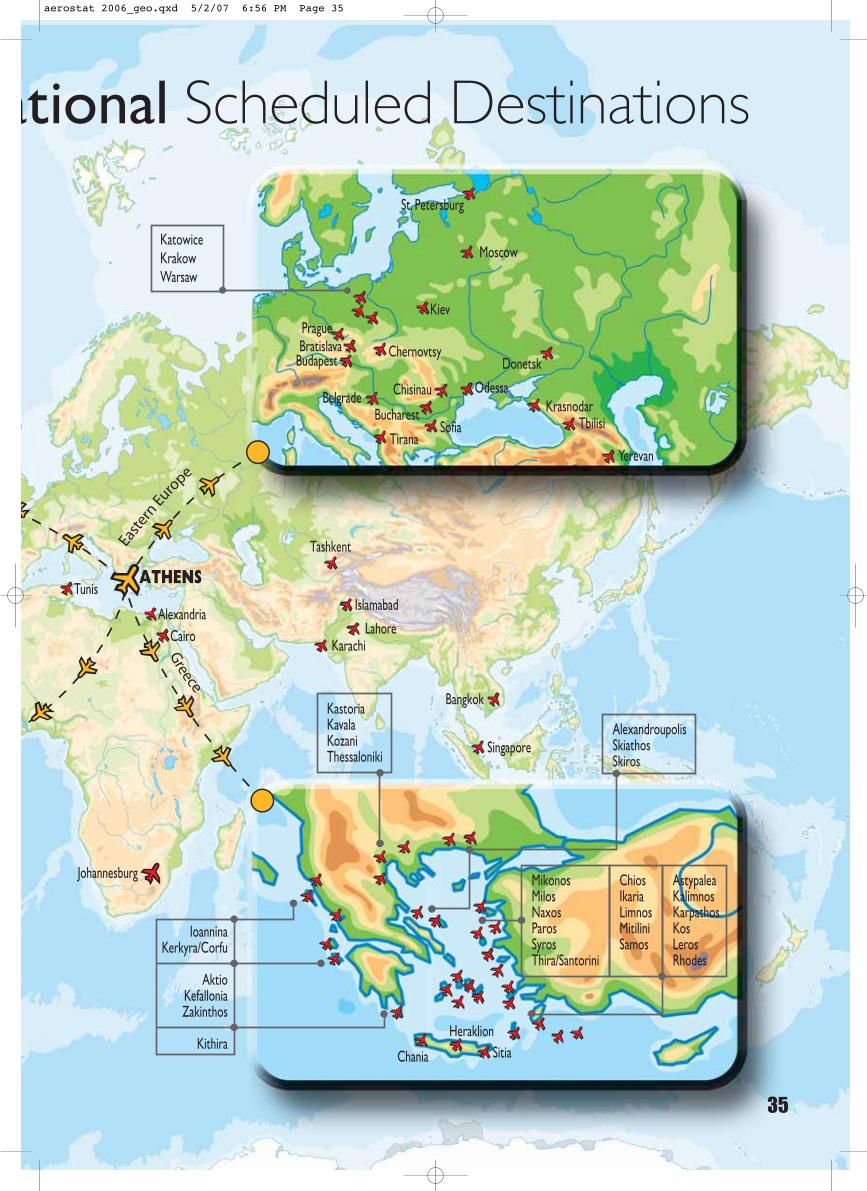
In 2006, 60 carriers in total offered AIA travellersscheduled direct connections with 33 domestic and 70international destinations in 48 countries.The majority ofthe airport's international routes (51 out of 70) are alsoserved by charter flights, while 77 more cities are servedonly by charter services offered by 78 additional airlines.
AIA's route network expanded significantly in the yearunder review with 10 new destinations and 5 newairlines, reflecting the successful implementation ofAIA's consistent strategy for attracting new airlinesand introducing new destinations.
During March, we welcomed 2 new airlines to ourairport; Blue1 –an SAS Scandinavian Airlines subsidiary–flying to Helsinki, and Pakistan International Airlines,which relaunched its flights from Athens to Karachi,Islamabad and Lahore. In May, Delta Airlines introduced anew non-stop daily service to the world's largest hub inAtlanta, while the UK-based Flyglobespan entereddynamically the Athens market, offering daily services toLondon and weekly flights to Glasgow.The Italian AirOne was another newcomer, introducing, in June,services to Naples, Rome and Turin. Norwegian was thelast new entrant in the Athens route network, launching,in September, a twice-weekly service to Warsaw.
Beside the destinations added to AIA's route networkfrom airlines entering the Athens market in 2006, theexpansion of carriers already operating at the airportresulted in the addition of 3 more internationaldestinations in AIA's flight schedule: Billund served bySterling European Airlines, Chernovtsy served byDonbassaero, and Krakow served by Sky Europe.Finally, in the domestic network, Olympic Airlinesintroduced, in August, regular scheduled connectionswith the newly established airport of Kalimnos island.
New Airlines
Air One
Blue1
Flyglobespan
Norwegian
Pakistan International
New Destinations
Atlanta
Billund
Chernovtsy
Islamabad
Kalimnos
Karachi
Krakow
Lahore
Naples
Turin
Furthermore, a number of airlines have includedadditional destinations in their scheduled services.Theentry of Aegean Airlines to the Bulgarian market (Sofia);the new service of easyJet to Milan; the enhancement ofthe Scandinavian flight schedule with the new service ofSAS to Oslo; and the new flight of Sterling EuropeanAirlines to Stockholm are among these developments.
With respect to cargo services, 12 airlines in totaloffered scheduled cargo services via Athens InternationalAirport in the course of 2006. Among the significantnew developments are the new Alitalia service and theentrance of a new airline in the Athens cargo market.More specifically:
• In July 2006,Alitalia inaugurated a new scheduled cargoservice, with an Airbus A300 Freighter, connecting Milanand Athens on a weekly basis.The new flight replacedthe weekly truck service, thereby aiming to betterserve the inbound demand in Greece.
• In August 2006, a new Greek airline, Sky Express aircargo,a joint venture between Sky Express S.A. and FinavalGroup, launched its operations from Athens InternationalAirport, deploying a Boeing 747-200 Freighter withapproximately 100 tonnes of payload. In 2006, the airlineoffered charter flights to the Far East, while during 2007,the aircraft will go into regular service using Athens as anintermediate stop in its future frequencies betweenWestern Europe and the Far East.These new serviceswill further support the development of the internationaltransit traffic via Athens.
aerostat 2006_geo.qxd 5/2/07 6:56 PM Page 31
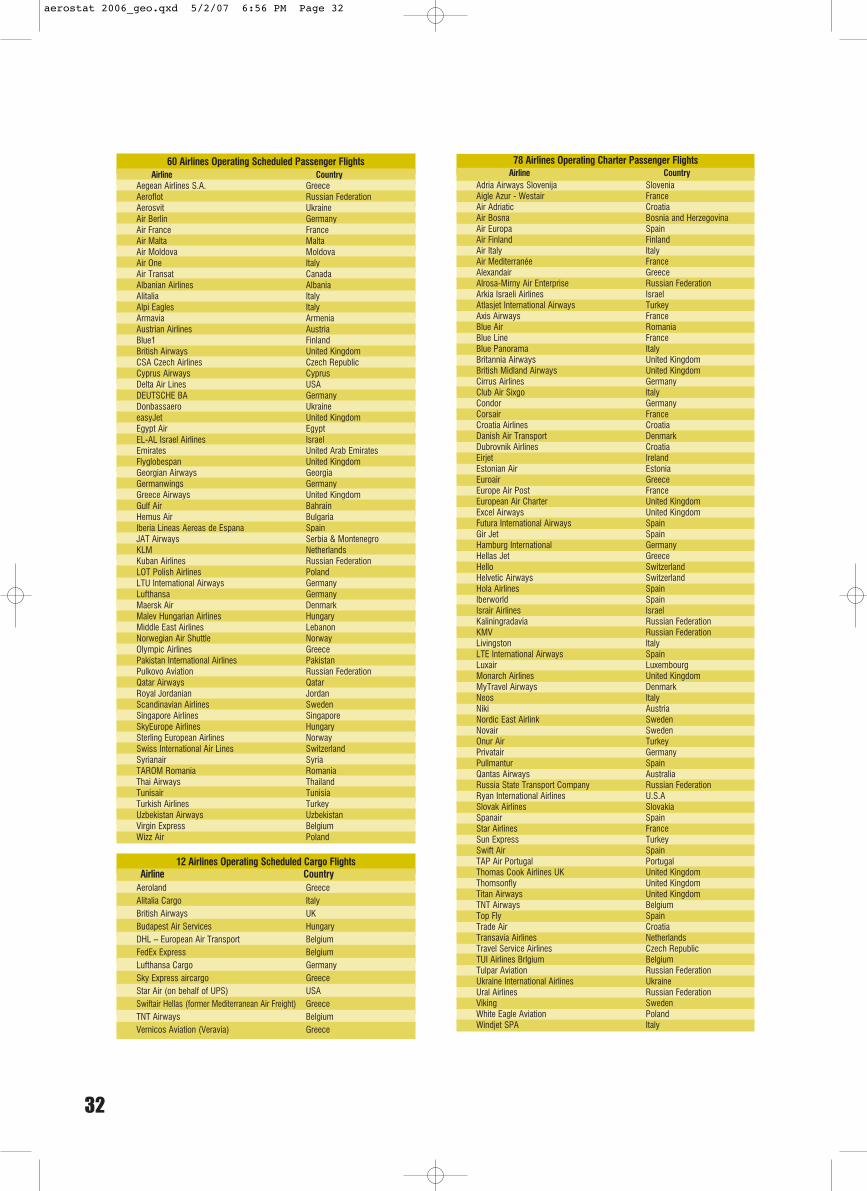
60 Airlines Operating Scheduled Passenger FlightsAirline Country
Aegean Airlines S.A. GreeceAeroflot Russian FederationAerosvit UkraineAir Berlin GermanyAir France FranceAir Malta MaltaAir Moldova MoldovaAir One ItalyAir Transat CanadaAlbanian Airlines AlbaniaAlitalia ItalyAlpi Eagles ItalyArmavia ArmeniaAustrian Airlines AustriaBlue1 FinlandBritish Airways United KingdomCSA Czech Airlines Czech RepublicCyprus Airways CyprusDelta Air Lines USADEUTSCHE BA GermanyDonbassaero UkraineeasyJet United KingdomEgypt Air EgyptEL-AL Israel Airlines IsraelEmirates United Arab EmiratesFlyglobespan United KingdomGeorgian Airways GeorgiaGermanwings GermanyGreece Airways United KingdomGulf Air BahrainHemus Air BulgariaIberia Lineas Aereas de Espana SpainJAT Airways Serbia & MontenegroKLM NetherlandsKuban Airlines Russian FederationLOT Polish Airlines PolandLTU International Airways GermanyLufthansa GermanyMaersk Air DenmarkMalev Hungarian Airlines HungaryMiddle East Airlines LebanonNorwegian Air Shuttle NorwayOlympic Airlines GreecePakistan International Airlines PakistanPulkovo Aviation Russian FederationQatar Airways QatarRoyal Jordanian JordanScandinavian Airlines SwedenSingapore Airlines SingaporeSkyEurope Airlines HungarySterling European Airlines NorwaySwiss International Air Lines SwitzerlandSyrianair SyriaTAROM Romania RomaniaThai Airways ThailandTunisair TunisiaTurkish Airlines TurkeyUzbekistan Airways UzbekistanVirgin Express BelgiumWizz Air Poland
12 Airlines Operating Scheduled Cargo FlightsAirline Country
Aeroland GreeceAlitalia Cargo ItalyBritish Airways UKBudapest Air Services HungaryDHL – European Air Transport BelgiumFedEx Express BelgiumLufthansa Cargo GermanySky Express aircargo GreeceStar Air (on behalf of UPS) USASwiftair Hellas (former Mediterranean Air Freight) GreeceTNT Airways BelgiumVernicos Aviation (Veravia) Greece
78 Airlines Operating Charter Passenger FlightsAirline Country
Adria Airways Slovenija SloveniaAigle Azur - Westair FranceAir Adriatic CroatiaAir Bosna Bosnia and HerzegovinaAir Europa SpainAir Finland FinlandAir Italy ItalyAir Mediterranée FranceAlexandair GreeceAlrosa-Mirny Air Enterprise Russian FederationArkia Israeli Airlines IsraelAtlasjet International Airways TurkeyAxis Airways FranceBlue Air RomaniaBlue Line FranceBlue Panorama ItalyBritannia Airways United KingdomBritish Midland Airways United KingdomCirrus Airlines GermanyClub Air Sixgo ItalyCondor GermanyCorsair FranceCroatia Airlines CroatiaDanish Air Transport DenmarkDubrovnik Airlines CroatiaEirjet IrelandEstonian Air EstoniaEuroair GreeceEurope Air Post FranceEuropean Air Charter United KingdomExcel Airways United KingdomFutura International Airways SpainGir Jet SpainHamburg International GermanyHellas Jet GreeceHello SwitzerlandHelvetic Airways SwitzerlandHola Airlines SpainIberworld SpainIsrair Airlines IsraelKaliningradavia Russian FederationKMV Russian FederationLivingston ItalyLTE International Airways SpainLuxair LuxembourgMonarch Airlines United KingdomMyTravel Airways DenmarkNeos ItalyNiki AustriaNordic East Airlink SwedenNovair SwedenOnur Air TurkeyPrivatair GermanyPullmantur SpainQantas Airways AustraliaRussia State Transport Company Russian FederationRyan International Airlines U.S.ASlovak Airlines SlovakiaSpanair SpainStar Airlines FranceSun Express TurkeySwift Air SpainTAP Air Portugal PortugalThomas Cook Airlines UK United KingdomThomsonfly United KingdomTitan Airways United KingdomTNT Airways BelgiumTop Fly SpainTrade Air CroatiaTransavia Airlines NetherlandsTravel Service Airlines Czech RepublicTUI Airlines Brlgium BelgiumTulpar Aviation Russian FederationUkraine International Airlines UkraineUral Airlines Russian FederationViking SwedenWhite Eagle Aviation PolandWindjet SPA Italy
32
aerostat 2006_geo.qxd 5/2/07 6:56 PM Page 32

33 Domestic Scheduled DestinationsAktioAlexandroupolisAstypaleaChaniaChiosIkariaIoanninaIraklionKalimnosKarpathosKastoriaKavalaKefalloniaKerkyra/CorfuKithiraKosKozaniLerosLimnosMikonosMilosMitiliniNaxosParosRhodesSamosSitiaSkiathosSkirosSyrosThessalonikiThira/SantoriniZakinthos
77 International Scheduled DestinationsAleppoAlexandria (EG)Amman AmsterdamAtlantaBahrainBangkokBarcelona (ES)BeirutBelgradeBerlin BillundBolognaBratislavaBrusselsBucharest BudapestCairoChernovtsyChisinauCologneCopenhagenDamascusDohaDonetskDubaiDublinDusseldorfFrankfurtGenevaGlasgow (GB)HelsinkiIslamabadIstanbulJohannesburgKarachiKatowiceKiev KrakowKrasnodarKuwaitLahoreLarnacaLondon MadridMalta
Manchester (GB)Milan Montreal Moscow MunichNaples (IT)New YorkNurembergOdessaOslo PaphosParis PragueRome SingaporeSofiaStockholm St. Petersburg (RU)StuttgartTashkentTbilisiTel AvivTiranaTorontoTunisTurinVeniceViennaWarsawYerevanZurich
128 International Charter DestinationsAalborgAbu DhabiAlexandria (EG)Amman AmsterdamAntalyaBahrainBarcelona (ES)BariBaselBelgradeBergamoBerlin BilbaoBirmingham (GB)BolognaBordeauxBratislavaBristolBrnoBrusselsBucharest BudapestCagliariCairoCataniaChisinauCopenhagenDamascusDjerbaDonetskDresdenDublinDubrovnikEast MidlandsEdinburghEkaterinburgErbilFrankfurtGenevaGenoaGlasgowGothenburgHanoverHaugesundHelsinkiHurghadaIstanbul
IzmirKaboulKaunas IntlKayseriKemiKiev KrakowKrasnodarKristiansandLarnacaLilleLimogesLisbonLjublianaLondon LuxembourgLyonMadridMahonMalagaMaltaManchester (GB)MarseilleMetz-NancyMilanMonastirMoscow Mulhouse/BaselMunichMuscatNantesNewcastle (GB)New YorkNiceOdessaOslo PalermoPaphosParis PisaP.MallorcaPragueReusRiyadhRome RotterdamRovaniemiSalzburgSarajevoSevilleSharmSimferopolSkopjeSofiaSplitStavangerStockholm St. Petersburg (RU)StrasbourgStuttgartTallinnTbilisiTel AvivTimisoaraTokyoToulouseTozeurTrevisoTriesteTunisValencia (ES)VeniceVeronaViennaVitoria (ES)WarsawYerevanZagrebZaporozhyeZurich
33
aerostat 2006_geo.qxd 5/2/07 6:56 PM Page 33
MontrealToronto
New York
BerlinDusseldorfMunichNurembergCologneFrankfurtStuttgart
GenevaZurich
BolognaMilanNaplesRomeTurinVenice
GlasgowLondon
Manchester
Helsinki
BahrainDoha
Kuwait
Dubai
Tel AvivAmman
DamascusAleppo
Beirut
StockholmBillund
Dublin
Oslo
Vienna
BarcelonaIstanbul
Malta
Brussels
Paris
Amsterdam
Madrid
Copenhagen
LarnacaPaphos
Atlanta
Western Europe
Middle East
33 Domestic and 77 Internati
34
aerostat 2006_geo.qxd 5/2/07 6:56 PM Page 34
Singapore
Tashkent
Bangkok
Islamabad
ATHENSTunis
Karachi
Johannesburg
LahoreAlexandriaCairo
Chania SitiaHeraklion
St. Petersburg
Moscow
Krasnodar
Donetsk
Tbilisi
Yerevan
OdessaChisinauBelgradeBucharest
Kiev
Chernovtsy
Prague
BudapestBratislava
TiranaSofia
KatowiceKrakowWarsaw
IoanninaKerkyra/Corfu
AktioKefalloniaZakinthos
Kithira
MikonosMilosNaxosParosSyrosThira/Santorini
KastoriaKavalaKozaniThessaloniki
AlexandroupolisSkiathosSkiros
ChiosIkariaLimnosMitiliniSamos
AstypaleaKalimnosKarpathosKosLerosRhodes
Greece
East
ernEuro
pe
ational Scheduled Destinations
35
aerostat 2006_geo.qxd 5/2/07 6:56 PM Page 35

punctuality
aerostat 2006_geo.qxd 5/2/07 6:56 PM Page 36

37
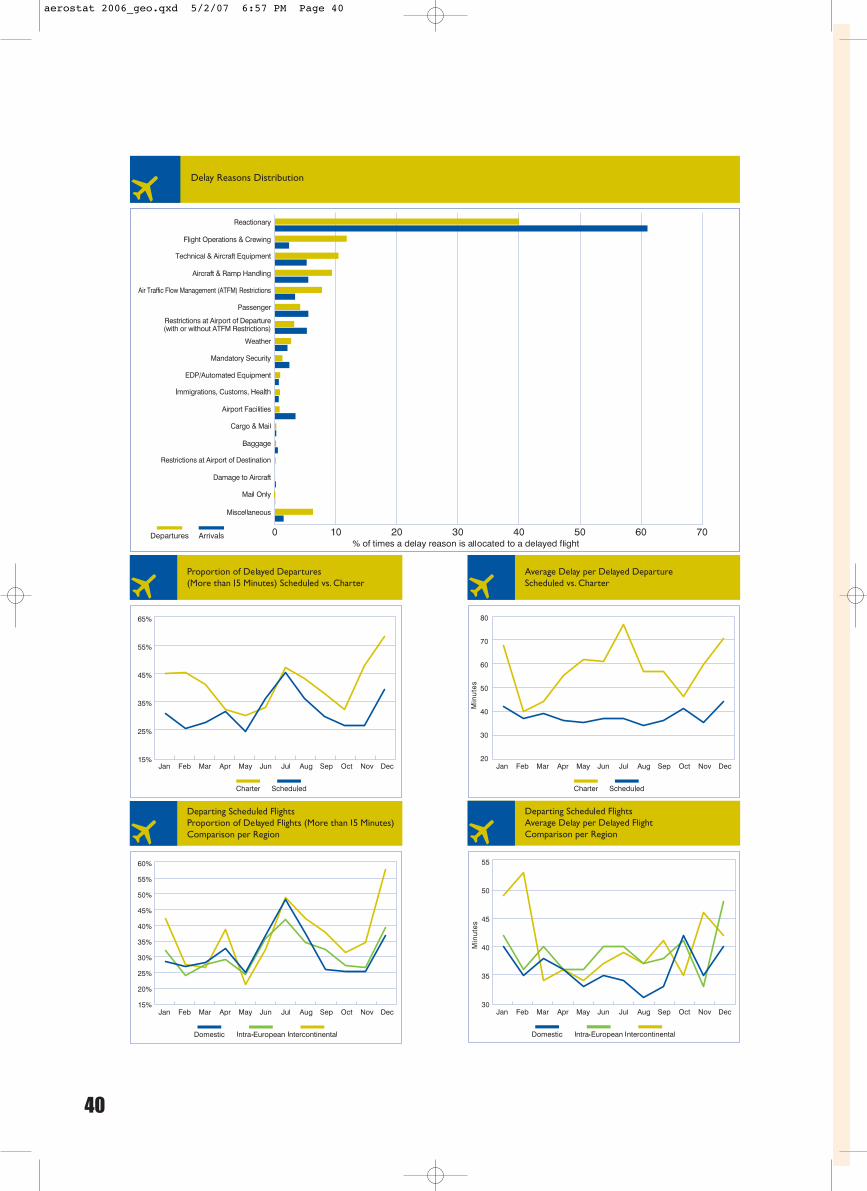
Scheduled and charter passenger services at AthensInternational Airport grew by 4.2% in 2006. Despitethe considerable increase in the number ofmovements, and the days of adverse weatherconditions and labour actions (thirty-one 24h strikes),the airport's flight punctuality was generally improved.More specifically, the proportion of departures delayedfor more than 15 minutes remained at 32%,approximately at the 2005 level, and the average delaytime of departing flights was significantly reduced from42 minutes in 2005 to 38 minutes in 2006.
The average delay for scheduled departures was 38minutes, 3 minutes less than the previous year, whilecharter departing flights were delayed for 62 minuteson average, 1 minute more than in 2005. Focusing onscheduled services, domestic operations had thelowest average delay (36 minutes) compared to intra-European and intercontinental services, whereas intra-European flights were the most punctual (with 31.6%of departures being delayed for more than 15 minutes).
February, being the less busy month of the year,presented the lowest proportion of delayeddepartures (25.7%), while July was the month with thehighest share of delayed departing flights (45.5%).Thelargest monthly average delay for departures was 45minutes, observed in December, while the lowest was35 minutes, in May,August and November.
Most delayed departing flights were primarily due to“Reactionary” reasons (40.1%), and secondly to “FlightOperations & Crewing” (11.8%). Only 0.8% of thedeparture delays were attributed to “AirportFacilities”, reaffirming AIA's commitment tooperational excellence.
aerostat 2006_geo.qxd 5/2/07 6:57 PM Page 37

38
aerostat 2006_geo.qxd 5/2/07 6:57 PM Page 38

39
Monthly Punctuality StatisticsDeparting Flights Arriving Flights
Month Events Affecting Proportion of Delayed Average Delay (in min) Proportion of Delayed Average Delay (in min)Punctuality Flights for more than of Flights Delayed for Flights for more than of Flights Delayed for
15 Minutes more than 15 Minutes 15 Minutes more than 15 MinutesJan 24,25 & 26/01 Adverse weather conditions (snow) 31.1% 42 27.6% 44Feb 25.7% 37 21.7% 42Mar 3,4,7 and 29/03 Strike of security screening personnel 27.7% 39 22.4% 43
15/3 24h general strike of Greek Federation ofWorkers' Unions and Civil Servants' Unions
Apr 31.4% 37 23.3% 40May 10/5 24h general strike of Greek Federation 24.6% 35 17.5% 40
of Workers' Unions and Civil Servants' UnionsJun 36.0% 38 26.2% 42Jul 45.5% 38 33.3% 42Aug 36.6% 35 26.0% 39Sep 29.8% 37 22.0% 42Oct 04/10 Strike of security screening personnel. 26.7% 41 21.6% 44
24/10 Adverse weather conditions (fog)Nov 17,18 and 19/11 Adverse weather conditions at other 26.5% 35 17.7% 41
airports had impact on flights departing from Athens.22/11 24h Strike of security screening personnel
Dec From 3/12 to 31/12 ongoing strike of 39.8% 45 26.5% 50security screening personnelTOTAL 2006 32.2% 38 24.0% 42
Proportion of Delay Reasons
Reasons for Delay Arrivals Departures
Reactionary 61.24% 40.13%
Flight Operations and Crewing 2.32% 11.80%
Technical and Aircraft Equipment 5.22% 10.45%
Aircraft and Ramp Handling 5.48% 9.38%
Air Traffic Flow Management Restrictions 3.31% 7.73%
Passenger 5.49% 4.15%
Restrictions at Airport of Departure with 5.25% 3.16%or without ATFM Restrictions
Weather 2.06% 2.66%
Mandatory Security 2.37% 1.23%
EDP/Automated Equipment 0.64% 0.86%
Immigrations, Customs, Health 0.63% 0.84%
Airport Facilities 3.38% 0.77%
Cargo & Mail 0.22% 0.22%
Baggage 0.48% 0.19%
Restrictions at Airport Destination 0.01% 0.13%
Damage to Aircraft 0.16% 0.03%
Mail Only 0.03% 0.00%
Miscellaneous 1.43% 6.25%
% of Delayed Flights for which 78.7% 56.7%a Delay Reason Has Been Reported
aerostat 2006_geo.qxd 5/2/07 6:57 PM Page 39
40
aerostat 2006_geo.qxd 5/2/07 6:57 PM Page 40
41
aerostat 2006_geo.qxd 5/2/07 6:57 PM Page 41

service performance
aerostat 2006_geo.qxd 5/2/07 6:57 PM Page 42
43
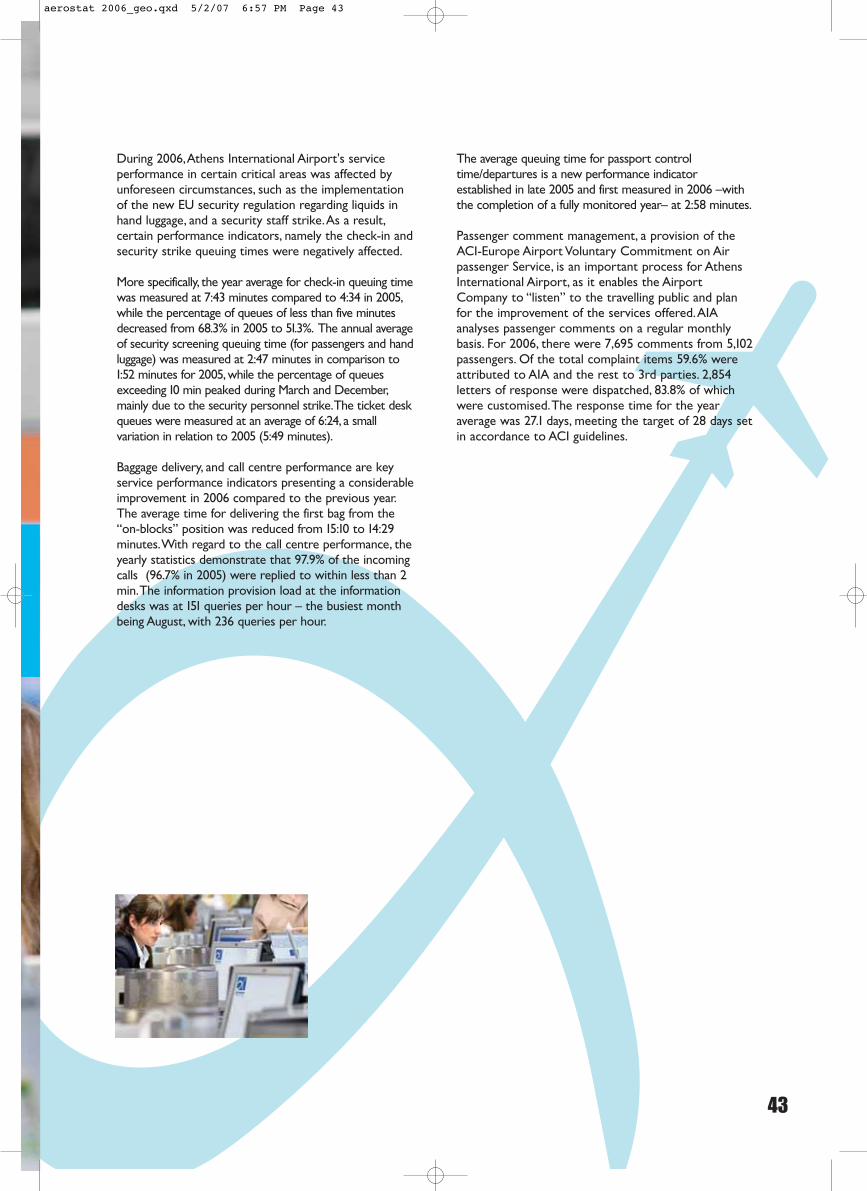
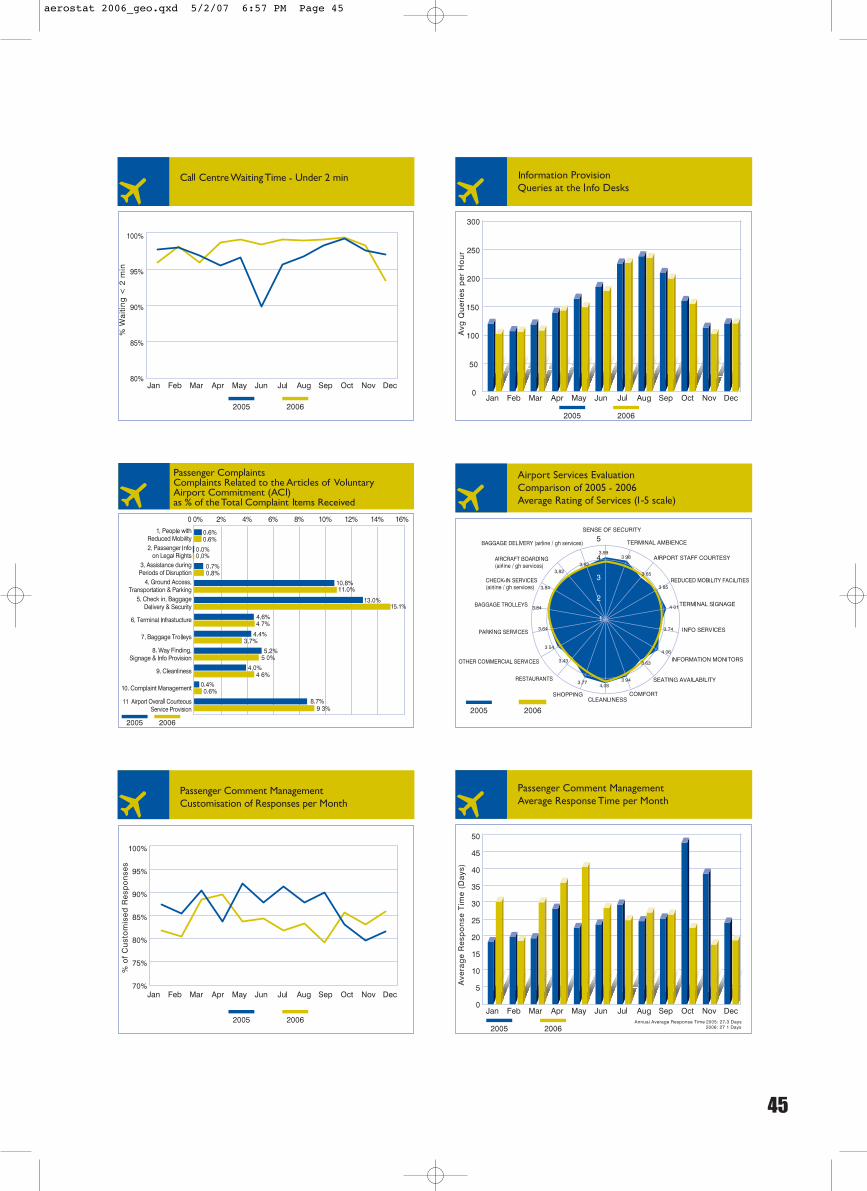
During 2006,Athens International Airport's serviceperformance in certain critical areas was affected byunforeseen circumstances, such as the implementationof the new EU security regulation regarding liquids inhand luggage, and a security staff strike.As a result,certain performance indicators, namely the check-in andsecurity strike queuing times were negatively affected.
More specifically, the year average for check-in queuing timewas measured at 7:43 minutes compared to 4:34 in 2005,while the percentage of queues of less than five minutesdecreased from 68.3% in 2005 to 51.3%. The annual averageof security screening queuing time (for passengers and handluggage) was measured at 2:47 minutes in comparison to1:52 minutes for 2005,while the percentage of queuesexceeding 10 min peaked during March and December,mainly due to the security personnel strike.The ticket deskqueues were measured at an average of 6:24, a smallvariation in relation to 2005 (5:49 minutes).
Baggage delivery, and call centre performance are keyservice performance indicators presenting a considerableimprovement in 2006 compared to the previous year.The average time for delivering the first bag from the“on-blocks” position was reduced from 15:10 to 14:29minutes.With regard to the call centre performance, theyearly statistics demonstrate that 97.9% of the incomingcalls (96.7% in 2005) were replied to within less than 2min.The information provision load at the informationdesks was at 151 queries per hour – the busiest monthbeing August, with 236 queries per hour.
The average queuing time for passport controltime/departures is a new performance indicatorestablished in late 2005 and first measured in 2006 –withthe completion of a fully monitored year– at 2:58 minutes.
Passenger comment management, a provision of theACI-Europe Airport Voluntary Commitment on Airpassenger Service, is an important process for AthensInternational Airport, as it enables the AirportCompany to “listen” to the travelling public and planfor the improvement of the services offered.AIAanalyses passenger comments on a regular monthlybasis. For 2006, there were 7,695 comments from 5,102passengers. Of the total complaint items 59.6% wereattributed to AIA and the rest to 3rd parties. 2,854letters of response were dispatched, 83.8% of whichwere customised.The response time for the yearaverage was 27.1 days, meeting the target of 28 days setin accordance to ACI guidelines.
aerostat 2006_geo.qxd 5/2/07 6:57 PM Page 43

44
aerostat 2006_geo.qxd 5/2/07 6:57 PM Page 44
45
aerostat 2006_geo.qxd 5/2/07 6:57 PM Page 45

passenger profile
aerostat 2006_geo.qxd 5/2/07 6:57 PM Page 46

47
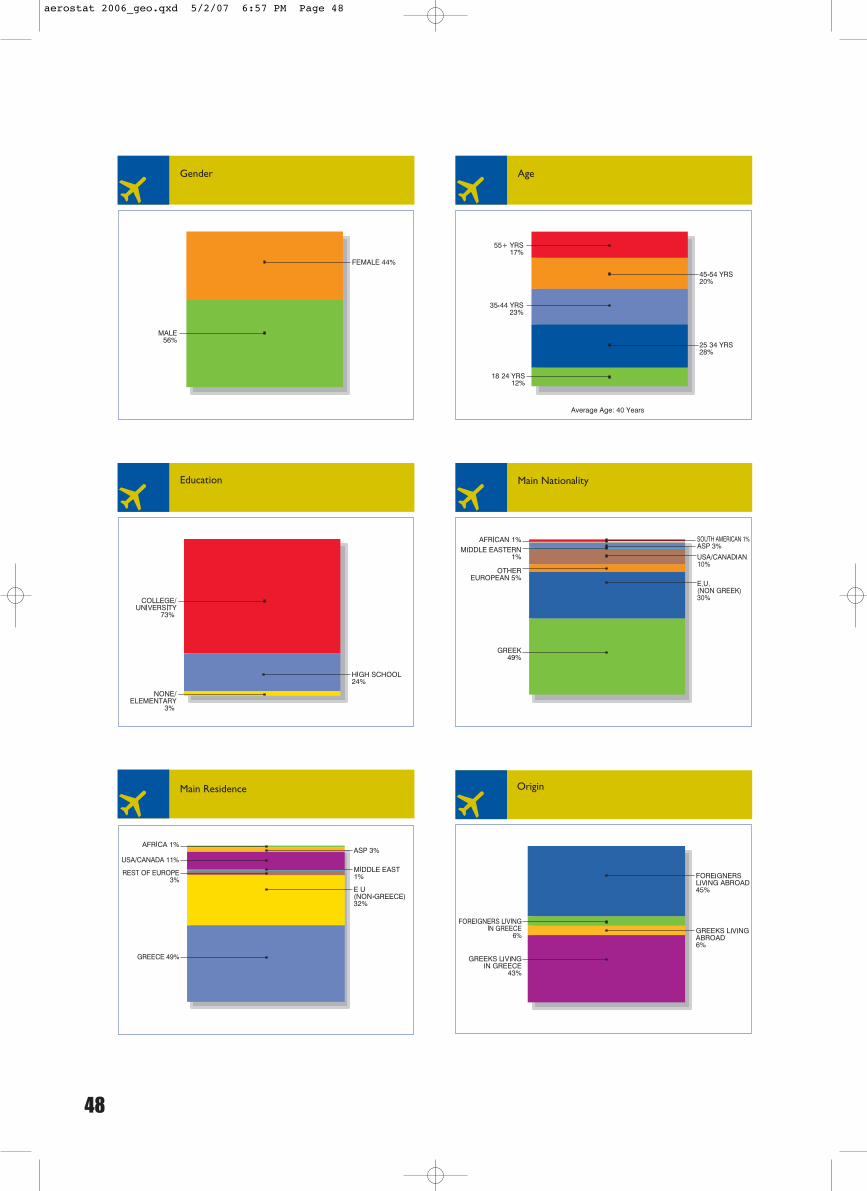
2006 was a milestone year not only for the airport'straffic development, but also for the demographic andtravelling profile of the served passengers. Femalepassengers approached the traditionally leading maletravellers, claiming 44% of the airport's 2006 totaltraffic, as opposed to 37% in 2005.The average age ofAIA's travellers remained at 40 years, and the higheducational level continues to be one of the maincharacteristics of Athens passengers, with 7 out of 10holding a college/university degree.
Since the outset of the airport's operation, Greektravellers had consistently held a larger sharecompared to foreigners, both in terms of nationalityand residence. However, in 2006, the proportion offoreigners exceeded for the first time that of Greekresidents, accounting for 51% of total traffic.Thisdevelopment is mainly attributed to the strongerpresence of US residents and passengers residing inthe Asia/Pacific region. On the other hand, Europeanresidents presented a slight decline compared to 2005.
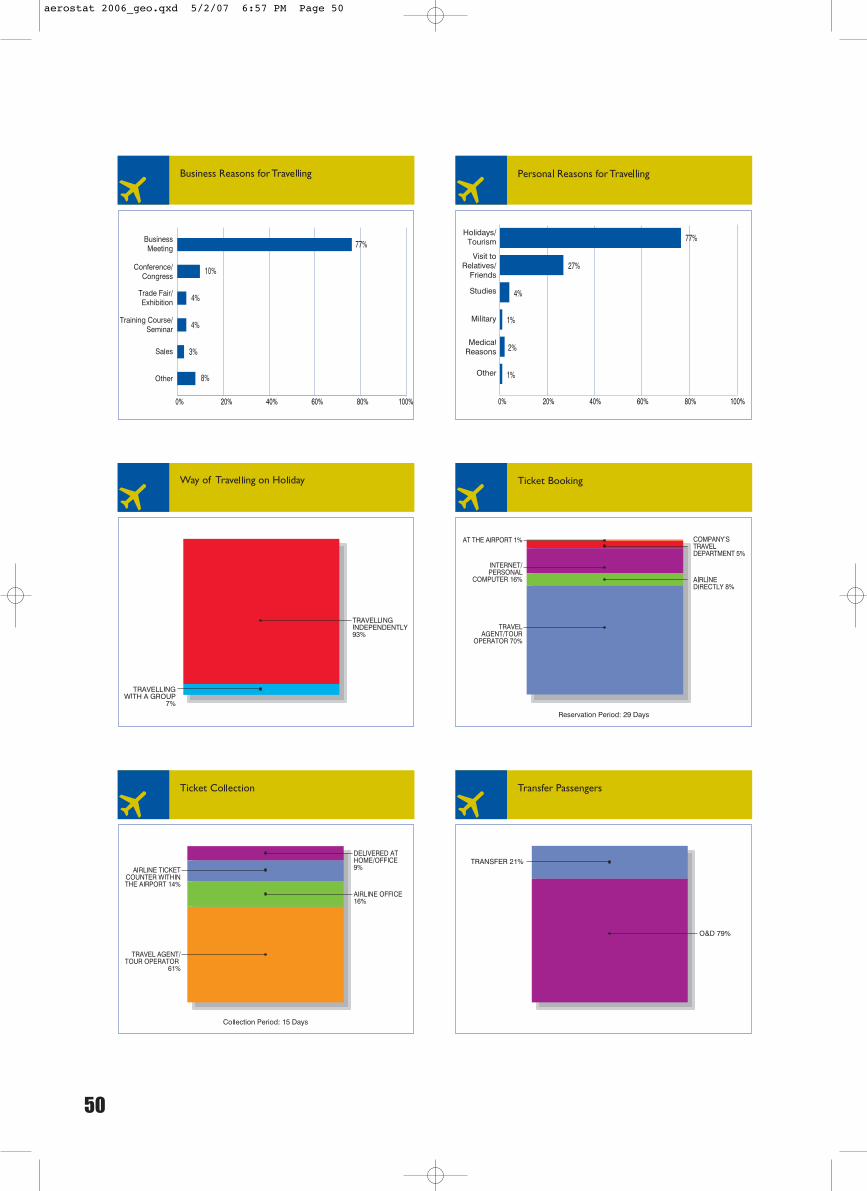
Regarding the purpose of trip, passengers travelling forbusiness purposes constitute a solid base of AthensInternational Airport traffic, amounting toapproximately 5 million in 2006, at similar levelscompared to 2005. It is worth noting that 42% ofbusiness travellers originated from EU countries, whileGreek business travellers remained steadily high at 37%.
Leisure traffic increased among foreigners and Greektravellers alike by an average 3%. 61% of Greekpassengers travelled for personal reasons, while therespective proportion of foreign travellers was 73%.Amongst leisure travellers the share of holidaymakersincreased by 10 percentage points, boosted both byforeign and Greek residents travelling on vacation.However, leisure travellers preferred to travelindependently this year, as a consequence of which,group travelling dropped to 7% (from 15% in 2005).The boost in leisure traffic has also affected thefrequency of travelling, with the share of light travellers(up to 2 trips/year) presenting spectacular growth of59%, up from 16% in the previous year. Nevertheless,the stable volume of business passengers prevented adecrease in the proportion of heavy travellers (10+trips/year), which remained at the level of 30%.
As usual, foreigners stay longer in their destination incomparison to Greek people.The long-haul touristboom raised the foreigners' average length of stayfrom 10 to 16 days, while the Greek traveller's triplasted approximately 10 days.
Concerning the ticket booking profile, more passengerspreferred to reserve their air tickets through theInternet in 2006.The e-booking service offered by alarge number of airlines nowadays, seems to beappreciated by more and more passengers who usethis valuable service, enhancing its market penetrationfrom 5% in 2005 to 16% in 2006. Nonetheless, personalcontact with the travel agency or the tour operatorremained the most favourite means of booking,accounting for 70%. Due to ticket booking via theInternet and the increased number of passengers fromlong-haul destinations, the ticket reservation periodwas extended from 19 to 29 days before departure.Additionally, the broader use of e-booking affected thepattern of ticket collection, with the pick-up from theairline counter raised from 6% to 14%.
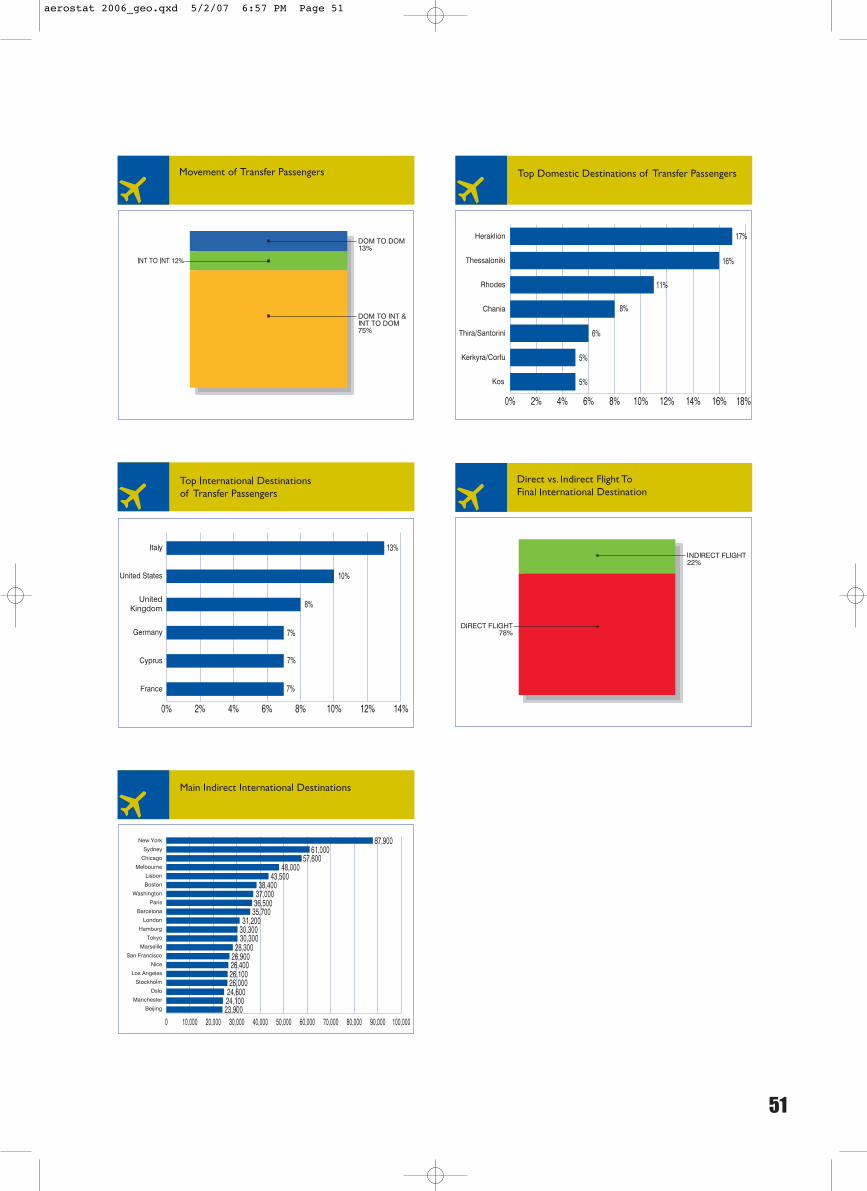
Following a decrease over the previous years, the shareof Athens transfer passengers has been stabilised at 21%.However, the Athens transfer product experienced adeclining trend during the last six months of 2006, as wellas in the first months of 2007.The proportion of transferpassengers remained at similar levels with that of theprevious year due to the important rise of “internationalto international” (from 8% to 12%) and the slight growthof “domestic to domestic” (from 10% to 13%) transfermovement. Heraklion, at 17%, regained the top spotamong passengers travelling to domestic destinations viaAthens, following a significant drop of Rhodes' share(from 20% to 11%). Italy ranked first among transferpassengers to/from international destinations with theUnited States gaining 2nd place, bouncing up from 6thplace in 2005.
The increasing demand for flying to Athens is alsoevident in indirect traffic figures. Despite the capacityincrease in the US market, the outstanding boost ofUS residents preferring Greece for their travellingaffected the share of indirect traffic between the twocountries by a 7% rise. More specifically, six out of tenpassengers made a stopover in order to reach theirfinal US destination, while most of them transferred inEuropean countries such as Germany, the UnitedKingdom and France. New York, Chicago, Boston andWashington were the top indirect US destinations in2006.Among European destinations, Lisbon holds theleading position for the last three years, followed byParis, Barcelona, London and Hamburg.
aerostat 2006_geo.qxd 5/2/07 6:57 PM Page 47
48
aerostat 2006_geo.qxd 5/2/07 6:57 PM Page 48

49
aerostat 2006_geo.qxd 5/2/07 6:57 PM Page 49
50
aerostat 2006_geo.qxd 5/2/07 6:57 PM Page 50
51
aerostat 2006_geo.qxd 5/2/07 6:57 PM Page 51

tourism development
aerostat 2006_geo.qxd 5/2/07 6:57 PM Page 52

53
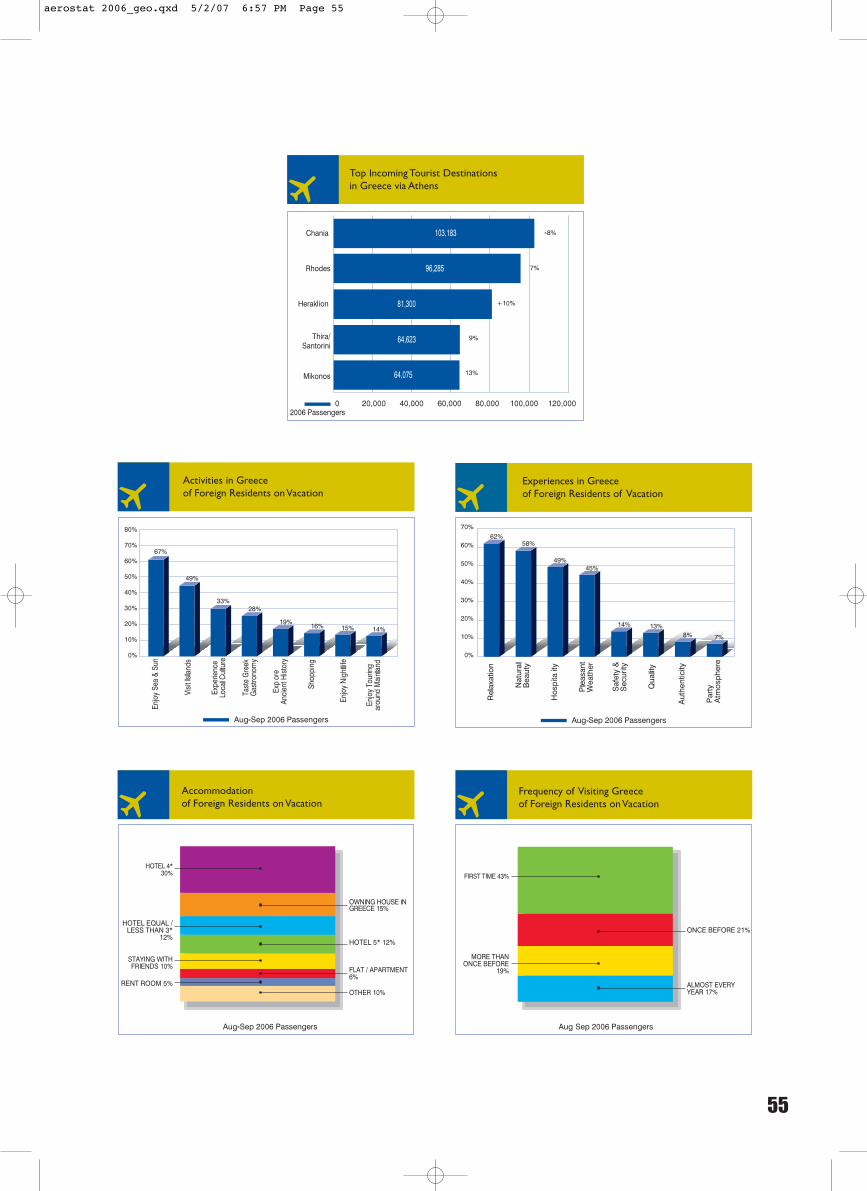
The ongoing promotion of Greece seems to be veryeffective for the development of tourism.Two years afterthe 2004 Olympic Games,Athens continues to attractmore and more foreign travellers.The share of foreignresidents in AIA's traffic increased, reaching 65% of theinternational traffic in 2006.This year, Athens InternationalAirport welcomed 3.1 million foreigners, experiencinggrowth of 8% compared to the 2005 figure (2.9 million).
The positive development of incoming vacation trafficin Athens was evident during the last two years. In2005, the proportion of holidaymakers was 57% amongthe foreigners, while in 2006 the respective percentagerose to 63%.The volume of foreign residents onvacation grew by 16% in 2005, and an impressive 20% in2006. More specifically, incoming tourism passingthrough Athens International Airport reached 2 millionpassengers in 2006, from 1.6 million in 2005.
The increase in the volume of passengers flying to Athensfor tourism was mainly attributed to foreigners travellingon long-haul routes, such as North America –presenting aspectacular 347% growth rate in incoming touristarrivals– and Asia/Pacific (ASP) showing a 97% increase inthe respective figure. It is worth noting that the ASPincoming tourist growth derived mainly from Australia.The significant boost of Middle East traffic was alsoreflected in tourism, since passengers flying from thatregion on holidays to Athens showed an increase of 88%.
2006 presented an obvious trend in the expansion ofthe tourist season, as exhibited in the monthlydevelopment of tourist arrivals.With the exception ofJanuary and February, when a decline was observed,the rest of the year presented significant growth evenduring the non-summer months. From the peaksummer months, June showed the highest increase of27%, while August also showed a noteworthy increaseof 16%. Foreign holidaymakers, however, preferredAthens even in the non-summer months of March,October, November and December.
Among the top markets of incoming tourism, NewYork climbed to 1st place, following an outstandinggrowth rate of 388%.Although Europeanholidaymakers presented a decline overall, incomingtourism from France, the United Kingdom, Spain andthe Scandinavian countries increased considerably.Thecountries providing the highest tourist boost in Athenswere Australia, South Africa, Sweden and Canada,presenting a spectacular increase exceeding 200%.Israel, Lebanon, Poland and South Korea also expandedremarkably by more than 50%.The foreigners' prolonged stay, along with the decrease
of incoming transfer passengers indicate that in 2006more foreign holidaymakers preferred to visit the cityof Athens and the greater area before continuing theirtrip to the islands. Incoming tourism in Attica and itscatchment area reached the number of 1,460,833visitors, corresponding to an increase of 44% over2005.The volume of the incoming tourism using AthensInternational Airport as a transfer point decreased by7% to 576,812 passengers. Chania, despite the decreasein volume, regained the top position in the transferholidaymaker's preferences, followed by Rhodes.
Based on the findings of an ad-hoc survey implemented byAthens International Airport on behalf of the GreekNational Tourism Organisation during the peak months oftourist arrivals (August & September 2006), the sea, thesun and the islands were the main elements that foreignholidaymakers enjoy most in Greece.The majority ofthem were interested in experiencing the local cultureand exploring the ancient flair of Greece, while aconsiderable proportion expressed a keen interest in thetraditional Greek cuisine.The prevailing feeling after thecompletion of their vacations in Greece was relaxation,after having enjoyed the natural beauty and the pleasantweather of the country, while half of them reallyappreciated the Greek hospitality.
Four out of ten foreigners visited Greece for the firsttime, while a significant 17% visit Greece almost everyyear.This high percentage of repetitive tourism wasformulated in 2006 mainly by the great number of USand Australian residents who own a house in Greece orhave friends and/or relatives in the country. However,the majority of foreign residents on vacation preferreda 4-star hotel for their accommodation in Greece.
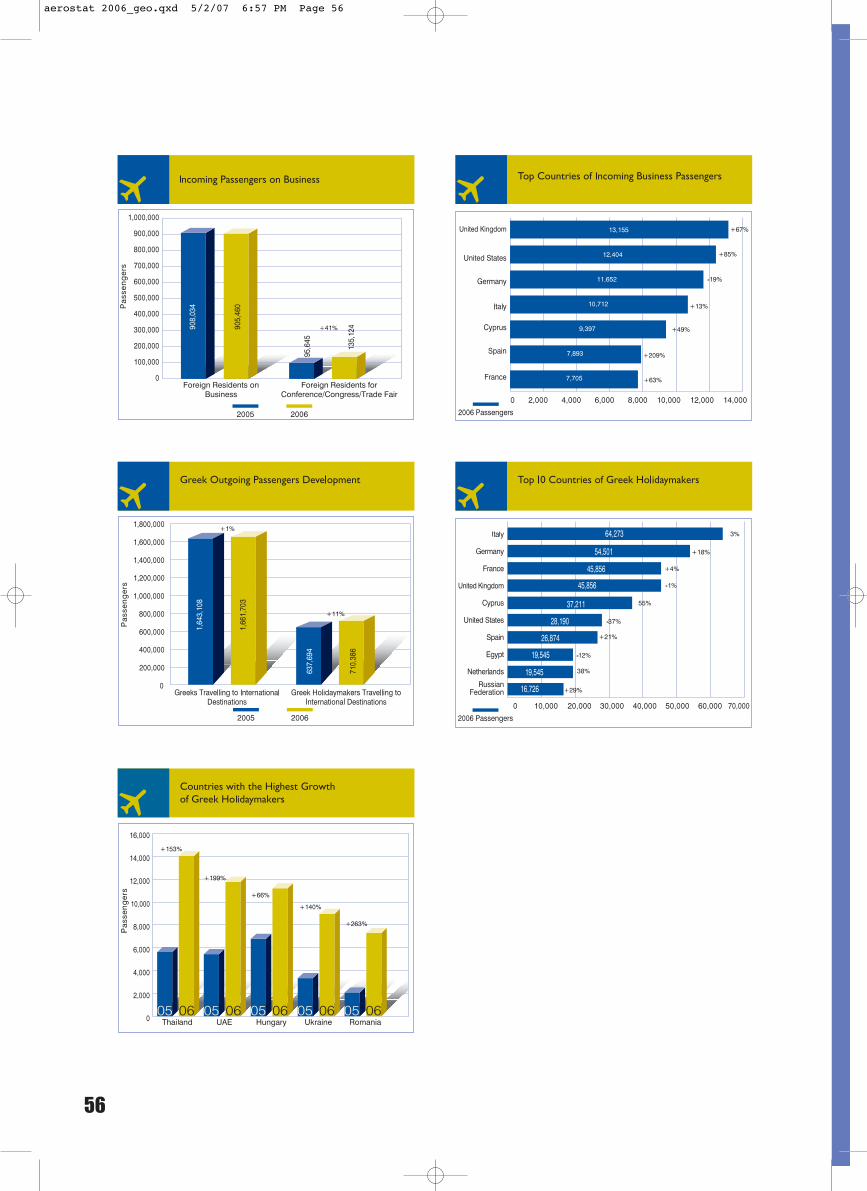
Incoming business traffic remained at the same level with2005, amounting to 905,460 passengers. However,passengers travelling for conferences, conventions, tradefairs and incentives demonstrated a significant 41% increasewith more than 135,000 travellers – an encouragingdevelopment for the enhancement of convention tourism,which is the focus of the Greek tourist authorities.TheUnited Kingdom, followed by the United States, Germanyand Italy, were the countries with a major interest forconvention tourism in Greece. It is worth noting that, withthe exception of Germany, which experienced a decline, allthe other countries presented a double-digit increase.
As per Greece's outgoing tourism, although Greekresidents flying from Athens to international destinationsremained at the 2005 level, the number of Greekholidaymakers to international destinations increased by11% this year, reaching 710,386. Italy remained the Greektraveller's favourite holiday spot abroad, with Germany insecond place, and France and the United Kingdomranking third. In 2006, Greek people showed anincreasing preference to travel east for their holidays andmore specifically to Thailand and the United ArabEmirates, as indicated by the remarkable growth (inexcess of 100%) of these destinations. Moreover, Greektravellers included some of the Balkan countries, such asHungary and Romania, among their holiday destinations.
aerostat 2006_geo.qxd 5/2/07 6:57 PM Page 53

54
aerostat 2006_geo.qxd 5/2/07 6:57 PM Page 54
55
aerostat 2006_geo.qxd 5/2/07 6:57 PM Page 55
56
aerostat 2006_geo.qxd 5/2/07 6:57 PM Page 56

57
aerostat 2006_geo.qxd 5/2/07 6:57 PM Page 57
the greek aviation market
aerostat 2006_geo.qxd 5/2/07 6:57 PM Page 58
59
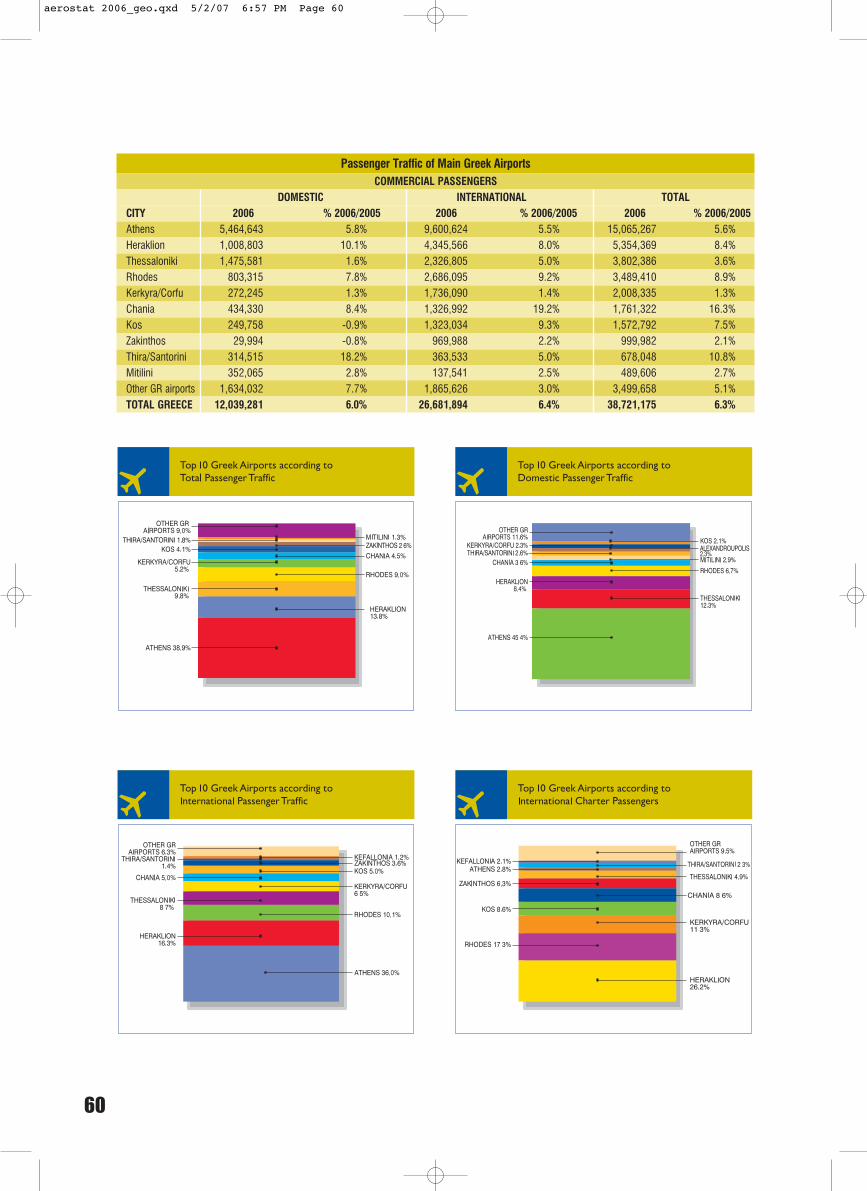
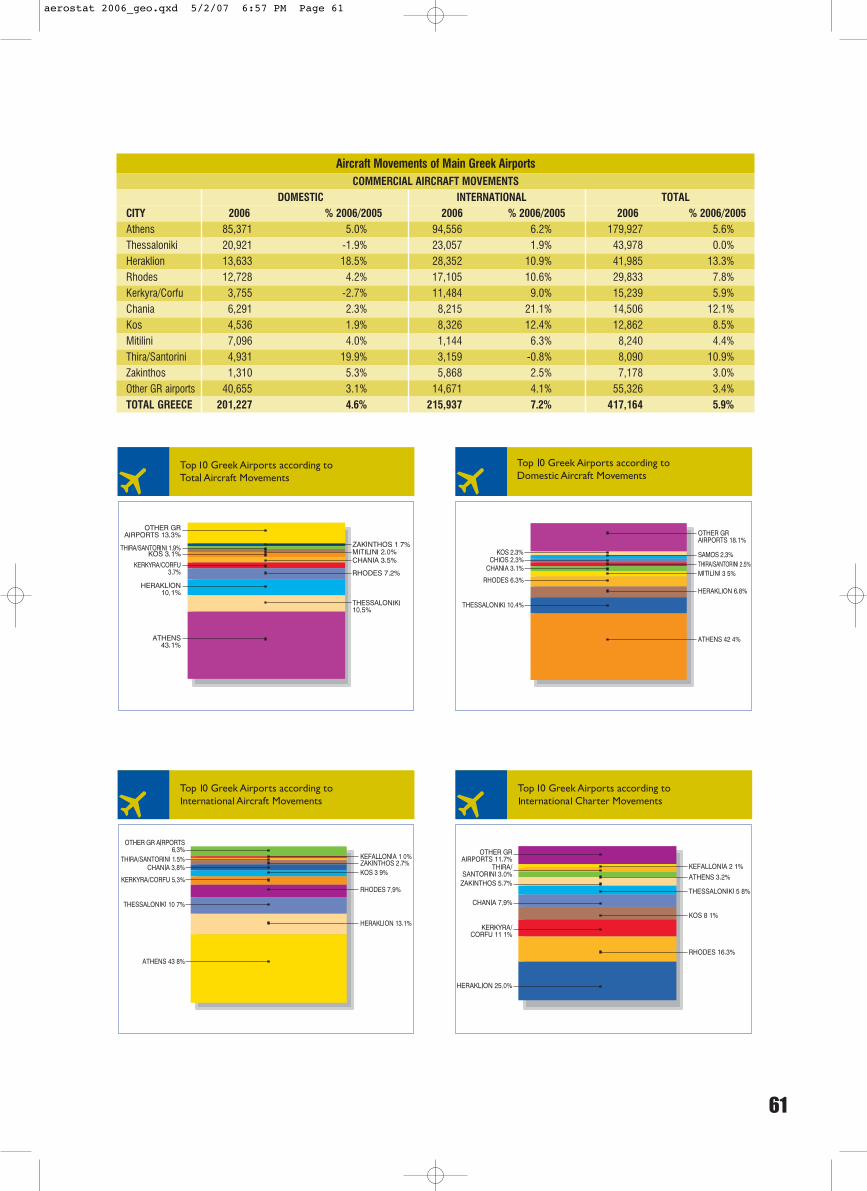
The Greek air travel market enjoyed a robust developmentin the course of 2006,with passengers travelling to/fromthe Greek commercial airports amounting to 38.7 million,2.3 million (+6%) above the previous year. Both thedomestic and the international markets achieved healthytraffic growth (at the level of 6%), signifying the positiveevolution of local as well as foreign tourism. Aircraftmovements also achieved a considerable increase of 6%,exceeding 400 thousand,while the total tonnage of air-transported mail and freight reached 138 thousand tonnes,3.4% above the equivalent 2005 level.
Focusing on the development of the major Greekairports, it is worth noting that, although all the majorairports enjoyed a traffic increase in the course of 2006,they also experienced diverse traffic developments.Chania was the fastest growing among major Greekairports, with a 16% passenger traffic increase, mainlyattributed to a rapid upward course (by almost 20%) inthe international passenger market. Santorini followswith an 11% increase, this time boosted by theoutstanding 18% rise in the domestic sector. Corfu(Kerkyra) remained rather stagnant, save a meagre 1%increase, while Kos and Zakinthos experienced amarginal decline in domestic passenger movements.
Greece's international passenger traffic is largelydepending on charter services. Passengers carried oncharter flights accounted for 15.3 out of 26.7 millioninternational passengers in 2006, and enjoyed robustgrowth of 6%.Almost 1/3 of the international charterpassengers (26%) are passing through Heraklionairport, while Rhodes and Kerkyra are the next twoairports in terms of international charter passengers,with 17% and 11% market shares respectively.Theairports enjoying the highest increases in internationalcharter passengers were Chania (+19%), Kefallonia(+12%) and Kos (+11%). In the particular marketsegment,Athens holds a slim 2%, being the only majorairport presenting a decline.The dynamic developmentof low-cost carriers, together with the adequatefrequency of scheduled flights in a wide range ofinternational destinations, are the main contributingfactors behind this development.
Athens International Airport serves the major bulk ofGreece's international scheduled traffic (81%),followed by Thessaloniki Airport (14%), with asubstantive European route network and a specialemphasis on Germany. Heraklion and Kavala alsoserve a number of international scheduleddestinations (acquiring market shares of 3% and 2%respectively in the particular sector).
Athens International Airport claims 39% of Greece'stotal air traffic. However, 2006 was the first year in therecent past that the peripheral Greek airportsmatched and slightly surpassed AIA's growth levels(6.7% vs. 5.6%).This was the result of coordinatedactions taken by all tourist-related authorities,together with the successful campaign of the GreekNational Tourism Organisation, effectively promotingGreece as a whole.
aerostat 2006_geo.qxd 5/2/07 6:57 PM Page 59
60
Passenger Traffic of Main Greek AirportsCOMMERCIAL PASSENGERS
DOMESTIC INTERNATIONAL TOTALCITY 2006 % 2006/2005 2006 % 2006/2005 2006 % 2006/2005Athens 5,464,643 5.8% 9,600,624 5.5% 15,065,267 5.6%Heraklion 1,008,803 10.1% 4,345,566 8.0% 5,354,369 8.4%Thessaloniki 1,475,581 1.6% 2,326,805 5.0% 3,802,386 3.6%Rhodes 803,315 7.8% 2,686,095 9.2% 3,489,410 8.9%Kerkyra/Corfu 272,245 1.3% 1,736,090 1.4% 2,008,335 1.3%Chania 434,330 8.4% 1,326,992 19.2% 1,761,322 16.3%Kos 249,758 -0.9% 1,323,034 9.3% 1,572,792 7.5%Zakinthos 29,994 -0.8% 969,988 2.2% 999,982 2.1%Thira/Santorini 314,515 18.2% 363,533 5.0% 678,048 10.8%Mitilini 352,065 2.8% 137,541 2.5% 489,606 2.7%Other GR airports 1,634,032 7.7% 1,865,626 3.0% 3,499,658 5.1%TOTAL GREECE 12,039,281 6.0% 26,681,894 6.4% 38,721,175 6.3%
aerostat 2006_geo.qxd 5/2/07 6:57 PM Page 60
61
Aircraft Movements of Main Greek AirportsCOMMERCIAL AIRCRAFT MOVEMENTS
DOMESTIC INTERNATIONAL TOTALCITY 2006 % 2006/2005 2006 % 2006/2005 2006 % 2006/2005Athens 85,371 5.0% 94,556 6.2% 179,927 5.6%Thessaloniki 20,921 -1.9% 23,057 1.9% 43,978 0.0%Heraklion 13,633 18.5% 28,352 10.9% 41,985 13.3%Rhodes 12,728 4.2% 17,105 10.6% 29,833 7.8%Kerkyra/Corfu 3,755 -2.7% 11,484 9.0% 15,239 5.9%Chania 6,291 2.3% 8,215 21.1% 14,506 12.1%Kos 4,536 1.9% 8,326 12.4% 12,862 8.5%Mitilini 7,096 4.0% 1,144 6.3% 8,240 4.4%Thira/Santorini 4,931 19.9% 3,159 -0.8% 8,090 10.9%Zakinthos 1,310 5.3% 5,868 2.5% 7,178 3.0%Other GR airports 40,655 3.1% 14,671 4.1% 55,326 3.4%TOTAL GREECE 201,227 4.6% 215,937 7.2% 417,164 5.9%
aerostat 2006_geo.qxd 5/2/07 6:57 PM Page 61

the european and globalaviation industry
aerostat 2006_geo.qxd 5/2/07 6:57 PM Page 62
63
2006 was a successful year for the aviation industryworldwide, with air travel demand consistentlyincreasing. Passenger volumes grew considerably by5.1% around the globe, albeit at a slower pace than theprevious two “recovery” years (10.9% in 2004 and 6.3%in 2005).The increased passenger demand, boosted bybuoyant global economic growth, assisted airlines inpartly offsetting the impact of higher fuel costs.Thisdevelopment, together with the consistentimprovement of the airlines' operational efficiency,resulted in slower yet more profitable growth for theglobal airline industry during 2006.The number ofinternational aircraft movements presented a smallincrease of 1.2%, reflecting the airports' capacityconstraints, as well as the airlines' careful capacitymanagement. Cargo uplift, although affected by highfuel costs and strong competition from other transportmodes, improved its growth rate in 2006, rising by 3.7%(2.5% in 2005).
The Asia/Pacific rim was the region with the highestpassenger growth, achieving an increase of 10.3%,followed by the 8.2% growing Middle East. NorthAmerica, representing 35% of the global air travellers,was the region posting the smallest increase in termsof passenger traffic, at the level of 0.7%, and the onlyregion experiencing a decline in aircraft movementsand cargo uplift.
Europe, accounting for 31% of the world's passengertraffic, enjoyed robust growth of 6.4% in terms ofpassengers, while cargo and flights presented a moremodest increase at the level of 3.6% and 3.4%respectively.As regards the development of the top 10airports according to passenger traffic, it is worthnoting that Barcelona was the airport with the highestgrowth (+10.5%) for a second consecutive year, closelytrailing Rome's Fiumicino, which lost the 7th positionto Munich, while London Heathrow, the busiestEuropean airport, was the only top-10 airportexperiencing a small decline in 2006.AthensInternational Airport continues to hold the 25thposition in Europe according to passenger traffic,ranking 23rd in terms of aircraft movements, and 25thin terms of cargo uplift.
Focusing on the performance of the major Europeanairports (exceeding 10 million passengers per year), it isimportant to note that Athens International Airport'spassenger growth was in accordance and slightly higherthan the European average, while the increase in thenumber of movements placed AIA among the fastestgrowing airports in Europe.
aerostat 2006_geo.qxd 5/2/07 6:57 PM Page 63
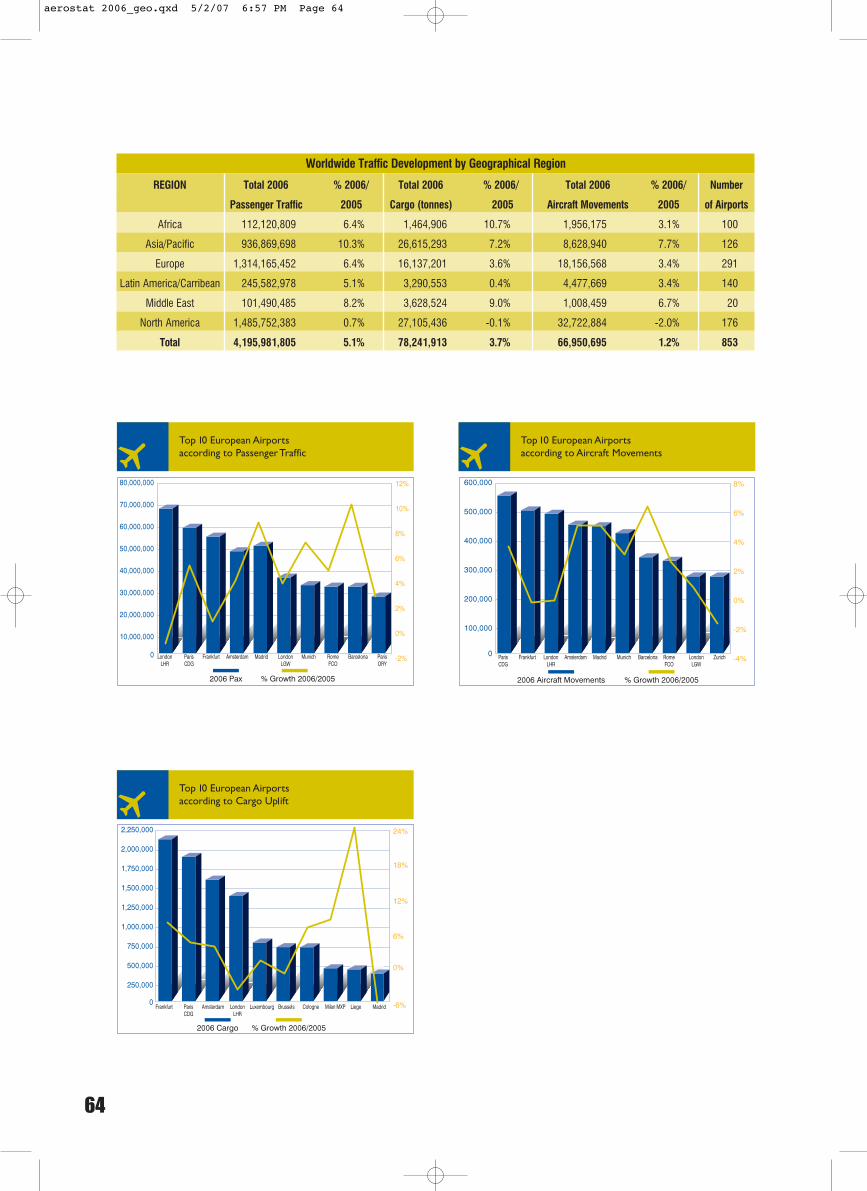
64
Worldwide Traffic Development by Geographical Region
REGION Total 2006 % 2006/ Total 2006 % 2006/ Total 2006 % 2006/ Number
Passenger Traffic 2005 Cargo (tonnes) 2005 Aircraft Movements 2005 of Airports
Africa 112,120,809 6.4% 1,464,906 10.7% 1,956,175 3.1% 100
Asia/Pacific 936,869,698 10.3% 26,615,293 7.2% 8,628,940 7.7% 126
Europe 1,314,165,452 6.4% 16,137,201 3.6% 18,156,568 3.4% 291
Latin America/Carribean 245,582,978 5.1% 3,290,553 0.4% 4,477,669 3.4% 140
Middle East 101,490,485 8.2% 3,628,524 9.0% 1,008,459 6.7% 20
North America 1,485,752,383 0.7% 27,105,436 -0.1% 32,722,884 -2.0% 176
Total 4,195,981,805 5.1% 78,241,913 3.7% 66,950,695 1.2% 853
aerostat 2006_geo.qxd 5/2/07 6:57 PM Page 64
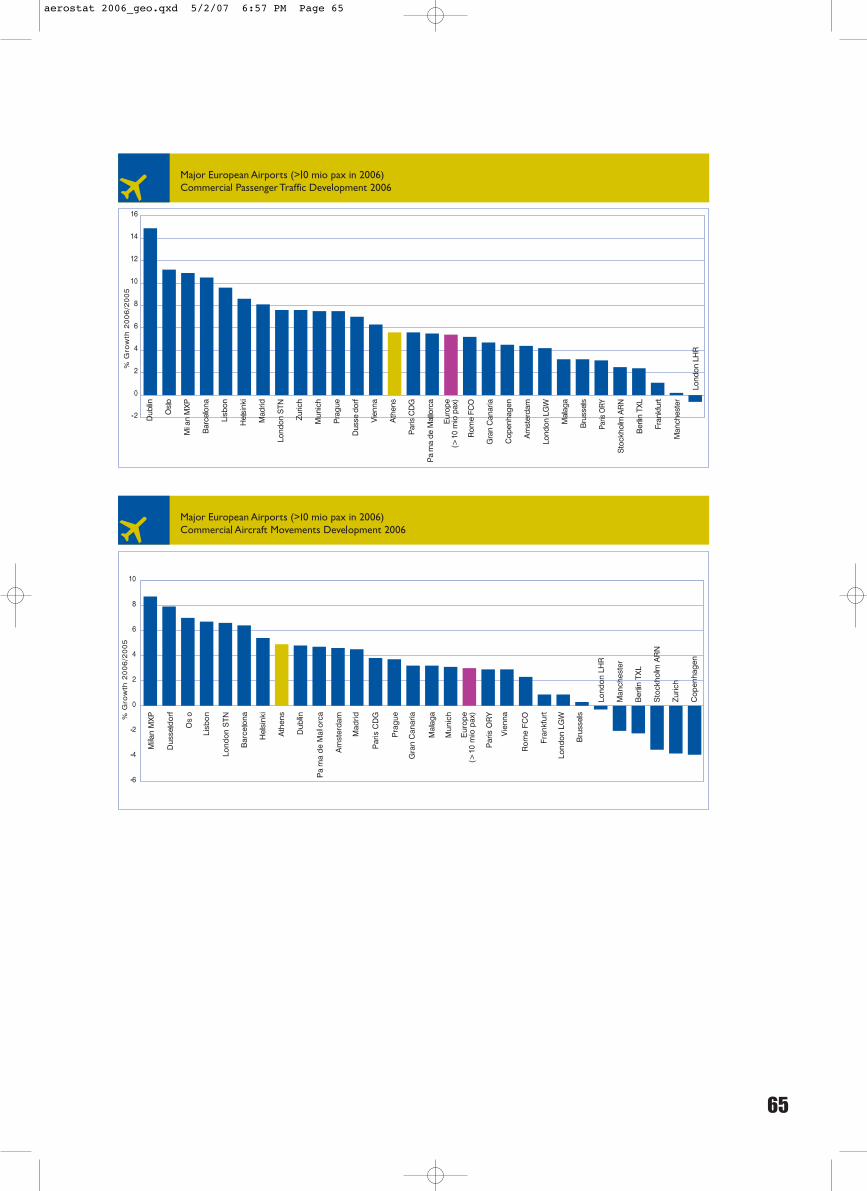
65
aerostat 2006_geo.qxd 5/2/07 6:57 PM Page 65
66
T R A F F I C F I G U R E S
The origin and destination of a flight is definedaccording to the first origin/last destination of theflight.
A passenger's origin/destination is defined according tothe point of embarkation/disembarkation.
The classification into Intra/Extra-Schengen forpassengers and flights is designated according to theflight's last origin/first stop.
The geographical regions are defined according to theACI classification.
Transit Passengers are defined as passengers arrivingto and departing from the airport with the same flightnumber, without leaving the transit area of the airport(direct transit).
Terminal Passengers are arriving and departingpassengers, transit passengers excluded.
All traffic statistical data are measured on UTC andLand/Airborne times.
Traffic data for the peripheral Greek airports arebased on the preliminary traffic results dispatched bythe Hellenic Civil Aviation Authority (HCAA).Thetotal number of Greece's domestic flights andpassengers are double-counted (included in both theairport of origin and the airport of destination).
Worldwide traffic statistics are based on ACIpreliminary traffic results.The ranking of majorEuropean airports is based on ACI's Rapid DataExchange programme.
P U N C T U A L I T Y
A flight is characterised as Delayed if it departs/arrives(off-/on- blocks) 15 or more minutes after thescheduled time of departure/arrival.
Average Delay is calculated in minutes and amongstdelayed flights.
Delay reasons are classified according to IATA DelayCodes, as declared by the airlines and/or handlingagents. It should be noted that statistics presented inthis report should be treated with caution due to thelimited number of delayed flights for which a delayreason is declared. More specifically, the availableresults are based on the 57% of delayed departures forwhich the corresponding reasons have beendispatched to AIA (as compared to 60% in 2005).
Flights considered in the “Punctuality” section are onlypassenger scheduled and charter flights.
PA S S E N G E R P R O F I L E –T O U R I S M D E V E L O P M E N T
Passenger profile and tourism development data derivefrom AIA's “Passengers Survey”.This survey has beenconducted at Athens International Airport for nineconsecutive years, aiming to investigate the demographicand travelling profile of Athens passengers, and depictchanges over the years.The annual sample of the surveyamounts to 39,000 interviews on departing passengers,while the data collection takes place at the departuresgates of the airport on a daily basis.
DEFINITIONS & NOTESA L L F I G U R E S P R E S E N T E D I N T H I S R E P O R T R E F E R T O T H E Y E A R 2 0 0 6
U N L E S S O T H E R W I S E S TAT E D
aerostat 2006_geo.qxd 5/2/07 6:57 PM Page 66

67
S E R V I CV I C E P E R F O R M A N C E
Service Performance relates to:
• Capturing the passengers'/visitors' perceptionregarding the level of services offered (passengercomment management process);
• Measuring actual performance on critical areas(service performance indicators).
Service Performance indicators reflect on those areasof service and facilities that affect the perception of apassenger for the level of the service offered withinthe airport premises.
Thus, for a number of services offered to passengerseither by the Airport Company or by 3rd partyairport users (airlines/handlers), quantifiable indicatorshave been established and are being monitored, in linewith the Corporate Quality programme of AIA.Theseindicators enable us to accurately monitor the level ofservice provided while supporting benchmarking andperformance enhancement activities. Efficientmeasurement of AIA and non-AIA passenger-orientedservices is achieved through effective cross-departmental cooperation.
Check-in, Ticketing and Security QueuesMeasurement of queuing time refers to the timeelapsing from the moment a passenger stands in lineuntil they reach the service point. Measurements aretaken 7 days a week between 06:00 and 22:00 hours.
B a g g a g e R e c l a i mThe measurement of the time between aircraft on-blocks until first bag delivery (Obl-Fb) and betweenfirst-bag delivery until last-bag delivery (Fb-Lb) is astandard method among international airports forassessing baggage reclaim performance, andapproximates the level of service provided.
I n f o D e s kAlthough the info desk queries indicator is not adirect measure of service performance, it shows theeffect of passenger traffic on the information counters.
C a l l C e n t r eCall centre statistics are being produced by thereporting function of the switchboard system.Thedata are taken in 10-second increments, and a 2-minute threshold is being used to assess the trend ofservice performance.
P a s s e n g e r C o m p l a i n t sRefers to complaints related to each of the articles ofthe ACI-Europe Airport Voluntary Commitmentexpressed as a percentage of all the complaint itemsreceived.Athens International Airport, in compliancewith article 10 of the ACI-Europe Airport VoluntaryCommitment, has established an integrated PassengerComplaint Management system.
Airport Services Questionnaire – RatingAIA's passenger comments brochure titled “YourOpinion Counts” features a questionnaire section forthe evaluation of airport services.This section includes18 general service categories, which the passengersrate on a 1 to 5 scale (5 being excellent). In 2006,3,398 passengers in total answered this questionnaire.
aerostat 2006_geo.qxd 5/2/07 6:57 PM Page 67

This Report was printed on elemental chlorine-free paper.
This Report is also available on the Airport Company’s website:www.aia.gr.
aerostat 2006_geo.qxd 5/2/07 6:57 PM Page 68

exo|_stau 5/2/07 6:59 PM Page 7

exo|_stau 5/4/07 5:26 PM Page 2