afc-modeler: a microsoft® excel© workbook program for...
TRANSCRIPT
304
http://journals.tubitak.gov.tr/earth/
Turkish Journal of Earth Sciences Turkish J Earth Sci(2013) 22: 304-319© TÜBİTAKdoi:10.3906/yer-1110-3
AFC-Modeler: a Microsoft® Excel© workbook program for modelling assimilation combined with fractional crystallization (AFC) process in magmatic systems by using
equations of DePaolo (1981)
Mehmet KESKİN*İstanbul University, Faculty of Engineering, Department of Geological Engineering, 34320 Avcılar, İstanbul, Turkey
* Correspondence: [email protected]
1. IntroductionA number of magmatic processes control trace element distributions and isotopic ratios in magmatic systems, including partial melting, fractional crystallization, magma mixing, crustal contamination and assimilation combined with fractional crystallization (AFC). Among these, AFC is of special significance as it is one of the most important processes that exists in many magmatic systems, as proposed by many researchers (e.g. Taylor 1980; DePaolo 1981, Powell 1984; Aitcheson & Forrest 1994; Bohrson & Spera 2001, 2003; Spera & Bohrson 2001, 2002, 2004) since Bowen’s (1928) pioneering work.
A few studies can be identified presenting software that can be used to model magmatic processes, including assimilation. Some of these studies are examined briefly below.
Using the phase equilibria model as a base, Nielsen (1985) developed the EQUIL program that can enable the user to model most low-pressure differentiation processes
involving magma chamber recharge, fractional or equilibria crystallization, assimilation and tapping of the magma chamber. Conrad (1987) produced an interactive FORTRAN 77 computer program that simulated mineral-melt evolution during fractional crystallization, fractional crystallization with melt removal and replenishment, and fractional crystallization with assimilation. Nielsen (1988) used a two-lattice model to calculate melt component activities, allowing the calculation of compositionally independent partition coefficients (D). He produced a program that utilized these compositionally independent D values, TRACE FOR, written in FORTRAN for PCs. This program can be used to calculate the differentiation paths of mafic and intermediate compositions for various combinations of fractional crystallization, assimilation, magma chamber recharge, and tapping. Hagen & Neumann (1990) produced a FORTRAN 77 program implementing the batch- and continuous replenishment models, allowing fractional crystallization, assimilation,
Abstract: AFC-Modeler is a user-friendly, interactive Microsoft Excel workbook program which is specifically designed to model up to ten theoretical AFC curves (corresponding to ten different r values; r being the ratio of mass assimilation rate to fractional crystallization rate) for a set of variables that can be interactively and precisely modified by the user (i.e. D, initial element concentration and isotope ratio in magma and element concentration and isotope ratio in wallrock). Being able to model ten curves for ten different ‘r’ values is an important feature of the program, because results of many studies indicate that the r values for a magmatic suite usually vary widely instead of following a single curve. Particular care has been taken in the design of the program in order to turn rather complex modelling into a simple and error-free procedure by utilizing a specifically designed graphical user interface, consisting of combo boxes placed around a scatter chart which continuously displays up-to-date results of a petrological model. It enables the user of the program to plot elements, ratios of elements and radiogenic (i.e. Sr, Nd and Pb) and stable (δ18O) isotopic ratios against each other. Up to eight data series can be entered into the program and stored on eight separate spreadsheets and then plotted along with the modelled theoretical curves. This enables the user to compare the modelled curves and the trends shown by his/her magma series and hence enables him/her to make interpretations and estimations about the degree of crustal assimilation in magma genesis. The program also has two separate and user-modifiable sheets for storing D values of the elements for basic, intermediate and acid magmas, and storing up to 100 magmatic/crustal end-member compositions, which can be utilized in the modelling. By virtue of these features, the AFC-Modeler program can be used as a useful tool for both research and educational purposes.
Key Words: Petrological modelling, assimilation of crust, Excel spreadsheet, magma-crust interaction
Received: 12.10.2011 Accepted: 29.03.2012 Published Online: 27.02.2013 Printed: 27.03.2013
Research Article
305
KESKİN / Turkish J Earth Sci
and replenishment to be concurrent mechanisms. The aforementioned FORTRAN program is able to handle concurrent modelling of the behaviour of up to ten trace elements in a magma chamber undergoing concurrent fractional crystallization, assimilation and replenishment, or any combination of these processes. D’Orazio (1993) produced a Macintosh basic program for AFC modelling. It should be noted that all these papers presented FORTRAN and Basic programs running under DOS (except for D’Orazio’s 1993 program).
In their pioneering work, Spera & Bohrson (2001) presented a new and more advanced approach to modelling the AFC process, named EC-RAFC (i.e. Energy-Constrained Recharge-Assimilation-Fractional Crystallization). They further developed the new method and also published the results through a series of additional papers (Bohrson & Spera 2001, 2003; Spera & Bohrson 2001, 2002, 2004). In their own words; “EC-RAFC is based on a self-consistent formulation of energy, mass and species conservation for a magma body undergoing assimilation combined with fractional crystallization, with or without recharge” (http://magma.geol.ucsb.edu/papers/ECAFC.html). They also developed Excel Workbook software in order to enable researchers to conduct their models. This spreadsheet, known as the EC-RAFC Program, is currently accessible both at http://magma.geol.ucsb.edu/papers/ECAFC.html and http://earthref.org/EC-RAFC/.
Ersoy & Helvacı (2010) have recently published a useful Excel Spreadsheet program for modelling fractional crystallisation, crustal assimilation and mixing processes in magmatic systems. Their program allows the researchers to model one curve for each of these processes on a single diagram. Although the program enables the users to see and compare the results of four different petrological models on a single diagram, having only one modelled curve for the AFC process appears to be problematic, precisely because in magmatic systems the degree of assimilation usually varies widely (see diagrams in Pearce et al. 1990; Keskin et al. 1998, 2008; Karacık et al. 2008; Cebriá et al. 2011) in time and space, depending on the variations in a number of parameters (e.g., temporal and spatial variations/fluctuations in magma ascent-replenishment-crystallization rates, temperature of the magma and the wall rock, period of residence of magmas in magma chambers, variations in the composition of magmas). Therefore, the r values also vary widely in many magmatic suites and even among the lava units of a single volcano. Hence, the data points (especially those on trace element diagrams) usually do not form well-defined trends on most diagrams of the AFC models (e.g., Pearce et al. 1990). With such a scatter, a single AFC model curve is generally inadequate for petrological interpretations; instead, an array of modelled curves for a set of varying
r-values offers a better choice. That is the primary reason and major contribution of the AFC-Modeler workbook program presented in this paper, which has been designed to handle modelling up to ten AFC curves for ten different r values at a time.
The main advantage of the AFC-Modeler workbook program over the alternative software is its simplicity and careful design that makes a complex AFC model a simple task. It allows the users to generate up to ten theoretical AFC curves corresponding to ten different r values and compare the modelled curves with their own data. As proposed by Holm (1990), there are advantages of using spreadsheet software for petrological modelling: (i) they are rather flexible, fast, customizable and stable, (ii) they do not require problematic data format conversions: instead they allow the users to enter the data directly and (iii) the calculations are almost instantaneous when a parameter changed in a model. However, an Excel workbook program still cannot compete with a fully-fledged computer program specifically designed to model a particular petrological process (e.g. Melts program by Ghiorso & Sack 1995 and Asimow & Ghiorso 1998; see http://melts.ofm-research.org/).
The AFC-Modeler program has been specifically designed to help the users easily produce an AFC model without much need for a thorough knowledge of constructing a complex petrological model. The users can store mineral/melt partition coefficient (Kd) values, compositions of magmatic and crustal end members (up to 100), and their own geochemical data (up to eight magma series each containing 200 columns for analyses). The program is designed to facilitate error-free modelling; it is equipped with warning messages whenever an error occurs. When there is an error, the program stops responding and warns the user with an appropriate message. The users interact with the program using a graphical interface. All the variables/parameters used in the model are always kept visible, easily reachable and modifiable on the screen around a graph which always displays up-to-date results of a model. The program also gives useful information about the most enriched elements (and hence most suitable ones for an AFC model) in the crust relative to their concentration in the primitive magma and displays useful suggestions and warnings for each element. Geochemical data consisting of eight data series can also be plotted beside the modelled AFC curves. This provides a good opportunity for the users to simulate the AFC process, observe the theoretical curves, compare them with natural trends, and eventually test their working hypotheses. The program file occupies around 2.42 Mb of disk space. Owing to the difficulties of obtaining user-friendly software to model the AFC process, the AFC-Modeler software may be of interest to many petrologists
306
KESKİN / Turkish J Earth Sci
producing AFC models and graduate and undergraduate students taking petrology courses.
It should be noted, however, that the results obtained from this kind of a model by using the DePaolo (1981) equations may be regarded as the first approach to the AFC process before getting into the realm of rather more advanced petrological models (e.g., those by Aitcheson & Forrest 1994; EC-AFC of Bohrson & Spera 2001, 2003; Spera & Bohrson 2001, 2002, 2004).
Note also that some coexisting magma series may not be related to each other via an AFC process. For example, they may be derived from different sources and have experienced different fractionation histories (e.g., coexisting evolved and mafic lavas at the volcanic front of the central Mexican Volcanic Belt; Verma 1999). In such cases, irrespective of how advanced and elegant the formulations and software are, the AFC models would not be applicable to such magmatic series at all. Therefore, users of the program should be aware of any possible pitfalls in the theoretical considerations, and know that the AFC models cannot always solve petrological problems of any igneous rock suite.
In this paper the first section deals with previous work on modelling various magmatic processes including the AFC, and presents DePaolo’s (1981) formulations used in the program. The second section focuses on the logic behind the program design. The third section deals with the program structure, followed by the description of the program in the fourth section with special reference to its use. In the fifth section, an application example is presented, followed by a conclusion.
2. Theoretical backgroundBowen (1928) was one of the first researchers to discuss the effects of assimilation during magmatic evolution. He emphasized that assimilation is not only a simple mixing process between two end-members but also involves combined fractional crystallization, which is required by the heat balance of the system. However, the first attempts to develop petrological models which account for some of the isotope and trace element relationships in the volcanic suites focused on describing mathematical equations concerning only the mixing process and ignoring the basic principles indicated by Bowen (1928). Vollmer (1976), Faure et al. (1974), Bell & Powell (1969) and Sun et al. (1975) developed and applied such equations to trace elements and Sr, Pb isotope ratios. O’Hara (1977) examined the geochemical evolution of magmas during fractional crystallization of a periodically refilled magma chamber. Langmuir et al. (1978) further developed a general mixing equation for three possible plots in a two component system (i.e. ratio-ratio, ratio-element, and element-element), and examined the ways to test mixing
and to place limits on the composition of end-members. Equations of Langmuir et al. (1978) were subsequently adapted by DePaolo & Wasserburg (1979) with the edition of epsilon (ε) notation of Nd and Sr isotopes. Allègre & Minster (1978) proposed a large number of models, used by various researchers in solving problems of igneous petrogenesis.
Taylor (1980) pointed out that although wall-rock assimilation and fractional crystallization are often treated separately, heat-balance considerations suggest that these two processes should be coupled. In accordance with Bowen’s argument, he demonstrated that heat required for assimilation can readily be provided by the latent heat of crystallization of the magma. Taylor (1980) showed that the assimilation of the most common rock types by a magma would not drastically change the liquid line of descent of the later magmatic differentiates, at least as far as major element variations are concerned. However, compared to the major elements, the trace elements and particularly the isotopic compositions are very much affected by the combined assimilation-fractional crystallization process. Taylor (1980) calculated the effects of concurrent assimilation and fractional crystallization on the strontium and oxygen isotopic compositions of magma and showed that the resulting ratios are significantly different from those predicted by simple two end-member models. He deduced that this is a three end-member problem at least: namely the magma, the country rocks and the cumulates.
DePaolo (1981) developed a mathematical model which presented the equations for both isotopic and trace element variations and described the contamination of magma by assimilation of wall-rock coupled with concurrent fractional crystallization. He proved that the tenet of the simple mixing model, in which the concentration in the magma would change in the direction of the composition of the wall-rock, was not necessarily true if fractional crystallization was also operating.
He concentrated on showing the variety of trends which can originate when end-members of known chemistry are mixed during fractional crystallization. However, a researcher is usually confronted with the opposite situation. He or she collects a body of isotope and trace element data which may follow various trends. Then, the researcher tries to characterize the chemistry of the end-members of the mixture under consideration. In other words, the primary concern is the characterization of the chemistry of the end-members of the mixture. Usually the main source component, normally of mantle origin, is reasonably easily identified but the ‘contaminant’ is often unknown (Powell 1984). Powell (1984) attempted to resolve this problem by inverting the AFC equations of DePaolo (1981). He derived equations for contours of the ratio of the rate of assimilation to the rate of fractional
307
KESKİN / Turkish J Earth Sci
crystallization in the isotope or trace element region where the contaminant might be located. According to Powell (1984), it is more than likely that AFC usually operates in the evolution of magmas, but unless there is an isotope and/or trace element contrast between magma and contaminant, AFC will not leave a recognizable imprint on the chemistry of magmas. Generally, it is the presence of isotopic variation, correlated with major and trace element chemistry which is diagnostic of AFC (Powell 1984) unless assimilation is decoupled from fractional crystallization (e.g., Cribb & Barton 1996) or there are some propagating errors in the model (i.e. analytical errors and/or errors resulted from the geological field sampling; Verma 1998, 2000).
Because AFC is a common magmatic process, it is not surprising that there are numerous studies in the literature that present the modelling of the AFC process in magmatic systems (e.g., Myers et al. 1984; McBirney et al. 1987; Marsh 1989; Ellam & Harmon 1990; Pearce et al. 1990; Lightfoot et al. 1991; Reiners et al. 1995, 1996; Ort et al. 1996; Keskin et al. 1998, 2006, 2008; Wenzel et al. 2000; Halama et al. 2004; Krienitz et al. 2006; Calderon et al. 2007; Huang et al. 2008; Rivalenti et al. 2008; Schmidt & Grunder 2011; YongSheng & ZhaoChong 2011; Velasco-Tapia & Verma 2012). AFC models have also been utilized on multi-element normalized spidergrams (e.g., Verma 2001) to show how a group of elements vary as a function of a number of parameters in magmatic systems and how these changes are reflected on the multi-element patterns.
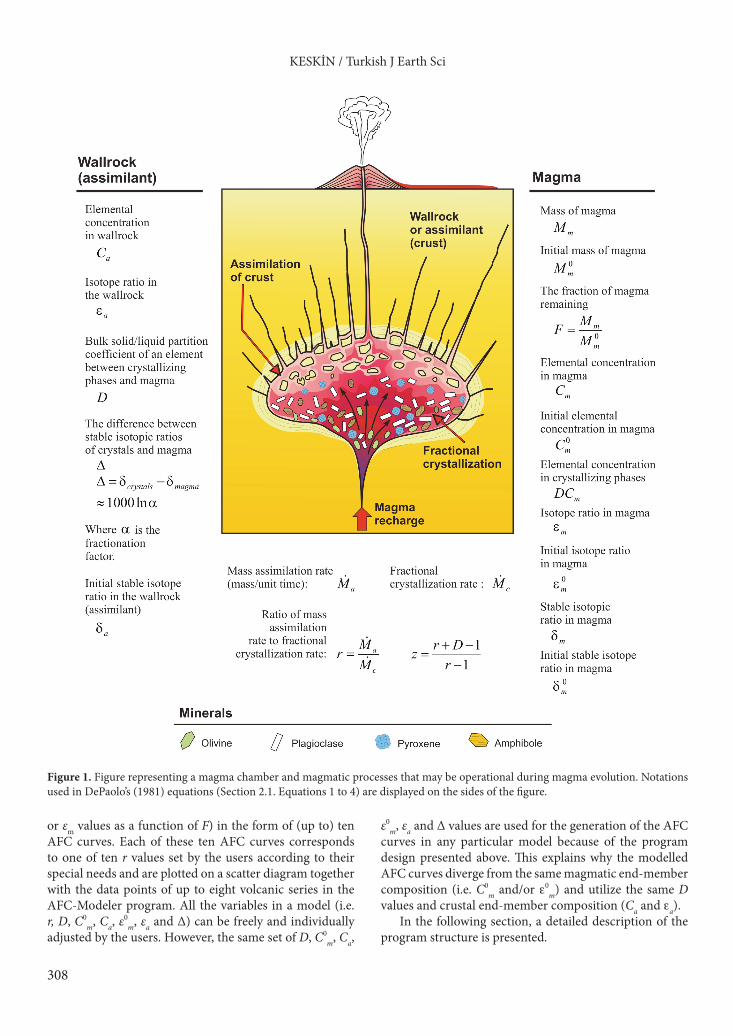
While there are other advanced approaches for modelling the AFC process in magmatic systems, such as those of Aicheson & Forrest (1995), Bohrson & Spera (2001) and Spera & Bohrson (2001, 2002) (i.e. energy-constrained AFC), the models based on DePaolo’s (1981) equations are still popular among petrologists because they provide researchers with useful estimates of the ratio of mass assimilation rate to fractional crystallization rate (i.e. r) in magmatic systems. 2.1. Formulations used in the programNotations used in DePaolo’s (1981) equations are summarized in Figure 1 on the sides of a cartoon representing a magma chamber and the magmatic processes that may be operational during magma evolution, while the equations used in the construction of the AFC-Modeler program are listed below:
General equations for trace elements applicable to most cases:
/
1( )C C F r
rzCC F1– –m m
o z
moa z– –= + ` j (1)
(The formula given above is not applicable to the
special case of r+D=1 and z=0)
/ InC C r
rCC F1
1–m mo
moa= + ` j (2)
(for the special case of r+D=1 and z = 0) For isotopic ratio ε :
( / )C C F1–– – ma m
om m
o
mo z–
f ff f = (3)
Note that ε could be replaced by any isotope ratio
(e.g. 206Pb/204Pb, 87Sr/86Sr) or any normalized parameter describing such ratios (εSr or εNd). In this equation Cm is given by Eq. 1.
For light stable isotopes such as oxygen (i.e. δ18O) there is a possibility of fractionation between the crystallizing phases and magma so that the isotope ratio in the fractionating crystals is displaced from that of the magma by a factor ‘α’ (see Figure 1 for an explanation). In this case the equation becomes:
( 1)( )
1In
rr
zCC
z rD F
rD F r
rzCC
11
11
– – – – –
– – –
m mo a
a mo z
m
a
m
–d d d d D
D
=-
-
`
`
j
j
;
;
E
E
(4)
3. Design of the AFC-Modeler programThe primary aim in the construction of an AFC model is to estimate the crustal involvement in magma genesis of a magmatic suite. Results from many studies in the literature (e.g. Pearce et al. 1990; Keskin et al. 1998, 2006, 2008) have revealed that the r values for a magmatic suite do not usually follow coherent trends; instead they generally vary widely, possibly in time and space. This implies that the amount of assimilation and fractional crystallization can vary widely from energy (temperature and latent heat of crystallization) and chemistry considerations, as Verma & Andaverde (2007) showed in their 3-D in-situ AFC model, although much work remains to be done regarding these lines. In such cases, Spera and Bohrson’s energy-constrained AFC systematics (Bohrson & Spera 2001, 2003; Spera & Bohrson 2001, 2002, 2004) may give useful results for the degree of crustal assimilation.
Because the r values usually vary widely, as discussed previously, it is plausible to construct a program in a way that enables the users to model a set of AFC curves corresponding to a set of different r values, instead of modelling only one or two AFC curves. This way, the users of the program can make useful estimates of the range of r values for their volcanic sequences.
In the light of these observations, the AFC-Modeler program presented in this paper has been specifically designed to enable the magma composition for different degrees of fractional crystallization to be modelled (i.e. Cm
308
KESKİN / Turkish J Earth Sci
Figure 1. Figure representing a magma chamber and magmatic processes that may be operational during magma evolution. Notations used in DePaolo’s (1981) equations (Section 2.1. Equations 1 to 4) are displayed on the sides of the figure.
or εm values as a function of F) in the form of (up to) ten AFC curves. Each of these ten AFC curves corresponds to one of ten r values set by the users according to their special needs and are plotted on a scatter diagram together with the data points of up to eight volcanic series in the AFC-Modeler program. All the variables in a model (i.e. r, D, C0
m, Ca, ε0
m, εa and Δ) can be freely and individually adjusted by the users. However, the same set of D, C0
m, Ca,
ε0m, εa and Δ values are used for the generation of the AFC
curves in any particular model because of the program design presented above. This explains why the modelled AFC curves diverge from the same magmatic end-member composition (i.e. C0
m and/or e0m) and utilize the same D
values and crustal end-member composition (Ca and ea). In the following section, a detailed description of the
program structure is presented.
309
KESKİN / Turkish J Earth Sci
4. Program structureThe AFC-Modeler program is composed of 15 dynamically linked spreadsheets combined in a workbook. These sheets can be combined into four main sections: (1) Control (GUI: Graphical User Interface), (2) Output, (3) Input, and (4) Info.
The Control section is represented by a single sheet which includes all the graphical user interface units for constructing an AFC model. The Output section contains three sheets: Enrichment, Summary and Graph. Results of the model or some calculations related to the model are illustrated on these three sheets. The Input section is made up of ten spreadsheets designed to store end-member compositions (i.e. End member DB), D values (i.e. D DBase) and geochemical data of up to 8 different volcanic series (i.e. sheets are named DS 1 to DS 8; DS stands for “Data Series”). Each of these sheets has a particular function, as explained in the following paragraphs (see also Table 1). Note that, except for cells used for setting parameters and storing data, most cells on these sheets are write-protected in order to maintain the integrity of the program. The D values stored on the sheet named “D Dbase” are broadly accurate values and completely modifiable by the user. Note that D values are very important parameters of the AFC model because even small changes in them can drastically change the patterns of the modelled curves. Therefore, users of the program should take special care in selecting the most appropriate Kd values from the literature and calculating the D (bulk partition coefficients) for each element by using the percentage of each mineral in the phase combination and then entering the values onto the sheet named “D Dbase”. The “FC-Modeler” program by Keskin (2002) can readily be used in these calculations. A good compilation of Kd values with statistical evaluation is presented in Torres-Alvarado et al. (2003), and also in the www.earthref.org website (i.e. GERM Kd database).
Special care has been taken in the design of the program to make an AFC model a simple task by putting the modelling graph in the middle of the program (i.e. “AFC Modelling” sheet) and surrounding it with all the control units (i.e. combo boxes, info areas and warning messages; Figure 2). In this way, all the variables used in the model are always kept visible and easily accessible on the screen around the modelling graph which consistently displays up-to-date results of a model (Figure 2). Note that if a parameter is irrelevant in a particular model (e.g. D value which is not applicable for the oxygen isotopic ratios), the control unit related to that parameter becomes invisible. The parameters D, C0
m, Ca, e0
m and ea can be manually modified by the user by typing values into the cells that appear next to the combo boxes. The positions and shapes of the modelled curves/trends are controlled by the values of these parameters in AFC models. The
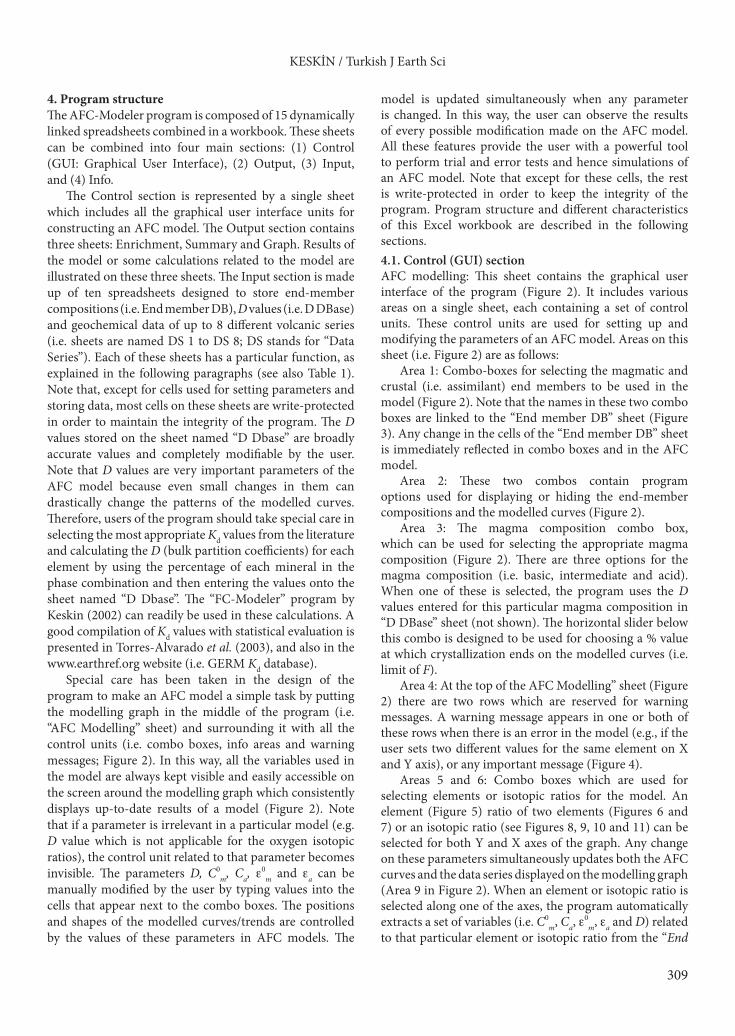
model is updated simultaneously when any parameter is changed. In this way, the user can observe the results of every possible modification made on the AFC model. All these features provide the user with a powerful tool to perform trial and error tests and hence simulations of an AFC model. Note that except for these cells, the rest is write-protected in order to keep the integrity of the program. Program structure and different characteristics of this Excel workbook are described in the following sections.4.1. Control (GUI) sectionAFC modelling: This sheet contains the graphical user interface of the program (Figure 2). It includes various areas on a single sheet, each containing a set of control units. These control units are used for setting up and modifying the parameters of an AFC model. Areas on this sheet (i.e. Figure 2) are as follows:
Area 1: Combo-boxes for selecting the magmatic and crustal (i.e. assimilant) end members to be used in the model (Figure 2). Note that the names in these two combo boxes are linked to the “End member DB” sheet (Figure 3). Any change in the cells of the “End member DB” sheet is immediately reflected in combo boxes and in the AFC model.
Area 2: These two combos contain program options used for displaying or hiding the end-member compositions and the modelled curves (Figure 2).
Area 3: The magma composition combo box, which can be used for selecting the appropriate magma composition (Figure 2). There are three options for the magma composition (i.e. basic, intermediate and acid). When one of these is selected, the program uses the D values entered for this particular magma composition in “D DBase” sheet (not shown). The horizontal slider below this combo is designed to be used for choosing a % value at which crystallization ends on the modelled curves (i.e. limit of F).
Area 4: At the top of the AFC Modelling” sheet (Figure 2) there are two rows which are reserved for warning messages. A warning message appears in one or both of these rows when there is an error in the model (e.g., if the user sets two different values for the same element on X and Y axis), or any important message (Figure 4).
Areas 5 and 6: Combo boxes which are used for selecting elements or isotopic ratios for the model. An element (Figure 5) ratio of two elements (Figures 6 and 7) or an isotopic ratio (see Figures 8, 9, 10 and 11) can be selected for both Y and X axes of the graph. Any change on these parameters simultaneously updates both the AFC curves and the data series displayed on the modelling graph (Area 9 in Figure 2). When an element or isotopic ratio is selected along one of the axes, the program automatically extracts a set of variables (i.e. C0
m, Ca, e0
m, ea and D) related to that particular element or isotopic ratio from the “End
310
KESKİN / Turkish J Earth Sci
member DB” (Figure 3) and “D DBase” sheets, depending on which end-member compositions are selected using the combos in Area 1. Numeric values of these parameters are displayed to the left of the Y axis and below the X axis of the modelling graph. The pale green, yellow and orange cells on the left of Areas 13-15 (Figure 2) correspond to C0
m, D and Ca variables respectively. Note that the user can manually modify any of these values by typing numbers into empty grey cells located on the left of these coloured cells. Any value typed into these cells overrides the data in
the program (e.g. Figure 7 shows that D value for Ta has been modified and Ca is to be modified). This provides the user with a simulation power to conduct trial and error tests.
Area 7: This area contains ten combo boxes (Figure 2) which are designed for setting “r” values (Figure 1) for each of the ten modelled curves. The values in these boxes range between 0 and 0.99. Note that if the user selects “n/a” in one of these combos, that particular curve will not be displayed in the model.
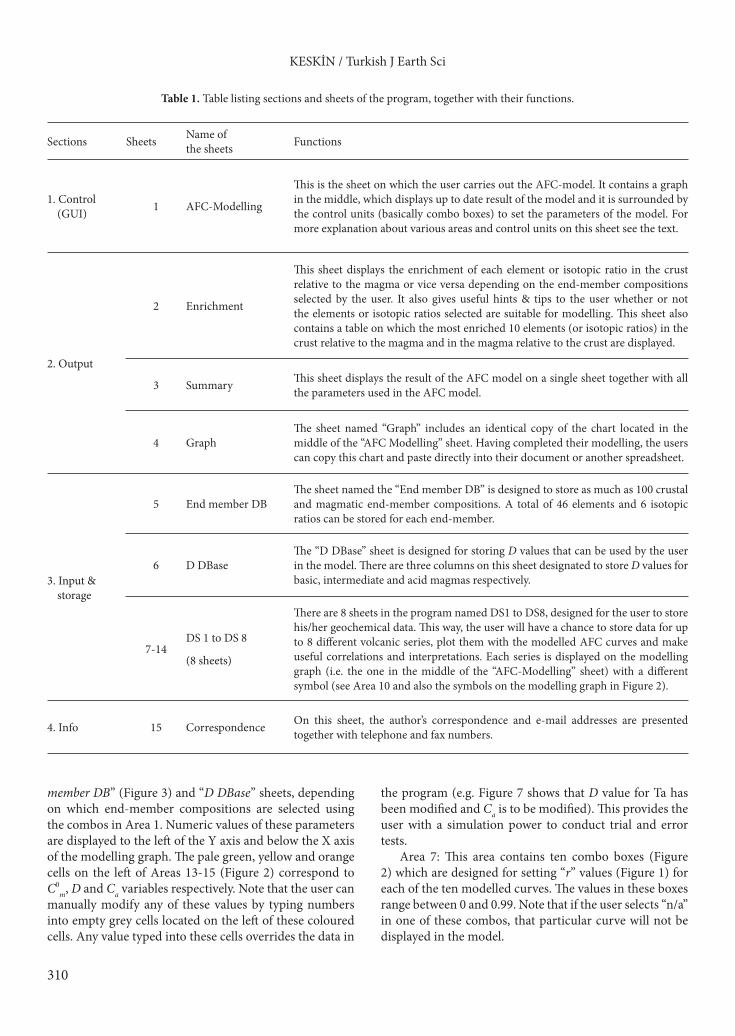
Table 1. Table listing sections and sheets of the program, together with their functions.
Sections Sheets Name ofthe sheets Functions
1. Control (GUI) 1 AFC-Modelling
This is the sheet on which the user carries out the AFC-model. It contains a graph in the middle, which displays up to date result of the model and it is surrounded by the control units (basically combo boxes) to set the parameters of the model. For more explanation about various areas and control units on this sheet see the text.
2. Output
2 Enrichment
This sheet displays the enrichment of each element or isotopic ratio in the crust relative to the magma or vice versa depending on the end-member compositions selected by the user. It also gives useful hints & tips to the user whether or not the elements or isotopic ratios selected are suitable for modelling. This sheet also contains a table on which the most enriched 10 elements (or isotopic ratios) in the crust relative to the magma and in the magma relative to the crust are displayed.
3 Summary This sheet displays the result of the AFC model on a single sheet together with all the parameters used in the AFC model.
4 GraphThe sheet named “Graph” includes an identical copy of the chart located in the middle of the “AFC Modelling” sheet. Having completed their modelling, the users can copy this chart and paste directly into their document or another spreadsheet.
3. Input & storage
5 End member DBThe sheet named the “End member DB” is designed to store as much as 100 crustal and magmatic end-member compositions. A total of 46 elements and 6 isotopic ratios can be stored for each end-member.
6 D DBaseThe “D DBase” sheet is designed for storing D values that can be used by the user in the model. There are three columns on this sheet designated to store D values for basic, intermediate and acid magmas respectively.
7-14DS 1 to DS 8
(8 sheets)
There are 8 sheets in the program named DS1 to DS8, designed for the user to store his/her geochemical data. This way, the user will have a chance to store data for up to 8 different volcanic series, plot them with the modelled AFC curves and make useful correlations and interpretations. Each series is displayed on the modelling graph (i.e. the one in the middle of the “AFC-Modelling” sheet) with a different symbol (see Area 10 and also the symbols on the modelling graph in Figure 2).
4. Info 15 Correspondence On this sheet, the author’s correspondence and e-mail addresses are presented together with telephone and fax numbers.
311
KESKİN / Turkish J Earth Sci
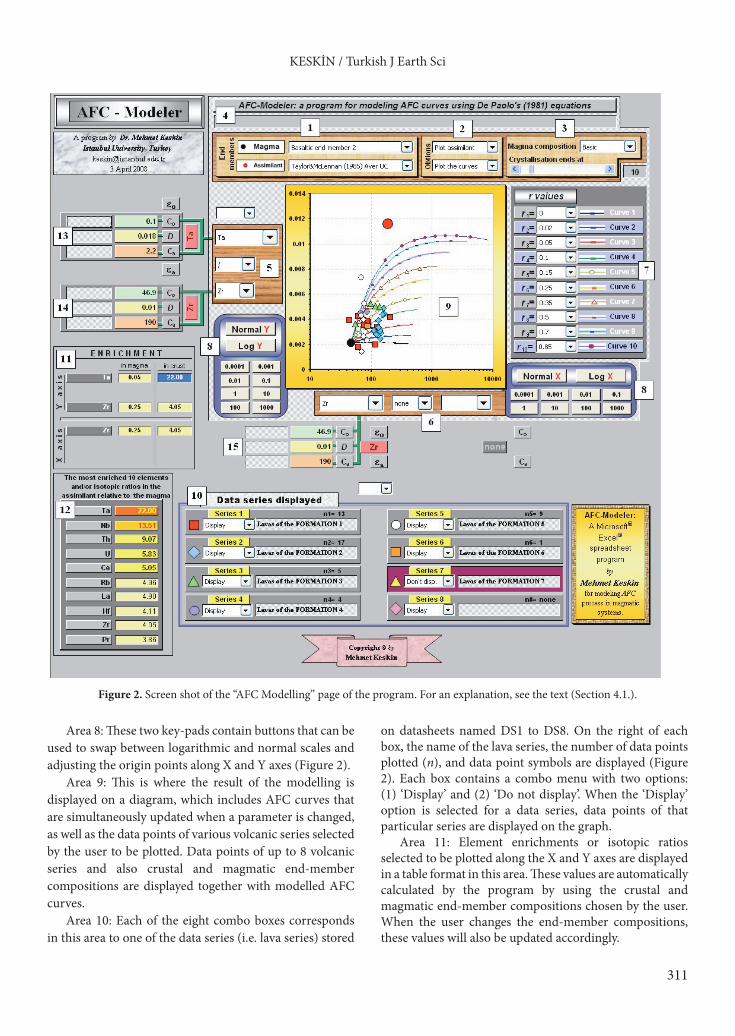
Area 8: These two key-pads contain buttons that can be used to swap between logarithmic and normal scales and adjusting the origin points along X and Y axes (Figure 2).
Area 9: This is where the result of the modelling is displayed on a diagram, which includes AFC curves that are simultaneously updated when a parameter is changed, as well as the data points of various volcanic series selected by the user to be plotted. Data points of up to 8 volcanic series and also crustal and magmatic end-member compositions are displayed together with modelled AFC curves.
Area 10: Each of the eight combo boxes corresponds in this area to one of the data series (i.e. lava series) stored
on datasheets named DS1 to DS8. On the right of each box, the name of the lava series, the number of data points plotted (n), and data point symbols are displayed (Figure 2). Each box contains a combo menu with two options: (1) ‘Display’ and (2) ‘Do not display’. When the ‘Display’ option is selected for a data series, data points of that particular series are displayed on the graph.
Area 11: Element enrichments or isotopic ratios selected to be plotted along the X and Y axes are displayed in a table format in this area. These values are automatically calculated by the program by using the crustal and magmatic end-member compositions chosen by the user. When the user changes the end-member compositions, these values will also be updated accordingly.
Figure 2. Screen shot of the “AFC Modelling” page of the program. For an explanation, see the text (Section 4.1.).
312
KESKİN / Turkish J Earth Sci
Area 12: This area lists the most enriched ten elements in the crust relative to the magma in descending order. As with the values in area 10, the values in this area reflect the ratios of crustal and magmatic end-member compositions selected by the user.
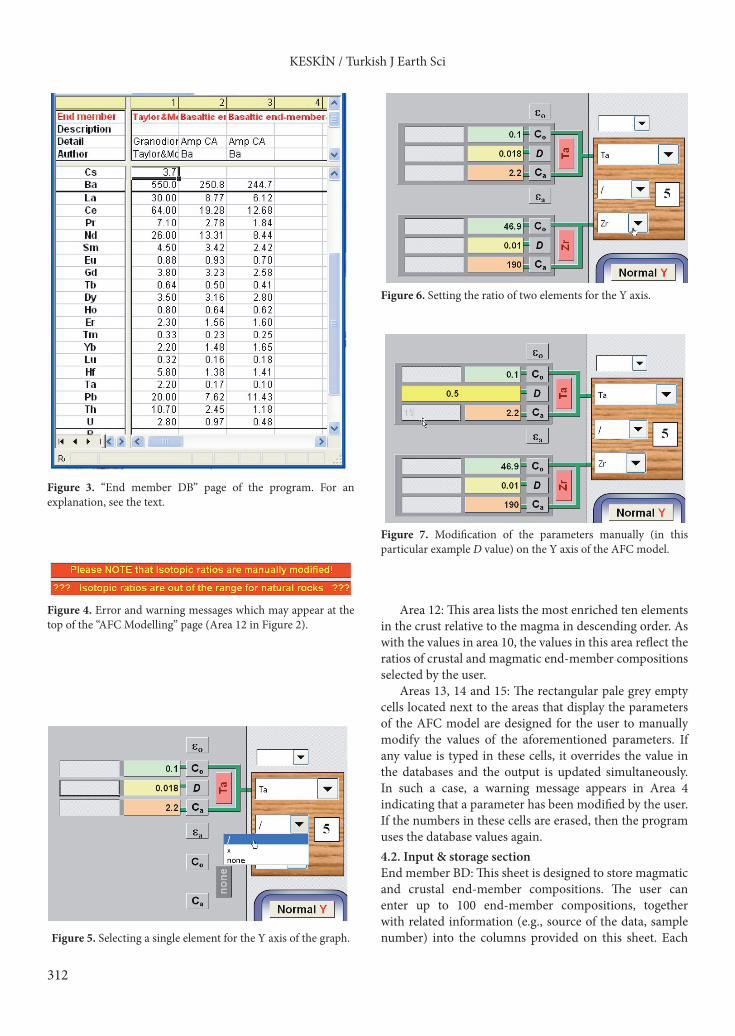
Areas 13, 14 and 15: The rectangular pale grey empty cells located next to the areas that display the parameters of the AFC model are designed for the user to manually modify the values of the aforementioned parameters. If any value is typed in these cells, it overrides the value in the databases and the output is updated simultaneously. In such a case, a warning message appears in Area 4 indicating that a parameter has been modified by the user. If the numbers in these cells are erased, then the program uses the database values again. 4.2. Input & storage sectionEnd member BD: This sheet is designed to store magmatic and crustal end-member compositions. The user can enter up to 100 end-member compositions, together with related information (e.g., source of the data, sample number) into the columns provided on this sheet. Each
Figure 3. “End member DB” page of the program. For an explanation, see the text.
Figure 4. Error and warning messages which may appear at the top of the “AFC Modelling” page (Area 12 in Figure 2).
Figure 6. Setting the ratio of two elements for the Y axis.
Figure 7. Modification of the parameters manually (in this particular example D value) on the Y axis of the AFC model.
Figure 5. Selecting a single element for the Y axis of the graph.

313
KESKİN / Turkish J Earth Sci
column contains 52 cells to store geochemical data (i.e. 10 major oxides, 36 trace elements and 6 isotopic ratios). The row named “End member” is linked to the crustal and magmatic end-member combo boxes on the “AFC Modelling” sheet (Area 1 in Figure 2). Any change in the cells along the row named “End member” updates the contents of the end-member combo boxes (Area 1 on the “AFC Modelling” sheet in Figure 2). Similarly, any change in data cells on this sheet automatically updates the AFC model. To be able to use these values in the AFC model, the user needs to select the appropriate crustal and magmatic end-member compositions from these combo boxes on the “AFC Modelling” sheet (see Area 1 in Figure 2 named ‘end-members’).
DBase: This sheet is designed to store bulk partition coefficient values (Ds) used in the AFC model and contains three columns for basic, intermediate and acid magma compositions respectively. These three compositions are linked to a combo box named “Magma composition” and are located at top right of the “AFC Modelling” sheet (Area 3 in Figure 2). When the user selects a magma composition from this combo box, the program automatically extracts the right values and updates the model simultaneously, taking the element or isotopic ratios selected by the user into consideration.
Sheets DS 1 to DS 8: This module is composed of eight sheets named in accordance with the number of data series, such as “DS 1” to “DS 8”. These are reserved for the user to enter, modify and store geochemical data and have the data plotted beside the modelled AFC curves representing theoretical AFC paths. This provides a good opportunity for users to test and constrain a working
hypothesis by comparing the modelled theoretical AFC curves with the distribution of their data series. Each of these data series are displayed by various symbols. Each series (namely sheets) can hold up to 200 analyses for 10 major oxides, 36 trace elements and 6 isotopic ratios. Therefore, potentially a total of up to 1600 data points can be plotted on a single graph besides modelled AFC curves. The users can also choose which data series will be displayed in their modelling by using the combo boxes on the AFC Modelling” sheet (see Area 10 in Figure 2).4.3. Output sectionEnrichment: This sheet contains a table which is designed to give useful information about the enrichment of each element and isotopic ratio in the crust relative to their values in the magma. These enrichment values are automatically calculated by the program by taking magmatic and crustal end-member compositions into account. Note that the crustal and magmatic end-member compositions are displayed at the top of the sheet together with some other information (e.g., description, details, author names). Also note that these are the ones selected by the user using the appropriate combos (i.e. Area 1 in Figure 2) on the “AFC Modelling” sheet as explained earlier. Note that higher enrichment values are highlighted on this table with various colours depending on the value (values greater than 10 are yellow, those between 10 and 5 are green etc.). The aforementioned table also gives useful hints and tips for the suitability of each element and isotopic ratio for modelling AFC (e.g., if a particular element is prone to alteration or is strongly partitioned in a particular mineral). The sheet named “Enrichment” also contains two other small tables that display the most enriched 10 elements in the crust and magma in descending order, located at the upper right of the sheet. None of the areas on this sheet are user-modifiable.
Summary: This sheet presents the summary of the AFC model on a single sheet in a consolidated form. All the
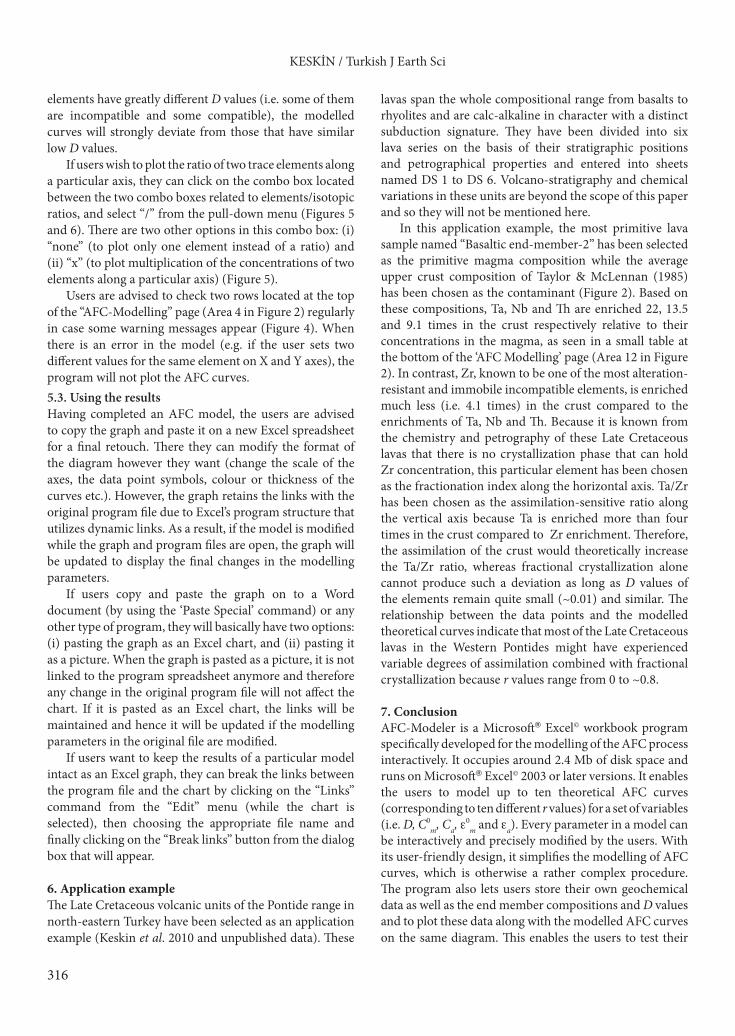
Figure 8. Screen shot of the program when 87Sr/86Sr isotopic ratio is selected along the Y axis of the diagram.
Figure 9. Screen shot of the AFC Modelling page when d18O is selected along the Y axis of the diagram.
314
KESKİN / Turkish J Earth Sci
parameters of the model, together with the calculated Cm (when traces are used in the model) and/or εm values for various values of r are displayed in a tabular form, together with a graph on which AFC curves and the data points of the lava series are plotted. This graph is an exact copy of the graph located in the middle of the “AFC Modelling” sheet. None of the areas on this sheet are user modifiable.
Graph: This sheet presents an Excel chart containing the modelled AFC curves and data series together with a legend. It is identical to the graph on the “AFC Modelling” sheet (i.e. the one that comprises the user interface of the program). The users can copy this card and paste directly into their document or another spreadsheet after completing their modelling. After pasting on another file, the users can format this graph and make necessary modifications depending on their aim. The graph produces a graphic output of publishable quality.4.4. Info sectionCorrespondence: This sheet displays the author’s address, telephone/fax numbers and e-mail address for further correspondence.
5. Use of the programBecause some macros are used in the program, it is recommended that the users lower the security level in order to be able to run them, or the program may malfunction. They can do this by selecting the “Macro” command from the Tools menu (Security submenu) and setting the security level from “Very High” or “High” to Medium (or Low) by clicking the Medium radio button. They also need to close the file and any other instances of the application currently running on the computer, open the file again and then click the “Enable” button when prompted to allow for the unsigned macro to run. The users should neither delete nor modify any of the macros of the program, as such an attempt may cause program malfunction. Neither should the graph in the centre of the “AFC Modelling” page be modified, as doing so may terminally damage the program. The procedure that users
need to follow for a successful AFC model is presented in the following paragraphs.5.1. Data Entry Users of the program are required to enter their own data and the necessary modelling parameters to the appropriate sheets of the program before commencing a new AFC model. In order to do this, they need to divide their geochemical data into a number of data series if more than one lava unit is present and then enter these data onto the spreadsheets provided (i.e. DS 1 to DS 8). Note that some test data (i.e. the elements Rb, Zr, Nb, Ta) have already been entered into data sheets DS1 to DS6. Program users should take special care about the cleaning of these test data on the data sheets prior to entering their own data to circumvent any possible mistakes. This can be done by selecting cells containing previous data and pressing the Delete key on the keyboard. Users also need to enter possible end-member compositions into the “End member DB” sheet (Figure 3) and modify the bulk partition coefficient (D) values on the “D DBase” sheet for basic, intermediate and acid magma compositions. Note that the order of elements / isotopic ratios are identical and write-protected on all these sheets, and so they cannot be modified by the user (in order to keep the integrity of the program). Therefore the users are required to enter their data in the order provided on these pages. Note that both crustal and magmatic end-member compositions are entered into the columns of the same sheet.
To avoid any format loss on these data sheets, users are advised to use the “Values” option from the “Paste Special” command rather than using only the “Paste” command when they intend to transfer data from another Excel file into the data sheets of the program. If users need software to calculate bulk partition coefficient (D) values using a set of Kd values for a particular mineral phase combination crystallized from a particular magma composition, they may use the “FC-Modeler” program (Keskin 2002). It should also be noted that the www.earthref.org website provides an excellent Kd database (i.e. GERM Kd database) for petrologists. A good compilation is also presented in Torres-Alvarado et al. (2003). 5.2. Modelling AFCCrustal and magmatic end-member compositions: Having completed the data entry, the next step is to select
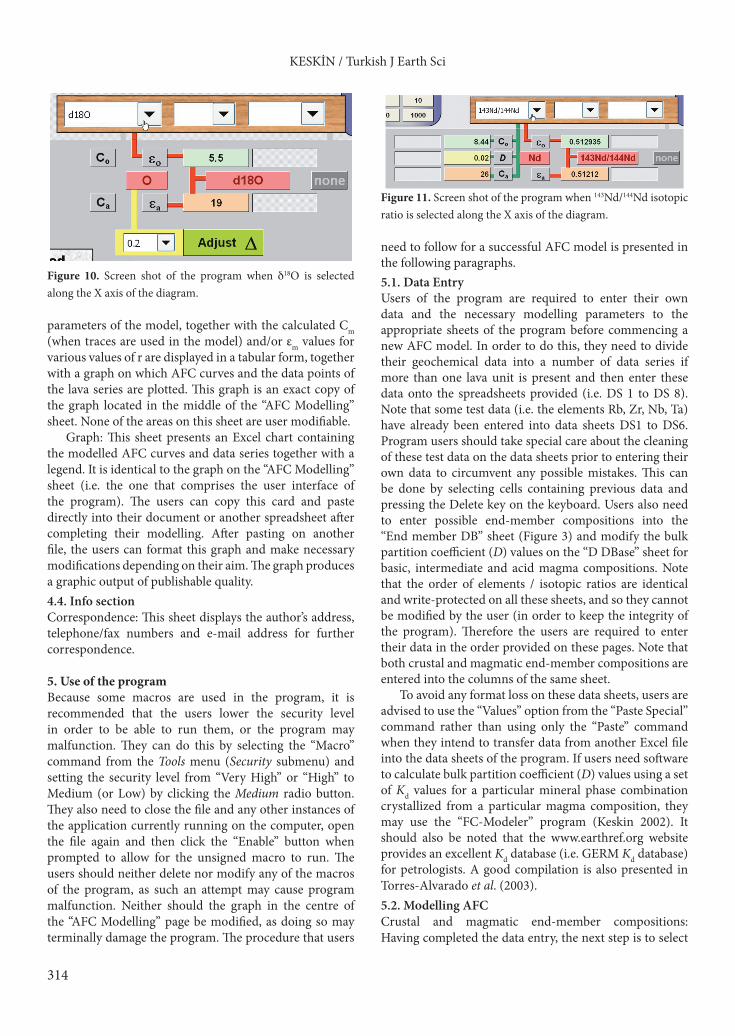
Figure 11. Screen shot of the program when 143Nd/144Nd isotopic ratio is selected along the X axis of the diagram.
Figure 10. Screen shot of the program when d18O is selected along the X axis of the diagram.
315
KESKİN / Turkish J Earth Sci
the crustal (i.e. assimilant) and magmatic end-member compositions by using ‘magma’ and ‘assimilant’ combo boxes at the top of the “AFC Modelling” page (Area 1 in Figure 2). In a volcanic suite, the most primitive lava sample is generally regarded as the magmatic end-member composition, while the average composition of the crustal basement units is regarded as the assimilant composition. In the absence of the latter, users may utilize an appropriate crustal composition from the literature (e.g., Taylor & McLennan 1981, 1985 or Weaver & Tarney 1984), but they should be aware of the possible pitfalls of doing so.
Setting the elements and/or isotopic ratios: After selecting the end-member compositions, the users need to choose elements and/or isotopic ratios for their model by using the combos around the modelling graph on the “AFC Modelling” sheet (Areas: 5 and 6 in Figure 2, also see Figures 5 to 11). This is possibly the most critical stage because the success of a particular AFC model primarily depends on the appropriateness of the elements or isotopic ratios as well as other variables (e.g., D and end-member compositions) selected by the users. Note that when users select an element using one of these combo boxes, the program automatically extracts the correct C0
m and Ca values from the “End member DB” and updates the model on the basis of these values. These values are displayed in the green (i.e. C0
m) and orange (i.e. Ca) cells together with the name of the elements next to the combo boxes. Note that the green embossed lines which connect the combo boxes to the corresponding cells that display C0
m and Ca values become visible for ease of use.
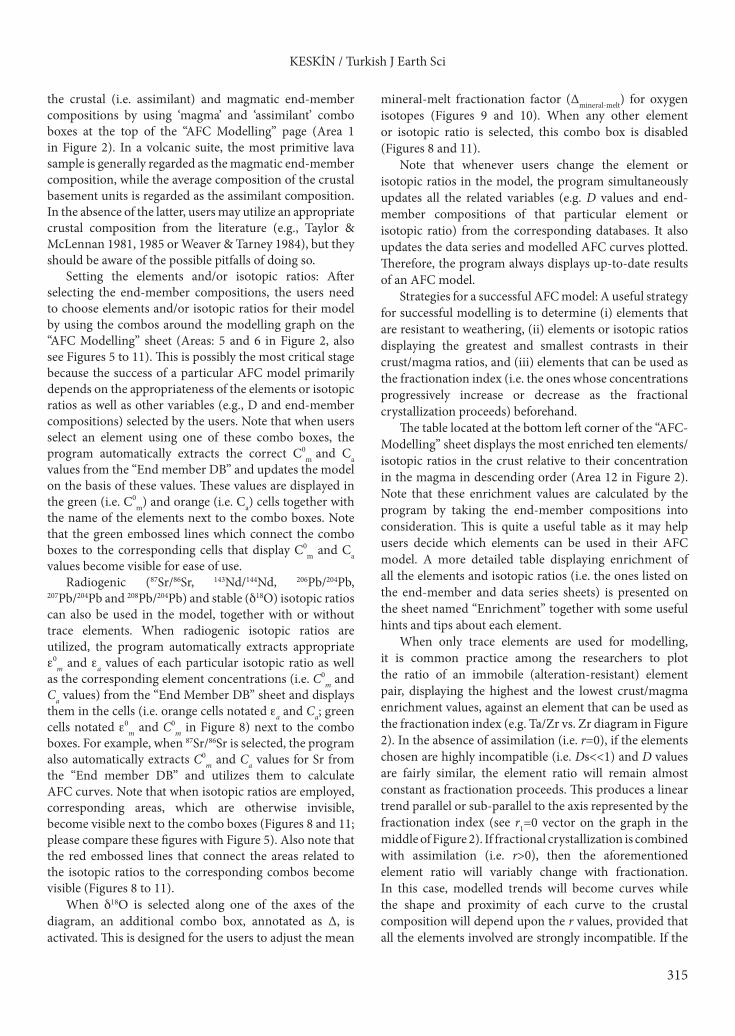
Radiogenic (87Sr/86Sr, 143Nd/144Nd, 206Pb/204Pb, 207Pb/204Pb and 208Pb/204Pb) and stable (d18O) isotopic ratios can also be used in the model, together with or without trace elements. When radiogenic isotopic ratios are utilized, the program automatically extracts appropriate e0
m and ea values of each particular isotopic ratio as well as the corresponding element concentrations (i.e. C0
m and Ca values) from the “End Member DB” sheet and displays them in the cells (i.e. orange cells notated ea and Ca; green cells notated e0
m and C0m in Figure 8) next to the combo
boxes. For example, when 87Sr/86Sr is selected, the program also automatically extracts C0
m and Ca values for Sr from the “End member DB” and utilizes them to calculate AFC curves. Note that when isotopic ratios are employed, corresponding areas, which are otherwise invisible, become visible next to the combo boxes (Figures 8 and 11; please compare these figures with Figure 5). Also note that the red embossed lines that connect the areas related to the isotopic ratios to the corresponding combos become visible (Figures 8 to 11).
When d18O is selected along one of the axes of the diagram, an additional combo box, annotated as ∆, is activated. This is designed for the users to adjust the mean
mineral-melt fractionation factor (Δmineral-melt) for oxygen isotopes (Figures 9 and 10). When any other element or isotopic ratio is selected, this combo box is disabled (Figures 8 and 11).
Note that whenever users change the element or isotopic ratios in the model, the program simultaneously updates all the related variables (e.g. D values and end-member compositions of that particular element or isotopic ratio) from the corresponding databases. It also updates the data series and modelled AFC curves plotted. Therefore, the program always displays up-to-date results of an AFC model.
Strategies for a successful AFC model: A useful strategy for successful modelling is to determine (i) elements that are resistant to weathering, (ii) elements or isotopic ratios displaying the greatest and smallest contrasts in their crust/magma ratios, and (iii) elements that can be used as the fractionation index (i.e. the ones whose concentrations progressively increase or decrease as the fractional crystallization proceeds) beforehand.
The table located at the bottom left corner of the “AFC-Modelling” sheet displays the most enriched ten elements/isotopic ratios in the crust relative to their concentration in the magma in descending order (Area 12 in Figure 2). Note that these enrichment values are calculated by the program by taking the end-member compositions into consideration. This is quite a useful table as it may help users decide which elements can be used in their AFC model. A more detailed table displaying enrichment of all the elements and isotopic ratios (i.e. the ones listed on the end-member and data series sheets) is presented on the sheet named “Enrichment” together with some useful hints and tips about each element.
When only trace elements are used for modelling, it is common practice among the researchers to plot the ratio of an immobile (alteration-resistant) element pair, displaying the highest and the lowest crust/magma enrichment values, against an element that can be used as the fractionation index (e.g. Ta/Zr vs. Zr diagram in Figure 2). In the absence of assimilation (i.e. r=0), if the elements chosen are highly incompatible (i.e. Ds<<1) and D values are fairly similar, the element ratio will remain almost constant as fractionation proceeds. This produces a linear trend parallel or sub-parallel to the axis represented by the fractionation index (see r1=0 vector on the graph in the middle of Figure 2). If fractional crystallization is combined with assimilation (i.e. r>0), then the aforementioned element ratio will variably change with fractionation. In this case, modelled trends will become curves while the shape and proximity of each curve to the crustal composition will depend upon the r values, provided that all the elements involved are strongly incompatible. If the
316
KESKİN / Turkish J Earth Sci
elements have greatly different D values (i.e. some of them are incompatible and some compatible), the modelled curves will strongly deviate from those that have similar low D values.
If users wish to plot the ratio of two trace elements along a particular axis, they can click on the combo box located between the two combo boxes related to elements/isotopic ratios, and select “/” from the pull-down menu (Figures 5 and 6). There are two other options in this combo box: (i) “none” (to plot only one element instead of a ratio) and (ii) “x” (to plot multiplication of the concentrations of two elements along a particular axis) (Figure 5).
Users are advised to check two rows located at the top of the “AFC-Modelling” page (Area 4 in Figure 2) regularly in case some warning messages appear (Figure 4). When there is an error in the model (e.g. if the user sets two different values for the same element on X and Y axes), the program will not plot the AFC curves. 5.3. Using the resultsHaving completed an AFC model, the users are advised to copy the graph and paste it on a new Excel spreadsheet for a final retouch. There they can modify the format of the diagram however they want (change the scale of the axes, the data point symbols, colour or thickness of the curves etc.). However, the graph retains the links with the original program file due to Excel’s program structure that utilizes dynamic links. As a result, if the model is modified while the graph and program files are open, the graph will be updated to display the final changes in the modelling parameters.
If users copy and paste the graph on to a Word document (by using the ‘Paste Special’ command) or any other type of program, they will basically have two options: (i) pasting the graph as an Excel chart, and (ii) pasting it as a picture. When the graph is pasted as a picture, it is not linked to the program spreadsheet anymore and therefore any change in the original program file will not affect the chart. If it is pasted as an Excel chart, the links will be maintained and hence it will be updated if the modelling parameters in the original file are modified.
If users want to keep the results of a particular model intact as an Excel graph, they can break the links between the program file and the chart by clicking on the “Links” command from the “Edit” menu (while the chart is selected), then choosing the appropriate file name and finally clicking on the “Break links” button from the dialog box that will appear.
6. Application exampleThe Late Cretaceous volcanic units of the Pontide range in north-eastern Turkey have been selected as an application example (Keskin et al. 2010 and unpublished data). These
lavas span the whole compositional range from basalts to rhyolites and are calc-alkaline in character with a distinct subduction signature. They have been divided into six lava series on the basis of their stratigraphic positions and petrographical properties and entered into sheets named DS 1 to DS 6. Volcano-stratigraphy and chemical variations in these units are beyond the scope of this paper and so they will not be mentioned here.
In this application example, the most primitive lava sample named “Basaltic end-member-2” has been selected as the primitive magma composition while the average upper crust composition of Taylor & McLennan (1985) has been chosen as the contaminant (Figure 2). Based on these compositions, Ta, Nb and Th are enriched 22, 13.5 and 9.1 times in the crust respectively relative to their concentrations in the magma, as seen in a small table at the bottom of the ‘AFC Modelling’ page (Area 12 in Figure 2). In contrast, Zr, known to be one of the most alteration-resistant and immobile incompatible elements, is enriched much less (i.e. 4.1 times) in the crust compared to the enrichments of Ta, Nb and Th. Because it is known from the chemistry and petrography of these Late Cretaceous lavas that there is no crystallization phase that can hold Zr concentration, this particular element has been chosen as the fractionation index along the horizontal axis. Ta/Zr has been chosen as the assimilation-sensitive ratio along the vertical axis because Ta is enriched more than four times in the crust compared to Zr enrichment. Therefore, the assimilation of the crust would theoretically increase the Ta/Zr ratio, whereas fractional crystallization alone cannot produce such a deviation as long as D values of the elements remain quite small (~0.01) and similar. The relationship between the data points and the modelled theoretical curves indicate that most of the Late Cretaceous lavas in the Western Pontides might have experienced variable degrees of assimilation combined with fractional crystallization because r values range from 0 to ~0.8.
7. ConclusionAFC-Modeler is a Microsoft® Excel© workbook program specifically developed for the modelling of the AFC process interactively. It occupies around 2.4 Mb of disk space and runs on Microsoft® Excel© 2003 or later versions. It enables the users to model up to ten theoretical AFC curves (corresponding to ten different r values) for a set of variables (i.e. D, C0
m, Ca, e0
m and ea). Every parameter in a model can be interactively and precisely modified by the users. With its user-friendly design, it simplifies the modelling of AFC curves, which is otherwise a rather complex procedure. The program also lets users store their own geochemical data as well as the end member compositions and D values and to plot these data along with the modelled AFC curves on the same diagram. This enables the users to test their

317
KESKİN / Turkish J Earth Sci
working hypothesis related to the magma chamber history of a magmatic suite. It produces a high-quality graphic output suitable for publication.
A separate “Readme document”, highlighting the use of the AFC-modeler and the precautions required by the potential users, is available from the author.
AcknowledgementsI would like to express my gratitude to the İstanbul University Research Fund for their support (Project no:
BYP-77/21102002 and BYP-4721). Data from TÜBİTAK-CNR project #104Y215 have been used in the AFC model in this paper. I particularly thank Surendra P. Verma and Ercan Aldanmaz for their valuable comments and suggestions, which have definitely helped me improve the quality of the paper. Special thanks must go to Aleksandar Miskovic from Department of Mineralogy, University of Geneva, Switzerland, for test-running an earlier version of the program and making very useful suggestions.
References
Aitcheson, S.J. & Forrest, A.H. 1994. Quantification of crustal contamination in open magmatic systems. Journal of Petrology 35, 461-488.
Allègre, C. J. & Minster, J.F. 1978. Quantitative models of trace element behavior in magmatic process. Earth Planetary Science Letters 38, 1-25.
Asimow, P.D. & Ghiorso, M.S. 1998. Algorithmic modifications extending MELTS to calculate subsolidus phase relations. American Mineralogist 83, 1127-1131
Bell, K. & Powell, J.L. 1969. Strontium isotopic studies of alkali rocks: the potassium rich lavas of the Birunga end Toro-Ankole regions, east and central equatorial Africa. Journal of Petrology 10, 536-572.
Bohrson, W.A. & Spera, F.J. 2001. Energy-constrained open-system magmatic processes II: Application of energy-constrained assimilation-fractional crystallization (EC-AFC) model to magmatic systems. Journal of Petrology 42, 1019-1041.
Bohrson, W.A. & Spera, F.J. 2003. Energy-constrained open-system magmatic processes IV: geochemical, thermal and mass consequences of energy-constrained recharge, assimilation and fractional crystallization (EC-RAFC). Geochemistry Geophysics Geosystems 4, 8002, doi:10.1029/2002GC000316.
Bowen, N.L. 1928. The Evolution of the Igneous Rocks, Princeton University Press, Princeton, 334 pp.
Calderon, M., Herve, F., Cordani, U. & Massonne, H.J. 2007. Crust-mantle interactions and generation of silicic melts: insights from the Sarmiento Complex, southern Patagonian Andes. Revista Geologica De Chile 34, 249-275.
Cebriá, J.M., Martiny, B.M. López-Ruiz, J. & Morán-Zenteno, D.J. 2011. The Parícutin calc-alkaline lavas: New geochemical and petrogenetic modeling constraints on the crustal assimilation process. Journal of Volcanology and Geothermal Research 201, 113-125.
Conrad, W.K. 1987. A FORTRAN program for simulating major- and trace-element variations during Rayleigh fractionation with melt replenishment or assimilation. Computers & Geosciences 13, 1-12. doi:10.1016/0098-3004(87)90021-5.
Cribb, J.W. & Barton, M. 1996. Geochemical effects of decoupled fractional crystallization and crustal assimilation. Lithos 37, 293-307.
DePaolo, D.J. & Wasserburg, G.J. 1979. Petrogenetic mixing models and Nd-Sr isotopic patterns. Geochimica Cosmochimica Acta 43, 615-627.
DePaolo, D.J. 1981. Trace element and isotopic effects of combined wall-rock assimilation and fractional crystallization. Earth and Planetary Science Letters 53, 189-202. doi: 10.1016/0012-821X(81)90153-9.
D’Orazio, M. 1993. A Macintosh basic program for the interactive testing of combined assimilation and fractional crystallization. Computers & Geosciences 19, 483-492. doi:10.1016/0098-3004(92)90003-A.
Ellam, R.M. & Harmon, R.S. 1990. Oxygen isotope constraints on the crustal contribution to the subduction-related magmatism of the Aeolian-islands, southern Italy. Journal of Volcanology and Geothermal Research 44, 105-122.
Ersoy, Y. & Helvacı, C. 2010. FC-AFC-FCA and mixing modeler: A Microsoft(R) Excel(c) spreadsheet program for modeling geochemical differentiation of magma by crystal fractionation, crustal assimilation and mixing. Computers & Geosciences 36, 383-390. DOI: 10.1016/j.cageo.2009.06.007
Faure, G., Bowman, J.R., & Elliot, D.H. & Jones, L.M. 1974. Strontium isotope composition and petrogenesis of the Kirkpatrick Basalt, Queen Alexandra Range, Antarctica. Contributions to Mineralogy and Petrology 3, 153-169.
Ghiorso, M.S. & Sack, R.O. 1995. Chemical mass-transfer in magmatic processes. 4. A revised and internally consistent thermodynamic model for the interpolation and extrapolation of liquid-solid equilibria in magmatic systems at elevated-temperatures and pressures. Contributions to Mineralogy and Petrology 119, 197-212. Doi: 10.1007/BF00307281.
Hagen, H. & Neumann, E.R. 1990. Modeling of trace-element distribution in magma chambers using open-system models. Computers & Geosciences 16, 549-586.
Halama, R., Marks, M., Brugmann, G., Siebel, W., Wenzel, T. & Markl, G. 2004. Crustal contamination of mafic magmas: evidence from a petrological, geochemical and Sr-Nd-Os-O isotopic study of the Proterozoic Isortoq dike swarm, South Greenland. Lithos 74, 199-232. Doi: 10.1016/j.lithos.2004.03.004.
Huang, F., Gao, L. & Lundstrom, C.C. 2008. The effect of assimilation, fractional crystallization, and ageing on U-series disequilibria in subduction zone lavas. Geochimica et Cosmochimica Acta 72, 4136-4145.

318
KESKİN / Turkish J Earth Sci
Karacık, Z., Yılmaz, Y., Pearce, J.A. & Ece, I. 2008. Petrochemistry of the south Marmara granitoids, northwest Anatolia, Turkey. Int. J Earth Sci. (Geol Rundsch) 97, 1181–1200. Doi: 10.1007/s00531-007-0222-y.
Keskin, M. 2002. FC-Modeler: a Microsoft® Excel© spreadsheet program for modeling Rayleigh fractionation vectors in closed magmatic systems. Computers & Geosciences 28, 919-928.
Keskin, M., Genç, Ş.C. & Tüysüz, O. 2008. Petrology and geochemistry of post-collisional Middle Eocene-Oligocene volcanic units in North-Central Turkey: evidence for magma generation by slab-breakoff following the closure of the northern Neotethys Ocean. Lithos 104, 267-305. doi: 10.1016/j.lithos.2007.12.011.
Keskin, M., Pearce, J.A. & Mitchell, J.G. 1998. Volcano-stratigraphy and geochemistry of collision-related volcanism on the Erzurum-Kars Plateau, North Eastern Turkey. Journal of Volcanology and Geothermal Research 85, 355-404.
Keskin, M., Pearce, J.A., Kempton, P.D. & Greenwood, P. 2006. Magma-crust interactions and magma plumbing in a postcollisional setting: Geochemical evidence from the Erzurum-Kars volcanic plateau, eastern Turkey, In: Dilek, Y. & Pavlides, S. (eds), Postcollisional tectonics and magmatism in the Mediterranean region and Asia, Geological Society of America Special Paper 409, 475-505. doi: 10.1130/2006.2409(23).
Keskin, M., Ustaömer, T. & Yeniyol, M. 2010. Magmatic evolution and geodynamic setting of the Late Cretaceous volcanic sequences in the north of Istanbul, in Symposium on the Geology of Istanbul-III Proceedings book, 130-180 (in Turkish with English abstract).
Krienitz, M.S., Haase, K.M., Mezger, K., Eckardt, V. & Shaikh-Mashail, M.A. 2006. Magma genesis and crustal contamination of continental intraplate lavas in northwestern Syria. Contributions to Mineralogy and Petrology 151, 698-716. Doi: 10.1007/s00410-006-0088-1.
Langmuir, C.H., Vocke, R.D., Hanson, G.N. & Hart, S.R. 1978. A general mixing equation with applications to Icelandic basalts. Earth and Planetary Science Letters 37, 380-392.
Lightfoot, P.C., Sutcliffe, R.H. & Doherty, W. 1991. Crustal contamination identified in Keweenawan Osler group tholeiites, Ontario - a trace-element perspective. Journal of Geology 99, 739-760.
Marsh, J.S. 1989. Chemical constraints on coupled assimilation and fractional crystallization involving upper crustal compositions and continental tholeiitic magma. Earth and Planetary Science Letters 92, 70-80.
McBirney, A.R., Taylor, H.P. & Armstrong, R.L. 1987. Paricutin reexamined - a classic example of crustal assimilation in calc-alkaline magma. Contributions to Mineralogy and Petrology 95, 4-20.
Myers, J.D., Sinha, A.K. & Marsh, B.D. 1984. Assimilation of crustal material by basaltic magma - strontium isotopic and trace-element data from the Edgecumbe volcanic field, SE Alaska. Journal of Petrology 25, 1-26.
Nielsen, R.L. 1985. EQUIL: a program for the modeling of low-pressure differentiation processes in natural mafic magma bodies. Computers & Geosciences 11, 531-546. doi:10.1016/0098-3004(85)90084-6.
Nielsen, R.L. 1988. TRACE FOR: A program for the calculation of combined major and trace-element liquid lines of descent for natural magmatic systems. Computers & Geosciences 14, 15-35. doi:10.1016/0098-3004(88)90050-7.
O’Hara, M.J. 1977. Geochemical evolution during fractional crystallization of a periodically refilled magma chamber. Nature 266, 503-507.
Ort, M.H., Coira, B.L. & Mazzoni, M.M. 1996. Generation of a crust-mantle magma mixture: Magma sources and contamination at Cerro Panizos, Central Andes. Contributions to Mineralogy and Petrology 123, 308-322.
Pearce, J.A., Bender, J.F., De Long, S.E., Kidd, W.S.F., Low, P.J., Güner, Y., Şaroğlu, F., Yılmaz, Y., Moorbath, S. & Mitchell, J.G. 1990. Genesis of collision volcanism in Eastern Anatolia, Turkey. Journal of Volcanology and Geothermal Research 44, 189-229.
Powell, R. 1984. Inversion of the assimilation and fractional crystallization (AFC) equations; characterization of contaminants from isotope and trace element relationships in volcanic suites. Journal of Geological Society of London 141, 447-452.
Reiners, P.W., Nelson, B.K. & Ghiorso, M.S. 1995. Assimilation of felsic crust by basaltic magma - thermal limits and extents of crustal contamination of mantle-derived magmas. Geology 23, 563-566.
Reiners, P.W., Nelson, B.K. & Nelson, S.W. 1996. Evidence for multiple mechanisms of crustal contamination of magma from compositionally zoned plutons and associated ultramafic intrusions of the Alaska Range. Journal of Petrology 37, 261-292.
Rivalenti, G., Correia, C.T., Girardi, V.A., Mazzucchelli, M., Tassinari, C.C.G. & Bertotto, G.W. 2008. Sr-Nd isotopic evidence for crustal contamination in the Niquelandia complex, Goias, Central Brazil. Journal of South American Earth Sciences 25, 298-312. Doi: 10.1016/j.jsames.2007.08.007.
Schmidt, M.E. & Grunder, A.L. 2011. Deep mafic roots to arc volcanoes: Mafic recharge and differentiation of basaltic andesite at North Sister Volcano, Oregon Cascades. Journal of Petrology 52, 603-641. doi:10.1093/petrology/egq094.
Spera, F.J. & Bohrson, W.A. 2001. Energy-constrained open-system magmatic processes I: General model and energy-constrained assimilation and fractional crystallization (EC-AFC) formulation. Journal of Petrology 42, 999-1018.
Spera, F.J. & Bohrson, W.A. 2002. Energy-constrained open-system magmatic processes 3. Energy-constrained recharge, assimilation, and fractional crystallization (EC-RAFC). Geochemistry Geophysics Geosystems 3, Art. No: 8001.
Spera, F.J. & Bohrson, W.A. 2004. Open-system magma chamber evolution: an energy-constrained geochemical model incorporating the effects of concurrent eruption, recharge, variable assimilation and fractional crystallization (EC-E’RAcFC). Journal of Petrology 45, 2459-2480.
319
KESKİN / Turkish J Earth Sci
Sun, S.S., Tatsumoto, M. & Schilling, J.-G. 1975. Mantle plume mixing along the Reykjanes Ridge axis: lead isotopic evidence. Science 190, 143-149.
Taylor, H.P. 1980. The effects of assimilation of country rocks by magmas on 18O/16O and 87Sr/86Sr systematics in igneous rocks. Earth and Planetary Science Letters 47, 243-254.
Taylor, S.R. & McLennan, S.M. 1981. The composition and evolution of the continental crust: rare earth element evidence from sedimentary rocks. Philosophical Transactions of the Royal Society of London A301, 381-399.
Taylor, S.R. & McLennan, S.M. 1985. The continental crust: its composition and evolution, Blackwell Scientific Publications, Oxford, 312 pp.
Torres-Alvarado, I.S., Verma, S.P., Palacios-Berruete, H., Guevara, M. & González-Castillo, O.Y. 2003. DC_Base: a database system to manage Nernst distribution coefficients and its application to partial melting modeling. Computers & Geosciences 29, 1191-1198.
Velasco-Tapia, F. & Verma, S.P. 2012. Magmatic Processes at the volcanic front of Central Mexican Volcanic Belt: Sierra de Chichinautzin volcanic field (Mexico). Turkish Journal of Earth Sciences 21, in press, doi:10.3906/yer-1104-9
Verma, S.P. & Andaverde, J. 2007. Coupling of thermal and chemical simulations in a 3-D integrated magma chamber-reservoir model: a new geothermal energy research frontier. In: Ueckermann, H.I. (ed), Geothermal Energy Research Trends, New York, Nova Science Publishers, Inc. 149-189.
Verma, S.P. 1999. Geochemistry of evolved magmas and their relationship to subduction-unrelated mafic volcanism at the volcanic front of the central Mexican Volcanic Belt. Journal of Volcanology and Geothermal Research 93, 151-171.
Verma, S.P. 1998. Error propagation in geochemical modeling of trace elements in two component mixing. Geofísica Internacional 37, 327-338.
Verma, S.P. 2000. Error propagation in equations for geochemical modelling of radiogenic isotopes in two-component mixing. Proceedings of the Indian Academy of Sciences (Earth and Planetary Sciences) 109, 79-88.
Verma, S.P. 2001. Geochemical and Sr-Nd-Pb isotopic evidence for a combined assimilation and fractional crystallisation process for volcanic rocks from the Huichapan caldera, Hidalgo, Mexico. Lithos 56, 141-164.
Vollmer, R. 1976. Rb-Sr and U-Th-Pb systematics of alkaline rocks: the alkaline rocks from Italy. Geochimica et Cosmochimica Acta 40, 283-295.
Weaver, B. & Tarney, J. 1984. Empirical approach to estimating the composition of the continental crust. Nature 310, 575-577.
Wenzel, T., Oberhansli, R. & Mezger, K. 2000. K-rich plutonic rocks and lamprophyres from the Meissen Massif (northern Bohemian Massif): Geochemical evidence for variably enriched lithospheric mantle sources. Neues Jahrbuch fur Mineralogie-Abhandlungen 175, 249-293.
YongSheng, L. & ZhaoChong, Z. 2011. Application of energy-constrained assimilation-fractional crystallization (EC-AFC) model for ultramafic magmatic systems: A case study of the Limahe intrusion associated with Cu-Ni sulfide ores, Sichuan Province. Acta Petrologica Sinica 27, 2975-2983.