agricultural growth project (agp) in ethiopia growth project by the carbon footprint of the (agp) in...
TRANSCRIPT

The Carbon Footprint of the Agricultural Growth Project (AGP) in Ethiopia
An Application of the EX-Ante Carbon-balance Tool (EX-ACT) by
G. Branca 1, P. Gorin2, M. Tinlot3 1 Economist, Agricultural Development Economics Division, FAO 2 Climate Change Officer, Investment Department, FAO 3 Consultant, Policy Assistance Support Service, FAO FOOD AND AGRICULTURE ORGANIZATION OF THE UNITED NATIONS, FAO
THEMATIC OVERVIEW
The EX Ante
Carbon-
balance Tool Resources for policy making
About EX-ACT: The Ex Ante Appraisal Carbon-balance Tool aims at providing ex-ante estimations of the impact of agriculture and forestry development projects on GHG emissions and carbon sequestration, indicating its effects on the carbon balance.
See EX-ACT website: www.fao.org/tc/exact Related resources
• EX-ANTE Carbon-Balance Tool (EX-ACT): (i) Technical Guidelines; (ii) Tool; (iii) Brochure
• See all EX-ACT resources in EASYPol under the Resource package, Investment Planning for Rural Development, EX-Ante Carbon-Balance Appraisal of Investment Projects
About EASYPol EASYPol is a multilingual repository of freely downloadable resources for policy making in agriculture, rural development and food security. The EASYPol home page is available at: www.fao.org/easypol. These resources focus on policy findings, methodological tools and capacity development. The site is maintained by FAO's Policy Assistance Support Service.
APPLIED WORK EASYPol Module 118

The Carbon footprint of the Agricultural Growth Project (AGP) in Ethiopia An application of the EX-Ante Carbon-balance Tool (EX-ACT)
The designations employed and the presentation of material in this information product do not imply the expression of any opinion whatsoever on the part of the Food and Agriculture Organization of the United Nations (FAO) concerning the legal or development status of any country, territory, city or area or of its authorities, or concerning the delimitation of its frontiers or boundaries. The mention of specific companies or products of manufacturers, whether or not these have been patented, does not imply that these have been endorsed or recommended by FAO in preference to others of a similar nature that are not mentioned.
The views expressed in this information product are those of the author(s) and do not necessarily reflect the views of FAO.
E-ISSN 2219-9535
E-ISBN 978-92-5-107244-8 (PDF)
All rights reserved. FAO encourages reproduction and dissemination of material in this information product. Non-commercial uses will be authorized free of charge, upon request. Reproduction for resale or other commercial purposes, including educational purposes, may incur fees. Applications for permission to reproduce or disseminate FAO copyright materials, and all queries concerning rights and licences, should be addressed by e-mail to
[email protected] or to the Chief, Publishing Policy and Support Branch, Office of Knowledge Exchange, Research and Extension, FAO,
Viale delle Terme di Caracalla, 00153 Rome, Italy.
© FAO 2012

The Carbon footprint of the Agricultural Growth Project (AGP) in Ethiopia An application of the EX-Ante Carbon-balance Tool (EX-ACT)
Table of Contents
1 Summary ................................................................................... 1
2 Introduction ................................................................................ 1
3 Methodology ............................................................................... 2
4 Carbon balance analysis of the Ethiopia agp .................................... 4
4.1 The project profile .......................................................................... 4
4.2 Structure and basic assumptions of the analysis ................................ 5
4.3 The “without project” case .............................................................. 5
4.4 The “with project” case ................................................................... 6
4.5 Component 1 (agricultural production and commercialization) ............. 7
4.5.1 Institutional strengthening and development ......................... 7
4.5.2 Scaling up best practices..................................................... 9
4.5.3 Market and agribusiness development ................................ 13
4.6 Component 2 (small-scale rural infrastructure development and management) ...................................................................... 17 4.6.1 Small-scale agricultural water development and
management ................................................................... 17
4.6.2 Small-scale market infrastructure development and management ................................................................... 18
5 Results and discussion ............................................................... 19
5.1 Main results ................................................................................ 19
5.2 Sensitivity analysis ...................................................................... 22
5.3 Economic analysis ........................................................................ 23
6 Conclusions .............................................................................. 24
7 Links to other EASYPol materials ................................................. 25
8 Further Reading/ References ....................................................... 25

The Carbon footprint of the Agricultural Growth Project (AGP) in Ethiopia An application of the EX-Ante Carbon-balance Tool (EX-ACT)
Acronyms
AFD Agence Française de Développement AGP Agricultural Growth Project ARDPLACs Agricultural and Rural Development Partners Linkages Advisory Councils ATVET Agriculture Technical Vocational Education and Training C Carbon CC Climate change CDM Clean development mechanism CH4 Methane CO2 Carbon dioxide CLPP Community-level planning process DAP Diammonium phosphate FAO Food and Agricultural Organization of the United Nations GDP Gross domestic product GHG Greenhouse gas GOE Government of Ethiopia GWP Global warming potential HAC High activity clay IPCC Intergovernmental Panel on Climate Change IRSS Irrigation runoff returns system LULUCF Land use, land use change and forestry Mt Million tons N2O Nitrous oxide PAD Project appraisal document SLM Sustainable land management SNNPR Southern Nations, Nationalities, and Peoples Region SSI Small-scale and micro-irrigation t CO2e ha-1 Tonnes of carbon dioxide equivalent per hectare t CO2e yr-1 Tonnes of carbon dioxide equivalent per year TFC Training farming centre UNFCCC United Nations Framework Convention on Climate Change WB World Bank

The Carbon Footprint of the Agricultural Growth Project (AGP) in Ethiopia An application of the EX-Ante Carbon-balance Tool (EX-ACT)
1
1 SUMMARY
Agriculture can play an important role in climate change mitigation while contributing to increased food security and reductions in rural poverty. The Ex-Ante Carbon-balance Tool (EX-ACT) can estimate the mitigation potential of rural development projects generated from changes in farming systems and land use. This study presents and discusses the EX-ACT analysis performed on the Agricultural Growth Project (AGP) in Ethiopia, which is supported by the World Bank and the Government of Ethiopia. The projected estimates of the impact of project activities on greenhouse gas emissions and carbon sequestration demonstrate that the mitigation benefits achieved through the adoption of sustainable agricultural practices (improved cropland and grassland management, soil and water conservation) not only balance the emissions associated with the increase in inputs use and the building of infrastructure (irrigation, roads and markets) but also create a carbon sink. If the project is successful in ensuring full adoption of all the proposed best practices, there will be options for mitigation financing from the public sector.
2 INTRODUCTION
The Ethiopian Government has recognized the critical importance of addressing climate change challenges in the country, particularly in the agricultural sector. The Government has signed and ratified all the Rio Conventions, namely the United Nations Framework Convention on Climate Change and its Protocol, the Bio-diversity Convention and the Conventions to Combat Desertification. The Government of Ethiopia has prepared the National Adaptation Program of Action (NAPA) to identify and promote activities that address the urgent need to adapt to the adverse effects of climate change. Of the eleven priority projects outlined in the NAPA document, diverse agriculture practices are considered high priority projects for adaptation-mitigation efforts1
In this context, models are being developed to estimate the mitigation potential from changes in agricultural production systems and to support project managers on CC mitigation decision making. EX-ACT (EX-Ante Carbon-balance Tool) is one such model that was developed by the Food and Agriculture Organization of the United Nations (FAO) to provide an ex-ante evaluation of the impact of rural development projects on Greenhouse Gas (GHG) emissions and carbon sequestration, thus estimating the agriculture (and forestry) sector’s potential contribution to CC mitigation. The tool is now going through a testing process: case studies have been selected with the aim of representing a wide range of different ecosystems worldwide (e.g. tropical, temperate, semi-arid), agriculture activities (e.g. annual/perennial crops, forestry, livestock, grasslands) and geographic coverage.
.
1 Dejene, Bekele, & Malo 2009.

2 EASYPol Module 118 Applied Work
Objectives: This report aims to present the results of the EX-ACT test on the World Bank (WB) and Government of Ethiopia (GOE) Agricultural Growth Project (AGP) in Ethiopia. It is worth noting that this project is one of the first cases in which the EX-ACT was applied during the appraisal and pre-start-up phases of relatively large projects. The following are preliminary results which could be subject to change as a result of possible methodology adjustments in the further development of the tool.
The report is organized as follows: Section 3 provides a description of EX-ACT and its methodology; Section 4 provides a short description of the proposed AGP and presents the EX-ACT analysis for the specific case study; Section 5 discusses the main findings in terms of AGP mitigation potential and the results of the sensitivity and economic analyses; and conclusions are presented in section 6. Target audience : This module targets current or future practitioners in the formulation and analysis of investment projects, working for public administration offices, NGO’s, professional organizations or for consulting firms. Academics may also find this material useful to support their courses in carbon balance analysis and development economics. Required background: Readers can follow links included in the text to other EASYPol modules or references2. See also the list of EASYPol links included at the end of this module3
3 METHODOLOGY
.
The analysis presented in this report has been conducted applying the EX-Ante Carbon-balance Tool (EX-ACT), developed by FAO and aimed at providing ex-ante measurements of the impact of agriculture (and forestry) development projects on GHG emissions and carbon (C) sequestration, indicating its effects on the C-balance4, which is selected as an indicator of the mitigation potential of the project5
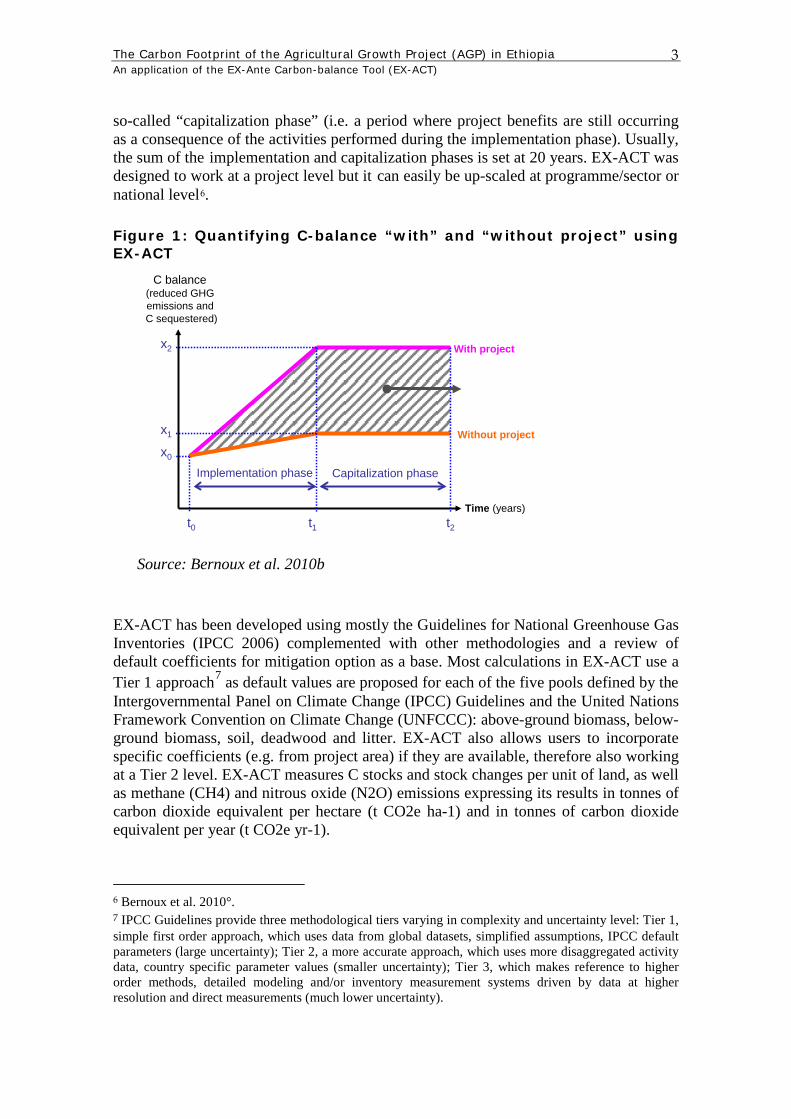
The model takes into account both the implementation phase of the project (i.e. the active phase of the project commonly corresponding to the investment phase), and the
. EX-ACT can be used in the context of ex-ante project formulation and is capable of covering the range of projects relevant for the land use, land use change and forestry (LULUCF) sector. It can compute the C-balance by comparing two scenarios: “without project” (i.e. the “Business As Usual” or “Baseline”) and “with project”. The tool’s main output consists of the C-balance resulting from the difference between these two scenarios (Figure 1).
2 EASYPol hyperlinks are shown in blue, as follows:
a) training paths are shown in underlined bold font b) other EASYPol modules or complementary EASYPol materials are in bold underlined italics; c) links to the glossary are in bold; and d) external links are in italics.
3 See all EX-ACT resources in EASYPol under the Resource package, Investment Planning for Rural Development - EX-Ante Carbon-Balance Appraisal of Investment Projects
4 C-balance = GHG emissions - C sequestered above and below ground. 5 EX-ACT 2010.
The Carbon Footprint of the Agricultural Growth Project (AGP) in Ethiopia An application of the EX-Ante Carbon-balance Tool (EX-ACT)
3
so-called “capitalization phase” (i.e. a period where project benefits are still occurring as a consequence of the activities performed during the implementation phase). Usually, the sum of the implementation and capitalization phases is set at 20 years. EX-ACT was designed to work at a project level but it can easily be up-scaled at programme/sector or national level6
.
Figure 1: Quantifying C-balance “with” and “without project” using EX-ACT
Time (years)t0
Implementation phase
With project
Without project
Capitalization phase
t1 t2
x0
x1
x2
C balance (reduced GHG emissions and C sequestered)
Source: Bernoux et al. 2010b
EX-ACT has been developed using mostly the Guidelines for National Greenhouse Gas Inventories (IPCC 2006) complemented with other methodologies and a review of default coefficients for mitigation option as a base. Most calculations in EX-ACT use a Tier 1 approach7
6 Bernoux et al. 2010°.
as default values are proposed for each of the five pools defined by the Intergovernmental Panel on Climate Change (IPCC) Guidelines and the United Nations Framework Convention on Climate Change (UNFCCC): above-ground biomass, below-ground biomass, soil, deadwood and litter. EX-ACT also allows users to incorporate specific coefficients (e.g. from project area) if they are available, therefore also working at a Tier 2 level. EX-ACT measures C stocks and stock changes per unit of land, as well as methane (CH4) and nitrous oxide (N2O) emissions expressing its results in tonnes of carbon dioxide equivalent per hectare (t CO2e ha-1) and in tonnes of carbon dioxide equivalent per year (t CO2e yr-1).
7 IPCC Guidelines provide three methodological tiers varying in complexity and uncertainty level: Tier 1, simple first order approach, which uses data from global datasets, simplified assumptions, IPCC default parameters (large uncertainty); Tier 2, a more accurate approach, which uses more disaggregated activity data, country specific parameter values (smaller uncertainty); Tier 3, which makes reference to higher order methods, detailed modeling and/or inventory measurement systems driven by data at higher resolution and direct measurements (much lower uncertainty).

4 EASYPol Module 118 Applied Work
In terms of dynamics, land use changes associated with project activities and the rate of adoption of land management options occur only during the implementation phase. Therefore, it is assumed that all project activities will be completed within the project timeframe and that no additional change in land use and management will take place during the capitalization phase. The EX-ACT default assumption for the land use and management change is a “linear” function over time, although the software allows for adopting a different dynamic of change, e.g. “immediate” or “exponential” (Figure 2), depending on the characteristics of the specific project activity and on the information available on the adoption rate of the selected practice among project participants. This aspect is often considered in the sensitivity analysis where different rates of adoption are taken into account. Figure 2: Schematic representation of the dynamics of change in the implementation phase
Abs
olut
e C
hang
e(x
1-x 0
)
t0 t1
“Immediate” “Linear” “Exponential”
t0 t1 t0 t1Time (years)
Source: Bernoux et al. 2010b
4 CARBON BALANCE ANALYSIS OF THE ETHIOPIA AGP
4.1 The project profile
The Agricultural Growth Project (AGP) aims to increase agricultural productivity and market access for key crop and livestock products in four regions with good potential for agricultural growth (Amhara; Oromiya; Southern Nations, Nationalities, and Peoples Region – SNNPR; and Tigray), including 83 woredas, about 2,108 kebeles8
o Agricultural Production and Commercialization, which will strengthen the capacity of farmer organizations and their service providers to scale up best practices in agricultural production and post-harvest value addition, adopt improved technologies in production and processing, and strengthen marketing and processing of selected commodities. It includes three sub-
and a total population of 9.8 million people. The AGP focuses on areas that are relatively rain- and food-secure and have considerable potential for agricultural growth. The AGP will be implemented over a period of five years and is structured around three components:
8 Woreda is an administrative division of Ethiopia (managed by a local government), equivalent to a
district. Woredas are composed of a number of Kebeles, which are the smallest unit of local government in Ethiopia. Woredas are typically collected together into zones.

The Carbon Footprint of the Agricultural Growth Project (AGP) in Ethiopia An application of the EX-Ante Carbon-balance Tool (EX-ACT)
5
components (institutional development and strengthening, scaling-up best practices, and market and agribusiness development);
o Small-scale Rural Infrastructure Development and Management, which will finance the construction, rehabilitation and improvement of small-scale infrastructures. It includes two sub-components (small-scale and micro-irrigation development; and small-scale market infrastructure development and management);
o Program Management and Monitoring and Evaluation, which will support effective coordination and management of the AGP.
4.2 Structure and basic assumptions of the analysis
The analysis is based on the comparison between the C-balance in the “with project” scenario and the C-balance in the so-called “without project” scenario (i.e. the baseline). The “with project” case takes into account the activities carried out under Components 1 (Agricultural Production and Commercialization) and 2 (Small-scale Rural Infrastructure Development and Management). The third component (Program Management and Monitoring and Evaluation) is not relevant for the EX-ACT analysis and is therefore not taken into account.
In both the “with project” and “without project” cases, data used to describe climate patterns and soil characteristics cannot take into account the considerable variability of existing soil and climatic conditions of the area covered by the project (see Annex 1). The results of the analysis should therefore be considered only as an average for the whole area. Average climate is considered as tropical with a mean annual temperature equal to 20 degrees Celsius and a moisture regime classified as dry. These settings correspond to average temperature and rainfall for the state. Such information is essential as most coefficients used in the analysis can change drastically according to the climate. This is particularly true for the moisture regime, but also for the mean annual temperature which is affecting, for example, the level of CH4 emissions from manure management. As for the soil characteristics – and with reference to the simplified IPCC classification where only six soil categories are listed (sandy soils, spodic soils, volcanic soils, wetland soils, high activity clay soils and low activity clay soils) – the state is characterized essentially by high activity clay (HAC) soils, which are lightly to moderately weathered soils and dominated by 2:1 silicate clay minerals910
4.3 The “without project” case
.
The “without project” scenario is essentially built on the results of the baseline established for AGP impact evaluation (BDS-CDR, 2010) and on the available statistics for land use and management in Ethiopia resulting from policies and strategies that have
9 In the World Reference Base for Soil Resources classification HAC soils include: Leptosols,
Vertisols, Kastanozems, Chernozems, Phaeozems, Luvisols, Alisols, Albeluvisols, Solonetz, Calcisols, Gypsisols, Umbrisols, Cambisols, Regosols. In USDA classification HAC soils include: Mollisols, Vertisols, high-base status Alfisols, Aridisols, Inceptisols.
10 Bernoux et al. 2010b.
6 EASYPol Module 118 Applied Work
been designed and implemented in the past to boost agricultural productivity in the country.
Since the AGP will promote crop intensification and yield increases, it is assumed that without the project, the annual cropland would expand and that such an expansion would not happen in the “with project” case. Based on this assumption yield increases in the intensified area could be linked with a potential land-sparing. Although there is no consensus about the possible rate of substitution11, it has been decided to follow the same procedure as described by Burney et al. (2010). Given that the Government of Ethiopia is currently implementing a five-year development programme entitled Plan for Accelerated and Sustained Development to End Poverty (PASDEP), which is aimed at expanding the area cultivated by 2.24 percent12
Also, since farmers in the regions covered by the AGP are already implementing SLM and improved agronomic practices on approximately 10 percent of the area (BDS-CDR, 2010), it is assumed that “without the project” 10 percent of the grasslands would be taken up by soil and water conservation activities and improved agronomic practices would be promoted on 10 percent of the annual cropland. Finally, given that fertilizers (Urea and DAP) are already used by farmers operating in the regions under the AGP
, it is assumed that without the project the annual cropland would expand by 2 percent over five years at the expense of grasslands.
13
4.4 The “with project” case
, this is taken into account in the “without project” case (inputs module) by making the hypothesis that fertilizers would be used in the “without project” case at a rate equal to 30 percent of that adopted in the AGP.
The analysis will consider an implementation phase of five years, followed by a capitalization phase of fifteen years, which would represent a period where the benefits of the investment were still occurring and could be attributed to the changes in land use and management brought on by the adoption of the project. In the analysis it is assumed that the implementation phase would happen according to a linear dynamic of change, as no specific information is available about the adoption rate of the project activities among project participants. In terms of the Global Warming Potential (GWP) coefficients14
The project would support a decentralized, community-driven, need-based approach: some activities (e.g. those foreseen under component 1 aimed at identifying and scaling up best practices) and would be built around priorities identified by farmer groups. The AGP would in fact fund investment sub-projects developed by farmer groups to address their priorities using participatory approaches and following specific guidelines. For
, the current analysis uses the same values as those adopted within the Clean Development Mechanism (CDM), i.e. 21 for CH4 and 310 for N2O.
11 Rudela et al. 2009 12 BDS-CDR, 2010. 13 BDS-CDR, 2010. 14 The GWP is a measure of how much a given mass of greenhouse gas is estimated to contribute to
global warming. It is a relative scale which compares the gas in question to that of the same mass of carbon dioxide (whose GWP is by convention equal to 1).

The Carbon Footprint of the Agricultural Growth Project (AGP) in Ethiopia An application of the EX-Ante Carbon-balance Tool (EX-ACT)
7
activities requiring the preparation of sub-projects, it would not be possible to have consolidated information on the land use change promoted by AGP at this stage of the project appraisal. Therefore, for those activities, the EX-ACT analysis would rely only on the data derived from making estimations on the basis of available statistical information.
The analysis is conducted at sub-component level in order to highlight the impact of each set of foreseen project activities on the C-balance.
4.5 Component 1 (agricultural production and commercialization)
4.5.1 Institutional strengthening and development
The EX-ACT analysis takes into account the GHG emissions related to the implementation of the training activities on the basis of the estimated fuel consumption, which is the first indicator selected to estimate the impact of this sub-component. It is in fact assumed that most activities implemented under this sub-component would, in the end, determine an increase in fuel consumption (e.g. participation to meetings and workshops, provision of equipment, purchases of motorcycles).
The AGP will fund meetings, a workshop and the participation of ARDPLAC members in monitoring and reviewing project interventions aimed at improving service delivery, especially extension. Also the project will promote planning and funding of the extension agenda (e.g. assistance to prepare project-specific training modules) and will provide support to the functioning of training centres (rehabilitation of buildings, provision of essential furniture and equipment, purchase of motorcycles and bicycles and use of demonstration farms to share innovations) and to the upgrading of training facilities in specialised institutions (e.g. Agriculture Technical Vocational Education and Training [ATVET] and agricultural universities).
The AGP will provide analytical equipment, chemicals and training to promote improved fertilizer use based on soil analysis, assist with the reclamation of problems of soils (e.g. acid soils), increase the production of lime to reclaim acid soils (before any investment is made, two studies will be conducted to assess the needs). The AGP will also help to equip regional animal health laboratories, woreda veterinary clinics, and kebele animal health posts, together with developing training activities for professional staff. Finally, the AGP will promote, train and build capacity of farmers’ organizations and facilitate exchange visits between groups.
It is assumed that only 50 percent of the participants use their own transportation (which is a reasonable assumption given that vehicles are often shared and many participants often use public transportation). Also, it is assumed that transportation would be needed only for meetings at federal level. For meetings at regional, woreda and kebele level, it is assumed that attendees would either walk, hitch-hike or use public transportation to reach their destination (training centres). This would only be for short distances, so it would not have a significant impact in terms of GHG emissions.

8 EASYPol Module 118 Applied Work
The impact of this set of activities on the C-balance of the project is obtained by considering the number of meetings, trainings and workshops organized under this sub-component; the number of participants attending such meetings; the average distance covered and the number of vehicles (car/motorcycles) used. Information was derived from the AGP Project Appraisal Document (PAD) and was integrated with field data collection. It was estimated that the average speed was 40 km/h and that the consumption of fuel was 0.1l/km.
Trainings and meetings are organised at federal, regional/zonal, woreda and kebele level but with different frequency. At federal and regional level, there is on average a training once a year or once every two years. Normally, one person per region would attend the federal meeting (in total there are nine regions) and four to five people from each woreda (experts) would attend the regional meeting. The average travel time is estimated to be around 90 minutes for the federal zone and 50 minutes for the regional zone with transportation.
At woreda level, trainings happen on average once or twice a year, where one leader is training four to five experts, each from a different domain. These experts would then directly train others in their woreda. The average travel time to get to a woreda center is estimated to be around 90 minutes with transportation. At kebele level, three different methods of training are used: (i) individual training (every week, or month), a trainer goes to the community; (ii) mass method (every month or season), a trainer goes to the community; (iii) development group method (twice a month or season), participants go to the nearest Training Farming Centre (TFC). Only one farmer per kebele, normally the leader, would attend. In general there are five leaders and around 20 participants. The average travel time for the kebele zone is 20 minutes with transportation.
Overall, in five years 103,911 training sessions/meetings would take place (15 federal; 214 regional/zonal; 2,341 woreda and 101,341 at kebele level) under this sub-component. It was estimated that the implementation of this set of activities would cause an overall consumption of 213 m3/year of diesel for the main scenario. Also, during the implementation phase, around 10 motorcycles (at woreda level) and 12 bikes (at kebele level) would be distributed to the farmers: the fuel consumption related to the use of the motorcycles, with respect to the activities planned under this sub-component, is included in the above computation. Therefore, total fuel consumption determined by this sub-component for the main scenario amounts to 213 m3/year. In order to estimate the GHG emissions from fuel consumption, EX-ACT analysis uses the Gasoil/Diesel default value of 2.63 t CO2/ m3 (Table 1).
The second indicator chosen to estimate the impact of this sub-component is the area of buildings (training centres) that would be rehabilitated in order to deliver extension services at the kebele level. It was estimated that the project would rehabilitate 210,000 m2 of buildings for training activities (each training centre having a size of 500 m2; rehabilitating one centre each 5 kebeles, i.e. 400 centres). EX-ACT analysis takes into account the GHG emissions related to the rehabilitation of buildings using default values from the tools developed by the Agence Française de Développement (AFD), which shows that the GHG emissions related to the building of new offices (concrete) amount to 0.469 t CO2e/m2. Given that the project is only rehabilitating existing structures, it is assumed here that the GHG emissions from rehabilitation are equivalent

The Carbon Footprint of the Agricultural Growth Project (AGP) in Ethiopia An application of the EX-Ante Carbon-balance Tool (EX-ACT)
9
to 1/3 of the emissions for new constructions (i.e. 156 Kg CO2e/m2 from 210,000 m2 or, which is the same, 0.469 t CO2e/m2 from 70,000 m2, corresponding to 32,830 t CO2e).
The results of the EX-ACT analysis for this sub-component, as computed using the module called “other investments”, are shown in Table 1. The results show that overall, the set of activities related to institutional strengthening and development will be a net source of GHG emissions of 42,643 (9814 + 32,830) tCO2e. Table 1: Released GHG associated with institutional strengthening and development
Fuel consumption Released GHG associated with Fuel consumption (agricultural or forestry machinery, generators…)
Annual Fuel Consumption (m3/yr) Emission (t CO2eq)Type of Fuel Default value Specific Default Start
t CO2 /m3 Value Factor t0 End Rate End Rate Without WithGasoil/Diesel 2.63 YES 0 0 Linear 213.0 Linear 0 9814OPTION1 + OPTION2 Sub-Total Without 0.0 Sub-Total With 9813.8 Difference 9813.8
All PeriodWithout Project With Project
Building rehabilitation Released GHG associated with building of infrastructure
Type of construction or infrastructure Default value Specific Default surface (m2) Emission (t CO2eq)t CO2 /m2 Value Factor Without With Without With
0.469 YES 0 70000 0.0 32830.0Subtotal 0.0 32830.0 Difference 32830.0
Offices (concrete)
Source: our computations using EX-ACT (2010)
4.5.2 Scaling up best practices
This sub-component will help identify best practices to be scaled up through sub-projects proposals developed by all participating groups in the AGP woredas. The AGP will then fund investment sub-projects developed by farmer groups to address their priorities (demand-based proposals) and which are aimed at implementing best practices. The EX-ACT analysis is therefore based only on preliminary estimates of the possible sub-projects the farmers will submit, among a list of pre-approved best practices such as: improved agronomic practices and manure application for main annual crops; improved natural resource management (e.g. grasslands rehabilitation, reclamation of acid soils and lime treatment, vermiculture and compost production); increased planting material/seed/breed multiplication (fruits/vegetables/coffee/tree seedlings; mini hatchery; fingerling production); and improved livestock management (dairy cattle and small ruminants; poultry; bee-keeping; aquaculture). The high rate of uncertainty in making these estimates will inevitably be reflected in the results of the analysis.
The impact of this sub-component on the C-balance is estimated as follows:
(i) EX-ACT takes into account the GHG emissions related to the implementation of the training activities supporting the preparation of the sub-projects. As in the previous sub-component, fuel consumption is the

10 EASYPol Module 118 Applied Work
indicator selected to estimate the impact of this set of activities. For this sub-component, it has been estimated that the overall diesel consumption would be 4,193 m3/year of diesel.
(ii) EX-ACT takes into account the GHG emissions related to the implementation of the training activities supporting the preparation of the sub-projects. As in the previous sub-component, fuel consumption is the indicator selected to estimate the impact of this set of activities. No data on the location of the trainings foreseen for this sub-component were available. Therefore, an average of the distances between the four different zones was used: the average travel time would be 52 minutes, which is equivalent to 35km. It is assumed that only a few participants would use a car – which would also be shared among several participants – and that most would make use of public transportation. For this sub-component, 2 480 trainings will take place (all levels included) over five years. It has been estimated that the implementation of this set of activities would cause an overall consumption of 3,193.24 m3/year of diesel, which also includes the fuel consumed by the use of the motorcycles purchased by the project.
(iii) EX-ACT takes into account the expected effect of the adoption of the best practices. Given that at this stage of the project appraisal, data on the size of the land on which the different practices will be implemented are not yet available. In fact the AGP will adopt a demand-driven approach funding projects proposed by farmers’ groups – the EX-ACT analysis has been based on preliminary estimates of the potentials for implementing best practices on most represented crops in AGP woredas, i.e. annual crops which occupy more than 75 percent of land15
(iv) Since the AGP will also support seed production for self-pollinated crops (staple cereals like teff and wheat) in order to provide a greater supply of breeder and/or basic seed, the analysis takes into consideration the increase in planting material/seed/breed multiplication promoted by the project.
. Specifically, it has been estimated that AGP will be successful in expanding the adoption of sustainable land management (SLM) practices on 163 089 ha of annual cropland. In fact, annual crops in the AGP woredas are grown on around 8.6 million ha: since the application rate of SLM practices in the AGP woredas is around 29 percent, as estimated in the AGP Baseline for Impact Evaluation (BDS-CDR 2010), the potential for expansion of SLM practices on annual cropland is around 2.5 million ha; given that the rate of adoption of best practices is equal to 6.5 percent of households in the “with project” scenario (BDS-CDR 2010), it is estimated that improved practices could be potentially implemented on 162,500 ha (6.5 percent of 2.5 million) of annual cropland. Nevertheless, supposing that only 50 percent of targeted farmers would adopt the practices promoted by the project, EX-ACT estimated the impact of best practices (e.g. nutrient and water management, residue management, and manure application) only on half of the potential area (i.e. 81,545 ha).
15 FAO 2010.

The Carbon Footprint of the Agricultural Growth Project (AGP) in Ethiopia An application of the EX-Ante Carbon-balance Tool (EX-ACT)
11
Extension support would in fact target community-based seed production through groups and the AGP would support groups engaging in seed production and implementation of best nutrient management practices16
(v) It is also considered that the AGP would promote the adoption of best practices on grasslands, which cover 9 percent of land area
. It is assumed that such best practices would be implemented on 4 960 ha where improved seeds will be produced. In fact, seed production would be based in 2 480 demonstration groups: it is assumed an average size of 2 ha per each demonstration group.
17. Specifically, it is assumed that 19 649 ha of grasslands18
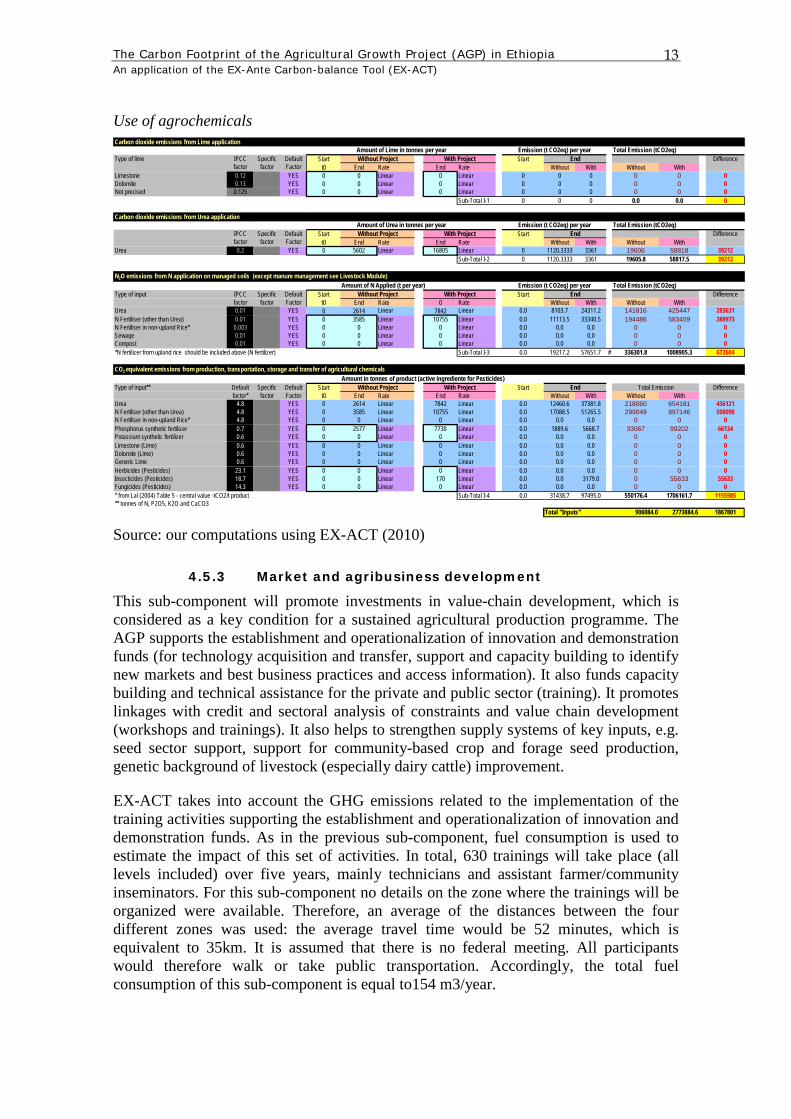
(vi) The EX-ACT analysis has also considered the increase in the use of chemicals which the implementation of best practices would determine: the fertilization rate of 0.1 t/ha for urea and 0.1 t/ha for the diammonium phosphate (DAP) is adopted on the 163 089 ha where the improved practices would be implemented; the application rate of 0,001 t/ha of Malathion (2,4 D) is used for pesticides. The analysis has also considered the use of agrochemicals on the area (4 960 ha) where improved seed production would take place (same application rates of fertilizers and pesticides applied).
would be improved from moderately degraded to improved (without input management) as the result of the adopted best practices.
Since no data on the adoption of improved livestock management practices were available at this stage and no estimates were possible due to the lack of necessary information, the adoption of best management practices in the livestock sector was not taken into account here.
The results of the EX-ACT analysis for this sub-component, as computed using the modules “other investments”, “inputs”, “annuals” and “grasslands”, are shown in Table 3.2. It is worth noting that the model considers that improved agronomic practices are able to store 0.29 tCO2e/ha/year, while the adoption of integrated nutrient management practices can store 0.26 tCO2e/ha/year and manure application 1.54 tCO2e/ha/year for the specific climate considered in the analysis19
16 WB 2010.
. Also, the improvement of severely degraded grasslands would determine an increase in the C stock of 1.39 tCO2e/ha/year. The increase in fertilizer use is expected to determine an increase in GHG emissions (carbon dioxide emissions from Urea application, N2O emissions from N application on
17 FAO 2010. 18 This value is computed following the same procedure as for the annual cropland: grasslands in the
AGP woredas cover around one million ha: using the application rate of SLM practices in the AGP woredas is around 29 percent (BDS-CDR 2010), the potential for expansion of SLM practices on annual cropland is around 300 000 ha; given that the rate of adoption of best practices is equal to 6.5 percent of households in the “with project” scenario (BDS-CDR 2010), it is estimated that improved practices would be implemented on 19 469 ha of grasslands.
19 Bernoux et al. 2010b.
12 EASYPol Module 118 Applied Work
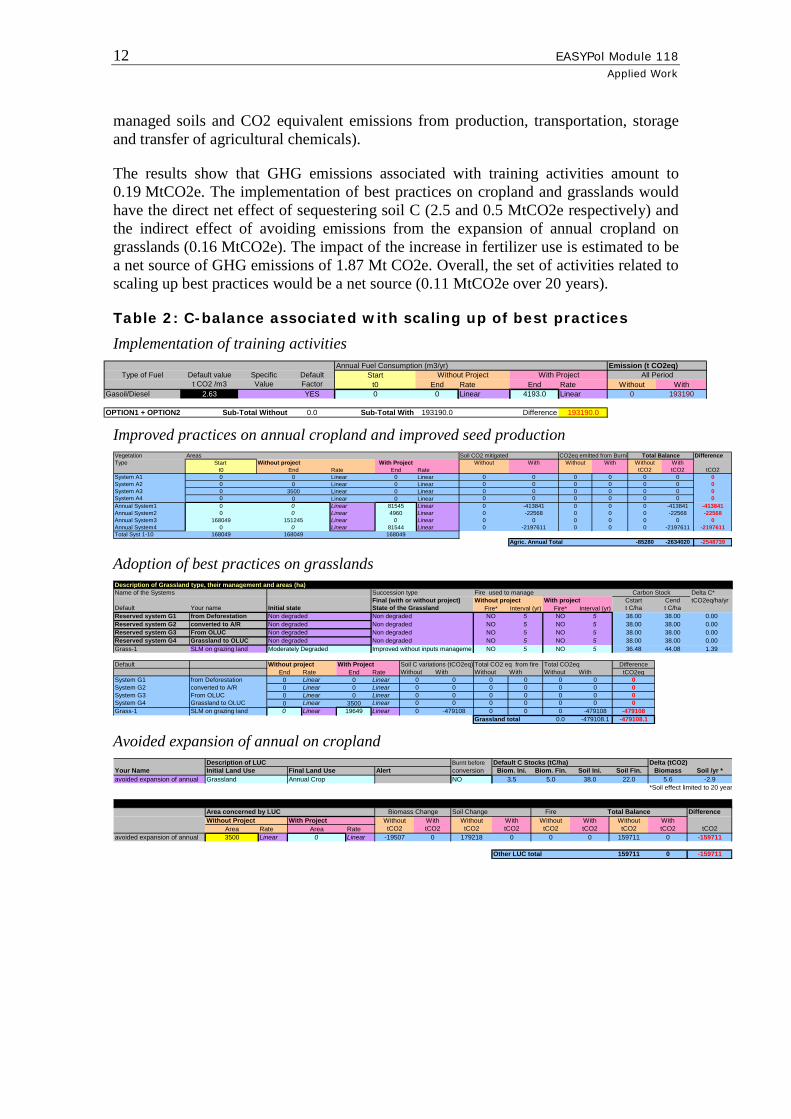
managed soils and CO2 equivalent emissions from production, transportation, storage and transfer of agricultural chemicals).
The results show that GHG emissions associated with training activities amount to 0.19 MtCO2e. The implementation of best practices on cropland and grasslands would have the direct net effect of sequestering soil C (2.5 and 0.5 MtCO2e respectively) and the indirect effect of avoiding emissions from the expansion of annual cropland on grasslands (0.16 MtCO2e). The impact of the increase in fertilizer use is estimated to be a net source of GHG emissions of 1.87 Mt CO2e. Overall, the set of activities related to scaling up best practices would be a net source (0.11 MtCO2e over 20 years).
Table 2: C-balance associated with scaling up of best practices
Implementation of training activities Annual Fuel Consumption (m3/yr) Emission (t CO2eq)
Type of Fuel Default value Specific Default Startt CO2 /m3 Value Factor t0 End Rate End Rate Without With
Gasoil/Diesel 2.63 YES 0 0 Linear 4193.0 Linear 0 193190
OPTION1 + OPTION2 Sub-Total Without 0.0 Sub-Total With 193190.0 Difference 193190.0
Without Project With Project All Period
Improved practices on annual cropland and improved seed production Vegetation Areas Soil CO2 mitigated CO2eq emitted from Burnin DifferenceType Start Without project With Project Without With Without With Without With
t0 End Rate End Rate tCO2 tCO2 tCO2System A1 0 0 Linear 0 Linear 0 0 0 0 0 0 0System A2 0 0 Linear 0 Linear 0 0 0 0 0 0 0System A3 0 3500 Linear 0 Linear 0 0 0 0 0 0 0System A4 0 0 Linear 0 Linear 0 0 0 0 0 0 0Annual System1 0 0 Linear 81545 Linear 0 -413841 0 0 0 -413841 -413841Annual System2 0 0 Linear 4960 Linear 0 -22568 0 0 0 -22568 -22568Annual System3 168049 151245 Linear 0 Linear 0 0 0 0 0 0 0Annual System4 0 0 Linear 81544 Linear 0 -2197611 0 0 0 -2197611 -2197611Total Syst 1-10 168049 168049 168049
Agric. Annual Total -85280 -2634020 -2548739
Total Balance
Adoption of best practices on grasslands Description of Grassland type, their management and areas (ha)Name of the Systems Succession type Fire used to manage Delta C*
Final (with or without project) Without project With project Cstart Cend tCO2eq/ha/yrDefault Your name Initial state State of the Grassland Fire* Interval (yr) Fire* Interval (yr) t C/ha t C/haReserved system G1 from Deforestation NO 5 NO 5 38.00 38.00 0.00Reserved system G2 converted to A/R NO 5 NO 5 38.00 38.00 0.00Reserved system G3 From OLUC NO 5 NO 5 38.00 38.00 0.00Reserved system G4 Grassland to OLUC NO 5 NO 5 38.00 38.00 0.00Grass-1 SLM on grazing land NO 5 NO 5 36.48 44.08 1.39
Default Without project With Project Soil C variations (tCO2eq) Total CO2 eq from fire Total CO2eq Difference refers to initial state)End Rate End Rate Without With Without With Without With tCO2eq t0
System G1 from Deforestation 0 Linear 0 Linear 0 0 0 0 0 0 0 0System G2 converted to A/R 0 Linear 0 Linear 0 0 0 0 0 0 0 0System G3 From OLUC 0 Linear 0 Linear 0 0 0 0 0 0 0 0System G4 Grassland to OLUC 0 Linear 3500 Linear 0 0 0 0 0 0 0 3500Grass-1 SLM on grazing land 0 Linear 19649 Linear 0 -479108 0 0 0 -479108 -479108 0
Grassland total 0.0 -479108.1 -479108.1
Carbon Stock
Non degradedNon degraded
Moderately Degraded
Non degradedNon degradedImproved without inputs managemen
Non degradedNon degradedNon degradedNon degraded
Avoided expansion of annual on cropland
Description of LUC Burnt before Default C Stocks (tC/ha) Delta (tCO2)Your Name Initial Land Use Final Land Use Alert conversion Biom. Ini. Biom. Fin. Soil Ini. Soil Fin. Biomass Soil /yr *avoided expansion of annual NO 3.5 5.0 38.0 22.0 5.6 -2.9
*Soil effect limited to 20 year
Area concerned by LUC Soil Change Fire Total Balance DifferenceWithout Project With Project Without With Without With Without With Without With
Area Rate Area Rate tCO2 tCO2 tCO2 tCO2 tCO2 tCO2 tCO2 tCO2 tCO2avoided expansion of annual 3500 Linear 0 Linear -19507 0 179218 0 0 0 159711 0 -159711
Other LUC total 159711 0 -159711
Annual CropGrassland
Biomass Change
The Carbon Footprint of the Agricultural Growth Project (AGP) in Ethiopia An application of the EX-Ante Carbon-balance Tool (EX-ACT)
13
Use of agrochemicals Carbon dioxide emissions from Lime application
Total Emission (tCO2eq)Type of lime IPCC Specific Default Start Start Difference
factor factor Factor t0 End Rate End Rate Without With Without WithLimestone 0.12 YES 0 0 Linear 0 Linear 0 0 0 0 0 0Dolomite 0.13 YES 0 0 Linear 0 Linear 0 0 0 0 0 0Not precised 0.125 YES 0 0 Linear 0 Linear 0 0 0 0 0 0
Sub-Total I-1 0 0 0 0.0 0.0 0
Carbon dioxide emissions from Urea applicationTotal Emission (tCO2eq)
IPCC Specific Default Start Start Differencefactor factor Factor t0 End Rate End Rate Without With Without With
Urea 0.2 YES 0 5602 Linear 16805 Linear 0 1120.3333 3361 19606 58818 39212Sub-Total I-2 0 1120.3333 3361 19605.8 58817.5 39212
N2O emissions from N application on managed soils (except manure management see Livestock Module)Amount of N Applied (t per year) Total Emission (tCO2eq)
Type of input IPCC Specific Default Start Start Differencefactor factor Factor t0 End Rate 0 Rate Without With Without With
Urea 0.01 YES 0 2614 Linear 7842 Linear 0.0 8103.7 24311.2 141816 425447 283631N Fertiliser (other than Urea) 0.01 YES 0 3585 Linear 10755 Linear 0.0 11113.5 33340.5 194486 583459 388973N Fertiliser in non-upland Rice* 0.003 YES 0 0 Linear 0 Linear 0.0 0.0 0.0 0 0 0Sewage 0.01 YES 0 0 Linear 0 Linear 0.0 0.0 0.0 0 0 0Compost 0.01 YES 0 0 Linear 0 Linear 0.0 0.0 0.0 0 0 0*N fertilizer from upland rice should be included above (N fertilizer) Sub-Total I-3 0.0 19217.2 57651.7 # 336301.8 1008905.3 672604
CO2 equivalent emissions from production, transportation, storage and transfer of agricultural chemicalsAmount in tonnes of product (active ingrediente for Pesticides)
Type of input** Default Specific Default Start Start Differencefactor* factor Factor t0 End Rate End Rate Without With Without With
Urea 4.8 YES 0 2614 Linear 7842 Linear 0.0 12460.6 37381.8 218060 654181 436121N Fertiliser (other than Urea) 4.8 YES 0 3585 Linear 10755 Linear 0.0 17088.5 51265.5 299049 897146 598098N Fertiliser in non-upland Rice* 4.8 YES 0 0 Linear 0 Linear 0.0 0.0 0.0 0 0 0Phosphorus synthetic fertilizer 0.7 YES 0 2577 Linear 7730 Linear 0.0 1889.6 5668.7 33067 99202 66134Potassium synthetic fertilizer 0.6 YES 0 0 Linear 0 Linear 0.0 0.0 0.0 0 0 0Limestone (Lime) 0.6 YES 0 0 Linear 0 Linear 0.0 0.0 0.0 0 0 0Dolomite (Lime) 0.6 YES 0 0 Linear 0 Linear 0.0 0.0 0.0 0 0 0Generic Lime 0.6 YES 0 0 Linear 0 Linear 0.0 0.0 0.0 0 0 0Herbicides (Pesticides) 23.1 YES 0 0 Linear 0 Linear 0.0 0.0 0.0 0 0 0Insecticides (Pesticides) 18.7 YES 0 0 Linear 170 Linear 0.0 0.0 3179.0 0 55633 55633Fungicides (Pesticides) 14.3 YES 0 0 Linear 0 Linear 0.0 0.0 0.0 0 0 0* from Lal (2004) Table 5 - central value -tCO2/t product Sub-Total I-4 0.0 31438.7 97495.0 550176.4 1706161.7 1155985** tonnes of N, P2O5, K2O and CaCO3
Total "Inputs" 906084.0 2773884.6 1867801
Without Project With ProjectAmount of Lime in tonnes per year Emission (t CO2eq) per year
End
Without Project With Project End
Emission (t CO2eq) per year
Total Emission
Without Project With Project End
Amount of Urea in tonnes per year Emission (t CO2eq) per yearWithout Project With Project End
Source: our computations using EX-ACT (2010)
4.5.3 Market and agribusiness development
This sub-component will promote investments in value-chain development, which is considered as a key condition for a sustained agricultural production programme. The AGP supports the establishment and operationalization of innovation and demonstration funds (for technology acquisition and transfer, support and capacity building to identify new markets and best business practices and access information). It also funds capacity building and technical assistance for the private and public sector (training). It promotes linkages with credit and sectoral analysis of constraints and value chain development (workshops and trainings). It also helps to strengthen supply systems of key inputs, e.g. seed sector support, support for community-based crop and forage seed production, genetic background of livestock (especially dairy cattle) improvement.
EX-ACT takes into account the GHG emissions related to the implementation of the training activities supporting the establishment and operationalization of innovation and demonstration funds. As in the previous sub-component, fuel consumption is used to estimate the impact of this set of activities. In total, 630 trainings will take place (all levels included) over five years, mainly technicians and assistant farmer/community inseminators. For this sub-component no details on the zone where the trainings will be organized were available. Therefore, an average of the distances between the four different zones was used: the average travel time would be 52 minutes, which is equivalent to 35km. It is assumed that there is no federal meeting. All participants would therefore walk or take public transportation. Accordingly, the total fuel consumption of this sub-component is equal to154 m3/year.

14 EASYPol Module 118 Applied Work
AGP also supports the increase in seed (including forage) availability and finances a mix of public and private investments in animal genetic improvement (upgrade facilities of artificial insemination centre, purchase breeding stock for breed multiplication farms, develop regional semen collection and processing centres, training for new and existing technicians and centre staffs). EX-ACT estimated the GHG emissions related to this mix of investments by considering the activity of upgrading livestock breeding facilities (Table 3) and the purchase of stock (Table 4). Table 3: Upgrade of livestock breeding facilities financed by AGP
Type of building m2
Semen collection centre: laboratory house 400 Bull sheds 300 Forage/hay sheds 400 semen collection area 200 offices 600 guard post 40 service centre 200 Store 200 Clinic 200 car shed 160 Total 2,700
Source: WB 2010
Table 4: Purchase of stock financed by AGP
Animal species n. animals heifers 300 jersey heifers 300 bulls 40 cows 400 poultry 10000 local breeding ewes 1000 rams 40 total 12080
Source: WB 2010
EX-ACT analysis takes into account the GHG emissions related to the upgrade of livestock breeding facilities (2,700 m2) in the module “other investments”, using default values from the tools developed by AFD, which shows that the GHG emissions related to the building of agricultural buildings (concrete) amount to 0.656 t CO2e/m2.
The purchase of livestock is considered in the module “livestock”. EX-ACT can estimate CH4 emissions from enteric fermentation and manure management, as well as

The Carbon Footprint of the Agricultural Growth Project (AGP) in Ethiopia An application of the EX-Ante Carbon-balance Tool (EX-ACT)
15
N2O emissions from manure management. CH4 emissions from manure management are those produced during storage and treatment of manure as well as from manure deposited on pasture, while N2O emissions are produced, directly or indirectly, during storage and treatment of manure (solid and liquid).
Since EX-ACT adopts a Tier 1 approach, only animal population data are needed to estimate the relative emissions. Default values for CH4 emissions from enteric fermentation and manure management used in EX-ACT computations are shown in Table 5 together with the N excretion rates adopted to compute N2O emissions from manure management. The mean annual temperature chosen at the beginning of the analysis is a critical parameter here as it affects both enteric fermentation and manure management and relative emissions. Table 5 IPCC default values for methane emissions from enteric fermentation and manure management in Africa used in EX-ACT
CH4 from enteric
fermentation CH4 from manure
management N excretion rate
(Kg CH4/head/year) (Kg CH4/head/year) (Kg N/t animal
mass/day) Dairy cattle 40.00 1.00 0.60 Other cattle 31.00 1.00 0.63 Sheep 5.00 0.15 1.17 Poultry 0.00 0.02 0.82
Source: Bernoux et al. 2010b
Although a detailed value-chain analysis has already been conducted in the project area20, the details of the activities foreseen under this component will be determined at the appraisal. Only some idea of the project strategy is already available21
. Therefore, the resulting EX-ACT analysis (shown in Table 6) should be considered only as partial. Nevertheless, since the EX-ACT methodology does not adopt a value-chain approach, the bias introduced in the analysis by not considering the agri-business activities the project will promote is very small.
20 Bekele 2010a, 2010b, 2010c, 2010d. 21 World Bank 2010.

16 EASYPol Module 118 Applied Work
Table 6 C balance associated with market and agribusiness development
Training activities Released GHG associated with Fuel consumption (agricultural or forestry machinery, generators…)
Annual Fuel Consumption (m3/yr) Emission (t CO2eq)Type of Fuel Default value Specific Default Start
t CO2 /m3 Value Factor t0 End Rate End Rate Without WithGasoil/Diesel 2.63 YES 0 0 Linear 154.0 Linear 0 7095OPTION1 + OPTION2 Sub-Total Without 0.0 Sub-Total With 7095.5 Difference 7095.5
All PeriodWithout Project With Project
Livestock breeding facilities Released GHG associated with building of infrastructure
Type of construction or infrastructure Default value Specific Default surface (m2) Emission (t CO2eq)t CO2 /m2 Value Factor Without With Without With
0.656 YES 0 2700 0.0 1771.2Subtotal 0.0 1771.2 Difference 1771.2
Agricultural Buildings (concrete)
Purchase of livestock Methane emissions from enteric fermentation
Total Emission (tCO2eq)IPCC Start Difference
Choose Livestocks: factor t0 End Rate End Rate Without WithDairy cattle 40 0 0 Linear 700 Linear 0 10,290 10,290Other cattle 31 0 0 Linear 340 Linear 0 3,873 3,873Buffalo 55 0 0 Linear 0 Linear 0 0 0Sheep 5 0 0 Linear 1,040 Linear 0 1,911 1,911Swine (Market) 1.5 0 0 Linear 0 Linear 0 0 0Swine (Breeding) 1.5 0 0 Linear 0 Linear 0 0 0Poultry 0 0 0 Linear 10,000 Linear 0 0 0Camels 46 0 0 Linear 0 Linear 0 0 0Camels 46 0 0 Linear 0 Linear 0 0 0User Defined- Specified value ---------------> 0 0 Linear 0 Linear 0 0 0User Defined- Specified value ---------------> 0 0 Linear 0 Linear 0 0 0
Sub-Total L-1 0 16,074 16,074
Methane emissions from manure managementTotal Emission (tCO2eq)
IPCC Start DifferenceLivestocks: factor t0 End Rate End Rate Without WithDairy cattle 1 0 0 Linear 700 Linear 0 257 257Other cattle 1 0 0 Linear 340 Linear 0 125 125Buffalo 1 0 0 Linear 0 Linear 0 0 0Sheep 0.15 0 0 Linear 1,040 Linear 0 57 57Swine (Market) 1 0 0 Linear 0 Linear 0 0 0Swine (Breeding) 1 0 0 Linear 0 Linear 0 0 0Poultry 0.02 0 0 Linear 10,000 Linear 0 74 74Camels 1.92 0 0 Linear 0 Linear 0 0 0Camels 1.92 0 0 Linear 0 Linear 0 0 0User Defined- Specified value ---------------> 0 0 Linear 0 Linear 0 0 0User Defined- Specified value ---------------> 0 0 Linear 0 Linear 0 0 0
Sub-Total L-2 0 513 513
Nitrous Oxide emissions from manure managementTotal Emission (tCO2eq)
IPCC Start DifferenceLivestocks: factor t0 End Rate End Rate Without WithDairy cattle 0.01 0 0 Linear 42 Linear 0 3,594 3,594Other cattle 0.01 0 0 Linear 14 Linear 0 1,153 1,153Buffalo 0.01 0 0 Linear 0 Linear 0 0 0Sheep 0.01 0 0 Linear 12 Linear 0 1,060 1,060Swine (Market) 0.01 0 0 Linear 0 Linear 0 0 0Swine (Breeding) 0.01 0 0 Linear 0 Linear 0 0 0Poultry 0.01 0 0 Linear 3 Linear 0 255 255Camels 0.01 0 0 Linear 0 Linear 0 0 0Camels 0.01 0 0 Linear 0 Linear 0 0 0User Defined- Specified value ---------------> Linear Linear 0 0 0User Defined- Specified value ---------------> Linear Linear 0 0 0see equation 10.30 Sub-Total L-3 0 6,062 6,062
0 22650 22,650
Head NumberAll Period
Annual amount of N manure* (t N per year)All Period
Without Project With Project
Without Project With Project
All PeriodHead Number
With ProjectWithout Project
Source: our computations using EX-ACT (2010)

The Carbon Footprint of the Agricultural Growth Project (AGP) in Ethiopia An application of the EX-Ante Carbon-balance Tool (EX-ACT)
17
The results show that GHG emissions associated with training activities amount to 7 095.5 tCO2e; those associated with upgrading livestock breeding facilities to 1 771.2 tCO2e; and those related to the purchase of livestock to 22 650 tCO2e. Overall, the set of activities related to market and agribusiness development will be a net source of GHG emissions of 31 516 tCO2e.
4.6 Component 2 (small-scale rural infrastructure development and management)
This component will support the construction, rehabilitation/improvement and management of small-scale rural infrastructure to address key production constraints, improve productivity, and develop and increase the efficiency of value chains through better market access.
4.6.1 Small-scale Agricultural Water Development and Management
Investments foreseen under this sub-component will include infrastructure development for new small-scale and micro-irrigation schemes on 18 000 ha (13 000 ha under small scale irrigation schemes and 5 000 ha under micro-irrigation technologies). This will include the establishment of micro-dams and groundwater recharge structures, gravity and pump diversions and groundwater development, the construction of ponds/tanks/wells, the supply of portable diesel irrigation pumps, mechanical pumps, family drip systems and similar technologies for 200 selected demonstration sites.
The sub-component will provide support for the implementation of soil and water conservation practices on 75 000 ha. This will include: protecting and rehabilitating watersheds where small-scale irrigation and/or water harvesting and micro-irrigation schemes are envisaged, promoting gully rehabilitation, area closures, plantation of multipurpose trees, groundwater recharge interventions; physical/biological measures to stabilize hillsides, degraded private and communal lands – e.g. check dams, gabions, reshaping/cultivation with multipurpose perennial trees, shrubs and grasses.
The AGP will also contribute to establishing and/or strengthening Water User Groups/Associations (training), and support capacity building in watershed management through short-term and tailor-made training, visits and study tours etc.
EX-ACT analysis related to the development of irrigation schemes is considered in the module “other investments”, which estimates the GHG emissions associated with infrastructure building (2,729 tCO2e). The implementation of soil and water conservation practices is considered in the module “grasslands”, which assimilates these types of activities to reduce land degradation, with the effect of increasing soil C stock by 2.37 MtCO2e.
EX-ACT takes into account the GHG emissions related to the training activities for small-scale agricultural water development and management. As discussed earlier, fuel consumption is used to estimate the impact of this set of activities. A total of 2 370 trainings will take place (all levels included) in five years. As in the previous sub-component, there was no detailed information about the distances covered by people

18 EASYPol Module 118 Applied Work
attending the meetings. Therefore, an average of the distances between the four different zones was used: the average travel time would be 52 minutes, which is equivalent to 35km. It was estimated that the implementation of this set of activities for this sub-component would cause an overall consumption of 634 m3/year of diesel (this also includes the fuel consumed by the use of the motorcycles purchased by the project). It results in an emission of 29 211 tCO2e.
The results (Table 7) show that overall, the set of activities related to small-scale agricultural water development and management will be a net sink of 5.06 MtCO2e. Table 7: C balance associated with small-scale agricultural water development and management Development of irrigation schemes Released GHG associated with installation of irrigation systems
Installation of irrigation system surface (ha) Type of irrigation systemAssociated tCO2eqWithout Project 0 Hand moved sprinkle 0.0With Project 5000 Trickle 1556.5
13000 Surface with IRSS 1172.6 Difference 1556.5 2729.1 Soil and water conservation practices Description of Grassland type, their management and areas (ha)Name of the Systems Succession type Fire used to manage Delta C*
Final (with or without project) Without project With project Cstart Cend tCO2eq/ha/yrDefault Your name Initial state State of the Grassland Fire* Interval (yr) Fire* Interval (yr) t C/ha t C/haReserved system G1 from Deforestation NO 5 NO 5 38.00 38.00 0.00Reserved system G2 converted to A/R NO 5 NO 5 38.00 38.00 0.00Reserved system G3 From OLUC NO 5 NO 5 38.00 38.00 0.00Reserved system G4 Grassland to OLUC NO 5 NO 5 38.00 38.00 0.00Grass-2 s&WC 1 NO 5 NO 5 36.48 48.93 2.28Grass-3 without project NO 5 NO 5 36.48 26.60 -1.81Grass-4 s&WC 2 NO 5 NO 5 36.48 44.08 1.39
Default Without project With Project Soil C variations (tCO2eq) Total CO2 eq from fire Total CO2eq Difference refers to initial state)End Rate End Rate Without With Without With Without With tCO2eq t0
System G1 from Deforestation 0 Linear 0 Linear 0 0 0 0 0 0 0 0System G2 converted to A/R 0 Linear 0 Linear 0 0 0 0 0 0 0 0System G3 From OLUC 0 Linear 0 Linear 0 0 0 0 0 0 0 0System G4 Grassland to OLUC 0 Linear 3500 Linear 0 0 0 0 0 0 0 3500Grass-2 s&WC 1 0 Linear 37500 Linear 0 -1497746 0 0 0 -1497746 -1497746 0Grass-3 without project 84649 Linear 0 Linear 0 -2683232 0 0 0 -2683232 -2683232 84649Grass-4 s&WC 2 0 Linear 37500 Linear 0 -914375 0 0 0 -914375 -914375 0Grass-5 s&WC 3 10000 Linear 0 Linear 0 0 0 0 0 0 0 10000
Grassland total 0.0 -5095353.5 -5095353.5
Carbon Stock
Non degradedNon degraded
Severely DegradedImproved without inputs managemen
Moderately Degraded
Non degradedNon degradedImproved with inputs improvementModerately Degraded
Non degradedNon degradedNon degradedNon degraded
Moderately Degraded
Training activities Released GHG associated with Fuel consumption (agricultural or forestry machinery, generators…)
Annual Fuel Consumption (m3/yr) Emission (t CO2eq)Type of Fuel Default value Specific Default Start
t CO2 /m3 Value Factor t0 End Rate End Rate Without WithGasoil/Diesel 2.63 YES 0 0 Linear 634.0 Linear 0 29211OPTION1 + OPTION2 Sub-Total Without 0.0 Sub-Total With 29211.2 Difference 29211.2
All PeriodWithout Project With Project
Source: our computations using EX-ACT (2010)
4.6.2 Small-scale Market Infrastructure Development and Management
Interventions under this sub-component include: feeder road development (800 km of small-scale feeder roads, roadside drainage and footbridges); market centre construction/improvement/development (40 primary, 20 secondary and eight terminal market centres); and institutional development and capacity building of relevant implementing and advisory agencies (establishing and training road maintenance groups for repair and maintenance of community-owned transport infrastructure, establishing and/or strengthening market centre management committees).

The Carbon Footprint of the Agricultural Growth Project (AGP) in Ethiopia An application of the EX-Ante Carbon-balance Tool (EX-ACT)
19
EX-ACT estimates the GHG emissions related to road development in the module “other investments”: road for medium traffic in asphalt is assumed, with a default value of 0.073 tCO2e emitted per m2. The same module also provides the estimates for the construction of market centres: it is assumed that the primary, secondary and terminal market centres will have a surface of 200, 500, and 1000 m2 respectively. Therefore, a total of 24 000 m2 of agricultural buildings (metal) will be built (default value of 0.22 tCO2e emitted per m2).
EX-ACT takes into account the GHG emissions related to the training activities for small-scale market infrastructure development and management. Again, fuel consumption was used to estimate the impact of this set of activities. A total of 468 trainings will take place in five years. Given an estimated average travel time of 52 minutes (equivalent to 35km), it is estimated that the implementation of this set of activities will cause an overall consumption of 17 m3/year of diesel (this also includes the fuel consumed by the use of the motorcycles purchased by the project). The results (Table 9) show that: GHG emissions associated with training activities amount to 783 tCO2e; emissions related to road construction and building of market centres amount to 225 280 tCO2e; and overall, the set of activities related to small-scale market infrastructure development and management will be a source of 226 063 tCO2e.
Table 8: C balance associated with small-scale market infrastructure development and management
Training activities Released GHG associated with Fuel consumption (agricultural or forestry machinery, generators…)
Annual Fuel Consumption (m3/yr) Emission (t CO2eq)Type of Fuel Default value Specific Default Start
t CO2 /m3 Value Factor t0 End Rate End Rate Without WithGasoil/Diesel 2.63 YES 0 0 Linear 17.0 Linear 0 783OPTION1 + OPTION2 Sub-Total Without 0.0 Sub-Total With 783.3 Difference 783.3
All PeriodWithout Project With Project
Road construction and building of market centres Released GHG associated with building of infrastructure
Type of construction or infrastructure Default value Specific Default surface (m2) Emission (t CO2eq)t CO2 /m2 Value Factor Without With Without With
0.073 YES 0 3000000 0.0 220000.00.220 YES 0 24000 0.0 5280.0
Subtotal 0.0 225280.0 Difference 225280.0
Road for medium trafic (asphalt)Agricultural Buildings (metal)
Source: our computations using EX-ACT (2010)
5 RESULTS AND DISCUSSION
5.1 Main results
The project is essentially promoting changes in land management. Nevertheless, it is assumed that in the “without project” case, annual cropland will expand at the expense of grasslands. This is shown in Table 1, which summarizes the changes in land use in both “with” and “without project” scenarios.

20 EASYPol Module 118 Applied Work
Table 9: Land use matrix of the AGP
Without Project Forest/ GrasslandPlantation Annual Perennial Rice Degraded Other Total Initial
INITIAL Forest/Plantation 0 0 0 0 0 0 0 0Annual 0 168049 0 0 0 0 0 168049
Cropland Perennial 0 0 0 0 0 0 0 0Rice 0 0 0 0 0 0 0 0
Grassland 0 3500 0 0 94649 0 0 98149Other Lan Degraded 0 0 0 0 0 0 0 0
Other 0 0 0 0 0 0 0 0Total Final 0 171549 0 0 94649 0 0 266198
With Project Forest/ GrasslandPlantation Annual Perennial Rice Degraded Other Total Initial
INITIAL Forest/Plantation 0 0 0 0 0 0 0 0Annual 0 168049 0 0 0 0 0 168049
Cropland Perennial 0 0 0 0 0 0 0 0Rice 0 0 0 0 0 0 0 0
Grassland 0 0 0 0 98149 0 0 98149Other Lan Degraded 0 0 0 0 0 0 0 0
Other 0 0 0 0 0 0 0 0Total Final 0 168049 0 0 98149 0 0 266198
Cropland
Cropland
FINALOther Land
FINALOther Land
Table 9 summarizes the overall C balance of the project, computed as the difference between C sinks and sources over 20 years (five years of implementation phase and 15 years of capitalization phase). The project is able to sequester 8.3 MtCO2e while emitting 2.4 MtCO2e so that the net effect of project activities is to create a sink of 5.9 MtCO2e, which corresponds to a unitary mitigation potential of 1.1 tCO2e/ha per year. Table 9: C-balance of the AGP
C-balance elements
MtCO2e over 20 years
Total GHG mitigated
-8.3
Total GHG emitted
2.4
C-balance -5.9 Source: our calculations using EX-ACT (2010)
Table 10 shows the mitigation potential of the project by category of land use change (corresponding to the EX-ACT modules). Mitigation potential is linked to the changes in the management of annual cropland and grasslands (improved agronomic practices, soil and water conservation) and to the “avoided” expansion of annual cropland on grasslands. Most GHG emissions are determined by the increase in input use associated with the scaling up of the best practices on cropland.

The Carbon Footprint of the Agricultural Growth Project (AGP) in Ethiopia An application of the EX-Ante Carbon-balance Tool (EX-ACT)
21
Table 10: Mitigation potential of the AGP, by EX-ACT module
EX-ACT modules
MtCO2e over 20 years
% of total GHG mitigated
% of total GHG emitted
Annual crops -2.5 30.8 -
Grassland -5.6 67.3 -
Non Forest Land Use Change -0.2 1.9
Total GHG mitigated -8.3 100 -
Livestock 0.02 - 0.6
Inputs 1.9 - 47.9
Other Investments 0.5 - 5.5
Total GHG emitted 2.4 - 100
C-balance -5.9 - - Source: our calculations using EX-ACT (2010)
Table 11 summarizes the results of the EX-ACT analysis by project component. It is evident from the table that most of the project’s mitigation potential is determined by the adoption of soil and water conservation measures, which in fact can reduce soil erosion, increase soil capacity to store C and improve the overall soil fertility (see the sub-component small-scale agricultural water development and management). It is interesting to observe that scaling up best practices results in a C sink, although it promotes the intensification of agricultural production through an increase in the use of inputs. In fact, although inputs use represents a source of GHG emissions, the soil C sequestered through the adoption of sustainable land management practices offsets such emissions and the overall component ends up being a net C sink. This shows that the adoption of sustainable agricultural practices could be seen as complementary to the use of agro-chemicals not only for the relevant agronomic implications, but also for the climate change mitigation side. It is also interesting to observe that neither the implementation of training activities nor the construction/rehabilitation of infrastructures (irrigation, markets) are causing a significant production of GHG emissions. Given the importance of such activities in project implementation, this is an important result.

22 EASYPol Module 118 Applied Work
Table 11: Mitigation potential of the AGP, by project component (MtCO2e over 20 years)
Component 1: Agricultural production and commercialization
Institutional strengthening and development
0.04
Scaling up best practices -1.1
Market and agribusiness development 0.03
Component 2: Small-scale rural infrastructure development and management
Small-scale Agricultural Water Development and Management
-5.1
Small-scale Market Infrastructure Development and Management
0.2
C-balance -5.9
Source: our calculations using EX-ACT (2010)
5.2 Sensitivity analysis
The analysis presented has taken into account the possible impact on GHG emissions of the training activities, which will be conducted during project implementation. It is worth noting that this represents an innovative approach in the application of the ex-ante C-balance analysis and is therefore interesting to estimate the C footprint of this set of activities. An alternative scenario is built by excluding the GHG emissions related to fuel consumption consequent to the training activities: under this scenario (the so-called “no training”) a reduction by 10 percent of overall GHG emissions from project activities is recorded. Under this scenario the final balance amounts to -6.1 MtCO2e over 20 years with an almost negligible change of the unitary mitigation potential (1.15 tCO2e/ha per year, i.e. +4%).
A second scenario is built on the hypothesis that the adoption of best farming practices will be wider than in the main scenario. Under this so-called “optimistic” scenario, it is assumed that all farmers in the potential area (i.e. 162,500 ha) will adopt the improved practices. As a result, the overall C balance will amount to -7.9 MtCO2e over 20 years, with an increase of 33 percent in the C sequestered. The corresponding unitary mitigation potential will be equal to 1.5 tCO2e/ha per year.

The Carbon Footprint of the Agricultural Growth Project (AGP) in Ethiopia An application of the EX-Ante Carbon-balance Tool (EX-ACT)
23
5.3 Economic analysis
Public and private mitigation financing for agriculture can play two important roles: providing increased investment flows to the agricultural sector of developing countries, and/or providing increased incomes to farmers in the form of C payments. Mitigation finance could be either public or market-based and integrated with existing official development assistance (ODA). Rural development projects involving the implementation of sustainable land management practices could therefore obtain funds from C finance related to mitigation benefits22
It is possible to classify projects that are of interest for agricultural development into four categories depending on their mitigation potential. Type 0 projects have no mitigation potential (e.g. they are a net source of GHG emissions) and cannot benefit from any additional financing from the C sector. Type 1 projects have a low mitigation potential so that the mitigation benefits are smaller than the costs for monitoring, reporting and verifying (MRV) C mitigation activities. There would be no space for additional project financing from C mitigation sources (ODA public funds remain the main financing source for this category of projects). For type 2 projects, the benefits of pursuing low-C agricultural strategies may be greater than the costs associated with the adoption of basic MRV for public implementation. In this case, public funding may be a possible financing source which could integrate ODA funds, as project offsets are considered as public goods and therefore purchased by a public institution. For type 3 projects, mitigation benefits are greater than the costs of adopting and meeting C crediting MRV requirements (presumably higher than MRV for public sector options) so that C crediting mechanisms are a suitable source of financing for this category of projects. This is the case, for example, of projects aimed at producing C credits from agriculture in developed countries to be sold on the (voluntary or mandatory) C markets (see Figure 3).
.
Figure 3: Financing options for agriculture development and mitigation projects
Source: adapted from FAO 2009.
22 Branca et al 2010.
Type 1 Type 2 Type 3

24 EASYPol Module 118 Applied Work
It is not easy to estimate the transaction costs related to the accounting of C activities at public or market level, given the lack of information and the fact that data available are not in standard format to allow accurate comparison. Therefore more research is needed on this topic. Nevertheless, for the purpose of this note, it is assumed that the transaction costs for public implementation are equal to 4 US$/ha (per year) which is an arbitrary but plausible value based on some available literature23. The transaction costs for selling C credits on the market will be obviously higher, given the number and type of requirements, e.g. establish baseline and C flows of the project, design monitoring plan, establish permanent sampling plots, prepare project design document, design individual farm plans, monitor C stocks reported by farmers, verification and certification24
The preliminary estimates from EX-ACT have shown that the average mitigation potential of the AGP is equal to 1.1 tCO2e/ha per year which could be valued using a price of 3 US$/t CO2e, computed as the average C price for agricultural soil C at retail level on the voluntary C market in 2008
.
25
6 CONCLUSIONS
. Therefore, the value of the average mitigation potential of the AGP amounts to 3.3 US$/ha. Since this value is below the level of transaction costs for public implementation 4 US$/ha (see above), the AGP can be classified as type 1 project. Nevertheless, the sensitivity analysis has shown that under the “optimistic scenario” the net unitary mitigation potential of AGP will amount to 1.5 tCO2e/ha corresponding to a value of 4.5 US$/ha. Under this scenario, the AGP would be classified as a type 2 project and could therefore be taken into consideration for C financing from the public sector.
The paper describes the ex-ante C-balance analysis performed for the Agricultural Growth Project (AGP) in Ethiopia. The results show that overall the net effect of AGP is to create a C sink of 5.9 MtCO2e over 20 years, which represents the balance between the GHG emitted (mainly as a consequence of the increased use in agro-chemicals and of the infrastructure building planned) and C sequestered (essentially through scaling up of best practices).
These results represent an interesting case: the AGP is promoting an intensification of crop and livestock production over a relevant land area (more than 266,000 ha) at national scale, supporting an increase in input use and building infrastructure, thus resulting in a relevant GHG emissions source. Nevertheless, the project will also fund the adoption of several sustainable agricultural practices (soil and water conservation, improved agronomic practices), which are not only offsetting the emissions of project activities but also contributing to create a C sink. The adoption of sustainable agricultural practices could therefore be seen as complementary to the intensification of crop production not only for the relevant agronomic implications, but also from an environmental (climate change mitigation) point of view.
23 Cacho et al. 2005; Lipper at al. 2010; Mooney et al. 2004 24 Cacho and Lipper 2006. 25 Hamilton et al. 2009.

The Carbon Footprint of the Agricultural Growth Project (AGP) in Ethiopia An application of the EX-Ante Carbon-balance Tool (EX-ACT)
25
The unitary mitigation potential of 1.1 tCO2e/ha per year is in line with similar cases where sustainable land management practices are introduced on annual cropland and land degradation halted thanks to soil and water conservation measures26
Interestingly, fuel consumption consequent to training activities is shown to have a very small impact on GHG emissions and on the overall project C-balance, although a relevant set of capacity-building activities will be put in place. This is certainly determined by the limited use of private transportation and by the relatively small distances to be travelled (also thanks to the well structured locally organized training sessions).
. Nevertheless, an expansion in the land interested by the adoption of the best practices could certainly increase the AGP mitigation potential and improve the overall C value of the project. This is demonstrated in the hypothetical case of full adoption of the best practices among all farmers in project area. In this “optimistic” scenario, the higher value of the C co-benefits would make the project worth being financed by the public C sector.
The results presented here are only preliminary estimates based on available information (or derived on the basis of working hypotheses) at this stage of the project appraisal. In fact, since many project activities are demand-driven, consolidated information will be available only during the implementation of the project (e.g. when the sub-projects will be fully developed). Also, the analysis was conducted at national level in order to include the 83 woredas which will be part of the project: data on climate characteristics, soil conditions, agricultural land use and management adopted represent only an average for the country. The uncertainty in the data availability and the significant number of assumptions made are inevitably reflected in the results discussed.
7 LINKS TO OTHER EASYPOL MATERIALS
This module belongs to a set of EASYPol modules and other related documents. See EASYPol Module 101 below:
•
•
EX-ante Carbon-Balance Tool : Software
•
EX-ante Carbon-Balance Tool : Technical Guidelines
EX-ante Carbon-Balance Tool : Brochure
See all EX-ACT resources in EASYPol under the Resource package, Investment Planning for Rural Development - EX-Ante Carbon-Balance Appraisal of Investment Projects
8 FURTHER READING/ REFERENCES
Alem, Y., Bezabih, M., Kassie, M., & Zikhali, P., 2008. Does Fertilizer Use Respond to Rainfall Variability? Panel Data Evidence from Ethiopia. School of business, Economics and law, University of Gothenburg. Dept of Economics. Göteborg, Sweden. December.
26 EX-ACT, 2010.

26 EASYPol Module 118 Applied Work
BDS-CDR, 2010. Agricultural Growth Program Survey and Establishing Baseline for Impact Evaluation. Centre for Development Research (CDR), Addis Ababa, Ethiopia, May.
Bekele, M., 2010a. Agricultural Value Chain Commodity Selection for Oromia Region. The World Bank. Ethiopia Office. Addis Ababa. May.
Bekele, M., 2010b. Agricultural Value Chain Commodity Selection for SNNPRS. The World Bank. Ethiopia Office. Addis Ababa. July.
Bekele, M., 2010c. Agricultural Value Chain Commodity Selection for Amhara Region. The World Bank. Ethiopia Office. Addis Ababa. August.
Bekele, M., 2010d. Agricultural Value Chain Commodity Selection for Tigray Region. The World Bank. Ethiopia Office. Addis Ababa. September.
Bernoux, M., Branca, G., Carro, A., Lipper, L., Smith, G., & Bockel, L. 2010a. Ex-Ante Greenhouse Gas Balance of Agriculture and Forestry Development Programs, Scientia Agricola 67: 31-40.
Bernoux, M., Bockel, L., Branca, G., & Tinlot, M., 2010b. EX-Ante Carbon-Balance Tool (EX-ACT) Technical Guidelines, version may 2010, EASYPol Module 101 FAO, Rome, 79 p. Available at:
Branca, G., Lipper, L., & Bockel, L., 2010. Potential Use of the EX-Ante C-balance Tool (EX-ACT) in the Economic and Financial Analysis of Agriculture and Mitigation Projects. Working paper. FAO. Rome.
http://www.fao.org/docs/up/easypol/780/EX-ACT-tech-guidelines_101EN.pdf
Bejene, A.; Bekele, M., & Malo, M., 2010. The Ethiopian National Adaptation Plan of Action (NAPA) with Respect to Promotion of on farm Forestry and Agro Forestry in Ethiopia. Addis Ababa, Ethiopia.
Burney, J.A., Davisc, S.J., & Lobella, D.B., 2010. Greenhouse Gas Mitigation by Agricultural Intensification. PNAS, June 29, 2010, vol. 107, no.26, pp. 12052–12057. Retrieved on November 20th, 2010 from http://www.pnas.org/content/107/26/12052 .
Dejene, A., Bekele, M., & Malo, M., 2009. The Ethiopian National Adaptation Plan of Action (NAPA) with Respect to Promotion of on Farm Forestry and Agro Forestry in Ethiopia, Ministry of Agriculture, Ethiopia.
FAO, 2010. The EX-Ante Carbon-balance Tool, FAO, 2011 available at http://www.fao.org/docs/up/easypol/780/ex-act_version_3-2_april_2011_101en.xls
FAO, 2010. Farming Systems and Growth Potentials in Agricultural Growth Project (AGP) Woredas in Ethiopia, January, Rome.
IPCC, 2006. 2006 IPCC Guidelines for National Greenhouse Gas Inventories, H. Eggleston, Buendia L, Miwa K, Ngara T, Tanabe K, Editor. The National Greenhouse Gas Inventories Programme, Intergovernmental Panel on Climate Change.
Kebede, K., 2010. Opportunities in Crop Insurance and Modalities for Adaptation to Small Holder Dry Land Farmers for Climate Adaptation. World Food Programme, Addis Ababa. June.
The Carbon Footprint of the Agricultural Growth Project (AGP) in Ethiopia An application of the EX-Ante Carbon-balance Tool (EX-ACT)
27
Ministry of Economic Development and Cooperation (MEDaC), 1999. Survey of the Ethiopian Economy. Review of post reform developments (1992/93-1997/98).
Pfeiffer, H., & Alemu, D., 2010. Agricultural Growth Programme in Ethiopia, Farming Systems and Growth Potentials in AGP woredas. Investment Centre, Service Africa (TCIA), Rome. January.
Rudela ,T.K., Schneiderb, L., Uriartec, M., Turner IId, B.L., DeFriesc, R., Lawrencee, D., Geogheganf, J., Hechtg, S., Ickowitzf, A., Lambinh, E.F., Birkenholtzb, T., Baptistai, S., & Grauj, R., 2009. Agricultural Intensification and Changes in Cultivated Areas, 1970–2005. PNAS, December 2009, vol.106, no. 49, 20675–20680. Retrieved on November 20th, 2010 http://www.pnas.org/content/106/49/20675.full.pdf
Tadesse, M., Alemu, B., Bekele, G., Tebikew, T., Chamberlin, J., & Benson T., 2006. Atlas of the Ethiopian Rural Economy. Ethiopian Development Research Institute, Addis Ababa. http://www.ifpri.org/node/3763
World Bank, 2008. The Sustainable Land Management Project in Ethiopia. Project Appraisal Document. World Bank, Washington, DC, May.
World Bank, 2010. The Agricultural Growth Project in Ethiopia. Project Appraisal Document. World Bank, Washington, DC, March.
World Bank, 2008. Sustainable Land Management Project in Ethiopia. Project Appraisal Document. World Bank, Washington, DC, March.
World Bank, 2007. Project Performance Assessment Report, Seed Systems Development Project, National Fertilizers Sector Project. Report No. 40124. Sector, Thematic and Global Evaluation Independent Evaluation Group. Ethiopia. June.