aimia 2.0 template databases, cyber security and consumer privacy, changes to the aeroplan program,...
TRANSCRIPT

AIMIA CREDIT RATING AGENCY MEETINGS
December 2013
DELETED SLIDES 7 AND 11
FROM PREVIOUS VERSION
CHANGED DATE ON FRONT
PAGE
REORDERED SLIDES IN DECK
ADDED PLACEHOLDERS FOR
NEW SLIDES
CAN WE CHANGE THE IMAGE
ON COVER SLIDE TO
DISTINGUISH VS EQUITY
PRESENTATION?
AIMIA
March 2015

FORWARD-LOOKING STATEMENT
2
Forward-looking statements are included in this presentation. These forward-looking statements are typically identified by the use of terms such as “outlook”, “guidance”, “target”, “forecast”, “assumption” and other similar expressions or future or conditional terms such as "anticipate", "believe", "could", "estimate", "expect", "intend", "may", "plan", "predict", "project", "will", "would", and “should”. Such statements may involve but are not limited to comments with respect to strategies, expectations, planned operations or future actions.
Forward-looking statements, by their nature, are based on assumptions and are subject to important risks and uncertainties. Any forecasts, predictions or forward-looking statements cannot be relied upon due to, among other things, changing external events and general uncertainties of the business and its corporate structure. Results indicated in forward-looking statements may differ materially from actual results for a number of reasons, including without limitation, dependency on significant Accumulation Partners and clients, failure to safeguard databases, cyber security and consumer privacy, changes to the Aeroplan Program, reliance on Redemption Partners, conflicts of interest, greater than expected air redemptions for rewards, regulatory matters, retail market/economic conditions, industry competition, Air Canada liquidity issues, Air Canada or travel industry disruptions, airline industry changes and increased airline costs, supply and capacity costs, unfunded future redemption costs, changes to coalition loyalty programs, seasonal nature of the business, other factors and prior performance, foreign operations, legal proceedings, reliance on key personnel, labour relations, pension liability, technological disruptions and inability to use third-party software, failure to protect intellectual property rights, interest rate and currency fluctuations (including currency risk or our foreign operations which are denominated in a currency other than the Canadian dollar, mainly pound sterling, and subject to fluctuations as a result of foreign exchange rate variations), leverage and restrictive covenants in current and future indebtedness, uncertainty of dividend payments, managing growth, credit ratings, audit by tax authorities, as well as the other factors identified throughout Aimia’s MD&A and its other public disclosure records on file with the Canadian securities regulatory authorities.
In particular, slides 13 and 14 of this presentation contain certain forward-looking statements with respect to certain financial metrics in 2015. Aimia made a number of general economic and market assumptions in making these statements, including assumptions regarding currencies, the performance of the economies in which the Corporation operates and market competition and tax laws applicable to the Corporation’s operations. The Corporation also made certain assumptions, with respect to the financial impact of the outcome of its ongoing negotiations with each of TD and CIBC, in relation to the Aeroplan financial card agreements as a result of changes to credit card interchange rates to be implemented as of April 30, 2015. The Corporation cautions that the assumptions used to make these statements with respect to 2015, although reasonable at the time they were made, may prove to be incorrect or inaccurate. In addition, these statements do not reflect the potential impact of any non-recurring or other special items or of any new material commercial agreements, dispositions, mergers, acquisitions, other business combinations or transactions that may be announced or that may occur after February 27, 2015. The financial impact of these transactions and non-recurring and other special items can be complex and depends on the facts particular to each of them. We therefore cannot describe the expected impact in a meaningful way or in the same way we present known risks affecting our business. Accordingly, our actual results could differ materially from the statements made on slides 13 and 14 of this presentation.
The forward-looking statements contained herein represent the Corporation’s expectations as of February 27, 2015 and are subject to change. However, Aimia disclaims any intention or obligation to update or revise any forward-looking statements whether as a result of new information, future events or otherwise, except as required under applicable securities regulations.
For further information, please contact Investor Relations at 416 352 3728 or [email protected].

A DATA-DRIVEN MARKETING AND ANALYTICS COMPANY
INSPIRING LOYALTY THROUGH A FULL-SUITE GLOBAL OFFERING
Proprietary
Loyalty
Services
FY 2014 Consolidated Gross Billings
$2.687B
Coalition Analytics
& Insights Proprietary Coalition
(Loyalty Units) 75%
Proprietary Loyalty
and Analytics & Insights 25%
75%
3

WE HAVE COME A LONG WAY
4
$1billion invested (net of cash) since 2007 that contributed $100 million to
Adjusted EBITDA in each of the last 3 years

THE LARGEST PURE PLAY LOYALTY COMPANY IN THE WORLD
UNMATCHED GLOBAL SCALE AND SCOPE
5
Mexico
USA
Chile
Canada UK
Italy
India Hong Kong
Malaysia Indonesia
Singapore
Australia
New
Zealand
Bahrain Japan
Egypt
Oman
Jordan
Lebanon
Qatar
UAE
Spain
57%
43%
Canada
Rest of World
Consolidated
Gross Billings
FY 2014
$2.687B

…WITH SUBSTANTIAL ROOM TO GROW
Market Size
$B, 2012
160
Global marketing
spend
900
Proprietary
$80-87B
Coalitions Aimia’s addressable
loyalty market
Non- addressable
by geography
-60
Loyalty marketing
spend
Non-loyalty marketing
spend
-740
May be subject
to disruptive
strategies from
loyalty players
Source: Euromonitor, Aimia analysis
$90-100B $13-20B
6

BUILDING ON A STRONG FINANCIAL TRACK RECORD
7
2,188 2,233 2,243 2,366
2,687
FY 2010 FY 2011 FY 2012 FY 2013 FY 2014
Gross Billings 2010-2014
($M)
273.6(2)
221.5(3)
299.5 268.1(4)
287.0
FY 2010 FY 2011 FY 2012 FY 2013 FY 2014
Free Cash Flow 2010-2014(1)
($M)
1) Free Cash Flow before common and preferred dividends paid.
2) Adjusted for $20.4 million related to the Nectar Italia launch costs, $26.8 million related to Carlson Marketing migration costs, and $5.2 million for Carlson Marketing
retention bonuses and new rewards platform.
3) Adjusted for the funding of the prepaid card liability of $23.9 million in the US business.
4) Adjusted for the CIBC payment of $150.0 million and the related harmonized sales tax of $22.5 million.

CONTINUED RETURN TO SHAREHOLDERS
8
$0.125 $0.125
$0.150 $0.160
$0.170 $0.180
2009 2010 2011 2012 2013 2014
Quarterly Dividends Per Common Share*
Repurchased ~$363M of
common shares between 2010 to 2014 pursuant to
NCIB
Return of Capital
since 2009
~$647M
of dividends
paid to common
shareholders
between 2009
and 2014
* Quarterly dividends paid in June each year.

2014 WAS A YEAR OF EXCEPTIONAL PROGRESS
9
• Aeroplan: fantastic year with new financial
partners and launch of Distinction
• Expanded the coalition business in Asia, Spain
• Intelligent Shopper Solutions (ISS) data
analytics business momentum
• Initial sales of next-generation global platforms
(ALP/ACP)
• Gross Billings up +9.3% (constant currency
basis) to $2,686.6 million, Adjusted EBITDA of
$316.4 million, and FCF of $287.0 million
Met or exceeded our
guidance on all key
financial metrics

2015 AND BEYOND
10
Leverage our unique capabilities and experience to replicate our
success globally
Continue to build breadth and scale in our business to serve global
clients
Make investments to enter new markets or to efficiently access
capabilities; and exit investments if not generating an acceptable return
on capital
Look for opportunities in evolving field of marketing data science that
drive benefits for partners and program members
Continue to deliver attractive returns to shareholders:
• Quarterly dividend per common share raised from $0.17 to $0.18 in
2014
• Approximately $30 million in common shares repurchased in 2014
with approximately another $20 million shares repurchased to date in
2015

ACCESS TO A RICH COALITION DATA SET
Transaction and Program
Interaction Data
• Transaction level data in all Nectar
partners and e-stores (location, spend,
frequency)
• Responsiveness to Nectar offers
and Partner marketing
Behaviours and Attitudes
• Attitudes to loyalty (e.g. loyal to merchant
or regular switching)
• Price sensitivity (e.g. deal-seeker or buys
premium products)
• Online search data
• Media consumption data
• Location data (mobile)
Lifestyle and
Social Data
• Mosaic segmentation
• Household metrics (children,
income, home/car ownership)
• Social network data
Personal and Registration Data
• Name
• Gender
• DOB
• 95% accurate (regular cleansing)
• Address
• Phone
11

CAPTURING 50% OF CONSUMERS’ ANNUAL SPEND
12
Savings
Life Assurance
/ Pensions
Insurance
Mortgage
Mobile
Water
Gas
Electricity
Telephone /
Broadband
/ Cable TV
Council
Tax
Rent
Household
Products
Alcohol
Food
Garden
Pets
Carpets / Flooring
DIY / Hardware
Furniture /
Home
Furnishings
Domestic
Services /
Repairs
Other Credit Card / Bank Fees TV License
Incidentals
Repairs /
Servicing
Fuel
Car
Purchase
Financial Household Bills Grocery Home / Garden Car Travel L&E
2% 1%
Taxi
Air
Car Service
Rail / Bus
/ Ferry
Forex /
Duty Free
Vacations Restaurant
Take Away
Food
Entertainment
Vacations
Ticketing
Sh
oe
s
Ac
ce
ss
ori
es
M
en
W
om
en
Hair
/ B
ea
uty
Bro
wn
Go
od
s
New
sp
ap
ers
/ M
ag
azin
es
To
ys
/ G
am
es
To
ile
trie
s
Sta
tio
na
ry
Mu
sic
/ M
ovie
s
Clo
thin
g
Wh
ite
Go
od
s
Co
sm
eti
cs
O
pti
ca
l
Bo
ok
s
Bab
y
Ph
oto
Ph
arm
ac
y
Captured Indirectly captured Not Captured

2015 GUIDANCE*
13
($ in millions)
2014 Reported 2014 Normalized(1) 2015 Guidance
Gross Billings $2,686.6 $2,586.6 Between $2,560 to $2,610
Adjusted EBITDA
and margin
$316.4
11.8%
$216.4
8.4%
Adjusted EBITDA margin
approximately 9%
Free Cash Flow before
Dividends Paid $287.0 $94.3 Between $220 to $240
Capital Expenditures $81.5 $81.5 Between $70 to $80
* Please refer to Slide 3 for a description of the assumptions made with respect to and risks related to the 2015 forecasts.
(1) Gross Billings and Adjusted EBITDA exclude the upfront $100 million TD contribution. Free Cash Flow before Dividends paid excludes the $100.0 million contribution from
TD, tax proceeds of $90.9 million related to loss carry back and $22.5 million related to HST, offset by a $20.7 million deposit made to Revenue Quebec.
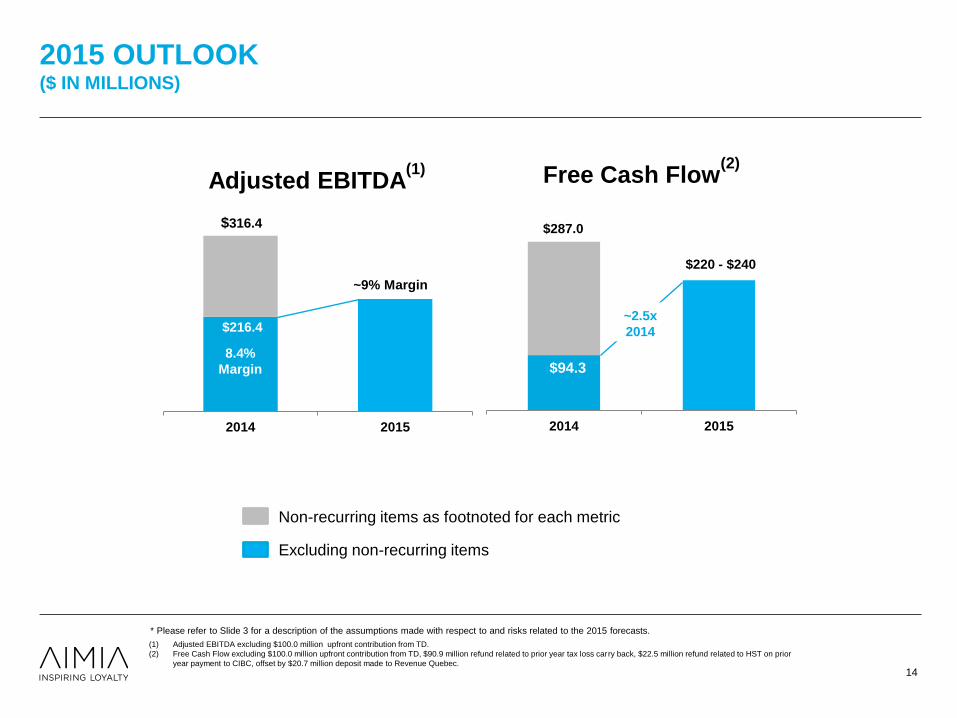
2015 OUTLOOK ($ IN MILLIONS)
14
US &
APAC
EMEA
Canada
Breakage
Impact PLM Stock
Based
Compensation
Corporate
Consolidated +60.1% growth
Consolidated: +17.0% growth; 12.1% in c.c.(1)
Canada: +22.4%; EMEA: +12.7%; -1.2% in c.c.(1)
US & APAC: +5.2%; 0.0% in c.c.(1)
Non-recurring items as footnoted for each metric
(1)
(1)
(2)
(1) Adjusted EBITDA excluding $100.0 million upfront contribution from TD.
(2) Free Cash Flow excluding $100.0 million upfront contribution from TD, $90.9 million refund related to prior year tax loss carry back, $22.5 million refund related to HST on prior
year payment to CIBC, offset by $20.7 million deposit made to Revenue Quebec.
$216.4
2014 2015
Adjusted EBITDA(1)
8.4%
Margin
~9% Margin
$316.4
$94.3
2014 2015
Free Cash Flow(2)
$220 - $240
$287.0
~2.5x
2014
Excluding non-recurring items
* Please refer to Slide 3 for a description of the assumptions made with respect to and risks related to the 2015 forecasts.

AEROPLAN TRANSFORMATION
15
Aeroplan
• Yield + Spend + Rewards Mix
dynamics will continue
• Mid-to-high single digit growth from
financial partners; Interchange
factored into guidance
• Growth from Air Canada’s increased
capacity
15.5%(1)
2014 2015
Adjusted EBITDA Margin
Core business
(1) Adjusted EBITDA margin excluding the $100.0 million contribution from TD.
Expect
margin
growth for
2015
Proprietary Loyalty
• Loss of large financial service
client in proprietary business
2015 ImpactsYield
• Welcome Bonus activity should taper
• Marketing and bonus program ongoing
• Impact of Interchange embedded in guidance
Rewards Mix
• Stronger USD
• Expected continued popularity of MFFR
• Airfares remain stable
Card Spend
• Renewal trends
• Spending patterns

EMEA AND US & APAC
16
• Nectar Italia partner transition
• Nectar base/bonus points rebalance
• Industry and macroeconomic factors ongoing
in Italy and UK
• Continued sales momentum in proprietary
loyalty and analytics
• Delivering Aimia Loyalty Platform and Aimia
Campaign Product pushing up global product
costs slightly
A return
to growth
in 2016
EMEA 2015 Outlook US & APAC 2015 Outlook
• Realigned and refocused for growth
• Momentum in proprietary and platforms with
sales of ACP and ALP platforms in US and
Asia Pacific
• Continued investment in coalition
development across the region
Measured
investments to
pursue growth

AIMIA: AN ATTRACTIVE INVESTMENT PROPOSITION
17 17
Attractive business model with diversity of profitability
Strong Free Cash Flow generation
Focused on sustainable growth opportunities
Delivers attractive returns to shareholders
17

THANK YOU