air force manpower, personnel, and … a4g rand corp santa monica ca f/6 15/5 air force manpower,...
TRANSCRIPT

A0A091 A4G RAND CORP SANTA MONICA CA F/6 15/5AIR FORCE MANPOWER, PERSONNEL, AND TRAINING SYSTEM. VOLUME II --ETC(U)MAY 80 B E ARMSTRONG. S W CHAPEL, S C MOORE F4962077-C-O030
UNCLASSIFIED RAND/N-N7A-AF NL
mEhEEhhhEhmmmmEm,,hmhEElllnEEEEEEEEIEmmEEmmEEEmmEEEEEmmuEmhEmhEEE.EEEEEEE~lllmhIl

. I M
140 1g20
11111 II m
'1111112 11111 -.4 fl
MICROCOPY RESOLUTION TEST CHARTNATIONAL BUREAU OF STANDARDS -963-A

01 N
IAA
~~X.,
414
-in
i - $
~A::T.

~ ~. Wtt:
sl y.
AA~
. . . . . . . . ............ .

UNCLASSIFIED89CURITV CL-SSIFIC&TION OF TiS PAGlEl" bgda OSO0mE•
I-1476-AF Air Force Manpower, Person-nel. and Traininq System: Volume IL:Analysis of the Enli~ted Authorization/Assiqnment and Manpover Requirements/Personnel Objectives Subsystems.$D. E. Armstronq S. d. Chapel. S, C.Moore. may 1980.
Describes evaluation of two subsystems forenlisted force manaqement: a short-ternor "proqramminq subsystem and a lonq-teraor "planninq" subsystem. The short-ternsubsystem is evaluated by =omparinq per-sonnel assiqments in about two hundredoccupational specialities over a three andone-half year period. The statisticalmethods employed should be useful in devel-opinq more detailed comparisons within oc-cupations (i.e.. authorization-assiqnmentaqreement accordinq to skill level, payqrade, command, etc.) The lonq-term sub-system is evaluated by reviewinq its loqi-cal and operational structure. While itsmany strengths are apparent, the subsystemis somewhat lackinq in inteqration. larqelybecause it lacks effective focus on costand productivity characteristics associatedwith different types of people (e.q.. ex-perienced versus inexperienced people with-in different occupations.) We recommendthat practical mechanisms be developedwhich will permit (1) identification ofmultiple sanpover/personnel force struc-tures (within occupations and forcevidejcapable of meetinq mission requirements and
'(2) evaluation of/selection amonq thesealternatives. 118 pp. Bef. (Author)
ai
um CLASSIF iiEODICURITY CLAINVIAir¢TION Ofr TNI8 PDA61IlWhenDt Rn)L *O

UNCLASSIFIEDSRCvK,?V CLASS1IFSC-ATIOM O 1,.4H-_______________________________
REPORT DOCUMENTAON PAkGE READ 0KMRU O
1. REORT NMBERGOVT ACCESSION NO, 31. "9CgIPI9Nv CATALOG HUMMER
14. TITLE (and Subtie) S. TYPE Or REPORT & PERIOD COVEREDAIR FORCE MANPOWER, PERSONNEL, AND TRAINING SYSTEMVOL I] ANALYSIS OF THE ENLISTED AUTHORIZATION/ InterimASSIGNMENT AND MANPOWER REQUIREMENTS/PERSONNEL 6.p PRORMIN OR*. REPORT NUMBEROBJECTIVES SUBSYSTEMS
7. AUTe4OR~.) S.- CONTRACT ON GRANT MUMEE-()
B. E. Armstrong, S. W. Chapel, S. C. Moore F49620-77-C-0023v
9. PERFORMING ORGANIZATI9U NAME AND ADDRESS I . PPOONAhW~MSg~Mq.POgT TUAWRThe Rand Corporation Ab R ROICT TW~ UM
1700 Main StreetSanta Monica. CA 90406 ~
If- C014TROLLING PIId NAME AND ADDRESS 12. REPORT DATE
Requiremients, Programs, A Studies Group (AF/RDQM) may 1980Ofc, DCS/R&E & Acquisition 12. NUIMBER OF PAGESHq USAF, Wash DC 20330 118
14. MONITORING A0ENCY NAME & AbDRIESS(If E~llosut gumo Comri8hWla Ofloe.) It. SECURITY CLASS. (of W~e eof
UnclassifiedIS&. DECLASSIICATION/OWNERADING
IS. DISTRIBUTION STATEMENT (of Ohio ep..tIjCROL
Approved for Public Release; Distribution Unlimited
17. DISTRIBUTION STATEMENT (of Ils obaentom Ina. Bi lock to. of dhfI...., *am Ropor)
No Restrictions
19 SUPPLEMENTARY MOTES
IS Key WORDS (Cetillnu. an fewer*@ side of nosomy and §4otITib bloc S "O*ine)
Military PersonnelTrainingPlanning-Progranining-BudgetingManpower
20. ABSTRACT (ConfIowe oer..o~ of Woe.pmucku"pS aoe0mWnI
see reverse side
D OAN~ 1473 tDiToIONIOV 69 05OBSOLETE UNCLASSIFIED
/: 40 5CURITY CLASSIFICATION OP T"IS PACE fWhm De. aler

A RAND NOTE
AIR FORCE MANPOWER, PERSONNEL, AND TRAININGSYSTEM: VOLUME II--ANALYSIS OF THE ENLISTEDAUTHORIZATION/ASSIGNMENT AND MANPOWER REOUIRE-MENTS/PERSONNEL OBJECTIVES SUBSYSTEMS
B. E. Armstrong, S. W. Chapel, S. C. Moore
Hay 1980
N-1476-AF
Prepared For The United States Air Force
CA,
(
Rand
AMI"OVE POI IMIC MIM DMlOUU UUMI1U

PREFACE
Recent specialized studies of aircraft maintenance, training
system acquisition, and personnel systems (conducted by the U.S.
Air Force, The Rand Corporation, and other institutions) have
noted the fundamental and complex organizational and functional
interdependencies existing in "the system" that defines require-
ments for manpower, establishes personnel plans and policies, and
recruits, trains, and assigns individuals to work units. Rand
established the "Manpower, Personnel, and Training Dynamics
Study" within the Project AIR FORCE Manpower, Personnel, and
Training Program to address these interdependencies. The objec-
tive of the study is to promote the control of enlisted manpower
costs, the enhancement of labor productivity through improved
responsiveness to changing environments, and a better integration
of manpower, personnel, and training planning and evaluation.
Major tasks within the study are designed to document the Air
Force's overall enlisted force management system (referred to, as
the Manpower, Personnel, and Training, or MPT, system), to exam-
ine the dynamic behavior of the MPT system by analyzing histori-
cal data, and to propose alternative operational strategies that
would improve the MPT system.
This Note--the second volume of a two-volume series--
documents the results of the second and third tasks. The first
volume (R-2429-AF)_presents the results of the first task, an
integrated discussion of the roles and interactions of the organ-
izations and processes constituting the system.

JVlLarge portions of the "manpower" and "personnel" components
of the HPT system, organizationally separate when the system
description was developed (about 1977-78), have since been drawn
together under a common Deputy Chief of Staff/Manpower and Per-
sonnel (AF/MP). To date, this reorganization, while involving
several changes in title, responsibility, and authority, seems to
have had relatively little effect on the functioning of the sys-
tem. Since they relate much more to functions than to organiza-
tions, the findings of the present studies should remain valid;
only an occasional title change has been required to keep the
text current.
This work was conducted for the Directorate of Personnel
Plans and the Directorate of Manpower and Organization, Hq USAF.
The Note addresses issues that commonly confront these organiza-
tions. The conclusions and recommendations provide a perspective
for USAF management improvement and action.

Iv
/ SIJMAY
This Note breaks the overall USAF manpower, personnel and
training (HPT) system, documented in the companion volume (R-
2429-AF), into two subsystems: (1) an authorization/assignment
subsystem and (2) a manpower requirements/personnel objectives
subsystem. The first subsystem focuses on the short term; it
allocates authorizations in accordance with manpower requirements
and budgetary limitations and it recruits, trains, and assigns
people to fill authorized positions. The second subsystem
focuses on the long term; it develops operational manning guide-
lines and overall workforce structure plans and personnel poli-
cies.
Our approach here is evaluative. The purpose is to combine
understandings obtained during our system-descriptive work,
inferences drawn from readily available historical data, and log-
ical criticisms of the system's operation to identify promising
I; areas for system improvement and/or research. The perspectives
provided by reviewing the MPT system from these short-term and
long-term viewpoints permit identification of important interre-
lationships among system components which might otherwise go
unnoticed.
//
0Ckn
$60 " - I . .
~....."l , ! ._, ,:., 6 ..
e , , - L ' -

- vi -
THE AUTHORIZATION/ASSIGNME SUBSYSTEM
The authorization/assignment subsystem is analyzed primarily
by comparing the number of people assigned in each of about 200
occupational specialties to the number actually authorized.
These comparisons cover the period from January 1974 to May 1977,
a time of steady decline in the total size of the enlisted com-
ponent. The ideal would be for the subsystem to result in an
exact match of assignments to authorizations for each occupation.
We examine, therefore, the degree of imbalance (disagreement in
the level of authorizations versus assignments) which we charac-
terize as chronic overmanning (a state of persistent excesses of
assignments), chronic undermanning (a state of persistent shor-
tages of assignments), or nonchronic (a close match between
authorizations and assignments). We find that:
1. Total imbalances (assignment excesses plus shortages)amounted to about 6 percent of the total authorizations.
.o °- . . . . .•
2. About two-thirds of the total imbalance was due toovermanning in occupations.
3. The undermanning imbalances declined (in terms of thepercentage of occupations exhibiting undermanning) byabout one-fourth over the three and a half year period.
4. About one-fourth of the occupations experienced chronicimbalances over the study period.
5. Chronically overmanned occupations tended to includethose being more critical to Air Force flying missions andthose having longer training requirements (suggestingintentional oversupply of these occupations).
6. Chronically imbalanced occupations tended to be smallerand changed size more rapidly (either growing or shrinking),and they exhibited greater variation from period to periodin their authorization levels.

-vii-
These findings support a conclusion that the
authorization/assignment subsystem succeeds rather well in
supplying/assigning appropriate numbers of personnel to indivi-
dual occupations. There is evidence that some occupations are
chronically imbalanced, but the MPT system components appear sen-
sitive to this situation; they provide more accurate advance pro-
jections of authorizations and produce assignments that more
closely parallel the authorization levels for these occupations.
But discrepancies, perhaps due to sudden changes in authorization
levels or retention behavior, persist over time.
The conclusion is limited to the matching of authorizations
and assignments in aggrezate (by entire enlisted occupation)
because of data limitations. The question of the degree of
agreement between authorizations and assignments at more detailed
levels (commands, bases, skill levels, and so on) is addressed
herein only briefly and qualitatively.
THE MANPOWER REQUIREMENTS/PERSONNEL OBJECTIVES SUBSYSTEM
The manpower requirements/personnel objectives subsystem
embodies a number of significant strengths; e.g., the formal
Management Engineering Program, a wide variety of available
operational and personnel data, and expertise in creating and
using computerized force planning models. But the subsystem also
has limitations. For example, long-run personnel force structure
plans are determined without regard for projected requirements
for specialists at the three lowest skill levels. Also, manpower
requirements within specialties are based primarily on past man-
ning practices and productivities. Further, only sporadic

i-viii -
attention is focused on aspects such as the personnel job clas-
sification scheme or manpower utilization policy changes which
would allow more senior enlisted personnel to continue working as
technical specialists rather than requiring their transition into
management roles. Such limitations, we believe, may be partially
manifest in collateral systemic problems such as cost overruns,
failure to meet production objectives, excessive overtime, recur-
ring necessities for high-level decisions to make across-the-
board personnel or program reductions, and the loss of valuable
senior technicians.
More succinctly, we find that the manpower
requirement/personnel objectives subsystem is somewhat lacking in
integration, largely because it lacks mechanisms which focus on
costs and productivity. Specifically, it lacks the ability to
evaluate possible redistributions of force strength among dis-
tinct manpower categories within and between specialties. The
requirements determination process generates manpower standards
prescribing just one personnel configuration for each possible
unit workload, and the force planning process generates just one
objective force structure. Differences in the capabilities and
costs of different categories of manpower either are not con-
sidered or their consideration occurs too late in both processes
to significantly affect the selected unit and force configura-
tions. This prevents the components of the MPT system from
evaluating alternative configurations which might (1) increase
output at the same cost or (2) reduce cost while maintaining the
desired output.

- ix -
RECOMMENDATIONS
Our recommendations pertain to both subsystems. First,
regarding the authorization/assignment subsystem, we recommend
that statistical methods, like those employed here to assess the
occupation-wide agreement between authorizations and assignments,
be extended and applied to assess the agreement between authori-
zations and assignments and standard-recommended manning at more
detailed levels: for individual skill levels and pay grades
within occupations, within operating commands, and within work
centers. Such comparisons are likely to reveal much larger rela-
tive discrepancies than observed in our work and provide explicit
data relevant to several important considerations--e.g., the
"clout" commanded by manpower standards, potential needs for man-
power standard revision, shortfalls in workforce capabilities
which may be present in particular operational functions, and the
relative priorities accorded the various occupations, work
centers, and commands.
Second, to provide the manpower requirements/personnel
objectives subsystem with the enhanced capability to identify and
take advantage of the cost and productivity differences that
exist among different types of personnel, we believe that the
subsystem should be extended in two dimensions. First, sys-
tematic means should be developed for identifying alternative
unit manning configurations capable of performing the same amount
of work. These configurations would vary according to experi-
ence, skill level and/or occupation, and unit size. This should
provide the subsystem with information concerning the relation-
- ~..-~~6a~w.'

-x
ship of work unit capability and personnel experience. Only a
few manning alternatives at the work center level translate into
myriad possibilities at the forcewide level. Second, force plan-
ning techniques should be devised which can use economic criteria
to select among these forcewide manning alternatives. These
techniques should provide the capability to identify alternative
force structures which capitalize on current and projected man-
power availabilities and to evaluate potential economic effects
of grade-ratio and end-strength limitations on these alternatives.
The essence of these alternative operational strategies is to
highlight the relationships among force capabilities, force
structures, and costs. The objective is to focus attention on
capability and costs within a framework which will preserve the
career opportunity, vigor, and experience of the enlisted force.

- xi -
ACKNOWLEDGMENTS
The authors are especially indebted to William Albright, C.
Robert Roll, Jr., and John Rolph, who have provided insights and
criticisms that have significantly influenced the directions of
this research and the final form of this Note.
The authors also acknowledge the consistent support and
assistance provided by Air Force Majors Ronald Kerchner and
Eugene Steadman from the Office of the Deputy Chief of Staff for
Manpower and Personnel, Hq USAF.
- 4 - - " " '- "" , ,n . . , _ . . 0 .. k . .L

- xiii-
CONTENTS
PREFACE .......................................................... iii
SUMMARY ........................................................... v
ACKNOWLEDGMENTS .................................................. xi
LIST OF FIGURES ................................................. xv
LIST OF TABLES ................................................. xvii
SectionI. INTRODUCTION ................................................ 1
Subdividing the MPT System .................................. 3Evaluation Issues ........................................... 7
II. THE AUTHORIZATION/ASSIGNMENT SUBSYSTEM ...................... 9Abbreviated Description ..................................... 9Evaluation Data ............................................ 15The Aggregate Balance of Authorizations and Assignments .... 16Occupational Imbalances .................................... 19Characteristics of AFSCs with Chronic Imbalances ........... 26The Distribution of Manpower Resources ..................... 29Summary .................................................... 33
III. THE MANPOWER REQUIREMENTS/PERSONNEL OBJECTIVES SUBSYSTEM... 35Overview ................................................... 35Manning Guidelines ......................................... 37Overall Personnel Objectives ............................... 41Operational Concerns ....................................... 47Subsystem Integration ...................................... 48Unit Manning Specification ................................. 52Force Structure Planning ................................... 59Alternative Operational Strategies ......................... 65Unit Manning Alternatives .................................. 65Force Planning Techniques .................................. 71
IV. CONCLUSIONS AND RECOMMENDATIONS ............................ 75Subsystem Evaluations ...................................... 75Recommended Research ....................................... 78
AppendixA. AUTHORIZATION/ASSIGNMENT SUBSYSTEM EVALUATION DATA ......... 84B. CONCENTRATION OF AUTHORIZATION/ASSIGNMENT IMBALANCES ....... 87C. MONTHLY IMBALANCES OF AT LEAST TEN PERCENT ................. 89D. CHARACTERISTICS OF CHRONICALLY IMBALANCED AFSCs ........... 92E. CAUSES OF CHRONIC IMBALANCES ............................... 96F. EXCERPT FROM AFR 39-1 REGARDING CLASSIFICATION CHANGES .... 116
References ..................................................... 117
Rpm-=- .- -

-xv-
FIGURES
1. The Overall Manpower, Personnel, and Training System ........ 4
2. The Singe-Cycle Manpower, Personnel, and Training System ..... 5
3. The Authorization/Assignment Subsystem ...................... 10
4. The Manpower Requirements/Personnel ObjectiesSubsystem ................................................ 36
5. An Example Standard Nanning Table ........................... 38
6. Example Objective Career Force Structure .................... 42
7. Example Objective Grade Structure ........................... 45
Al. Example of a Specialty's HistoricalAuthorization/Assignment Data ............................. 85
Bl. Percentages of the Sample Exhibiting SpecifiedAmounts of Authorization/Assignment Imbalance ............. 88
Cl. Fluctuations in the Percentages of AFSCs Exhibiting10% Assignment Imbalances ................................. 90
El. Distribution of AFSC Sizes Within Categories of Imbalance..111
E2. The Cyclic Pattern of Significant Imbalances ............... 113

-xvii-
TABLES
1. Percentage Difference Between Assignmentsand Authorizations ...................................... 17
2. Percentages of AFSCs Exhibiting SignificantAuthorization/Assignment Imbalances ..................... 21
3. Percentage of AFSCs in Excess and Shortage ManningSituations--Semiannual Periods.......................... 23
4. Contributions of Chronic and Non-Chronic AFSCs
to Semiannual Imbalance Categories ...................... 24
5. List of Chronically Imbalanced AFSCs ..................... 28
6. Hypothetical Manning Alternatives for a Base PersonnelRecords Office Supporting 2,000 Officers and 10,000Enlisted Personnel ...................................... 67
7. Basing and Total Force Alternatives for Three SimilarBases with Two Unit Manning Alternatives............... 67
8. The Number of Total Force and Basing Configurationsfor Similarly Loaded Work Centers at 10 Bases ........... 68
Dl. Characteristics of AFSCs by Chronic Category .............. 92
D2. Variation in Authorization of AFSCs by Chronic Category.. 92
Ela. Distribution of Balance Categories Among Growth RateCategories............................................. 97
Elb. Distribution of Growth Rate Categories Among BalanceCategories .............................................. 97
E2. Summary of Linear Relationships Between AssignmentLevels and Authorization Levels ......................... 99
E3a. Distribution of AFSCs Among Categories of VariationAbout Trend and Authorization/Assignment Balance ....... 101
E3b. Summary of Linear Relationships Between ActualAuthorization Levels and Six-Month Projections ......... 105
E4. Summary of Linear Relationships Between ActualAuthorization Levels and Six-Month Projections ......... 105
E5. Summary of Linear Relationships Between ActualAssignment Levels and Six-Month AuthorizationProjections ........................ .... . .......... 107

I. INTRODUCTION
The enlisted manpower component of the United States Air
Force currently numbers about 450,000. Approximately 70,000 new
personnel are added each year and a similar number are separated,
including about 8,000 who retire. This enlisted force is subdi-
vided into groups representing over 300 occupations, 5 skill lev-
els, 9 grades, up to 30 years of service, and up to 18 years of
experience in some grades. Further, this force is spread over
more than 20 different commands and separate operating agencies,
about 150 bases, and approximately 10,000 distinct work centers.
Maintenance of the force is further complicated by a "con-
stant state of change" due, for example, to variations in mis-
sions, weapon systems, operating philosophies, budgets, wages,
public attitudes, and recruitment pool sizes. Each person in the
enlisted force must be recruited, trained, assigned, employed,
developed, and eventually separated in ways acceptable to him as
an individual and supportive of USAF mission objecties. The Air
Force manpower, personnel, and training functional components are
charged with the responsibility for management and performance of
these Herculean tasks.
This Note examines the Air Force's "Manpower, Personnel, and
Training (MPT) System," the complex of people, policies, and pro-
cedures which are employed to manage its enlisted manpower
resources. While the companion report, R-2429-AF, Air Force Nan-
power, Personnel, and Training: Roles and Interactions, by
Armstrong & Moore, 1980, is primarily descriptive of this vast
system, the current volume adopts an evaluative viewpoint. The

-2-
purpose here is to combine understandings obtained during our
descriptive work, inferences which can be drawn from readily
available historical performance data, and logical criticisms of
the system's integration/operation to identify promising areas
for system improvement and/or research.
The overall study was undertaken because Rand researchers
and Air Force managers and analysts perceived the complexity of
the MPT system and the manner in which individual aspects of the
overall system (e.g., job classification, recruitment, training
requirements, retention behavior, and promotion policies) con-
tinually influence each other. The Rand project, "The Manpower,
Personnel, and Training Dynamics Study," which produced this
Note, was undertaken to assemble an understanding of the
integrated nature of the overall MPT system. The companion
volume describes the system straightforwardly so that others--
besides those few who have had operational and/or management
responsibilities in all three components[l] --can understand it.
Comprehension of this overall NPT system brings a consider-
able appreciation for its sophistication and soundness. Critical
evaluation, however, leads to identification of areas in which
significant improvements appear to be possible. We begin here by
presenting a conceptual division of the system into two interre-
lated subsystems and describing appropriate evaluative approaches
[1] Previously, the three components were organizationallydistinct. Recently, however, a major reorganization has joinedthe manpower and personnel functions under a common Deputy Chiefof Staff for Manpower and Personnel. The training organization,the Air Training Command, remains separate.
- L-

I
for each. Subsequent sections review each subsystem and provide
evaluation discussion sufficient to lead to the final section, a
description of recommended research and development activities.
SUBDIVIDING THE MPT SYSTEM
As noted, R-2429-AF provides a "snapshot" (circa 1977-79) of
the Air Force's MPT system. Its descriptive approach presents
the roles of the manpower, personnel, and training components and
then addresses the interactions among the three components. It
pays special attention to the processes and policies followed by
each component, the organizational levels where particular
responsibilities are located, and the occurrence of events over
time. Figure 1 represents a summary of the overall system.
Observe that three cycles of the planning, programming, and budg-
eting system (PPES) are depicted, spanning about 15 months.
For our purposes, it is advantageous to consider just one of
these cycles, as depicted in Figure 2. In this simplified
representation, the administrative level (i.e., base, command,
Air Staff, secretarial) designations are deleted and strict
adherence to the time scale is relaxed, facilitating our concen-
tration on the system's major functions and activities. As indi-
cated in the figure, we have subdivided the total system into two
subsystems: a manpower requirements/personnel objectives subsys-
tem and an authorization/assignment subsystem. This dichotomy
appears more appropriate than an organizationally-based division
because all three components engage in two fundamentally dif-
ferent kinds of activity, one oriented towards the long-term
(i.e., planning how the force should be structured after the next

4-4
1-3
<1-U
12-a
-0
I-3
Own "O.--a

-5-
ii! I IIf
"<ii
lj 4' Iii I
reA'
SI'
I:
e -

-6-
several years) and the other oriented towards the short term
(i.e., programming the management of the force during the current
and the next few years). For example, tasks typically considered
as personnel responsibilities include the establishment of long-
term force structure plans as well as the continuous assignment
of individuals to duty locations. Manpower, similarly, defines
and promulgates long-run work standards and standard manning con-
figurations as well as regularly allocating authorized manpower
levels among commands and bases. Training responsibilities tend
to concentrate in the relative short term, largely because
recruitment, training, and crosstraining provide the principal
means for accommodating short-term changes in manpower supply and
demand. But longer-term implications for training are occasion-
ally considered, for example, when possible changes in the per-
sonnel classifications system are analyzed.
This subdivision of the overall MPT system into a manpower
requirements/ personnel objectives process and an
authorization/assignment process dictates the structure of this
paper. We conclude this first section with a brief discussion of
evaluation approaches and their appropriateness for each of these
subsystems. The sections following contain abbreviated descrip-
tions of each subsystem along with relevant evaluative discus-
sion. We discuss the authorization/assignment subsystem first
since it must operate within certain constraints dictated by the
manpower requirements/personnel objectives process and since we
undertook its evaluation first. Its analysis, then, provides the
context and some of the motivation for our consideration of the

-7-
manpower requirements/personnel objectives process. We conclude
with our recommendations for development of system improvements
and for further evaluative investigation.
EVALUATION ISSUES
Numerous approaches can be taken in systems evaluation.
Primary among these are:
(1) Outcome evaluation: assessment of adequacy and desirabilityof the system's "products."
(2) Cost evaluation: analysis of costs associated with systemoperation (e.g., estimation for each occupational specialtyof costs per authorization, per recruit accessed, perindividual trained, or per person assigned).
(3) Cost-effectiveness/cost-benefit: comparison of the valueof the system's results against its cost.
(4) Process evaluation: analysis of the system's structureto determine the extent to which its mechanisms andoperations are utilized, coexist compatibly, and mutuallysupport achievement of system objectives.
In the assessment of the authorization/assignment subsystem,
it seems particularly appropriate to employ outcome evaluation.
The subsystem's primary objectives are to (1) allocate approved
authorizations to programs, commands, bases, and work centers and
(2) assign individuals to fill authorized positions. Thus, a
straightforward measure of system performance is the degree to
which assignments have historically matched authorizations--
often referred to as "the matching of faces to spaces."
The principal products of the manpower
requirements/personnel objectives subsystem are personnel plan-
ning policies (e.g., objective experience and grade distributions
for groups of AFSCs called career progression groups) and

-8
manpower requirements guidelines (e.g., recommended unit manning
configurations for different types of work centers). In the
sense that we can examine these outputs, looking for certain
desirable characteristics, we can also use outcome evaluation in
this setting--although not in the quantitative way that is possi-
ble for the authorization/assignment subsystem. At the same time
we can employ process evaluation by considering the sequence and
mechanics of the steps involved in the manpower
requirements/personnel objectives subsystem.
Information necessary for a comparison of the MPT system
costs and corresponding benefits was not available nor did it
seem particularly appropriate since this research focuses on the
system's operations and performance.

-9-
II. THE AUTHORIZATION/ASSIGNMENT SUBSYSTEM
ABBREVIATED DESCRIPTION
Figure 3 is a flow diagram depicting the
authorization/assignment subsystem and some of its relationships
to the manpower requirements/personnel objectives subsystem. The
authorization/assignment subsystem is a short-term management
system used to control the provision and distribution of enlisted
personnel resources. The system accepts manpower requirements
and personnel objectives as fixed. Managers endeavor to distri-
bute manpower authorizations and to recruit, train, retrain,
assign, and separate individuals so that manpower requirements
are met equitably, budget levels are not exceeded, etc.
We observe in Fig. 3 that the authorization/assignment sub-
system receives two primary inputs from the manpower
requirements/personnel objectives subsystem: manning guidelines
and personnel objectives. Manning guidelines, in the form of
Program Estimating Equations (PEEs) and manpower standards, de-
lineate recommended manning associated with specified program
activities and corresponding workloads. They facilitate the
determination of manpower allocations among commands, bases, work
centers, and even skill and grade levels. Personnel objectives
take the form of force profiles (e.g., numbers of personnel by
years of service, occupational specialty, and skill level), reen-
listment targets, promotion quotas (grade guides), etc., and are
generated by Air Staff personnel using computerized planning
models. These personnel objectives are based on skill level

-10-
FI
1z1

: - 11 -
requirements obtained using the Skill Projection Model, (1] loss
rates obtained from the Uniform Airman Record (UAR) and the
Gain/Loss Transaction File, and management assessment of accept-
able personnel policies and force evolution.
The authorization/assignment system also receives annual
program plans, in the Five-Year Defense Plan (FYDP), which
largely dictate its near-term manpower, personnel, and training
decisions.
Within the authorization/assignment subsystem, the three
basic activities are (1) detailed allocation of authorizations to
commands, bases, and work units, (2) acquisition and training of
appropriate personnel, and (3) assignment of these individuals to
bases and work units. Let us summarize each in turn.
The Report Transaction Voucher document lists authorized
manpower by program, skill type, and grade; it essentially
represents a budget constraint for each command. This allocation
is based on Air Staff assessment of mission and function priori-
ties, Congressional budgetary and manpower allotments, interpre-
tation of historical requirements, and simple proration. The
commands themselves then allocate authorizations further to bases
and individual units (often while negotiating for adjustments in
their own allocations). Thus, the activity of allocating author-
izations occurs at both the Air Staff and command levels.
[1) See, for example, Michael J. Mestrovich, "The Airman andOfficer Skill Projection Model, Volume I: Management Summary,"USAF Manpower Research and Analysis Group, the Pentagon, June1973.
-- " ,, .. . ,

- 12 -
Detailed authorization levels (by specialty, skill level,
and grade) are specified for each base in the form of unit man-
power documents. The "7102 File," updated and reviewed by the
Air Staff, constitutes the authoritative record of manpower
authorizations. It also contains projections of future manpower
requirements.
To ascertain personnel recruitment and training require-
ments, the Airman Skill Force Model (in conjuction with the Air-
man Force Program and Longevity Model) is employed to analyze
current strength, anticipated authorizations (determined by
extrapolating recent authorization patterns using the Skill Pro-
jection Model), loss rates, promotion and retraining quotas, etc.
The resulting personnel requirement projections are grist for the
quarterly Trained Personnel Requirement (TPR) Conference. At
this conference, attendees use information such as impending pro-
Ol gram changes, discrepancies between expected and requested
authorizations, and recruitment and training resources and likel-
ihoods to revise projected personnel requirements. The resulting
schedule of requirements, referred to as "the TPR," forms the
basis for planning training courseloads, schedules, instructor
assignments, etc. The Air Training Command publishes such plans
quarterly in the Program of Technical Training, essentially a
two-year projection of new manpower supply for each specialty.
Then, of course, actual recruiting and training must be coordi-
nated so that "production" objectives are met. Finally, the USAF

- 13 -
Manpower Personnel Center (MPC)[1] endeavors to match existing
personnel resources to manpower authorizations (by skill type,
skill level, and grade).[2] Records of airman assignments are
maintained in the Uniform Airman Record.
Manpower authorizations are typically specified without
regard to existing or projected manpower supplies. It should be
clear from the previous process description, however, that pro-
jected authorization levels are an important element in generat-
ing recruitment, training, retraining, and retention targets and
hence in the determination of assignment levels.
As already previewed, our analysis of the
authorization/assignment subsystem is focused on the outcome
ideal: agreement between authorizations and assignments. It is
clear that disagreements between assignments and authorizations
can have very serious ramifications. Underassignment--assigning
fewer people than authorized--can inhibit force performance and
jeopardize mission accomplishment. Overassignment, on the other
hand, potentially contributes to personnel underutilization and
economic waste.[3]
[1] Formerly entitled the USAF Military Personnel Center.[2] In this role MPC has been likened to a clearinghouse.[3] These general statements, of course, assume that author-
ization levels are "correct"--i.e., they represent the manninglevels which can best meet program objectives within existingbudget limitations. As indicated in sections III and IV of thisreport, however, we contend that authorization level specifica-tions can be improved, for example, by considering personnelcosts more completely and by examining alternative configurationsof manpower (and equipment) in accomplishing particular func-tions. But regardless of how authorization levels are deter-mined, it is still necessary to match people to them.

- 14 -
In summary, the overall objectives of the
authorization/assignment subsystem can be stated, albeit crudely,
as:
(1) distributing budget-approved total manpower authorizationsso that mission objectives can best be met,
(2) "producing" individuals (human resources) with the properlevels of experience and training to perform assigned taskseffectively, and
(3) distributing these individuals among the work centersrequiring their skills.
More succinctly, the task is to produce the right person at the
right time and at the right place.[1] In analyzing achievement of
these objectives, we have accepted the classification of occupa-
tions, skill levels, associated training, etc., as "correct"; we
address how well the system operates within these constraints.
In the remainder of this section we address three related topics:
(1) the MPT system's ability to balance manpower authorizations
and assignments in aggregate terms, (2) the identification of Air
Force Specialties (AFSCs)[2J which experience consistent imbal-
ance and an investigation of possible causes of the imbalance,
and (3) the distribution of manpower resources among experience
levels and geographic regions.
[1) Interestingly, Grinold and Marshall (Manpower PlanningModels, 1977, p. xix) state: "...a more realistic view... is thatit avoids having too many of the wrong types of people in thewrong jobs too frequently."
12] Air Force specialties are delineated in AFR 39-1. Theyare distinct occupational specialties, requiring common qualifi-cations and, usually, airmen remain in a single specialty (desig-nated by an alphanumeric code called an AFSC) throughout theirservice lives, while progressing through a series of skill lev-els.

- 15 -
EVALUATION DATA
Our analysis here is primarily statistical. Findings are
based on monthly records maintained by the USAF Military Person-
nel Center,[lJ Randolph AFB, describing the levels of total AFSC
authorizations and assignments from January 1974 through May
1977. These data are augmented by information regarding training
times and experience distributions obtained from training manuals
and the Uniform Airman Record; see Appendix A for details. In
summary, the data are based on 199 four-digit AFSCs, representing
about 75 percent of USAF enlisted force authorizations. (A
weighting procedure, also described in Appendix A, was employed
to make the sample approximately representative of all USAF
enlisted force AFSCs.)
Except where noted, our discussions are based on six-month
aggregations of the data. Thus, when we refer to an AFSC's
authorization level during a particular six-month interval, we
mean the average of the authorization levels in that period's
individual months. This approach induces a mild smoothing effect
and can obscure some short-term aberrations. We have employed
monthly data where such aspects are problems, however, and have
found virtually complete consistency between the two versions of
the data. The six-month aggregations reduce the costs of data
manipulation, of course, and minimize problems of missing data.
[1] As already noted, the USAF Military Personnel Center,under the recent reorganization of manpower and personnel func-tions under the single DCS/MP, has been renamed the USAF Manpowerand Personnel Center, retaining the designator AF/MPC.

- 16 -
(If data are missing for, say, one month in a semiannual period,
the average employed for that period is taken over the remaining
five months' data.) In addition, only larger and more persistent
effects are manifest in the aggregated data. And for the most
part, these broader behavioral patterns are the ones of current
significant interest.
THE AGGREGATE BALANCE OF AUTHORIZATIONS AND ASSIGNMENTS
Because of the size, complexity, and dynamic nature of the
enlisted manpower force, it is unreasonable to expect a perfect
match between each AFSC's assignments and its authorizations. In
investigating the closeness of the match between the two, we
treat authorization levels as targets and consider the deviations
of assignment levels from these targets. (Of course we recognize
that authorizations change and are really "moving targets"; we
consider that issue in Appendix D in a discussion of authoriza-
tion projections.)
To establish the relative degree of imperfection in the
overall match between asssignments and authorizations, we con-
sider first the average amounts of "over-assignment" (or overman-
ning) and "under-assignment" (or unfilled authorizations) in each
semiannual period covered by our data. The results appear in
Table 1 as percentages of average total authorizations. Refer-
ring to the table, note that in the July-December 1975 interval
about 2.7 percent of the total USAF enlisted authorizations were
unfilled. During that same period the number of enlisted people
assigned in excess of authorized levels represented about 4.9
percent of total authorizations. Thus, the total force was 2.2

-17-
Table 1
PERCENTAGE DIFFERENCE BETWEEN ASSIGNMENTS AND AUTHORIZATIONS
For AFSCs with Overmanning and for AFSCs withUnfilled Authorizations
Six-Month Interval
Jan-Jun Jul-Dec Jan-Jun Jul-Dec Jan-Jun Jul-Dec Jan-MayItem 1974 1974 1975 1975 1976 1976 1977 Avg
Overmanninga 4.3 4.5 4.5 4.9 5.1 5.1 3.7 4.6Undermannlngb 1.8 1.4 1.3 2.7 1.1 1.4 2.0 1.7
ImbalanceTotnlc 6.1 6.0 5.8 7.6 6.2 6.5 5.7 6.3Net 2.5 3.1 3.2 2.2 4.0 3.7 1.7 2.9
total excess assignments in overmanned AFSCsaOvermanning " total authorizations in all AFSCs x
b Utotal unfilled authorizations in undermanned AFSCsbUndermanning " x 100
total authorizations in all AFSCs
CTotal irbalance - overmanning + undermanning.
dNet imbalance - overmanning - undermanning.
F .

- 18 -
percent overmanned during this period. The total of mismatches
between authorizations and assignments (excesses plus shortages)
was 7.6 percent of total authorizations.
Over the entire period, an average of about 1.7 percent of
the authorizations were unfilled, approximately 4.6 percent of
the assignments were in excess of individual AFSC authorizations,
and the total mismatch between assignments and authorizations was
about 6.3 percent of total authorizations. In total there were
about 2.9 percent more assignments than authorizations.
More concretely, this means that in an enlisted force
authorized at a level of approximately 450,000, about 21,000 peo-
ple would be assigned to AFSCs in excess of those AFSCs' authori-
zations, and about 8,000 unfilled positions would exist in other
AFSCs. This can be regarded as a fairly high overall level of
subsystem performance--at least in aggregate--especially in view
of the constant changes in manpower demand and supply and the
constraints noted in the introduction. However, this level of
aggregation can mask imbalances in authorizations and assignments
at more detailed levels (regional distributions, skill levels,
etc.). Ideally, our evaluation would proceed to an examination
of each of these levels of detail. The available data, unfor-
tunately, limit us to an evaluation of occupational imbalances
and only qualitative comments concerning geographical and skill
level authorization/assignment matching.

IP
- 19 -
Occupational Imbalances
Significant and persistent discrepancies between authoriza-
tions and assignments do exist for some individual occupational
areas. That is, even though the aggregate figures indicate a
relatively close match in "faces and spaces," examination of
career area authorizations versus assignments indicates the
occurrence of significant manpower imbalances. For example, dur-
ing our forty-one-month data period, the occupation of "semi-
rigid rotor helicopter mechanic" experienced eleven months in
which there was at least a 20 percent manpower shortage (averag-
ing about 90 unfilled authorizations) and twenty-one months in
which there was at least a 10 percent manpower shortage (includ-
ing one stretch of fifteen consecutive months). In the missile
control communication systems maintenance occupation there was at
least a 50 percent oversupply (averaging about 800 people) of
personnel in six months during the data period and twenty-two
consecutive months of at least a 10 percent oversupply of person-
nel.
We have elected to define "sianificant" occupational (AFSC)
manpower imbalances as those in which authorizations are either
greater than or less than assignments by 10 percent or more. The
justification is two-fold: first (an operational reason), non-
mobilization-designated units must be 90 percent manned (assign-
ments equal to at least 90 percent of authorized manpower) as
specified in the "Standard Aircraft Organization Manning Cri-
teria" in order to be classified as operationally ready. Thus, a
10 percent or greater shortfall degrades readiness and signals an
V i, . .... -.°-., U

- 20 -
imbalance problem to us. Second (a data-dependent reason), 10
percent imbalances are exhibited by a sizable yet not unreason-
ably large proportion of the sample. (Specifically, 22.1 percent
of the monthly observations show assignment overages of at least
10 percent, and 11.5 percent show assignment shortages of at
least 10 percent. See Appendix E for the distribution of
excesses and shortages.) Table 2 displays the percentages of the
sample AFSCs exhibiting significant imbalances during each of the
data period's semiannual intervals. Roughly one-third of the
AFSCs exhibited at least a 10 percent imbalance at any point in
time, and only about one-third of these imbalances were due to
manning shortages. Not incidentally, analysis of monthly ver-
sions of these data (see Appendix C) indicates that the percen-
tage of AFSCs exhibiting significant shortages declined by about
one-fourth during the period covered by the data.
Another way of viewing the AFSCs in significant imbalance
situations at any time is by considering those that exhibit per-
sistent imbalance behavior and those that experience only occa-
sional imbalances. That is,,beyond using 10 percent as a thres-
hold for significant or critical imbalances, we seek a time-
sensitive threshold which could indicate problems of persistent
or "chronic" imbalance. To illustrate, not all of the 17 percent
of the AFSCs exhibiting significant excess manning in the
January-June 1975 period were included in the 23 percent exhibit-
ing such excesses in the corresponding 1976 period. Table 3
displays the percentages of AFSCs exhibiting various combinations
of authorization-assignment imbalance during the seven six-month

-21-
Table 2
PERCENTAGES OF AFSC'S EXHIBITING SIGNIFICANTAUTHORIZATION/ASS IGNMENT IMBALANCES
Six-Month Interval
Imbalance Jan-Jun Jul-Dec Jan-Jun Jul-Dec Jan-Jun Jul-Dec Jan-MayCategorya 1974 1974 1975 1975 1976 1976 1977 Avg
Significantlyovermanned 20 28 17 25 23 26 16 22
Approximatelybalanced 68 62 74 64 69 67 72 68
Significantlyundermanned 13 10 9 11 8 7 12 10
Total withsignificantimbalance 33 28 26 36 32 33 28 32
a"Significant" imbalances occur when assignments differ
from authorizations by more than 10%.

- 22 -
periods. For example, 27 percent of the AFSCs were not out of
balance any of the seven semiannual periods, and only about 1
percent of the AFSCs experienced two periods of significant shor-
tages and two periods of significant excesses. As indicated in
the table, we designate chronically imbalanced (or simply
"chronic") AFSCs as those experiencing significant (at least 10
percent) imbalances during at least half of the semiannual
periods.[l] Chronically out-of-balance AFSCs are subdivided into
chronic shortage, chronic excess, and chronic unstable categories
depending, respectively, on whether they were predominantly in
shortage situations, excess situations, or equally divided
between both. We observe that only about 9 percent of the AFSCs
experienced both significant shortages and significant excesses
during the seven periods, of which only 2 percent are classified
as chronically unstable.
This categorization permits us to examine the relative con-
tributions of chronically imbalanced AFSCs to the total
authorization/assignment imbalance. Table 4 displays relevant
statistics. (Note: the totals in Table 4 have already been seen
in Tables 1 and 2.) Observe that about half to three-quarters of
the AFSCs exhibiting significant imbalances in any semiannual
period were chronically imbalanced AFSCs; the average over the
seven semiannual periods was about 66 percent (i.e., 21 percent
out of 32 percent). Table 4 also reveals that about one-fourth
1i] Of course, many other definitions of chronic imbalanceare possible. This one is both simple and convenient.

- 23 -
Table 3
PERCENTAGE OF AFSCs IN EXCESS AND SHORTAGE
MANNING SITUATIONS - SEMI-ANNUAL PERIODS
Semi-Annual Periods in Shortage
0 1 2 3 4 5 6 70 27 10 4 2 0 3 2 1
113 4 1
Semi- 2 6 1 Chronic Shortage (6.4%)AnnualPeriods 3 1InExcess 4 6 Chronic Unstable (2.0%)
5 5 1
6 5 1
7 3
Chronic Excess (18.7%)
NOTE: Entries in this table do not add to 100 due to rounding.A zero in the table indicates a positive percentage lessthan 0.5.

-24-
Table 4
CONTRIBUTIONS OF CHRONIC AND NONCHRONIC AFSC'S TOSEMIANNUAL IMBALANCE CATEGORIES
Six-Month Interval
Type Jan-Jun Jul-Dec Jan-Jun Jul-Dec Jan-Jun Jul-Dec Jan-Mayof AFSC 1974 1974 1975 1975 1976 1976 1977 Avg
% of AFSCs Experiencing Significant Imbalance
Chronic 17 21 19 23 23 24 18 21Nonchronic 16 17 7 12 8 10 10 11
Total 33 38 26 36 31 33 28 32
% of Authoraations Overmanned
Chronic 1.1 1.6 1.4 1.4 1.3 1.4 1.0 1.3Nonchronlc 3.2 3.0 3.1 3.5 3.8 3.7 2.7 3.3Total 4.3 4.5 4.5 4.9 5.1 5.1 3.7 4.6
% of Authorizationa Undermanned
Chronic 0.3 0.3 0.3 0.3 0.3 0.3 0.2 0.3Nonchronic 1.6 1.2 1.0 2.4 0.8 1.1 1.7 1.4
Total 1.8 1.4 1.3 2.7 1.1 1.4 2.0 1.7

- 25 -
of the total imbalance in each six-month period was contained in
AFSCs classified as chronic. Specifically, an average of nearly
30 percent (i.e., 1.3 percent out of 4.6 percent) of total over-
manning was contaied in chronic AFSCs and less than 20 percent
(i.e., 0.3 percent out of 1.7 percent) of total undermanning was
contained in chronic AFSCs. More succinctly, most of the total
imbalance at any time was contained in the non-chronic AFSCs, but
most of the AFSCs experiencing significant imbalances at any time
were chronic AFSCs.
In summary, our analysis of the data reveals that between
January 1974 and May 1977:
1. Total imbalances (assignment excesses plus shortages)amounted to about 6 percent of the total authorizations,about one-third of the AFSCs exhibited significantassignment/authorization imbalances at any point in time,and about two-thirds of these exhibited overmanning.
2. The undermanning imbalances declined (in terms of thepercentage of occupations exhibiting undermanning) byby about one-fourth over the three-and-one-half-yearstudy period.
3. About one-fourth of the occupations experienced chronicproblems of imbalance.
4. Most of the occupations experiencing significant imbalancesat any time were chronically imbalanced occupations; and
5. Most of the total imbalance at any time was due to non-chronicAFSCs.

- 26 -
Characteristics of AFSCs with Chronic Imbalances
Chronically imbalanced AFSCs constitute the major proportion
of those exhibiting significant imbalances at any time, and their
imbalance constitutes a substantial proportion of the total
imbalance. As already noted, mission performance may be jeop-
ardized by significant personnel shortages in individual work
units. Chronically overmanned AFSCs, on the other hand, may con-
tribute to serious underutilization of human resources in indivi-
dual work units. Consequently, we have examined chronic AFSCs
somewhat more closely in search of distinguishing characteris-
tics. Recognition of such characteristics may provide insight
into likely causes of chronic imbalance problems and also foster
development of guidelines for identifying chronic imbalances.
The AFSCs which exhibited chronic imbalances in our sample
are listed in Table 5 in decreasing order of imbalance frequency.
Before presenting a more quantitative description of their
characteristics, we note a few qualitative aspects about these
forty-five AFSCs. First, the chronically overmanned category
contains relatively more mission-critical AFSCs than does the
chronically undermanned category (about two-thirds as opposed to
one-third).[1I Second, electronics and aircraft/system mainte-
nance specialists dominate the chronically overmanned category.
And third, medical specialties contribute the largest number of
11) The mission-criticality of individual AFSCs was esta-blished subjectively on the basis of specialist titles. Forexample, weapon control systems mechanics are judged more impor-tant for combat purposes than clarinetists.
A _ _

-27-
Table 5
LIST OF CMRONICALLY-IMBALANCED APSCs
Chronically Overmanned APSCs Chronically Undermanned AFSCs
Seven semi-annual periods of significant imbalance
*Radio Operator (29 3X3) Preventive Dentistry (981X1)*0/1 Maintenance (363XM) Allergy/Iumumology (912X4)Meatcutting (612X0)Morale, Welfare and Recreation (741X0)Education (751X0)
*Integrated Avionics Systems (326X2c:Communications, Navigation, andECM Systems)
Six semi-annual periods of significant imbalance
*Auto Tracking Radar (303X3) Cardiopulmonary Laboratory (916X0)*Missile Electronic Equipment (316X26) *Electronic War Countermeasures
(2 76Xl)Navigation/Bombing/Tactics Trainer
(34 33M)Photolithography (713X1)Recreation Services (741X1)
*Missile Systems Maintenance (316X1F and 316X1L)*Linguist (3 periods of excess, 3 of shortages)
Five semi-annual periods of significant imbalance
*Radio Relay Equipment (3043W) *Avionic Communications (328X0A)*Flight Facilities Equipment (304X1) Budget (672X0)*Electronic Communications and Instrumientalist (817X0A: Clarinet)
Cryptographic Equipment (306X0)*Avionic Comunnication (328X0)*Airborne Early Warning Radar (328X2)Reciprocating Engine (426X1)
*Machine Shop (531X0)Printing-Binding (713X0)

-28-
Table 5
Four semi-annual periods of significant imbalance
Telephone Equipment Security Police (8l2JDA)Installer (362X4) *Missile Facilities (541X0G)
*Air Operations (271X0)*Telecomunicat ions Systems
Control (307X0)*Automatic Flight Control Systems
(325X0)*Integrated Avionics Systems (326X2A:
Inertial Bomb Nay.)*Integrated Avionics Systems (326X2B:
Flight Control and DataRecorders, etc.)
*Helicopter (431x0C: Articulated Rotor)*Helicopter (Semi-rigid Rotor)
(431X0D: Semi-rigid Rotor)Aircraft Maintenance (43lX1A: Recip.
Engine Aircraft)Air Passenger (605X0)Information (791N0: Journalist)
*Sheet Metal Worker (531X2)*Precision Measurement (2 periods of excess,
Equipment Lab. (324X0)-*Avionics Sensor Systems (329XDB: 2 of shortage)
Electro Optical)
*Indicates AFSC subjectively judged to be relatively "mission-critical."

- 29 -
imbalance observations to the chronic shortage category.
In a brief quantitative examination of AFSCs exhibiting
chronic and non-chronic imbalances, we observed the following
characteristics:
1. Smaller AFSCs, probably because of their size, are moreinfluenced by the randomness of airman retention behavior,and hence, have more potential for imbalances.
2. High rates of turnover (the percentage of the specialtyrepresented by first-term airmen serves as a proxy forturn-over rate) did not tend to explain chronic imbalances,contrary to our preliminary expectations.
3. AFSCs with longer training times (supposedly making it moredifficult to respond to authorization changes) did not tendto be chronically imbalanced.
4. Chronically imbalanced AFSCs did experience relatively moreauthorization fluctuations than others. For example,the variation in authorizations for chronic shortage AFSCswas about 50 percent greater than for non-chronic AFSCs.
Discussions supporting these and related observations are
presented in Appendix D.
THE DISTRIBUTION OF HANPOWER RESOURCES
The preceding analysis focuses on the agreement between
total authorizations and assignments for an occupation. In prac-
tice, manpower in an occupation is further subdivided by (at
least) location, skill level, and grade. Allowing only two
grades per skill level (the skill levels are 1, 3, 5, 7, and 9)
and supposing a particular AFSC is employed at, say, 150 instal-
lations, the specialty can be subdivided immediately into 1,350
distinct categories.[lJ If personnel in a specialty are employed
Ill During some periods, up to three different pay gradeshave been permitted per skill level.

- 30 -
in different work centers (as, for example, are administrative
specialists, AFSC 702X0) and different major commands, these con-
stitute further characteristics which subdivide the specialty's
authorizations and assignments. For many specialties, the number
of possible combinations of location, grade, skill level, work
center, and major command actually exceeds the total number of
people in the specialty. The point here is that it is not suffi-
cient to ascertain that, in general, total assignments to AFSCs
coincide fairly closely with their authorizations. The manpower,
personnel, and training system must not only provide the proper
numbers of specialists at the proper times, which is what we have
examined to this point, but these people need also to "appear" in
the desired places and to bring with them specified combinations
of experience and training.
It is common to hear USAF personnel say that, "We have too
many skill level 3 people and not enough skill level 5 people."
Unfortunately, our data regarding historical agreement between
authorizations and assignments contain no indication of these
more detailed distributional characteristics and hence do not
allow us to examine authorization/assignment agreement at these
more refined levels. However, the Air Force has recently under-
taken a comprehensive study of enlisted grade and skill imbal-
ances by occupation in order to address important questions
regarding the distribution of its human resources.
The Air Force study eventually should facilitate assessment
of such issues as distribution equity and productive capability.
In addition, if authorizations (as budgeted manpower constraints)
' . .. . . . " -E-E--

Ei
- 31 -
are compared with the detailed manpower "requirements" (the
unconstrained personnel needs) represented in manpower standards,
a coherent picture of the realism and impact of these standards
should emerge. Of course it is important not only to understand
how manpower "users" would employ people in combinations which
might differ from standard manpower configurations (the preferred
combinations being reflected in manpower authorizations influ-
enced by budget limitations), but how close the supply side of
the manpower, personnel, and training system comes to providing
these combinations. Thus, it should be possible to compare three
forms of the distribution of trained manpower: (1) recommended
unit manning, based on manpower standards and guides, (2) author-
ized unit manning, based on subsequent funding and detailed man-
power allocation decisions, and (3) actual unit manning based on
individual assignments.
To evaluate the performance of the authorization/assignment
subsystem at these more detailed levels, we recommend that sta-
tistical analyses similar to those represented here be accom-
plished. Specifically, historical records of work center author-
ization, standard manning, and assignment detail should be assem-
bled. Criteria for defining "significant" and "chronic" imbal-
ances should be established for evaluations at different levels
of detail (e.g., command, pay grade, and/or unit). Analyses of
these data with respect to such criteria should clarify, for
example, whether some segments of the Air Force fare worse than
others in obtaining qualified personnel, whether some may "game
the system" by inflating or upgrading authorizations in order to
jjjP7A5=-

- 32 -
receive the people they desire, and whether some may be losing
mission capability because of inadequate or inappropriate man-
ning.
Qualitative knowledge that standards, authorizations, and
assignments do not and, practically speaking, cannot match per-
fectly leads to the conclusion that, fairly often, units either
(1) satisfy their required missions (quantitatively and qualita-
tively) with manning configurations other than those delineated
in manpower standards or (2) provide capabilities different from
those required (whether higher or lower). This leads us to con-
sider the specification of manpower required to accommodate the
workloads experienced by individual units. In particular, our I
attention begins to focus on detailed manpower standards since
they constitute the initial element in the sequence leading from
"requirements" to "authorizations" to "assignments." The ques-
tion is fundamentally whether the standards, representing the
primary basis for authorizations, represent the "best" targets
for unit manning.
Air Force manpower standards specify the manning to accommo-
date workloads in individual base work centers. As described
earlier, standards play a fundamental role in influencing the
distribution of manpower resources. They do so more in a long-
run mode, however, than do frequent authorization allocation and
personnel assignment decisions. The standards development pro-
cess together with the other longer term efforts of establishing
and refining personnel plans, objectives, and volicies form the
* manpower requirements/personnel objectives subsystem of the

- 33 -
overall manpower, personnel, and training system. This longer-
term planning subsystem is the subject of the remaining sections
of this Note.
SUMMARY
The statistical analysis of the authorization and assignment
information at the level of total AFSCs, between January 1974 and
May 1977, reveals the following:
1. Total imbalances (occupational assignment excesses plusshortages) amounted to about six percent of totalauthorizations; the overall net imbalance was less thanthree percent.
2. About one-third of the occupations exhibited significant(greater than 10 percent) authorization/assignmentimbalances at any time.a. About two-thirds of these occupations exhibited
overmanning.
b. The percentage of occupations experiencing significantshortages diminished by about one-fourth over thethree-and-one-half-year study period.
3. About one-fourth of the occupations exhibited chronicimbalances (10 percent imbalances at least half ofthe time).
4. Most of the occupations experiencing significant imbalancesat any time were chronically imbalanced, but most of thetotal imbalance at any time was due to non-chronic AFSCs.
5. Characteristics of chronically imbalanced AFSCs includea. smaller size,b. larger growth trends (increasing or shrinking),c. longer training times and higher "mission criticality" for
chronically overmanned AFSCs, andd. more authorization instability (variation in size around
trends).
The authorization/assignment subsystem apparently succeeds
rather well in subdividing authorized manpower levels among
specialties and meeting these distributed manpower requirements
with assigned personnel in the same specialties. Of course this

- 34 -
does not rule out distribution or assignment problems at the more
detailed levels of individual commands, bases, skill levels, or
pay grades.
I

- 35 -
III. MANPOWER REQUIREMENTS/PERSONNEL OBJECTIVES SUBSYSTEM
OVERVIEW
Similar to Figure 3 which represents the
authorization/assignment subsystem, Figure 4 is a flow diagram
depicting the manpower requirements/personnel objectives subsys-
tem. This is a planning subsystem which establishes manpower
requirements (e.g., requirements based on engineered manpower
standards) and develops long-run personnel plans and policies
(e.g., target or "objective" distributions of personnel among
specialties, grades, and experience levels).
In the discussion that follows, we will observe the depen-
dence of the manpower requirements/personnel objectives subsystem
on historical data. These data are extracted from manpower and
personnel files maintained within the authorization/assignment
subsystem and from operating units whose manning is effected by
the authorization/assignment subsystem. Hence, Figure 4 depicts
three major inputs to the planning subsystem from the programming
subsystem: historical data regarding unit operations, authoriza-
tions, and personnel behavior.
In discussing the manpower requirements/personnel objectives
subsystem, it is convenient to examine the processes which gen-
erate the two types of information it provides to the
authorization/assignment subsystem (recall Figure 3): manning
guidelines and overall personnel objectives.
I ____ ______

-36
Il
LU.

° 37 -
MANNING GUIDELINES
As indicated in Figure 2, detailed manpower requirements are
determined by using (1) workload projections based on program
plans (e.g., flying programs), (2) program estimating equations
(general guidelines indicating the requirements for broad groups
of personnel associated with program operations), and (3)
detailed manpower standards based on unit organization structure
and analysis of work unit tasks. Manpower standards are at the
heart of this matter; they are also the basis for program
estimating equations. An example standard is excerpted in Figure
5, a copy of part of Air Force Form 1113 from the manpower stan-
dard for a work center called Personnel Records.[I] (This work
center, found at nearly every Air Force installation, is respon-
sible for controlling access to and maintaining personnel
files/folders.)
The fundamental manpower equation for this work center
(estimated using regression analysis of data from 29 bases in
this case)--i.e., the equation used to convert projected workload
to the number of manhours required per month to accommodate that
workload--is as follows:
Y = 40.74 + .3253X(1) + .1519X(2)
where X(l) and X(2) are, respectively, the numbers of officer and
enlisted personnel assigned to the base, and Y is the number of
[1] See Final Report, USAF Engineered Manpower Standards:Chief, Personnel Division and 3PO, FC 16XX, Air Force PersonnelManagement Engineering Team, Z1 September 1976, pp.2-273 to 2-299.
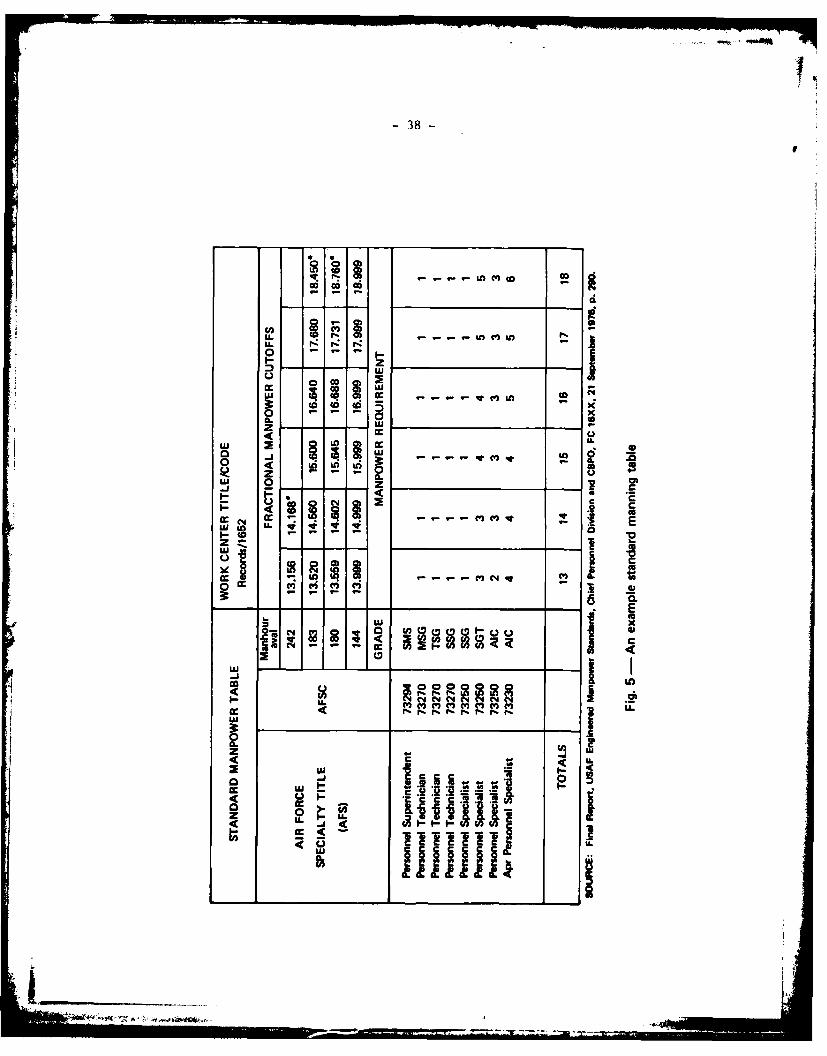
-38 -
LL -I I - - LoCO i
0i
0-0
Ifl
o Lo mz 9c
-J 2z _ _ _ _ _
c
I- to - -
-~ - --
0~ ccc V C I
6 0L
4.-.

- 39 -
manhours required per month to operate the Personnel Records work
center. Thus, if a particular base's assigned manpower were pro-
jected to change from 2,500 officers and 12,000 enlisted person-
nel to 2,000 officers and 9,000 enlisted personnel, the number of
monthly manhours recommended to handle personnel records would
decrease from 2,677 to 2,058. Using the latest peacetime "avai-
lability factor" of 145.2 work-available manhours per individual
per month, these figures translate to 18 and 14 individuals,
respectively, required to operate the work center. As revealed
in Figure 5, these quantities can be converted to detailed man-
power requirements in terms of occupational specialty and skill
level (represented together in the AFSC) and grade. In this
hypothetical case the projected base assignment reduction from
14,500 to 11,000 results in decrementing the base's Personnel
Records manpower requirement by 4 people: 2 journeymen at the
grade of Sergeant (E-4) and 2 apprentices at the grade of Airman
First Class (E-3).
Standards currently cover approximately 65 percent of Air
Force manning. Coverage is being expanded continually with older
standards being reviewed and revised as activities, work methods,
and/or technologies change. Considerable Air Force attention is
being directed toward shortening the time required to construct a
standard (targeted at 15 to 16 months from initiation to comple-
tion) and toward improving the specification of skill levels and
grades.
"'c -~

- 40 -
To complement engineered standards, the Air Force employs a
computerized model (LCOM, the Logistics Composite Model) to simu-
late activities in several maintenance-related work centers. The
model requires detailed specificiation of maintenance workload
generation (e.g., using flying program scenarios and expected
failure rates), handling (e.g., designating which malfunctions
are repaired and in what proportion at each possible location),
and support levels (e.g., describing repair and resupply times).
Iteratively, it evaluates overall system performance measures
(e.g., aircraft sortie rates, delays and down-times due to
maintenance and supply, technician utilization rates, and inven-
tory fill rates) and adjusts the associated levels of support
resources (in particular, the numbers of different types of
maintenance technicians, ground support equipment units, and
inventory stockage quantities) until desired performance levels
are achieved. At this level of detail, model inputs are so dif-
ficult to develop and the model itself is so expensive to operate
that LCOM is used only to develop total manpower requirements
within occupations under an operating program. Breakdowns of
total manpower into skill levels and grades are not considered in
the model.
In addition to their fundamental role in the determination
of detailed manpower requirements, standards usually constitute
the basis for "Program Estimating Equations (PEEs)"--as depicted
in Figure 4. These equations, which typically consider both man-
power and workload in a more aggregate manner than the standards,
permit simplified computation of varying total manpower require-
7\

41- 41 -
ments corresponding to alternative force program plans. Key
requirements of PEEs are that they permit quick computation of
aggregate manpower requirements and that they accept relatively
few programmable factors as independent variables. For example,
a PEE for the Aerospace Ground Equipment work center might yield
manpower requirements as a function of flying hours and sorties
while the standard itself determines requirements on the basis of
the quantities of numerous types of equipment maintained. The
PEE is much simpler to use, and approximate manpower requirements
can be determined quickly on the basis of time-sensitive, pro-
grammed data. These short-term characteristics are imperative in
evaluating and assessing alternative force programs that are con-
sidered during manpower standard application process.
OVERALL PERSONNEL OBJECTIVES
Enlisted personnel objectives take the form of a target
force structure and promotion/reenlistment/accession policies
which will lead to eventual achievement of that target. These
objectives are referred to as TOPCAP, the Total Objective Plan
for Career Airman Personnel; they are developed using a system of
computerized mathematical models.
Figure 6 depicts a representative target force structure--
for career personnel only (those beyond their first term of
enlistment). This sort of objective structure is determined by
exercising the Objective Force Model for each of over 100 career
progression groups (CPGs, collections of occupational specialties
"which have common characteristics in terms of career progression
and utilization") and then aggregating to the totals shown. This

-42-
30
Career Force ObjectiveTotal force range450,000 - 500.000
24
20
Superintendents. supervisors& technicians 1132,000)
116
12
Journeymen (70.800)
8
5 - - - - - - - - -
00010 20 30
Strength (thousands)
SOURCE: USAF temsne Mlan, Vol. III Amnn (CO.10 September 1976. p. C.
Fig. 6- Example objective career force structure

- 43 -
model accepts as inputs the numbers of skill level 7
(supervisor/technician) and skill level 9 (superintendent) per-
sonnel required in each CPG (as determined using the Skill Pro-
jection Model[l] and historically-based estimates of loss and
upgrade rates (i.e., respectively, the proportions of enlistees
who leave the Air Force each year and advance to higher skill
levels each year). These inputs define a system of simultaneous
linear equations which the model solves to determine the number
of skill level 5 (journeyman) personnel needed in the career
force to sustain or "feed" the higher skill levels. In so doing,
the model ignores the Skill Projection Model's specifications for
required manpower at skill levels 1, 3, and 5.
The career objective force structure is further refined into
an objective grade structure and extended to include first term
personnel using the Airman Force Steady State Model. This model
also has an internal structure which solves simultaneous linear
equations. Its purpose is to determine promotion policies to be
applied for the enlisted force as a whole, rather than for indi-
vidual specialty groups. Its primary fixed inputs are the size
of the objective career force, total force size or end-strength,
loss rate for each possible combination of grade level and year
[1) The Skill Projection Model is a computer program whichforecasts distributions of authorized strengths for plannedoperations (represented in the Five-Year Defense Plan) in accor-dance with past patterns (indeed proportionately). These fore-casts are treated as manpower requirements for purposes of per-sonnel planning and programming, and so we have included theSkill Projection Model as part of the manpower-requirements/personnel objectives subsystem and as part of theauthorization/assignment subsystem.
&.A

- 44 -
of service, and a promotion opportunity for each grade (i.e., the
proportion of enlistees with a specified number of years of ser-
vice who will have achieved that grade). Promotion phase points
(the average number of years of service in each enlisted grade
before promotion to the next higher grade) and then reenlistment
rates and accessions are varied iteratively until desired numbers
of personnel in each grade are attained which also sum to the
required career force and total force sizes. The principal
result is an enlisted force profile such as depicted in Figure 7.
Implicit in this profile is a promotion structure consisting of
the number of personnel in each combination of grade and years of
service who should be promoted to the next higher grade.
Both the Objective Force Model and the Airman Force Steady
State Model are "static" models; i.e., they derive force struc-
tures which are invariant from year to year. They take no
account of presently or likely available manpower resources.
Invoking the promotion policies so determined, however, should
"drive" the current actual force structure, regardless of its
form, toward the stationary or static structure--provided histor-
ical loss and upgrade rates persist.
Anomalies which may occur during the transition from the
current structure to the static objective structure are identi-
fied using the Promotion Flow Model. This "dynamic" model, sim-
plistically described, consists of a mechanism for sequential
matrix multiplication. Starting with the current structure, each
year's force (partitioned according to grade and year of service)
undergoes attrition, aging, and promotion, consecutively, and

-45-
30 Topoap grade distribution
Grades equitable distributed to all occupationsin proportion to career requirements
Top six
24E-9 1%
E-8 2% ES & E9
20 E-7 7% E7
E-6 11% E6
u. 16E-5 21.2% E5
E-4 23.0 E2 E12652
5
012030 60 70 so 90Strenth (thousands)
SOURCE: USAF Personnel Plen. Vol. Oil Annexes. 12 Sipt. 1976, P. D-10.
Fig. 7 - Example objective grade structure

- 46 -
then required accessions are added to obtain the next year's
expected force. The attrition and promotion steps are accom-
plished by multiplying the appropriate force structure matrices
by matrices of loss rates and promotion rates, respectively.
(The promotion rate matrix is that determined by the Airman Force
Steady State Model.) "Unreasonable" projections such as years
with extremely high accession requirements or cohorts with
unusual promotion phase points are noted and referred to person-
nel policy planners. Possible results include policy revisions
and subsequent re-exercising of the static and dynamic models.
Model outputs include force structures similar to that illus-
trated in Figure 7, but specific to particular years within a
selected planning horizon.
At this point, overall personnel objectives are essentially
determined. A number of other special purpose models transform
this overall objective force structure and promotion policy into
objectives and guidelines for individual career progression
groups, primarily on the basis of historical loss rates peculiar
to personnel in those occupations. These CPG-specific objectives
eventually constitute inputs to the Airman Skill Force Model
within the authorization/assignment subsystem. This model com-
pares current and projected manpower supplies against anticipated
manpower requirements and plays a key role in determining the
needs for personnel recruitment, training, and cross-training.
h - .4I1~ h m I 1 I . . . . .. . . .. .,' ' '' ..

- 47 -
OPERATIONAL CONCERNS
The USAF approaches to manpower requirements determination
and development of personnel plans have received numerous
accolades from the defense and governmental communities. Taken
together, they represent a comprehensive, systematic, and sophis-
ticated set of human resources management methods. The Air Force
has developed these capabilities over many years, continually
updating and improving them. The Management Engineering Program,
with its formal organization, explicit data collection and
analysis techniques, and manpower standards, plays an extremely
vital role. The plethora of data regarding unit operations, man-
power distribution, and individuals' career behavior--much of
which data are maintained in automated files--constitutes a valu-
able resource. And substantial expertise has been exhibited in
creating and using the numerous force planning models.
We point out these features and overall positive assessment
of the subsystem to establish a proper perspective, for the
remainder of our comments tend to take the form of criticism. We
want to emphasize that only the inherent logic and formality of
this subsystem make it possible to perceive the problems we
address in the remainder of this section. And only the existence
of present Air Force organizations and technical capabilities
makes the alternative operational strategies we propose in the
next section seem feasible.
Our discussion of operational concerns begins with some
rather general comments regarding the overall integration of the
manpower requirements/personnel objectives subsystem. These are

-48-
followed by subsections which address more specific aspects of
the subsystem: unit manning specification and force structure
planning.
Subsystem Integration
Many activities and products of the manpower
requirements/personnel objectives subsystem depend on interaction
between components of the subsystem. For example, force struc-
tures depend on manpower requirements--and vice versa. But the
flow of information among subsystem components is often only par-
tial. To illustrate, personnel planners determine promotion
phase points and long-term accession and reenlistment objectives
without regard to projected requirements for specialists at the
three lowest skill levels. (Recall, for instance, that the
Objective Force Model accepts manpower requirements at only skill
levels 7 and 9.) And, another illustration, manpower require-
ments within a specialty, in the form of detailed standards or
guides, are constructed with insufficient regard to temporary
personnel factors such as possible widespread personnel shortages
in a particular type of work center or transient variations in
the availability of individuals with different levels of experi-
ence (e.g., the "humps" typically associated with periods of
war). [1]
[1] The term "hump" in this context refers to the relativelylarge numbers of people in cohorts entering service duringbuild-ups and/or wartime periods. These cohorts historicallyhave remained larger throughout their service careers and henceconstituted a passing abundance of people with the same (butincreasing) level of experience.

- 49 -
Consider also that training program changes can have some
unexpected effects. For example, reducing course length for a
technical specialty, say in an effort to reduce average training
costs, may increase on-the-job training requirements, thereby
reducing unit effectiveness. Eventually this may be manifested
in increased manpower requirements for the work centers,[l]
larger numbers of personnel being needed in the specialty, and
hence more people being recruited and trained--possibly resulting
in a growth of total training costs.
Our objective in these examples is to note that this subsys-
tem is missing some important links; further, existing links seem
to have inadequate influence in determining policies within the
participating organizations. In the remainder of this section we
note three elements of the manpower, personnel, and training sys-
tem which provide natural foci for system integration, but which
do not seem to be addressed effectively: manpower costs, speci-
alty definition/classification, and certain personnel policies.
Quite naturally, the emphasis of many military planners is
on mission performance, for the consequences of mission failure
in wartime can be calamitous. But such a focus on performance
can be accompanied by inattention to costs. We note that the Air
Force's manpower requirements/personnel objectives subsystem can-
not be indicted on this count, however. Costs are considered in
the continuing program evaluation process, during force planning,
[1] Productivity reductions may also be manifest inincreased overtime, poor sortie performance, and a variety ofother input/output measures.

- 50 -
and within the process of applying manpower standards. The
debatable issue is the effectiveness of this cost consciousness.
Virtually all Air Force members are familiar with manpower cost
control actions taken by high-level decisionmakers. These often
take the form of across-the-board personnel reductions and/or
program cuts. That such moves reduce costs cannot be argued
(although the effects on mission performance capability generally
can be and are--and at some length and volume). But, as we dis-
cuss below in considering the specification of manning configura-
tions and the development of force structure plans, more subtle
adjustments that can be made in response to cost concerns are
largely overlooked. We believe that consistent and effective
attention to costs can improve integration and interaction in the
manpower requirements/personnel objectives subsystem. Our
suggestions for alternative operational strategies and our recom-
mendations for relevant research and development activities will
clarify how we believe that improvement can be realized.
As has been seen throughout our discussion, most enlisted
manpower, personnel, and training system activities depend on the
definitions of technical specialties. Manpower standards, promo-
tion quotas, training programs, etc., are based on fundamental
specifications regarding individuals' skills, aptitudes, and lev-
els of experience. Current specialty classifications for
enlisted personnel are published in Air Force Regulation 39-1.
Appendix E excerpts the portion of that publication devoted to
the definition/revision of the classification scheme. These
instructions, emphasizing mission effectiveness, unit operations,LIi

- 51-
manpower requirements, personnel considerations, training, and
costs, make it clear that the role played by the classification
structure is fundamental to the entire manpower, personnel, and
training system. Yet revision of the classification definitions
seems relatively haphazard. Basically, changes are investigated
when someone notices and points out a classification problem.
While the Manpower Personnel Center regularly reviews the clas-
sification for each AFSC, there is no regular effort made to
examine the overall classification structure for possible changes
which might improve effectiveness and/or reduce overall costs.
Consideration of the combined implications for manpower,
personnel, and training also should occur during evaluation of
certain personnel policies. An example is the policy of advanc-
ing enlisted personnel into the ranks of management as non-
commissioned officers as opposed to retaining some as senior
technicians. That is, typically, once a specialist attains a
certain level of experience and technical competence, his only
options are to be promoted to a supervisory position or to leave
the Air Force. Essentially, the subject here is similar to the
"up-or-out" issue so often discussed for officer personnel. One
policy option is to allow some airmen to progress into higher
enlisted grades and continue working as technical specialists
rather than supervisors; thus, the issue here is really a matter
of personnel utilization. The ramifications for unit manning,
retention, force structures, recruiting, training, costs, and
mission capability are important; but a ready means for consider-
ing these combined effects is not available. Similarly, mechan-
J!m

-52-
isms for evaluating policy revisions in the retirement and com-
pensation programs--especially as they might affect retention
rates, and hence workforce structure, costs, and productive
capability--do not exist. Integrated means for evaluating
effects of enlisted force entry requirements (e.g., mental apti-
tudes) are also lacking--as are methods for considering options
related to changes in manpower supply (e.g., trying to achieve
force structures with larger numbers of more senior personnel,
who in many occupations must be more productive than their
juniors, during times of diminishing availabilities of
enlistment-eligible youth).
The research we discuss in the final section of this paper
should consider many of these integrative planning issues.
Spe;ifically, improved means for addressing these problems can
come through enhanced methods for developing manpower require-
ments and personnel force plans. The following two subsections
focus on problems specific to these two components of the current
manpower requirements/personnel objectives subsystem.
Unit Mannin Specification
As already mentioned, recommended manning for individual
work units is specified in manpower standards and guides. Thus,
although commanders have the discretionary authority to distri-
bute their allotted authorizations differently, these common
guidelines represent the "default" work center manpower confi-
gurations. As exemplified in Figure 5, these manpower standards
specify, for any given workload, the total quantity of manpower
needed to operate the work center and the "quality" breakdown of

- 53 -
this total into quantities for specific specialties, skill lev-
els, and grades.
Such standards are constructed painstakingly, with special
care taken to involve the affected organizations, and with con-
siderable opportunity for review and revision. When they are
eventually employed, they often result in manpower cost reduc-
tions far in excess of the cost of their development.[l] They
also sometimes result in manpower authorization increases. The
standards have the additional effects of encouraging similar
operations among similar work units in different locations and of
maintaining a common "standard of living." As time and authority
allow, efforts are also made during standard development to
review work methods, procedures, organization structure, etc. and
to introduce improvements which make the work centers more effi-
cient and/or effective.
The most apparent feature of standards is their singularity.
That is, for a given workload there is recommended just one man-
power configuration: a fixed number of people with each combina-
tion of specialty, skill level, and pay grade, adding to a single
total. For example, there is no indication that the work handled
by the 15 people recommended in the third column of Figure 5
could also be handled by, say, 13 people if, for example, there
were fewer low-skilled workers and a few more high-skilled work-
ers. A hypothetical alternative configuration might involve sub-
stituting 1 supervisor/technician and 1 senior journeyman for 2
[11 See Chapter 21, AFR-25-5, November 1977.

- 54 -
junior journeymen and 2 apprentices. Of course such a substitu-
tion would not imply the straightforward takeover of the junior
peoples' work by the more highly skilled and experienced people.
A number of more subtle shifts of tasks among these and other
individuals would be required to maintain satisfactory relation-
ships between the types of people involved and the kinds of work
they perform. (Note: this example is hypothetical only; we are
not implying that this particular unit manning change is desir-
able or even feasible).
Consider one eventual effect of developing the singular
standards we see today: limited flexibility in force planning.
As a simple illustration, consider a hypothetical work center
found at say, 100 bases, each base experiencing a different work-
load for that work center. Suppose eight types (or "categories")
of people, distinguished by skill level and grade within the same
specialty, are employed in these work centers. For each workload
a manpower standard specifies the recommended number of each
category to employ. By summing these numbers over all bases, we
obtain the forcewide total requirement for specialists in each
category. Thus, basically, we have identified a single total
force structure for this specialty. Our continuing goal then
becomes attainment of this targeted force structure. If, on the
other hand, multiple force structures were identified--i.e.,
alternative workforce structures capable of performing the same
missions--substantial flexibility could be introduced into the
force planning process. Attention could then be directed toward
evaluating the costs of attaining these alternative workforce

- 55 -
structures--including expenditures for basic pay and allowances,
of course, in addition to costs for recruiting, initial training,
retraining, bonuses, retirement pay, and, perhaps in the future,
separation pay. These costs change over time as personnel poli-
cies change, and policy changes are often reactions to changes in
the "external environment"--e.g., demographics or civilian
employment opportunities. By maintaining pursuit of a single
workforce structure, the current planning process forgoes poten-
tial opportunities to achieve savings in many high-cost areas of
workforce development and support. And to the extent that the
single targeted workforce structure is not achieved, the mission
capability of the evolving workforce may differ from the desired
capability.
Other concerns regarding the specification of single unit
manning configurations emerge as we look backward beyond the
standards and into the processes which generate them. Several of
these concerns have been intimated in the previous discussion.
One observation is that standards tend to be generated in a
circular manner, tending to perpetuate past manning practices.
During the standard "measurement phase," data from about 15 to 30
sample bases are collected. These data represent current opera-
tions; for instance, they might reflect the "measured manhours"
expended in the conduct of each of several work categories and/or
in each of several hundred individual work center activities.
Typically, such data are aggregated into total manhour figures;
identities of the types of individuals who contribute these
manhours are not maintained. The total manhour quantities become
4 ,... ... ............. .. ..... .. .. ...

- 56 -
observed values for the dependent variable in functional (regres-
sion) relationships with one or more independent variables (or
"workload factors"). Alternative functional relationships among
the variables are routinely examined to find an equation provid-
ing the best possible explanation of current total manhour expen-
ditures. This becomes "the standard equation" for the subject
work center.[1 The key point is that the manpower standard
reflects current work center practices. Insufficient attention
seems to be paid to data which indicate exceptionally efficient
performance (i.e., the "maverick" or "outlier" bases whose
manhour expenditures seem relatively lower in comparison to work-
load). The thrust is to "normalize" into a common or average
sort of relationship, possibly even standardizing on mediocrity.
We should emphasize an interesting process of data aggrega-
tion and disaggregation in standards development. Basically,
data regarding the detailed distribution of effort among tasks is
aggregated into total manhour expenditures and employed in
estimating the standard equation. Then, essentially using MET
personnel's best judgments, each possible total number of people
that might be employed in the work center is disaggregated into
constituent numbers of people according to specialty, skill
level, and grade. Detailed data regarding the quantities of dif-
(1) Of course a considerable amount of work goes intoanalysis of the elemental data to identify possible inconsisten-cies, errors, necessary adjustments, etc. and to determine "addi-tives" and/or "subtractives"--i.e., justifiable deviations fromthe standard due, for example, to base or command-peculiar opera-tional characteristics.

- 57 -
ferent types of work to be performed are relatively little used.
Strong influences in establishing these breakdowns belong to past
manning practice (as reflected in authorizations) and to grade
guidelines (developed in planning long-term force structures
which are also based on historical patterns; see next section).
A related observation is that the basic standards "measurement"
data are not person-specific. For example, in work sampling stu-
dies, the percentage of time spent in each category of work is
estimated by observing different types of workers; novices and
experts are not differentiated. In fact, when people are
observed to work at different rates, their rates are "leveled" or
normalized using "pace rating." [1] This approach protects the
identities of the individuals observed in the study and hence
promotes their cooperation, but it also masks the "quality" asso-
ciated with the time expended in each activity. As a further
example, the operational audit technique results in estimates of
the times required to perform individual tasks, but no informa-
tion is available on how these times might vary among the dif-
ferent types of people (e.g., with different specialties and/or
skill levels). This sort of data would seem to be critical in
specifying unit manpower configurations capable of meeting
overall performance requirements.
Standard manning configurations are also constructed with
little regard for likely manpower availability. Only subjec-
tively can management engineers weigh the merits of manpower
[1] See Attachment 7, AFR 25-5, November 1977.

- 58 -
configurations which differ, for example, in their dependence on
first-term airmen. Of course there is widespread military con-
cern over potential shortfalls of and/or increased expenditures
for first-term personnel (due to declines in the numbers of youth
eligible for military service), but there is no formal mechanism
for considering these possibilities in specifying manning confi-
gurations. A further concern relating to insensitivity to man-
power availability: there is limited capability for adapting to
known shortages or excesses of specialists with particular levels
of experience. That is, existing "humps" and "valleys" in indi-
vidual specialties' force profiles, perhaps due to periods of
wartime, reduced operations, personnel dissatisfaction and
exodus, etc., are not considered. Correcting these deviations
through cross-training, bonus plans, reductions in force, etc.
can be difficult and expensive.
We find also that the standards development process embodies
insufficient opportunity to consider cost implications. As
already noted, costs for training, retraining, recruitment, reen-
listment, separation, and retirement are not considered; and even
basic salary factors come into play only after the fact. The
sole overt deference to cost occurs in completion of standards
program management reports (Air Force Form 498, 1973).[1J These
summary reports delineate manpower changes due to the standard
over three fiscal years--i.e., changes at each pay grade level.
Each such change (e.g., six fewer E-6 personnel) is multiplied by
[1) See AFR 25-5, Attachment 23.

- 59 -
the corresponding average salary factor, and the products are
summed to obtain the total impact on pay.[l] This value, together
with any other cost changes occurring due to the standard study
(e.g., improved material handling), is compared to the cost of
conducting the study to determine the study's "return." At this
point the standard manning configurations have already been
determined and applied; it is far too late for these or other
cost factors to influence choices among manning alternatives.
Force Structure Planning
As already noted, force structures are dictated to a consid-
erable extent by manpower requirements projections. But we
observe that the objective or target structure for the career
force (those airmen beyond the first term of service) is prepared
based only on the projected requirements for people at skill lev-
els 7 and 9. The remainder of the force structure plan is filled
out by using historical retention and skill upgrade rates and by
varying promotion, reenlistment, and accession quantities. Pre-
cise agreement between individual specialties' projected require-
ments at the lower skill levels and the corresponding manpower
quantities in the force structure plan, then, should not be
expected. Since both the projected requirements and expected
personnel behavior (regarding promotion, upgrading, separation,
[1] We note that other important costs such as technicaltraining, reenlistment bonuses, and retirement benefits--allimplicit in the occupational force structures which would appearif standard manning suddenly were employed worldwide--do notappear in this evaluation.

- 60 -
etc.) are based on past experience, however, the disagreement may
not be severe.- We have not assessed the size of such disagree-
ments quantitatively. It suffices here to note the potential for
incongruity between skilled manpower requirements and correspond-
ing specialty force plans.
The dependence of the force structuring process on histori-
cal loss rates, upgrade rates, etc. is another prominent feature.
Very little effort is made to examine the mechanisms available to
influence these rates. For example, the potential effects of
reenlistment bonuses on retention rates do not come into play.
And although it is felt that promotion policies affect retention
rates, the effects of variations in these policies (particularly
phase points) are not considered in the enlisted force planning
models.[l] Similarly, training program revisions could lead to
different skill level upgrade rates, but these possibilities are
not considered. The orientation here is very much toward main-
taining career progression and total end-strength. And nearly
all the flow rates which could be influenced through policy deci-
sions are treated as fixed at their historical values.
[1] Note: The Airman Force Steady State Model, for example,allows different retention rates for people in the same year ofservice who hold different pay grades. Thus, the model doesincorporate some influence of promotion policy on retention. Butpotential effects such as the increased "pull" of lowered phasepoints--i.e., expectations of faster promotions among more juniorpeople, whose retention rates should increase--are not con-sidered.

-61-
This tendency to regard things as fixed during the force
planning process is even more apparent when we note the static
nature of the models employed. The Objective Force Model, the
Airman Force Steady State Model, the Five Level Redistribution
Program, the CPG Objective Grade Model, and the AFSC Decomposi-
tion Model are all stationary or static models. They determine a
single, self-sustaining force structure. They make no attempt to
capitalize on current manpower availability (i.e., the humps and
valleys noted earlier), they take no account of the costs that
may be incurred in moving from the present force structure to the
objective structure, and they tend to disregard changes in per-
sonnel behavior (e.g., revealed through loss rates) and recruit-
ment potential (affected, for example, by a shrinking population
in the primary enlistment age group) which may occur during the
planning period.
Of course personnel plans address the force structure's pro-
gression toward the objective (see, e.g., USAF Personnel Plan,
Vol. III, Annex E). But apparently there is little opportunity
in making these projections to allow for likely changes in pro-
grams, technologies, behavioral patterns, etc. The Promotion
Flow Model is the primary tool used for considering enlisted
force structure dynamics. Its main use is found in considering
the force as a whole, again neglecting specific occupational
needs. The model admits little flexibility for considering
changes in programs, technologies, behavioral patterns, etc.
Although its inputs may reflect such changes--e.g., overall force
size need not remain fixed and retention rates may be based on

- 62 -
experience in different years (e.g., 1978 vs. 1979)--they are not
considered within the model itself. And the m6del certainly has
no innate capability for controlling force evolution--e.g., by
recommending retention incentives or enlisting more people during
years of "easy" personnel supply (e.g., due to large enlistment-
eligible cohorts or slowdowns in civilian employment growth). At
times in the past, policies seem to have been sought which would
shape the force structure into the objective form as quickly as
possible.
Another factor related to the dynamics of force evolution is
the uncertainty of human behavior--even if the behavior-
influencing factors are fixed. As noted in Appendix D, for exam-
ple, the chance that 30 out of 100 people with similar charac-
teristics (e.g., specialty, years of experience, education, sex,
pay grade) elect to leave the Air Force in a given year--even if
the underlying loss probability for such people is 30 percent--is
quite small (indeed, less than 10 percent). In neglecting such Juncertainties, current planning models' projections of the number
of people remaining in a cohort after several years are subject
to considerable error. Further, the likelihood of error
increases for smaller cohorts and especially when loss rates are
estimated from fairly limited historical experience.
We also note the relatively minor role played by costs in
force structure planning. The major objectives seem to include
determining a force structure of a given total force size, meet-
ing minimum requirements for personnel at the highest skill lev-
els, providing equal promotion opportunity for all, and staying

- 63 -
within certain grade structure limitations (i.e., legislative and
OSD restrictions, respectively, on the percentages of the force
that can be in the top two and the top six pay grades). The
planning models are used to accomplish these ends by solving
numerous sets of simultaneous equations, basically determining
for each specialty grouping the number of people in each year
group, skill level, and pay grade--and simultaneously determining
the personnel "flows" between cells in a network representation
of the force. The TOPCAP approach to cost minimization is basi-
cally to minimize the size of the career force. Only the Airman
Force Steady State Model acknowledges costs explicitly. Its out-
put may (optionally) include cost estimates for procurement and
training, maintenance, retirement, and incentives. But this
capability has been "added on" to the basic program and is
apparently little used. (And even when used, it cannot influence
the model's other outputs.) This model's primary use is for
total force planning. Hence, such cost data are not career- or
specialty-specific--as especially training and incentive costs
obviously should be.
Another adjunct to the Airman Force Steady State Model
emphasizes a further shortcoming of the overall force planning
process: its neglect for productivity considerations. It is
apparent, especially within individual specialties, that certain
categories of personnel can be substituted for others, with con-
comitant changes in force capability. Albrecht (R-2330-MRAL,
1979) examines the substitution potential between first-term and
career personnel. In examining 17 Air Force specialties,
l m ll , . . . .I Ili-d _: _ . . . . ... . . . .•. . .I.. .

- 64 -
Albrecht concludes that productivity increases with experience,
and that a redistribution between first-term and career personnel
could bring substantial annual cost savings with no loss of
overall effectiveness. He finds that, presently, higher skill
occupations tend to overutilize first-term labor inputs, and
lower skill occupations tend to underutilize first-term inputs.
Unfortunately, the Air Force enlisted force planning process does
not have the capability to analyze such issues. The process uses
no data regarding the relative capabilities/productivities of
different categories of personnel. Further, there is no ability
to make cost tradeoffs among resource alternatives.
The force structure planning portion also aims to provide a
singular output: an enlisted force of a fixed size and with
predetermined relationships among its components. This planning
process does not routinely identify and evaluate alternative
force structures, examining, for instance, the costliness of
imposed constraints such as limitations on the proportion of the
force that can be in certain grades or requirements that all
specialties offer similar promotion opportunities. It does not
necessarily identify least-cost or most-productive force struc-
tures.
In summary, the force planning process seems preoccupied
with career progression. We concur that career
progression/promotion opportunity must be preserved, but we
believe that more emphasis should be given in the planning pro-
cess to issues of cost, productivity, and dynamic force evolu-
tion.

- 65 -
ALTERNATIVE OPERATIONAL STRATEGIES
To provide the manpower requirements/personnel objectives
subsystem with enhanced capabilities to deal with issues of cost,
productivity, and dynamic force evolution, we believe the plan-
ning process should be extended in two dimensions. First, sys-
tematic means should be developed for identifying alternative
unit manning configurations. Second, force planning techniques
should be devised which can use economic criteria to select among
the resulting forcewide manning alternatives (all providing the
requisite mission capability) while preserving career progression
opportunity. These techniques should provide the capability to
identify dynamic force structures which capitalize on current and
likely personnel supply and to evaluate the impacts of force
structure constraints (e.g., end-strength and grade ratio limita-
tions).
These extensions of the present system would imply numerous
differences in its operation. Many of these are noted in the
following very brief discussion of these two ideas.
Unit Manning Alternatives
The concept and implications of unit manning alternatives
can be introduced most conveniently through an example. Let us
continue to use the example of the Personnel Records work center
introduced earlier. Suppose we are considering an installation
populated by 2,000 officers and 10,000 enlisted people; its stan-
dard complement for the Personnel Records work center is then 15
persons, categorized as depicted in Figure 5. We have reproduced
this standard unit manpower configuration as "Alternative I" in
A

-66-
Table 6. The table also displays an alternative configuration,
"Alternative 2", hypothetically capable of accommodating the same
workload. (Note that, probably realistically, the smaller the
total unit size, the relatively more senior people required.) If
there were, say, two other bases similar to this one, the three
could be manned in several different ways with each base using
one of these "standard" configurations. Referring to Table 7, we
see that providing just two configuration alternatives allows 4
different total force configuraticns for these 3 bases. Depend-
ing on which bases use each unit configuration, a total of 8 dif-
ferent basing alternatives are possible.
I . , i.. . . . .

- 67 -
Table 6HYPOTHETICAL MANNING ALTERNATIVES FOR A BASE PERSONNEL RECORDS OFFICE
SUPPORTING 2,000 OFFICERS AND 10,000 ENLISTED PERSONNEL
Manpower Requirement
AFSC Grade Alt. 1 Alt. 2
Personnel Technician 73270 MSG 1 1Personnel Technician 73270 TSG 1 2Personnel Technican 73270 SSG 1 1Personnel Specialist 73250 SSG 1 2Personnel Specialist 73250 SGT 4 4Personnel Specialist 73250 AIC 3 1Apr. Personnel Specialist 73230 AIC 4 2
TOTALS: 15 13
Table 7BASING AND TOTAL FORCE ALTERNATIVES FOR THREE SIMILAR BASES WITH TWO
UNIT MANNING ALTERNATIVES
Basing Unit Configuration Alternative Total ForceConfiguration Base 1 Base 2 Base 3 Configuration
1 1 1 1 12 2 1 1
3 1 2 1 24 1 1 25 2 2 16 2 1 2 37 1 2 28 2 2 2 4
U- ---------------------------------

- 68 -
Of course, the number of basing and total force possiblities
grows rapidly as the number of unit manning alternatives and the
number of bases considered increases. Table 8 illustrates the
situation for 10 bases with similar workloads. The alternatives
are vastly more numerous when we consider the realistic case of
many more bases, most having different workloads. Lest these
possibilities seem too numerous, we note that they are tied to
very few unit manning alternatives. Apparently, only a few such
alternatives generate vast force configuration flexibility.
Table 8NUMBER OF TOTAL FORCE AND BASING CONFIGURATIONS FOR
SIMILAR WORK CENTERS AT 10 BASES
No. of Unit ManningAlternatives Availableper Base 1 2 3 4
No. of Total PersonnelForce Configurations 1 11 55 220
No. of BasingConfigurations 1 1,024 59,049 1,048,576
But how can such alternatives be developed? We believe the
USAF Management Engineering Program has the requisite capability.
As noted previously, Management Engineering Teams already collect
myriad detailed data regarding unit manning and operations. At
present, the manhour data are substantially aggregated (the dif-
ferent categories of personnel are not distinguished). One pos-
sibility is to collect these data in disaggregated forms or even
to employ historical unit manning records (maintained in MPC's
automated files). Then, in a manner similar to that employed
currently, functional relationships between unit manpower
"inputs" and corresponding workload or "outputs" could be
,tIS+

- 69 -
estimated. Other possibilities include conducting surveys to
examine personnel tradeoffs (i.e., substituting different
categories of personnel for others), analyzing detailed work
allocation alternatives, and straightforward reliance on the
expert judgment of MET personnel.[1 Development of specific
mechanisms for identifying unit manning alternatives is included
as a major task in the research recommended in the final section
of this paper.
Aside from developing the alternative unit manning confi-
gurations themselves, of course, there is the very important
practical question of how to select among them. Answering this
question requires considering both the force planning and author-
ization allocation processes--because the structure adopted for
an occupation's entire workforce is dictated by the cumulative
choices made for individual installations. These choices could
be made individually, centrally, or possibly via negotiation.
Indeed all of these approaches come into play within the present
system: current standards are developed and promulgated centrally
(but with local participation), commands choose individually to
comply or deviate, and, under the Skills Management System, sub-
stantial differences would be mediated by the Air Force Manage-
ment Engineering Agency (AFMEA). It appears imprudent to advance
an answer to this question at this early juncture. The
[1] It is our subjective conclusion that MET personnel mightprefer to specify more than a single acceptable unit manning con-figuration for each workload. A great deal of effort currentlygoes into designing "the" configuration, and confidence that theconfiguration selected is distinctively "best" seems low.

I- 70 -
flexibility required by unit commanders and the stability favored
by those responsible for personnel planning and programming both
must be considered. It may be possible, for example, for com-
mands to select some among (or at least to rank-order) manning
alternatives developed for their operating units. These could be
aggregated centrally into alternative occupational force struc-
tures which would then be evaluated in terms of their attainabil-
ity, costs, etc. (This brings up questions of force planning; see
the next subsection.) Once overall occupational force structures
are selected, authorizations could be allocated to coincide as
closely as possible to command-specified preferences. The issue
here is at once authorization allocation and force structure
planning. Its satisfactory resolution could improve substan-
tially the integration between the authorization/assignment sub-
system and the manpower requirements/personnel objectives subsys-
tem. By considering different degrees of centralization in
authorization allocation authority, considerably different imple-
mentations of a planning strategy which incorporates alternative
unit manning and force structure alternatives can be envisioned.
Whatever the degree of centralization or the form of organiza-
tional interaction, the process certainly should address current
and anticipated personnel supplies, force structure evolution,
and costs.
$

- 71 -
Force Planning Techniques
As noted previously, force structure plans for specialty
groupings are determined with insufficient regard for manpower
costs, dynamics, or mission capability. Attention focuses on
historical behavior, career progression, and external con-
straints.
This emphasis can be changed, however, by taking advantage
of unit manning alternatives like those just proposed. The
plethora of force configurations arising from these alternatives
would constitute a broad set of "solutions" to the force planning
problem. They would all have the paramount property of meeting
mission-capability requirements. Some configurations, however,
would probably be inadmissible, because, for example, they might
require unattainable retention rates. Hence, the problem becomes
one of searching among these possibilities for a "feasible" and
in a broad sense "least cost" force structure. Indeed, in the
dynamic case we could imagine a different set of alternative
force structures for each year in some planning period. Then the
problem is one of selecting consecutive force structures, begin-
ning, of course, with the current structure. In either the
static or dynamic case, this selection process would amount to
designing forces with appropriate internal structure (flow rates,
grade ratios, etc.), fabricating them from the relatively few
manning configurations identified for each projected workload.
In the dynamic case we would face the additional difficulty of
selecting an orderly progression of forces, one that would hold
down undesirable fluctuations in promotion policies, training

- 72 -
practices, etc.
A model or system of models which could aid in accomplishing
all this is certainly within the state-of-the-art. Jaquette and
Nelson (R-1451-ARPA) have developed an optimization model quite
similar in concept (though not in form). Theirs is a static and
very aggregate approach (e.g., there is no recognition of speci-
alties, skill levels, or pay grades, and force members are
categorized only according to their term of service), but it
serves to identify the key issues requiring study. Their model
assumes the existence of a "mathematical production function"
yielding the productive capacity of a given force in terms of its
constituent experience profile. The function's purpose is to
ensure that at least some minimum productive capability is pro-
vided by the selected force. Under the strategy we propose, this
capability is guaranteed by constructing the set of possibilities
from unit configurations which can accommodate projected work-
loads. Alternatively we could estimate specific mathematical
functions to "fit" the range of possible forces defined by these
unit configurations.
Jaquette and Nelson also assume knowledge of "supply func-
tions," expressions recognizing the influences of wage payments,
bonuses, and retirement benefits on enlistment and retention
behavior. This is in contrast to present USAF enlisted force
planning models which regard personnel behavior as fixed. Since
force structures obviously can be influenced by compensation,
which is variable through bonuses, and since compensation expen-
ditures often may be traded off against recruitment and
Lr ,p

- 73 -
training/retraining expenditures, it is apparent that a con-
venient model of overall costs and associated personnel behavior
is needed. Considerable research on these topics is documented
in the relevant literature, and it needs to be synthesized and,
if necessary, extended to meet present needs.
The sophistication required of the model or models needed to
assist in this sort of dynamic, cost-conscious, productivity-
preserving planning task is substantial. At first glance it may
appear that the computation expense associated with such methods
would be exorbitant. But we should recall that numerous models
are already in place and exercised regularly in the USAF man-
power, personnel, and training planning system. These models
already perform many of the calculations required in this alter-
native approach; it may even be possible to extend them to incor-
porate these additional capabilities. Barring that, several of
them would probably be displaced by new models. Our point is
that the computational requirements associated with this alterna-
tive planning approach would only be incremental. In addition,
we should recall the very large sums being expended to acquire,
train, and maintain the personnel force. Deriving force struc-
tures costing only a small percentage less than those being
planned now and in the future could produce savings dwarfing any
additional operational or development costs that might be
incurred in the planning process.
Of greater interest should be the additional capabilities
and unfamiliar options that would be implicit in this new stra-
tegy. It would be possible, for example, to evaluate quickly the
| I-

- 74 -
implications of program or technology changes affecting certain
work centers, for workload variations or technology-induced unit
manning changes would change the set of possible force structures
directly. Also, it would be possible to evaluate quantitatively
the impact of externally imposed constraints on enlisted grade
ratios and reenlistment bonuses. As an example of an aspect
which may cause some consternation, it might be possible to iden-
tify cost-minimizing force structures which provide the required
mission capability--but which do not conform to some prespecified
total force size or end-strength. Of course a constraint on
end-strength could also be introduced--and hence evaluated.
The essence of these alternative operational strategies is a
more direct linkage between the force's productive capability and
its costs. The objective is to focus attention on these two
aspects within a framework which will preserve career opportun-
ity, vigor, and experience in the enlisted force.
F -L

- 75 -
IV. CONCLUSIONS AND RECOMMENDATIONS
The conclusions we have reached are presented in this sec-
tion along with some recommendations for further research.
SUBSYSTEM EVALUATIONS
We have found both the authorization/assignment subsystem
and the manpower requirements/personnel objectives subsytem to be
generally effective. The recruitment, training, crosstraining,
and separation activities apparently result in the assignment of
personnel to individual specialties in substantial agreement with
the approved end-strengths of authorized positions in those
specialties. This conclusion bears up over time (recall that our
sample data covered a period of nearly three and one-half years).
At any given time, only a relatively small number of people were
assigned to specialties in excess of those specialties' author-
ized requirements, and a correspondingly small number of author-
ized positions were unfilled. Overmanning of specialties was
much more common than undermanning. The specialties experiencing
significant imbalances between authorizations and assignments at
any time, however, tended to experience that problem per-
sistently. This was in contrast to those specialties which
accounted for the bulk of the significant shortages or surpluses
at any time; their imbalances generally were restored quickly to
acceptable levels. That fourth of the sample's specialties which
were chronically imbalanced tended to be smaller, exhibit larger
trends in their authorized manning, and/or experience relatively
more variations in authorization levels. Assignment levels

- 76 -
tended to parallel authorization levels quite well even for these
chronic specialties.
We conclude that the personnel "production" process func-
tions rather well. The exception is that when authorization lev-
els change significantly and quickly, or possibly when unexpected
fluctuations in retention behavior occur, sizable imbalances can
be introduced which take some time to rectify. In addition, we
observed that chronically overmanned specialties tend to be rela-
tively more "mission-critical" than other chronic specialties and
tend to have longer training times than other specialties. We
conclude that many of these AFSCs may be consciously "protected"
by ensuring an ample supply of manpower. All in all, aggregate
trained manpower resources appear to be provided in quantities
quite close to their authorized levels. We have not examined
authorization/assigment imbalances regionally (e.g., stateside
installations vs. others), organizationally (e.g., differences
among commands), or with respect to experience (e.g., as indi-
cated by skill level or pay grade). Imbalances that may exist at
these levels may be due, for example, to policies and priorities
which cause the assignment system to give "preferential treat-
ment" to some categories of locations. Another contributor is
the simple impossibility of always keeping positions filled pre-
cisely as authorized. Analysis procedures similar to those used
here--including data over an extended period and incorporating
thresholds for "significant" and "chronic" imbalances--can be
employed to investigate the balance between authorizations and
assignments at these more detailed levels. These issues merit

- 77 -
investigation for two reasons: to assess their influence on unit
readiness and to determine their implications for the alternative
operational strategies advanced in the preceding section.
Our conclusions regarding the manpower
requirements/personnel objectives subsystem can also be summar-
ized briefly. We find that the subsystem is somewhat lacking in
integration, largely because it lacks mechanisms which focus on
costs and productivity. Specifically, it lacks the ability to
evaluate possible redistributions of force strength among dis-
tinct manpower categories within and between specialties. The
requirements determination process generates manpower standards
prescribing just one personnel configuration for each possible
unit workload, and the force planning process generates just one
objective force structure. These processes place considerable
emphasis on historical data, basing their calculations, for exam-
ple, on unit operational experience, past allocations of authori-
zations, and historical personnel behavior. Routinely, very lit-
tle opportunity arises in these processes for developing and
testing operational and/or policy alternatives which might funda-
mentally affect the cost-effectiveness of enlisted manpower
employment.
These historical data, on the other hand, largely available
in automated files, together with existing USAF organizations and
expertise provide a very sound basis for extending and improving
the manpower requirements/personnel objectives subsystem. We
believe that a valuable alternative strategy can be built around
the systematic generation of different work center manning confi-
'A|

- 78 -
gurations capable of handling the same workload. Only a few such
configurations are needed for each workload in order to generate
many occupational force structures. These alternative structures
then can be evaluated using such factors as costs (recruitment,
training, wages, bonuses, separation pay, retirement, and other
benefits), career progression (i.e., promotion opportunity), and
external constraints (e.g., enlisted grade limitations). All of
these are considerably linked to personnel behavior. For exam-
ple, grade ratio limitations affect promotion opportunities,
which, along with cost-affecting compensation practices, influ-
ence individuals' decisions to stay in or leave the Air Force.
We also believe that objective overall and specialty force
structures should be planned dynamically. That is, the policies
which shape them should be formulated by considering current and
likely personnel supplies in an orderly evolution.
RECOMMENDED RESEARCH
As noted previously, the Air Force itself is examining the
distribution of manpower authorizations and assignments. This
capability will greatly facilitate assessment of the
authorization/assignment subsystem's performance. We recommend
that, in addition, efforts be undertaken to examine actual rela-
tionships between required or "standard" manpower and these
authorization and assignment levels. In promulgating a manpower
standard, Air Force management engineers typically report cost
differences that would be associated with its application; i.e.,
they compare average costs of existing and proposed standard man-
ning levels. Such comparisons help to summarize results of'a

- 79 -
study effort and, especially when savings are reported, justify
the management engineering role. Continued monitoring of the
comparison between authorized and standard manning, however,
should reveal the impacts the standards actually have on manpower
allocation. If allocations are not in agreement with standards,
perhaps the views of the responsible commanders and those of the
standard-builders do not coincide. In the latter case there
would probably be unmet needs for education and/or standard
modification. Comparisons between standard and authorized man-
ning might also point out how severely manpower budgets may be
limiting expectations of operational capability; i.e., for the
cases where authorization levels fall short of standard-
recommended manpower. Comparisons between standard manning and
actual assignments, on the other hand, should help identify the
eventual impact of manpower standards on actual manning and the
degree to which operational capabilities may deviate from those
required. The regularity and persistence of deviations from
standards may indicate whether operating efficiencies are being
t realized and whether standard revision is required.
We might consider authorized, assigned, and standard man-
power as three vertices of a triangle, each pair of vertices
joined by a major "activity" within the overall manpower, person-
nel, and training system. The "personnel" and training portions
of the authorization/assignment subsystem are responsible for the
triangle's edge joining authorizations and assignments; the
objective here is to make assignments consistent with authoriza-
tions. The edge joining assigned and standard manpower is the A
* - A

AD-A091 849 RAND CORP SANTA MONICA CA F/ 15i/5AIR FORCE MANPOWER, PERSONNEL. AND TRAINING SYSTEM. VOLUME 11. -ETC(U)MAY A0 B E ARMSTRONG. S W CHAPEL. S C MOORE FR9620 77-C-0030
UNCLASSIFIED RAND/N-147bAF N

1j2
1.8
'1111112 jj.
MICROtOPY RESOLUTION TEST CHARTNATIONAL BUREAU OF STANDARDS-1963-A

- 80 -
responsibility of Management Engineering and is a part of the
manpower requirements/personnel objectives subsystem; the objec-
tive here is to develop standard unit manning configurations
which are efficient and simultaneously consistent with current
experience in Air Force work centers as they are actually manned
and operated. The edge joining standard and authorized manning
is the province of commanders at various levels (e.g., unit,
base, and major command), operating through the Air Force's "man-
power" organization; the objective here is to distribute approved
total manpower authorizations so that mission capabilities are
best provided. This last activity is the authorization part of
the authorization/assignment subsystem. We believe the detailed
distribution of manpower resources can be examined best by con-
sidering and comparing all three of this triangle's vertices.
Ideally, the three manpower specifications should coincide.
More fundamentally, we recommend that the Air Force develop
an alternative operational strategy for the manpower
requirements/personnel objectives portion of its overall man-
power, personnel, and training system. The proposed strategy
would be built around methodical specification of alternative
manpower requirements; i.e., routine generation of different man-
ning configurations which can handle the same workload, provide
the same degree of readiness, etc. These equally-capable work
forces should be developed first at the level of individual work
centers and then be combined to identify alternative forcewide
manning possibilities. These forcewide alternatives can then be
evaluated systematically. Factors which must be included in such
" IT i111 II I III I # I I -

- 81 -
evaluations, of course, are costs (recruitment, training, wages,
bonuses, separation pay, retirement, and other benefits), career
progression (i.e., promotion opportunity), and external con-
straints (e.g., enlisted pay grade ratio limitations). We recom-
mend that alternative manning configurations be specified first
at the unit level because this is where mission capability must
be assured. And since costs, career structure, etc. can only be
assessed adequately at aggregate levels, we recommend that force
plans be developed by comparing alternative forces corresponding
to different combinations of the individual unit manpower confi-
gurations.
We believe the capability for developing alternative work
center manning configurations can be achieved by extending
methods currently employed in the Air Force's Management
Engineering Program (MEP). This program already embodies an
appropriate organizational structure and a technical staff who
are accustomed to collecting and analyzing large and detailed
data sets. The recommended extension to the management engineer-
ing activity would involve explicit evaluation of the relative
capabilities of different types of manpower. Differences in
functional capabilities and work rates are considered only impli-
citly in the current standard development process, and methods
for considering them vary from one standard study to the next.
We recommend development of specific methods which can be applied
consistently.

- 82 -
We note that the systematic evaluation of alternative
enlisted force structures recommended here would also require
developmental work. Current planning techniques would need
extension to facilitate comparisons of force alternatives by exa-
mining their costliness and even their achievability. Personnel
force structures may be shaped by altering promotion and upgrade
policies, separation practices, grade ratios, compensation rates,
eligibility requirements, etc., and it is important in planning
practice to be able to estimate the costs and behavioral effects
of such changes. We recommend that efforts be undertaken to
identify and assimilate relevant previous research on these
topics and, if necessary, to extend existing methods so they can
be applied directly in analysis of enlisted force planning alter-
natives.
Adopting these recommended extensions in manpower require-
ments determination and personnel force planning procedures would
undoubtedly involve implementation of some new procedures; e.g.,kIadditional methods of data collection, different formats for
representing manpower standards, and revised force planning
models. Related processes such as program evaluation and author-
ization allocation also might be affected significantly. Hence
we recommend, in addition to the methodological research proposed
above, that special attention be paid to the relationships exist-
ing between the analytical methods and the organizations which
use them and/or their results. Care must be taken to understand
the decisions made in those organizations, who makes them, when,
using what information, etc. Besides laying groundwork to facil-

-83-
itate eventual implementation of revised methods of analysis and
4ensuring that the methods themselves are designed for practical
use, such research is likely to be valuable in its own right.
For example it might reveal organizational inconsistencies or
problems in communication, decision scheduling, and/or informa-
tion systems. Identification and correction of such problems can
improve the manpower, personnel, and training system's operation
using current methods and ease the solution of problems which
would be encountered in developing, evaluating, and eventually
employing the extended analytical methods.
Finally, we recommend that the methodological extensions be
undertaken in a "pilot study" fashion; that is, using selected
Air Force functional areas as prototype work centers. These work
centers would provide the realistic environment needed for the
development and early testing of analytical concepts and methods.
.......................... ............ •. .
Ie4.j

- 84 -
Appendix A
AUTHORIZATION/ASSIGNENT SUBSYSTEM
EVALUATION DATA
The data used in analyzing the authorization/assignment pro-
cess include training times, first-term/career ratios, and
authorization and assignment figures (projected and actual) by
AFSC. Data analysis was primarily based upon the authorization
and assignment information. This information was collected from
records maintained by the (then) Military Personnel Center (MPC),
Airman Assignments Branch, Randolph AFB, Texas. The information
was presented in the format shown in Figure A.l. For each AFSC,
MPC tracks actual authorizations (derived from the "7102 File")
as well as the six-month projections, and it also tracks actual
and projected assignments (the actuals represent duty assign-
ments). The records are kept by month and were available from
January 1974 through May 1977. This information was coded into a
computer format compatible with SPSS.[1]
Some of the MPC data were incomplete in that several months
(and in a few cases years) of authorization and/or assignment
statistics were missing. Thus, it became necessary to eliminate
several AFSCs from the data analysis. Our sample contains 199
out of a total population of 380 AFSCs. These accounted for more
than 75 percent of the total authorizations (based upon the
authorization level in May 1977, the latest date of data availa-
bility when the sample was collected). This sample bias towards
[11 Statistical Package for the Social Sciences.

-85-
AFSC 511 X2 TITLE Systemn Analyst TYPE Lat IMB 140...
SCALE
Actual assgnment~- - - - -
00
AS GD I tl 2271221220 220 220220 IN110 111187 1851871179 1,615n16M
o Si U0S7 8 UNU 01 1 12U 3 7 771 78 7777
CTU AS GD 260 246 239 238 236 I36 32052M19S6 1961961 193100197 184 I1812 179176M173 171 603
L % 03 493 9569511;95 9492 901921a Ur 6103109 0 lol Solg 9968 7nat
LMONTH IJ'41_I PM IAIMJ J A So0l I D IJlI j[ '
Fig. A.1 -Example of a Wecialtys histoical authorization -aulgnment date

-86-
large specialties was compensated for by weighting the sample to
make it congruent to the total data set.
AFSCs were weighted as follows:
Size of AFSC(Authorizations) Weight Percent
less than 250 2.84 46.4,%250 to 1,000 1.25 20.4%1,001 to 2,000 1.03 16.8%greater than 2,000 1.00 16.3%
100.0%.
This distribution was derived by comparing the frequency distri-
bution of the entire sample (380 AFSCs) with the distribution of
the subsample (199 AFSCs) and calculating a relative weight.
Each AFSC's size was determined using its authorizations in May
1977 or using the authorizations of the most recent month for
which data were not missing.[1]
(11 USAF Formal Schools Catalog, AFM 50-S, Volume II, Sep-tember 1976. Eleven of the sample AFSCs were found to bedirect-duty assignments, thus requiring no formal training.

- 87 -
Appendix B
CONCENTRATION OF AUTHORIZATION/ASSIGNMEN IMBALANCES
To examine the degree to which the over-and-under-
assignments are concentrated in certain AFSCs, we have considered
the proportions of our sample exhibiting various percentages of
imbalance between authorizations and assignments. Figure B-1
shows that as the degree of imbalance increases, the proportion
of observations exhibiting such imbalance decreases rapidly. For
example, 37.5 percent (23.4 percent) of the monthly observations
represented assignment excesses (shortages) of at least 5 per-
cent, while only 7.1 percent (2.1 percent) of the observations
showed excesses (shortages) of at least 20 percent. We have
elected to define significant imbalances as those of at least 10
percent.
- t ....
i
* I

-88-
70
One AFSC. one month -One obsurveton
50-
40 -
TOWi
0-
8 U~Sortags
20--
..................
'0
0 10% 20% 30% 40% %or mWo or more or mores or more or more
Degre of ImbelencI peentae devietion of aulnwmu from euthoelzetions)
Fig. B-1 -Percentages of the sample exhibiting specified amnountsof authorization-umdgniment imbalance

- 89 -
Appendix C
MONTHLY IMBALaNCES OF AT LEAST 10%
Figure C-1 depicts the proportion of each month's observa-
tions exhibiting assignment excesses and shortages of at least 10
percent.[1] Apparently there is considerably more variation in
the percentage exhibiting excess than in the percentage exhibit-
ing shortages.[2J Indeed, although the regression-determined
trend lines for both kinds of imbalance are depicted in the fig-
ure, only the trend line for shortages represents a statistically
significant change over the 41-month period. Specifically, we
can estimate an average monthly decrease of about 0.08 percent in
the percentage of AFSCs exhibiting shortages of at least 10 per-
cent. Technically, we can reject the hypothesis of there being
no significant change at the 95 percent confidence level.
This amounts to an estimated reduction of almost 3.3 percent in
the proportion of AFSCs showing significant shortages over the
nearly three and one-half years covered by the data (a change
from 12.9 percent to 9.6 percent). The text's Table 2 displays
the mild smoothing effect introduced by using six-month aggrega-
[1) Our data base did not contain both authorization andassignment quantities for all forty-one months for every AFSC.Either one or both of these quantities was missing for about 15percent of the weighted sample; thus different numbers of AFSCsmay be represented each month.
[2J Cyclic patterns can be discerned in the overmanned AFSCpercentages. These are considered later in a discussion ofimbalance causes.
* 1t

-90 rtions.[3] of monthly data; the table can be interpreted much the
same as Figure C-1.
40
U Excesses
SSortages
3 o
I
10
Jan. July Jan. July Jan. July Jan. July1974 1975 1976 1977
Month of obemation
Fig. C-I - Fluctuations in the percentages of AFSCs exhibiting10% assignment imbalances
[1) Obtained by determining average authorization andassignment levels for each AFSC and for each semiannual period.

- 91 -
Appendix D
CHARACTERISTICS OF CHRONICALLY IMBALANCED AFSCs
We have examined several hypotheses regarding the AFSCs
exhibiting chronic and non-chronic imbalances. Tables D-1 and
D-2 present relevant summary statistics.[1] Table D-1 contains
information relevant to our a priori expectations regarding the
size, turnover, and training time. We observe that chronic AFSCs
did tend to be smaller than others, but that higher turnover and
longer training times did not characterize chronic AFSCs (except
that average training time for chronically overmanned AFSCs was
significantly longer, statistically, than for non-chronic AFSCs.)
Table D-2 displays information relevant to our notions about
changing authorizations. We observe that chronically imbalanced
AFSCs did experience relatively more authorization fluctuation
than others. Specifically, the variation in authorizations for
chronic shortage AFSCs was about 50 percent greater that that for
non-chronic AFSCs. The variation for chronic excess AFSCs exhi-
bited even more marked variation: about 170 percent greater than
for non-chronic AFSCs. All these variations are considerably
reduced, however, if we remove the "predictable" variation due to
continuing trends in AFSC size
[1] Note that the "chronically unstable" AFSCs (i.e, thosewhose significant imbalances are equally divided between shortageand excess situations) are not represented in these calculations.The small number of such AFSCs and special aspects of theirmanagement and available data led us to omit them.

-92-
Table D-1CHARACTERISTICS OF AFSCs BY CHRONIC CATEGORY
Category
Chronic Chronic NonShortage Excess Chronic
Percent of AFSCs 6.5 16.6 73.0Percent of Authorizations 2.0 9.5 87.8Average Size of AFSCs* 426 724 1707Average Percent First Term 40 52 44Average Training Time (In Weeks) 9 14 13
*The average number of authorizations per AFSC
Table D-2VARIATION IN AUTHORIZATIONS OF AFSCs BY CHRONIC CATEGORY
Category
Chronic Chronic NonShortage Excess Chronic
Total Variation Within AFSCs* 13.9 25.1 9.2Trend for Category 0.2 -0.8 -0.3Variation Due to Trend 6.1 14.9 3.3Variation about Trend 7.8 10.2 5.9
(Total variation less variationdue to trend)
------------------------------------------------------------------------
*This is the coefficient of variation in percentage terms (simply thestandard deviation divied by the mean, times 100--averaged over allAFSCs in the category.)
changes. Note that chronic shortage AFSCs exhibit an average
monthly size increase of about 0.2 percent. Corresponding fig-
ures for chronic excess and non-chronic AFSCs are 0.8 percent and
0.3 percent decreases respectively. These trends account for 44
percent, 59 percent, and 36 percent of the authorization varia-
tion in the chronic shortage, chronic excess, and non-chronic
categories, respectively. This leaves variations (unexplained by
linear trends) for the chronic shortage and chronic excess

1 -93.
groups, respectively, which are 32 percent and 73 percent greater
than for the non-chronic group.

-94 1Appendix E
CAUSES OF CHRONIC IMBALANCES
The explanatory nature of several of the characteristics
noted in the text and in Appendix D is fairly straightforward.
For example, electronics and aircraft/systems maintenance speci-
alties, because of their direct association with the USAF's rai-
son d'etre, have the highest manning priorities and hence are
most subject to personnel management "overkill" or overmanning.
In a related vein, recall chat AFSCs with chronic assignment
excesses tended to have longer training times than others. These
findings suggest that the personnel management system may be act-
ing conservatively with respect to mission-critical and long-
training-time AFSCs. That is, management may be ensuring ade-
quate manpower resources in these AFSCs through extra attention
to filling recruiting and training pipelines.1 1] Medical special-
ties, on the other hand, may be victims of the highly competitive
civilian sector, which offers extremely attractive opportunity to
trained and experienced personnel. Thus, these may be AFSCs
which are already receiving special management attention but
whose chronic shortages persist because of external pressures.
Our primary intent in this Appendix is to analyze the quan-
titative characteristics of chronically imbalanced AFSCs previ-
ously identified: small size, significant size trends, and
(11 Of course a complementary explanation is that theseAFSCs may constitute more attractive career areas and henceexperience little difficulty in accessing and retaining adequatenumbers of people.
i: ...

- 95 -
relatively large variations in authorization levels. Because
authorization trends and variations are integrally related, they
are discussed first. Manpower demand and supply projection
errors are the subject of this appendix's second part. Such
errors clearly can influence authorization/assignment imbalances,
and, indeed, supply projection errors are likely to be relatively
larger for smaller AFSCs.
AUTHORIZATION LEVEL VARIATIONS
A closer examination of the trends and variations of AFSC
authorization levels reveals that the chronic and non-chronic
AFSC categories differed in these characteristics even more
markedly than indicated in Appendix D.
Trends
Table E-1 summarizes the distribution of AFSCs among four
categories of growth rates and the three categories of
authorization/assignment balance.[l] We observe that the
fastest-growing and fastest-shrinking AFSCs exhibited chronic
imbalances much more frequently (Table E-la), and they contri-
buted the largest amounts to the chronic categories (Table E-Ib).
For example, nearly half of the fastest-growing AFSCs experienced
[1] Note that the total enlisted force size was declining byan average of about 0.2 percent per month during the periodcovered by the data. Thus -0.2 percent is chosen as the centralpoint for dividing AFSC growth rates into categories. We desig-nate AFSCs with average monthly growth rates outside the -0.6 to0.2 percent range as being either fastest-growing or fastest-shrinking, depending, of course, on whether their growth ratesare above or below this range--i.e., above 0.2 percent or below-0.6 percent respectively.

- 96 -
chronic imbalances (and somewhat surprisingly, more than half of
those exhibited chronic excesses). Almost half (48 percent) of
the chronically overmanned AFSCs, however, were "fast shrinkers,"
and nearly as large a proportion (41 percent) of the chronically
undermanned AFSCs were "fast growers."

- 97 -
Table E-1 (a)
DISTRIBUTION OF BALANCE CATEGORIES AMONG GROWTH RATE CATEGORIES
Monthly Growth % of . of Group in Each Balance Category
Rate AFSCs Chronic Excess Non-Chronic ChronicShortage
Less than -0.6% 27 34 61 4-0.6% to -0.2% 35 13 81 7-0.2% to +0.2% 25 9 89 2More than +0.2% 13 24 56 21-------- i---i-i--l-llili--lill----llli-----i-liil------iil--i--i-----
Overall 100 19 75 7
Table E-1 (b)
DISTRIBUTION OF GROWTH RATE CATEGORIES AMONG BALANCE CATEGORIES
% of Group in Each Growth Rate Category
Balance % of Less than -0.6% to -0.2% to More thanCategory AFSCs -0.6% -0.2% +0.2% +0.2%
Chronic Excess 19 48 24 12 16Non-Chronic 75 22 37 31 10Chronic Shortage 7 18 35 6 41
Overall 100 27 35 25 13
The causative nature of these findings, although clearly not
inviolate, is apparent: it is more difficult to garner adequate
manpower supplies for specialties which grow more rapidly, and it
is more difficult to trim manpower supplies for AFSCs which
shrink most rapidly. Further insight is gained by examining
Table E-2, exhibiting results of simple linear regressions of

-98-
assignment levels against authorization levels.[1 The first two
columns of the table indicate, respectively, that assignment and
authorization levels were much more highly correlated for chroni-
cally imbalanced AFSCs and that the relationship was more nearly
one-to-one for such AFSCs. The table's "elasticity" column
represents the average percentage change in assignments accom-
panying a 1 percent change in authorizations. For example, a 1.0
percent change in authorizations for a chronically overmanned
AFSC was matched, on the average, by an assignment change of 0.9
percent. Again, we find better results for the chronic AFSCs:
assignment level changes more closely matched authorization level
changes--at least in terms of the linear relationship between the
two levels.
[1] All regression results displayed in this paper are basedon the simple model y(t) = a + bx(t) + cz, where z represents theAFSC's average size (authorizations) over all forty-one months,x(t) is an "independent" characteristic of the AFSC during timeperiod t (in this case, for example, x(4) represents the AFSC'saverage authorization level during the fourth semi-annualperiod), and y(t) is a "dependent" characteristic during timeperiod t (in this case y(4) is the AFSC's average assignmentlevel during the fourth semi-annual period). Of course, a, b,and c are the regression coefficients. Experimentation with anumber of other regression model specifications yields entirelyconsistent results, so we discuss this simple linear form becauseits interpretation is more direct.
I.:

-99 -
Table E-2
SUMMARY OF LINEAR RELATIONSHIPS BETWEEN ASSIGNMENT LEVELS AND
AUTHORIZATION LEVELS
Balance Correlation Slope ofCategory Coefficient Regression Elasticity
Line
Chronic Excess .91 1.02 .90Non-Chronic .60 .73 .71Chronic Shortage .85 .86 1.00
Overall .66 .80 .78
Such results suggest two possible underlying causes of
chronic imbalances: (1) intentional maintenance of imbalances
for certain AFSCs and (2) occasional short periods of rapid
authorization change (causing sudden significant imbalance
between an AFSC's assignments and authorizations) followed by
periods in which assignment levels parallel authorization levels
but the degree of imbalance persists. The first possibility
seems plausible in view of the apparent prevalence of more
mission-critical and longer-training time AFSCs among the chroni-
cally overmanned specialties. The next section's analysis of
authorization level variations casts light on the second possi-
bility.

- 100 -
Variations About Trends
Table E-3 summarizes the distribution of AFSCs among the
categories of balance according to the degree of variation of
authorization levels about their trend lines. It can be argued
that the linear trends are detectable, statistically, and hence
this sort of "steady" change in an AFSC's size is predictable.
The variation about these trends, then, measures the extent to
which authorization level fluctuations are unexplained by these
smooth (indeed linear) trends.[1] The data in Table E-3(a) indi-
cate that AFSCs with higher degrees of variation more often
experienced chronic imbalances. (Also, the greater the varia-
tion, the more likely that an imbalance reflected shortages.)
Table E-3(b) illustrates in more detail the greater
authorization-level variability among chronically imbalanced
AFSCs. Note that 30 percent and 50 percent of the chronic excess
and chronic shortage AFSCs, respectively, experienced variations
about trends of at least 4 percent. This compares to only 22
percent of non-chronic AFSCs.
Table E-3(a)
DISTRIBUTION OF AFSCs AMONG CATEGORIES OF VARIATIONABOUT TREND AND AUTHORIZATION-ASSIGNMENT BALANCE
of Variation Group in Each Balance CategoryVariation -----------------------------------------------
About Chronic Non ChronicTrend Excess Chronic Shortage Total
0-2% 16 79 5 1002-4% 20 76 4 1004-6% 24 64 12 100Over 6% 21 64 15 100
[1] Of course, authorization levels may be changed intentionally innonlinear ways. For example, new programs may require accelerated andthen decelerated growth rates for certain AFSCS, and equipment phase-outsmay cause manpower reductions that are not straight-line.
.9

- 101 -
Table E-3(b)SUMMARY OF LINEAR RELATIONSHIPS BETWEEN ACTUALAUTHORIZATION LEVELS AND SIX MONTH PROJECTIONS
% of Balance Group in
Variation-About-Trend Category of:BalanceCategory 0-2% 2-4% 4-6% Over 6% Total
Chronic Excess 41 29 12 18 100Non-Chronic 51 28 8 14 100Chronic Shortage 33 17 17 33 100
Overall 48 27 10 16 100-------------------------------------------------
il--------
As noted previously, linear trends in authorization levels
explain relatively more of the total variation for the chronic
AFSCs than for the non-chronic AFSCs. Such "steady" trends can
be recognized and taken into account in the process of projecting
manpower requirements. Such trends do not lend substantial sup-
port to the common complaint of "wildly" fluctuating authoriza-
tions. But the fact that considerably larger variations remain
when the effects of linear authorization trends are removed does
support this contention. Note, for example, that only about 20
percent of the AESCs having variations about trend of less than 2
percent were chronically imbalanced, while almost 40 percent of
those with such variations over 4 percent were chronically imbal-
anced. Thus, the difficulties that authorization level fluctua-
tions posed (for the recruiting/training/assignment portion of
the system) apparently were not coped with adequately.
In summary of authorization level behavior, we note that
both trends and variations about trends were larger for chroni-
cally imbalanced AFSCs. Indications (in terms of higher linear
correlations, regression slopes, and elasticities) are, however,

- 102-
that assignment levels tended to parallel authorization levels
better for chronic AFSCs than for others. Thus, apparently, sud-
den changes in authorization levels tended to introduce signifi-
cant assignment-authorization imbalances. For those AFSCs in
which such imbalances were not corrected quickly, assignment lev-
els tended to "follow" authorization levels with persistent pro-
portional imbalances. Such results should not be surprising,
however, especially in view of pressures to maintain stability in
the "input" (i.e., recruiting, training, and crosstraining) sys-
tem.
PROJECTION ERRORS
The realization that large portions of the variation in
authorization levels are due to trends leads us to consider the
accuracy of authorization level predictions. Conceptually, we
can consider predicted authorization levels as manpower demand
projections. If these demand projections are treated as assign-
ment targets, any inherent inaccuracies clearly can contribute to
imbalances between authorizations and assignments. Correspond-
ingly, inaccuracies in manpower supply projections--i.e., predic-
tions of the number of people available at some future time
point--can also contribute to existence of imbalances. In this
section we very briefly review the methods currently used for
demand and supply projections and examine certain quantitative
aspects of the results and/or methods.

- 103-
Demand Projections
As indicated in Section II, actual authorizations are pro-
ducts of the authorization allocation process. This process
reconciles "pure" manpower requirements (requirements that are
developed without budget constraints) and budgeted or funded man-
power levels. Typically, command manpower requirements projec-
tions are available earlier than accurate manpower budget esti-
mates. Consequently, early demand projections primarily reflect
expected manpower needs, "pure" in the sense of being unres-
tricted by budget limitations. These expected needs are compiled
for the respective bases and commands using management engineer-
ing guidelines (engineered standards, statistical standards, and
guides) and projected workloads (based on planning documents
promulgated at higher DoD and USAF levels). Because of the
nature of the authorization allocation process--e.g., budgeted
authorizations (and, later, even personnel assignments) are fre-
quently distributed in direct proportion to estimated
requirements--there are implicit incentives for base and command
managers to overstate manpower requirement estimates. As the
point of actual authorization level specification approaches,
however, budget limitations exert increasing pressure for down-
ward revision of manpower demand projections.
Demand projections are made three, six, nine, and twelve
months in advance of actual authorization specification. For
illustrative purposes, and because they are most used in antici-
pating actual total and trained manpower requirements, we have
examined the six-month demand projections statistically. Table

-104-
E-4 displays the results of simple linear regressions of actual
authorization levels on projected levels; it indicates the extent
of agreement between the two. We note that: (1) actual authori-
zations were predicted more consistently for chronically imbal-
anced AFSCs than for others (higher correlation coefficients),
(2) demand projections were consistently higher than correspond-
ing actual authorizations (slopes of regression lines all less
than 1.0), but the overestimation was least for the chronically
undermanned (shortage) AFSCs, and (3) actual authorizations were
more responsive to changes in projections for the chronically
imbalanced AFSCs (higher elasticities for the chronic
categories).

-105-
Table E-4
Balance Correlation Slope ofCategory Coefficient Regression Elasticity
Chronic Excess .87 .796 .818Non-Chronic .58 .353 .355Chronic Shortage .96 .959 .959
Overall .63 .405 .409
In total, these findings indicate that demand projections
tended to be better for the chronically imbalanced AFSCs than for
non-chronic AFSCs. Apparently the demand projection "system"
recognizes the existence of "chronic" AFSCs and gives special
attention to their manpower needs. This suggests that a mechan-
ism exists in the authorization/assignment system which identi-
fies problem AFSCs and ferrets out relatively more of the demand
projection bias introduced by (1) early separation of "pure" man-
power requirements and budget level projections and (2) tacit
incentives for manpower-using organizations to overestimate man-
power needs.
hL...'4

-106-
To examine this issue more closely, consider Table E-5.
This table relates actual AFSC assignment levels to six-month
authorization projections. The results are again favorable for
the chronically imbalanced AFSCs: (1) assignment levels were
more highly correlated with demand projections, (2) assignment
levels were consistently lower than authorization projections
(the slopes are less than 1.0) but less so for the chronic AFSCs,
and (3) changes in assignment levels were more responsive to
changes in demand projections. We conclude that the
authorization/assignment system recognizes the existence of
chronically imbalanced AFSCs, takes the manpower demand projec-
tions for these AFSCs more seriously, and manages assignment lev-
els for such AFSCs so that they more nearly parallel demand pro-
jections.
These findings are also manifest in Table E-1; recall, for
example, that actual asignment levels and actual authorizations
were more highly correlated for chronic AFSCs. Hence, as a gen-
eral statement, we may conclude that the authorization/assignment
subsystem, although it recognized chronic AFSCs and reacted
appropriately, simply fell behind some of those AFSCs' authoriza-
tion targets and had difficulty making up the discrepancies.

- 107 -
Table E-5SUMMARY OF LINEAR RELATIONSHIPS BENEEN ACTUAL ASSIGNMENT
LEVELS AND SIX-HONTH AUTHORIZATION PROJECTIONS
Balance Correlation Slope ofCategory Coefficient Regression Elasticity
Chronic Excess .92 .936 .851Non-Chronic .41 .303 .298Chronic Shortage .86 .869 1.000
Overall .86 .383 .374
Supply Projections
One might suspect that predictions of available manpower
supply--i.e., the number of people available within an AFSC at
some future time point--might be made, arbitrarily, to agree with
predictions of manpower demand. Of course such "fudging" would
serve no useful purpose, and indeed it apparently does not occur.
The Air Force employs quite sophisticated supply projection
methods, for example, in its Airman Skill Force Program and its
Trained Personnel Requirements Program,[lJ designed to project
airman losses, renlistments, etc., even on a monthly basis, for
individual skill specialties, and for up to four years into the
future. These refined projections form the basis for personnel
policy decisions regarding recruitment, training, and retraining
quotas, reenlistment bonuses, proficiency pay, etc. Projections
are based on historical retention rates and current personnel
resources in specific categories.
11 See USAF Personnel Plan, Vol. VI, "Personnel ProgramingSystem," Section 2.
[ Mk Xf 'A

eT
- 108 -
Unfortunately, such refined personnel supply projections are
not a part of our data base. The projections in the USAF Mili-
tary Personnel Center (NPC) records (see Appendix A) are for
entire AFSCs and apparently are very crude. Specifically, these
estimates are based on assumptions that (1) all career force per-
sonnel in an AFSC will be retained and (2) all first-term person-
nel in the AFSC will be lost. Such estimates could hardly be
expected to predict actual manpower supplies accurately. (And,
as we have verified statistically, they do not.) Fortunately,
however, these particular projections seem to be used for little
more than "completing" a large data file.
Although we lack specific data for use in evaluating man-
power supply projections, we can point out one aspect of the
estimation process which may inhibit achievement of
authorization/assignment balances. This aspect is the apparent
neglect of simple random variation in human behavior. To illus-
trate, consider a cohort of 100 individuals (similar in terms of
specialty, grade, age, sex, etc.) facing a decision of whether to
leave or stay in the service. Suppose history indicates that an
average 70 percent of such individuals elect to stay in the ser-
vice. Only rarely will exactly 70 people in such a cohort elect
to stay in service in any given year. Indeed, if we assume that
each individual acts independently and makes the stay-in decision
with a 70 percent probability, it is easy to verify that the
chances are greater than one in six that the number who actually
stay in differs from 70 by at least 10 percent. If the cohort
contains only 50 people, the chance of actual retention differing

- 109 -
from 35 (i.e., 70 percent of 50) by at least 10 percent increases
to more than one in five. And if the cohort contains only 20
people, the chance of a projection error of at least 10 percent
becomes almost one in two; that is, on average, a retention esti-
mate of 14 would be off by at least 10 percent about half the
time.l Considering the relatively small personnel groupings for
which distinct retention rates are estimated,[2J it is safe to
assume that personnel supply estimates are frequently based on
cohorts of approximately these sizes. Hence, simple point esti-
mates of subgroup retention quantities should be expected, fairly
often, to err substantially.
Figure E-1 illustrates the prevalence of smaller AFSCs among
the chronically imbalanced. For example, compared to the non-
chronic category, the two chronic categories contained approxi-
mately twice as large a proportion of AFSCs with fewer than 251
authorizations. We note further that 36 percent of the AFSCs
with average authorizations under 500 appeared in the chronic
categories as compared to only 18 percent for those with authori-
zations over 500. Generally, the smaller the AFSC, the smaller
[11 It is interesting to observe that these error probabili-ties increase substantially if the 70 percent retention rate,say, is based on a "short" history--i.e., on a relatively smallnumber of observed stay-leave decisions. The error probabilitiesalso increase rapidly as the retention rate itself diminishes:for example, the chances of at least a 10 percent projectionerror with a 30 percent retention rate are 59 percent, 65 per-cent, and 81 percent respectively, for cohorts of 100, 50, and 20individuals.
121 See, for example, John D. Maybee, "Forecasting AirmenLosses and Reenlistments -- the Methodology and its Applica-tions," USAF Personnel Research and Analysis Division, the Pants-Son, May 1972.

-110-
are its constituent cohorts, and the more likely become signifi-
cant retention estimate errors.
Our initial empirical investigations indicate, however, that
the likelihood of significant error in predicting an AFSC's total
short-term retention quantity is fairly low. This is because
relatively few people in an AFSC pass a point of substantial
attrition during each short-term planning period. Typically,
only about 12 percent to 18 percent of enlisted personnel are in
their fourth or twentieth years of service, the years with lowest
retention rates and hence primary potential for contributing to
supply projection errors. Of course different AFSCs have dif-
ferent distributions of personnel among retention categories
(such as years of service); smaller AFSCs with relatively larger
fractions of individuals at stay-leave decision points are sub-
ject to larger likelihoods of significant retention projection
errors. Our data base, unfortunately, does not include detailed
AFSC historical profiles or retention rate estimates, so we are
unable to assess the extent of such projection error and its
causative impact on authorization/assignment imbalances. Our
intent here is simply to emphasize the existence of this kind of
supply prediction error and to note that it may account at least
partially for the predominance of smaller AFSCs among the chroni-
cally imbalanced.
We must note that retention estimates are only one part of
an AFSC's manpower supply projections. New personnel are con-
tinually being recruited and trained, in addition to crosstrain-
ing of individuals from other skill classifications. Typically,

c 41% f
Notchronic AS ~
261 -t1.000
ChronicC3Oe ,0thortag33
0 20 40 60 so 100Pocentgmas of AFSCs
*Ave. monthly authorizationsJan. '74-Man '77
Fig. E- - Distribution of AFSC sizes within categories of im~belance

-112-
from 10 percent to 20 percent of the enlisted force is first-year
personnel. Recruitment and successful training of this signifi-
cant manpower component are also subject to some random varia-
tion, and errors in projecting available supplies of new person-
nel are unavoidable. In addition, since requirements quotas for
new personnel are based on retention quantity predictions (and
projected workloads, of course), occasional shortfalls in acces-
sions might coincide with periods of lower-than-expected reten-
tion, resulting in an AFSC's assignment level being considerably
below its authorization level. Efforts to maintain stable induc-
tion and training rates, then, just as noted previously in rela-
tion to imbalances caused by sudden authorization level changes,
tend to permit only rather slow correction of such imbalances.
Finally, we note the significant seasonality of manpower
supply and its relationship to authorization/assignment imbal-
ances. Figure E-2 depicts the percentage of AFSCs experiencing
significant (at least 10 percent), imbalances in each of the
forty-one months (i.e., the total of the excess and shortage per-
centages in Figure 2). The period of peak imbalance apparently
is late summer and early fall each year. This is also the time
when overmanning situations are most frequent. Traditionally,
early summer (following school graduations) has been a period of
peak enlistment, and it is not surprising to find overmanning
situations occurring several weeks to a few months later. The
time lag, of course, is due to the period of training between
enlistment and assignment.
. .. ..... . - *.. - -

-113-
40-
5-
- V.
Ja.l a.4uyJn Jl a. Z1I417 9617*1' nflan Imblne etkna m fa o 0
Fi.E2-Th ylcpatr3fsinfcn5iblne

- 114 -
Appendix F
EXCERPT FROM AFR 39-1 [1]REGARDING CLASSIFICATION CHANGES
Requesting New or Revising Existing AFSs:
A. It is essential that the classification system accuratelyreflect technical, operational, and procedural developmentsin the Air Force. Review of skill requirements andclassification by individual commands and Hq. USAF Air Staffofficers is a continuing responsibility. As existingclassification becomes obsolete or developments occur whichrequire new or revised Air Force-wide skill identification,Hq. USAF DCS/Manpower and Personnel, should be advised.Modification of existing classification has a significanteffect on all facets of Personnel Management. Therefore,recommended changes must reflect understanding of the PersonnelClassification Concepts set forth in AFR 35-1, and providesufficient data for analysis by Hq. USAF.
B. Submit recommended changes, additions, or deletions to theexisting classification provided in this regulation throughchannels to HQ AFMPC/MPCRPQ, Randolph AFB TX 78148.
C. Recommendations for changes to AFSCs, prefixes, or suffixesmust include the following essential information:
1. Brief description of proposed change. Show itsrelationship to the existing classification structure,consistent with personnel classification concepts of AFR 35-1.
2. Rationale for change. Include reasons why existingclassification is inadequate.
3. Description of duties and tasks:
a. Describe duties and tasks; include details of systems,equipment, special tools, or materials involved.
b. Include details of knowledge, education, and experiencerequired to perform duties and tasks.
4. Evaluation of training requirements:
[1J Effective 15 October 1978 AFR 39-1(C4) 15 September1978.

- 115 -
a. Include evaluation of existing courses, need for newcourses,and estimated on-the-job or formal training time.
b. Categorize training as "desirable" in all cases exceptwhere OJT is judged impossible or permanently uneconomicaland operationally unfeasible.
5. Detailed summary of personnel and/or manpower impacts:
a. Estimate the number and organizational level ofpositions which would be identified by the proposedclassification.
b. Estimate the number, location, and AFSC of manpowerpositions which would be deleted and/or added.
c. List AFSCs of personnel currently performing dutiesincluded in proposed classification, and estimate numberby AFSC that would convert to the new AFSC, if established.
6. Recommendation on desirability of conducting a specialty surveyunder AFR 35-2 for proposed classification.
D. Recommended changes, deletions, or additions to SEIs mustcontain the following information:
1. Brief description of proposed change.
2. Brief rationale for change.
3. Requests for new SEIs should contain:
a. Details as to length of experience and training oreducation essential to qualify for designation of theSEI. Include details of when the SEI should beconsidered for withdrawal.
b. Career fields and AF specialties to be authorizedfor use with the SEI, and an estimate of the numberof personnel to be identified.
4. Recommendations concerning existing SEIs must refer to thepresent SEI code number. These codes appear inAFR 39-1 and AFP 300-4.
NOTE: Recommended changes to this regulation must arrive atHQ AFMPC/MPCRPQ, Randolph AFB TX 78148, per the followingtime schedule:
1. Not later than 28 February for the change to becomeeffective the following October.
2. Not later than 31 August for the change to becomeeffective the following April.

-116-
BY ORDER OF THE SECRETARY OF THE AIR FORCEOFFICIAL
JAMES J. SHEPARD, Colonel, USAFDirector of Administration
DAVID C. JONES, General, USAFChief of Staff

-117-
REFERENCES
1. Air ForceRegulation 25-5, Manageen Engineering Procedures,Department of the Air Force, Headquarters USAF,November 1977.
2. Air ForceUSAF Formal Schools Catalogue,AFM-505, Vol. II, September 1976.
3. Air Force Personnel Management Engineering Team,Final Report, USAF Engineered Manpower Standards:Chief, Personnel Division and CBPO, FC 16XX,21 September 1976.
4. Albrecht, M. J.,An Analysis of Labor Substitution in the MilitaryEnvironment: Implications for Enlisted Force Management,The Rand Corporation, R-2330-MRAL, November 1979.
5. Armstrong, B. A., and S. C. Moore,Air Force Manpower, Personnel, and Training System:Volume I--Roles and Interactions,The Rand Corporation, R-2429-AF, May 1980.
6. Grinold, R. C., and K. T. Marshall,Manpower Planning Models,North Holland Publishing Company, New York, 1977.
7. Jaquette, D. L., and G. R. Nelson,The Implications of Manpower Suppl and Productivity forthe fa and Composition of the Military Force:An Optimization Model,The Rand Corporation, R-1451-ARPA, July 1974.
8. Joint Chiefs of Staff, Annex A, Publication 6,Volume V, Part 2, Chapter 1.
9. Maybes, J. D.,Forecasting Airmen Losses and Reenlistments--the Methodology and its Applications.USAF Personnel Research and Analysis Division,Headquarters, USAF, May 1972.
10. Rice, D. B.,Defense Resource Management Study,U.S. Government Printing Office, February 1979.
-

-118-
11. USAF Personnel Plan,Office, Deputy Chief of Staff,Personnel, Headquarters USAF,September 1976.
12. Westrovich, M. J.,The Airman and Office Skill Projectit Updel,Volume I: Management SummaryUSAF Manpower Research and Analysis Group,Headquarters USAF, June 1973.
4F!