air france alitalia
TRANSCRIPT
www.exanebnpparibas-equities.com
Please refer to important disclosures at the end of this report.
Air France-KLM
Transport / France
Equity Research
Report Stock vs Sector Outperform
Sector vs Market Outperform EPS revisions 03/07 03/08e 03/09e 03/10e Revised 3.03 3.68 4.36 4.46 Previous 3.03 3.68 4.53 5.21 % change - - (4) (14)
Price (19 November 2007) EUR22.9
20 November 2007
Target price EUR40.5 (+77%)
Strong globalisation play
► Network scale offers scope to exploit global growth Air France-KLM, the world�s leading international airline, offers a strong play on globalisation based on increased inter-connectivity between Europe and the emerging economies. It has a unique position among the three network airlines with: 1) a hub at Paris-CDG that has four runways and terminal capacity that will increase significantly by the end of 2008, 2) an aircraft acquisition programme that has already peaked and started to generate strong FCF and 3) a flexible approach to aircraft financing that allows rapid adaptation of capacity at no cost in the event of a downturn in demand.
► Risks of overpaying for weak airlines are overdone Air France-KLM has the potential to lead further industry consolidation, but it is very sensitive to the importance of value creation, in what is now largely a buyers� market. The recent share price weakness partly reflects investors� concerns about the group overpaying in any possible acquisition of Alitalia or Iberia, but we are confident that management will remain disciplined in its 2009/10e target of a post-tax ROCE of 8.5% (6.5% in 2006/07).
► Strong upside, reiterate Outperform stance Reflecting higher fuel cost forecasts, partly offset by firmer prices and a positive earnings impact from the Delta transatlantic JV, we have lowered our 2008/09e and 2009/10e EPS estimates by 4% and 14%, respectively, but remain significantly higher than the consensus. We have cut our DCF/SOTP target price to EUR40.5 (formerly EUR46). The substantial 77% upside to our revised target price underpins our Outperform conviction.
Nick van den BrulNick van den BrulLondon: +44 20 7039 [email protected] Geoff van KlaverenLondon: +44 20 7039 9484
Market cap./Free float (EURbn) 6.7/5.5 EV (EURbn) 14.5 12-month high/low (EUR) 38.3/22.6 Reuters/Bloomberg AIRF.PA/AF FP DJ STOXX50 3,660.0 Risk rating D
Per share data (EUR) 03/07 03/08e 03/09e 03/10e EPS restated 3.03 3.68 4.36 4.46 EPS reported 3.32 4.70 4.24 4.35 EPS (IBES) 3.35 3.45 3.73 3.96 CFPS 9.54 10.41 10.52 10.81 Net dividend 0.48 0.54 0.64 0.74
Stockmarket ratios* 03/07 03/08e 03/09e 03/10e P/E (x) 8.3 6.2 5.3 5.1 P/E rel.DJ STOXX50 (%) 75.1 57.2 51.2 54.5 P/CF (x) 2.6 2.2 2.2 2.1 P/BV (x) 0.9 0.7 0.6 0.6 Net yield (%) 1.9 2.4 2.8 3.2 EV/Sales (x) 0.7 0.6 0.6 0.5 EV/EBITDA (x) 4.2 3.6 3.3 3.1 EV/EBIT (x) 10.1 8.1 6.9 6.3 * Yearly average price for FY ended 03/07
P&L highlights (EURm) 03/07 03/08e 03/09e 03/10e Sales 23,077 24,110 25,403 26,813 Restated EBIT 1,570 1,787 2,082 2,278 Attrib. net profit (adj.) 888 1,078 1,278 1,306
Performance (%) 1w 1m 3m 12m Absolute 1 (12) (17) (26) Rel. Transport 7 (1) (14) (26) Rel. DJ STOXX50 4 (6) (16) (24)
Price relative to DJ STOXX50
2005 2006 200710
15
20
25
30
35
40
Air France-KLMRelative to DJ STOXX50
Source: DATASTREAM Source: Datastream [email protected]
2 Air France-KLM
Contents
Investment case__________________________________________ 3
Valuation upside on DCF/SOTP metrics _______________________ 8
Scale effects/cost cutting support margins ____________________ 12
Delta JV: taking advantage of Open Skies ____________________ 22
Airline acquisitions: risk/return trade-off_______________________ 28
Moving towards the 8.5% ROCE target_______________________ 37
Strong FCF leading to net debt reduction _____________________ 44
Glossary_______________________________________________ 47
Company profile and financial highlights ______________________ 50
3 Air France-KLM
Investment case
A buying opportunity following recent sell-off We reiterate our sector-relative Outperform recommendation on Air France-KLM shares. We have cut our target price to EUR40.5 (from EUR46) to reflect a downward adjustment to our earnings forecasts following a reassessment of future fuel cost trends, partly offset by firmer pricing and a positive earnings contribution from the new transatlantic joint venture with Delta Airlines. However, our revised EUR40.5 target price still implies an upside of 77% for the stock.
Table 1: Summary of revisions to estimates EURm 08/09e 09/10e
Operating profit, previous 1,783 2,158Fuel cost previous 4,780 5,060Fuel cost new 4,860 5,340Difference (80) (280)Contribution from Delta JV 30 44Net changes (50) (236)Operating profit, new 1,733 1,922 Restated EPS new (EUR) 4.36 4.46Restated EPS previous (EUR) 4.53 5.21Change (%) (4) (14)
Note: operating profit shown here is on a reported basis
Source: Exane BNP Paribas estimates
In our view, the drivers of Air France-KLM�s margin and ROCE improvement remain intact. Strong traffic growth, continued long-haul yield improvements and cost cutting (including a further boost under the new �Challenge 10� programme), should all support further margin expansion and a progressive improvement in post-tax ROCE to the group�s target of 8.5% in 2009/10e (6.5% in 2006/07).
Our 2008/09e and 2009/10e estimates are above the consensus. We believe this reflects two factors. Firstly, we believe the investment community has not fully recognised the positive revenue and earnings impact of the transatlantic joint venture between Delta and Air France (and the subsequent KLM/Northwest joint venture on routes to Heathrow, about which we still await an announcement). Secondly, we believe the consensus is too cautious about the growth dynamics of global air traffic and the scope for further margin improvement at Air France-KLM over at least the next three years.
Air France-KLM trades on only 3.3x calendarised 2008e EV/EBITDAR and 7.0x EV/EBIT, compared to the European network airlines� current averages of 4.9x and 10.7x, respectively, and against an average EV/EBITDAR multiple of around 4.6x at the time of the last trough in the cycle in 2003 (which was a severe downturn, involving both the second Gulf war and the spread of the SARS disease).
Our Outperform recommendation on Air France-KLM reflects its exposure to the long-term growth dynamics of air travel and its particularly strong position in serving emerging economies. This is combined with the limited long-haul capacity growth profile of the industry through to 2010, which will keep yields firm.
We believe one of the catalysts for the shares is likely to be the Q2 2007/08 results on 22 November which should confirm these positive factors. In addition, improved visibility on the earnings potential of the Delta joint venture is also likely to provide support for the shares.
4 Air France-KLM
Share price performance In 2006 and H1 07, Air France-KLM outperformed the CAC 40 index by 28.4% and strongly outperformed its benchmark competitors, Lufthansa and British Airways (BA). The main reason for this was Air France-KLM�s significant improvement in earnings and the trend towards higher margins that followed the merger (April 2004) between Air France and KLM, as efficient reorganisation of route networks and greater economies of scale led to improved asset utilisation.
In August 2007, Air France-KLM fell by over 30% in absolute terms and underperformed the CAC 40 index by 7.6%. Despite a recent recovery, the share price remains 72% below its June peak of EUR39.4.
In our view, the current share price assumes a collapse of passenger revenue growth and operating profit in 2008/2009. We have undertaken a worst case sensitivity analysis which assumes that growth in the passenger business falls to 0.4% and costs remain static in that year. As a result, operating profit for 2008/09 would more than halve from an estimated EUR1,733m to EUR727m, representing a 2.98% margin. Air France-KLM believes that with its new operating structure and cost profile, 3% would be the worst-case margin at the bottom of the cycle. Our DCF valuation using this scenario would give a valuation per share of EUR23.91, implying 4% upside to the current share price.
We have identified three reasons for the stock�s relative underperformance after the period of strong outperformance: 1) a perception from the Q1 2007/08 results (for the three months to end-June 2007) that the trend of margin improvement had stalled, 2) concerns that the turbulence in financial markets could herald a downturn in air traffic markets, and 3) speculation that the pending round of further airline consolidation in Europe (involving Alitalia, Iberia, Austrian Airlines, bmi and possibly SAS) could lead to Air France-KLM overpaying for second-tier airline assets in order to gain market share. We believe all these concerns are misconceived.
Margin trend remains positive
The group�s Q1 2007/08 results (announced 9 August) contained two major negative factors; a one-off adverse impact on business class travel reflecting the timing of public holidays in France and a negative impact from the US dollar�s decline against the euro, which had an adverse effect on intercontinental yields (but a positive effect on costs).
However, Air France-KLM confirmed its strong current performance in terms of traffic and yield at the Investor Day at Paris-CDG airport in October. The aberration of Q1 (which was impacted negatively by holidays) has not continued into Q2 and since July, cargo has been on a recovery trend.
The Q2 2007/08 results (to be announced on 22 November) are likely to benefit from the new cost-cutting programme, �Challenge 10�. This had a minimal impact on the Q1 2007/08 results because it had only been launched in May. Recent comments from management suggest that this Challenge 10 programme is likely to have had a positive impact on Q2 2007/08 results.
5 Air France-KLM
Around EUR130m of the EUR560m of targeted cost savings from the new Challenge 10 cost-savings programme for 2007/08 have been achieved. These EUR560m cost savings include EUR35m from marketing costs, EUR150m from purchasing costs, EUR200m in processes and productivity and EUR175m from the fleet modernisation. This programme is expected to achieve total savings of EUR1.4bn over three years.
Furthermore, management confirmed that the 7% post-tax ROCE target (implying a 0.9 percentage point increase in the EBIT margin to 7.4% in 2007/08e) should be easily achieved. The implication is a small increase in our full year 2007/08 estimates, but this is neutralised by the estimated EUR60m EBIT cost of the cabin crew strike at the end of October. Consequently, we leave our 2007/08 EPS forecasts unchanged.
We are confident that the rising trend of EBIT margins should continue in at least 2007/08e, 2008/09e and 2009/10e.
Air traffic still growing, boosted by emerging economies
In our view, Air France-KLM remains one of the best European plays on globalisation, as the leading connector of Europe to the growth economies in Asia, Latin America, Middle East/Africa and Eastern Europe. Our analysis shows that, while US�Europe and domestic US traffic have clearly started to slow, traffic to and from the emerging economies remains very robust. Air France-KLM, as the world�s largest international airline, looks particularly well placed to benefit from the continued growth of the global economy.
Air France-KLM is a well-managed airline with an increasing long-haul orientation and has moved from the number three position in Europe to the clear market leader in both Europe and the international airline business within the space of three years. Much of the reason for this lies in the scale and continuous improvements in the structure of the group�s hub and spoke network.
Air France-KLM has the greatest exposure of all European airlines to the world's growth economies in Asia, Latin America and Middle East/Africa. (These three regions accounted for 48% of passenger revenues in 2006/07). Furthermore, new capacity growth in the next five years is concentrated in these areas so this percentage will increase. The group, therefore, enjoys a growth dynamic which, in our view, will continue to perform strongly despite an anticipated slowdown in the US and European economies. (By contrast, BA is heavily exposed to UK�US traffic which accounts for around 65% of its operating profit. The US domestic air travel market has started to weaken and US airlines are suffering more from higher oil prices as they do not gain from the sharp fall in the US dollar this year. In contrast, the fall in the US dollar is helping to contain fuel, depreciation and other costs of European airlines).
We believe the new joint venture agreement with Delta and closer ties with China Southern also offer good long-term growth opportunities for the group and that these have possibly not been fully recognised by the investment community.
6 Air France-KLM
Strict ROCE criteria in any acquisition scenario In our view, industry consolidation will accelerate as Open Skies between Europe and the US starts to put pressure on protected �national� niche operations (for example, Milan�New York), eroding the profitability of those routes. Therefore, we believe the industry is in a process of voluntary consolidation for those smaller airlines which will need to seek the protection of economies of scale, the support of an efficient fuel hedging programme, access to capital for investment and participation in the large corporate account programmes which drive network airlines� profitability. Air France-KLM should benefit significantly from this consolidation process.
Iberia and Alitalia have put themselves up, or been put up, for sale now for almost a year. However, Air France-KLM and Lufthansa, the two most obvious acquirers, have sensibly waited for potentially improved acquisition terms. The conditions have improved and the �speculative� appetite from private equity funds has probably diminished as highly leveraged bids appear less likely in the current market climate. In these circumstances, we believe Air France-KLM is much less likely to overpay for vulnerable operating airline assets, especially as the experience of acquiring KLM (and also Swiss) shows that the balance of advantages in terms of scale and strength of balance sheet is with the acquirer.
The benefits of consolidation are closely linked to improvements in operations, which have a direct impact on asset utilisation and thus on earnings and margins. Linking hub and spoke networks allows airlines to concentrate routes, allowing larger, more efficient aircraft and more frequent services. As occurred following the merger with KLM, the addition of a new spoke to a hub and spoke airline network significantly increases the city-pair combinations served by the network, at minimal additional cost. Thus, while small-scale, standalone airline operations can be unprofitable (such as Alitalia) within the framework of linked hub and spoke networks, they can turn round their fortunes relatively quickly if the network is reconstructed and linked effectively and overlapping costs are eliminated quickly.
Air France-KLM has commented that it is "interested in" Iberia and Alitalia, but as yet there do not appear to be any concrete negotiations. Indeed, it seems more likely that Iberia will be acquired by a Spanish investor group. Furthermore, Air France-KLM�s President and CEO, J-C Spinetta, has consistently stated that no deal would be done with either Alitalia or Iberia which could jeopardise the group�s achievement of its 2009/2010 post-tax ROCE target of 8.5%.
EPS forecasts trimmed reflecting oil price
We have revised our 2008/09e and 2009/10e EPS estimates downwards by 4% and 14%, respectively, to reflect, in part, the group�s revised oil price forecasts. The negative impact of these higher oil price assumptions is partly offset by firmer prices (see below). The new estimates assume structurally higher oil prices because of tight capacity, higher extraction costs and (implicitly) sustained global demand. Our forecasts are based on the group�s assumptions of an average Brent oil price of USD81/bbl for 2007/08, USD88/bbl for 2008/09 and USD84/bbl for 2009/2010.
The group is 78% hedged against the fuel price this year, giving a net price of USD66/bbl, and is 67% hedged next year (2008/09e), giving a USD69/bbl final price.
Incorporating the group�s revised estimates and the impact of the fuel cost hedge, we keep our estimate of hedged fuel costs for Air France-KLM for the current year at EUR4.6bn, but increase our estimates for 2008/09 to EUR4.86bn (+1.7%), for 2009/10 to EUR5.34bn (+5.5%) and for 2010/11 to EUR5.62bn (+7.5%).
7 Air France-KLM
Price component of yield remains firm
Air France-KLM has managed to compensate for fuel price increases with a progressive increase in fuel surcharges on tickets, which reached EUR72 on a long-haul flight for Air France and EUR70 for KLM in early November (following an earlier increase in September). This is because capacity constraints and rising load factors on long-haul routes have given the leading long-haul airlines pricing power which is partly compensating for the sharp rises in oil prices. While there has been a strong increase in short-haul, low-cost capacity this year, capacity remains constrained on long-haul routes. We do not see this easing until 2009 at the earliest.
Yields should continue to be supported by further consolidation (Alitalia, Iberia and closer relationships between members of the three international airline alliances, SkyTeam, Star and oneworld). Air France-KLM�s passenger traffic has been growing at over 5% this year to date, focused on growth areas in the global economy. Capacity is scheduled to increase by 5.2% for the winter season (October�March) and this is focused on destinations in high-growth emerging economies (China, Latin America, Middle East/Africa and Eastern Europe). Additional frequencies to Shanghai and Hong Kong alone will increase capacity on those specific routes by 20% in anticipation of strongly rising demand.
Delta joint venture to boost earnings from 2008/09e
Partly offsetting the impact of the higher fuel price, the group�s transatlantic joint venture with Delta, announced in October, will provide a further boost to earnings. We estimate that the Delta joint venture (which is entirely incremental to earnings for Air France-KLM until 2010/11, when the joint venture�s parameter will be expanded to include existing routes) will add EUR31m to operating earnings in 2008/09 and EUR44m for 2009/10. This has a positive effect on our EPS estimates of EUR0.10 for 2008/09e and EUR0.15 for 2009/10e.
The net effect, taking into consideration a higher fuel cost and a positive contribution from the joint venture, is that our EPS estimates decline by 4% to EUR4.36 for 2008/09e and by 14% to EUR4.46 for 2009/10e. Consolidation and closer cooperation within alliances has a positive net effect that partly compensates for higher oil prices, the remaining unmanageable variables being the movement of the US dollar (a US dollar decline is positive for Air France-KLM�s costs, although it would have a negative impact on the joint venture�s contribution) and the group�s ability to increase fuel surcharges (mainly long-haul passenger airline prices) further. We consider our estimates for the potential benefits of the Delta joint venture, which is the only quantifiable effect of the proposed joint venture initiatives at present as very conservative and see room for upgrades.
8 Air France-KLM
Valuation upside on DCF/SOTP metrics
Our approach to the value of Air France-KLM is to look at comparative and sum-of-the-parts metrics around a core DCF valuation. The DCF method captures both the airline�s cash flow generation and capital expenditure on replacement fleet assets. Based on an average of our DCF and SOTP approaches, we calculate an equity value for Air France-KLM of EUR12,158m, corresponding to EUR40.5 per share. Our DCF approach produces a value of EUR42.1 per share and our sum-of-the-parts model produces a range of EUR38�40 per share with an average of EUR39. Our revised target price of EUR40.5 is based on the average of the DCF and SOTP outcomes.
Air France-KLM�s valuation discount to BA of 27% on calendarised 2008e EV/EBITDAR multiples at current price levels looks unjustified. Air France-KLM�s earnings growth outlook is strongly positive and better than BA�s, with a positive earnings increment from Open Skies (not included in the current guidance) but without the significant risks posed by the sudden impact of new competition for BA at Heathrow, for example.
We are confident in the ability of Air France-KLM�s management to deliver increased earnings growth and higher margins from the implementation of the Challenge 10 cost-cutting programme and the realisation of further synergies from the merger, notably through the introduction of common IT systems. Our valuation takes into account a raised fuel cost assumption (detailed below) and rolls forward our DCF valuation to the end of 2008.
DCF model: EUR42.1 per share
Our DCF valuation is based on our assessment of the network and cost synergies still to be extracted from the merger, along with the ongoing boost to forecast earnings from the Challenge 10 cost-savings programme under way and the positive impact of the Delta joint venture, set against a higher medium-term fuel cost forecast of approximately USD81/bbl Brent equivalent. We set out our key assumptions as follows.
Traffic and yields Our passenger traffic growth assumptions are 6% for 2007/08 and 5% for 2008/09. The main driver is likely to be intercontinental traffic, continuing the trend of recent months. We assume a (post-currency effect) trend in yields (in terms of revenue per RPK) of -0.5% this year, +0.2% for 2008/09eand approximately +0.5% p.a. thereafter.
Oil price and fuel costs We have used higher oil price assumptions as the basis for our post-hedge fuel price estimates for Air France-KLM. Our Oil & Gas team�s current oil price estimates (revised in early October 2007) assume structurally higher oil prices because of tight capacity, higher extraction costs and (implicitly) sustained global demand. Our actual fuel cost estimates are based on the Air France-KLM group�s latest assumptions of an average Brent oil price of USD81/bbl for 2007/08, USD88/bbl for 2008/09, USD84/bbl for 2009/10 and USD82/bbl for 2010/11. Using these revised assumptions, we keep our estimate of hedged fuel costs for the current year at EUR4.6bn but increase our estimates for 2008/09 to EUR4.86bn (+1.7%), for 2009/10 to EUR5.34bn (+5.5%) and for 2010/11 to EUR5.62bn (+7.5%).
9 Air France-KLM
WACC We calculate a WACC of 7.49% (raised from 7.04%). This is based on an equity risk premium of 4.49% (from 3.83%), a risk-free rate of 4.16% (from 4%), a pre-tax cost of debt of 5.16% and a beta of 1.4. Our long-term growth assumption is 1%.
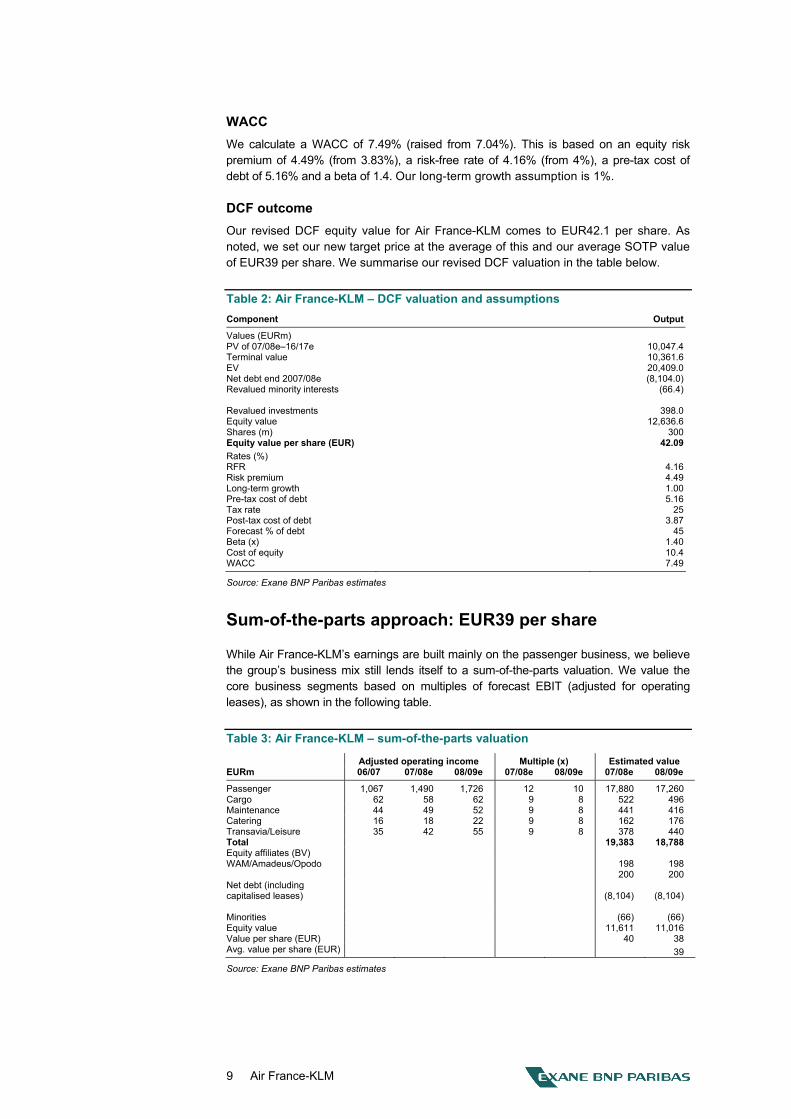
DCF outcome Our revised DCF equity value for Air France-KLM comes to EUR42.1 per share. As noted, we set our new target price at the average of this and our average SOTP value of EUR39 per share. We summarise our revised DCF valuation in the table below.
Table 2: Air France-KLM � DCF valuation and assumptions Component Output
Values (EURm) PV of 07/08e�16/17e 10,047.4Terminal value 10,361.6EV 20,409.0Net debt end 2007/08e (8,104.0)Revalued minority interests (66.4) Revalued investments 398.0Equity value 12,636.6Shares (m) 300Equity value per share (EUR) 42.09Rates (%) RFR 4.16Risk premium 4.49Long-term growth 1.00Pre-tax cost of debt 5.16Tax rate 25Post-tax cost of debt 3.87Forecast % of debt 45Beta (x) 1.40Cost of equity 10.4WACC 7.49
Source: Exane BNP Paribas estimates
Sum-of-the-parts approach: EUR39 per share
While Air France-KLM�s earnings are built mainly on the passenger business, we believe the group�s business mix still lends itself to a sum-of-the-parts valuation. We value the core business segments based on multiples of forecast EBIT (adjusted for operating leases), as shown in the following table.
Table 3: Air France-KLM � sum-of-the-parts valuation
Adjusted operating income Multiple (x) Estimated value EURm 06/07 07/08e 08/09e 07/08e 08/09e 07/08e 08/09e
Passenger 1,067 1,490 1,726 12 10 17,880 17,260 Cargo 62 58 62 9 8 522 496 Maintenance 44 49 52 9 8 441 416 Catering 16 18 22 9 8 162 176 Transavia/Leisure 35 42 55 9 8 378 440 Total 19,383 18,788 Equity affiliates (BV) WAM/Amadeus/Opodo 198 198 200 200 Net debt (including capitalised leases) (8,104) (8,104) Minorities (66) (66) Equity value 11,611 11,016 Value per share (EUR) 40 38 Avg. value per share (EUR) 39
Source: Exane BNP Paribas estimates
10 Air France-KLM
Our multiples of 12x (2007/08e) and 10x (2008/09e) operating income applied to Air France-KLM�s largest business segment, the passenger activity, are equivalent to the network airlines� average. This could be considered conservative given our higher profit growth expectations for Air France-KLM.
Our model indicates an estimated EV for Air France-KLM of EUR19.38bn for 2007/08e.and EUR18.79bn for 2008/09e. After deducting net debt and minorities, we arrive at an equity value range of EUR11.6bn to EUR11bn, averaging out at EUR11.3bn and corresponding to EUR39 per share. This is close to our DCF valuation and 70% above Air France-KLM�s current share price, supporting our view that the shares are significantly undervalued.
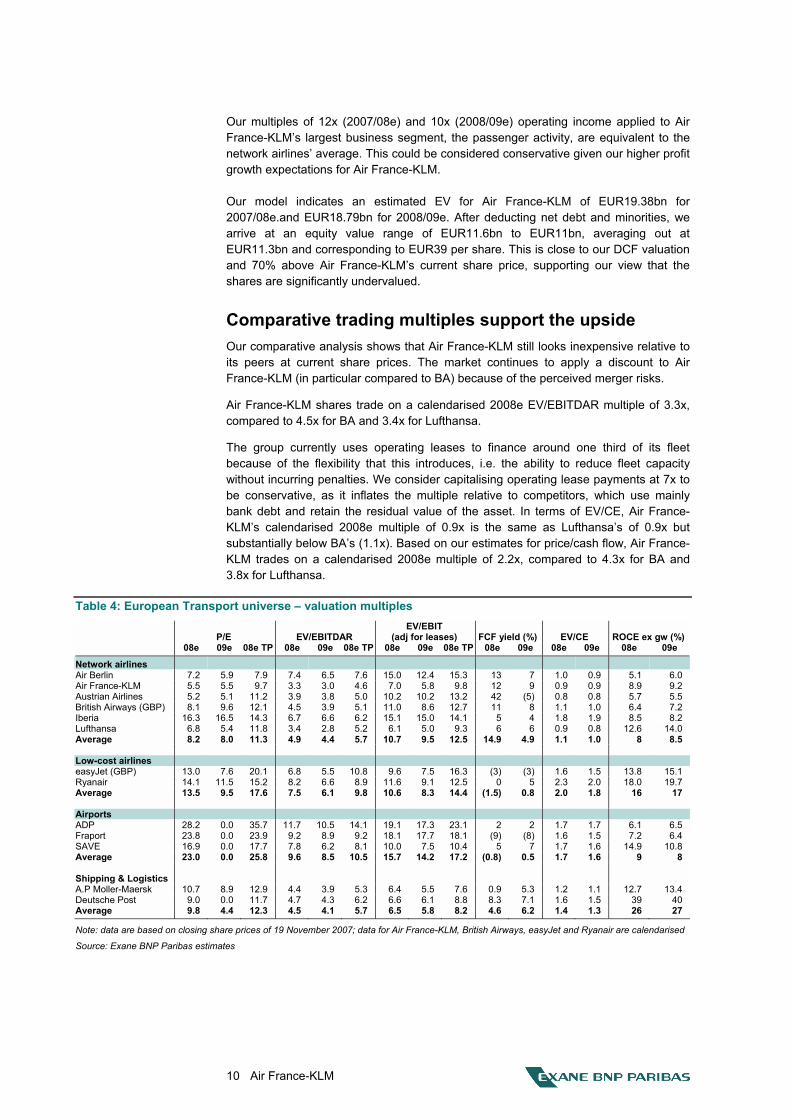
Comparative trading multiples support the upside Our comparative analysis shows that Air France-KLM still looks inexpensive relative to its peers at current share prices. The market continues to apply a discount to Air France-KLM (in particular compared to BA) because of the perceived merger risks.
Air France-KLM shares trade on a calendarised 2008e EV/EBITDAR multiple of 3.3x, compared to 4.5x for BA and 3.4x for Lufthansa.
The group currently uses operating leases to finance around one third of its fleet because of the flexibility that this introduces, i.e. the ability to reduce fleet capacity without incurring penalties. We consider capitalising operating lease payments at 7x to be conservative, as it inflates the multiple relative to competitors, which use mainly bank debt and retain the residual value of the asset. In terms of EV/CE, Air France-KLM�s calendarised 2008e multiple of 0.9x is the same as Lufthansa�s of 0.9x but substantially below BA�s (1.1x). Based on our estimates for price/cash flow, Air France-KLM trades on a calendarised 2008e multiple of 2.2x, compared to 4.3x for BA and 3.8x for Lufthansa.
Table 4: European Transport universe � valuation multiples
P/E EV/EBITDAR EV/EBIT
(adj for leases) FCF yield (%) EV/CE ROCE ex gw (%) 08e 09e 08e TP 08e 09e 08e TP 08e 09e 08e TP 08e 09e 08e 09e 08e 09e
Network airlines Air Berlin 7.2 5.9 7.9 7.4 6.5 7.6 15.0 12.4 15.3 13 7 1.0 0.9 5.1 6.0 Air France-KLM 5.5 5.5 9.7 3.3 3.0 4.6 7.0 5.8 9.8 12 9 0.9 0.9 8.9 9.2 Austrian Airlines 5.2 5.1 11.2 3.9 3.8 5.0 10.2 10.2 13.2 42 (5) 0.8 0.8 5.7 5.5 British Airways (GBP) 8.1 9.6 12.1 4.5 3.9 5.1 11.0 8.6 12.7 11 8 1.1 1.0 6.4 7.2 Iberia 16.3 16.5 14.3 6.7 6.6 6.2 15.1 15.0 14.1 5 4 1.8 1.9 8.5 8.2 Lufthansa 6.8 5.4 11.8 3.4 2.8 5.2 6.1 5.0 9.3 6 6 0.9 0.8 12.6 14.0 Average 8.2 8.0 11.3 4.9 4.4 5.7 10.7 9.5 12.5 14.9 4.9 1.1 1.0 8 8.5
Low-cost airlines easyJet (GBP) 13.0 7.6 20.1 6.8 5.5 10.8 9.6 7.5 16.3 (3) (3) 1.6 1.5 13.8 15.1 Ryanair 14.1 11.5 15.2 8.2 6.6 8.9 11.6 9.1 12.5 0 5 2.3 2.0 18.0 19.7 Average 13.5 9.5 17.6 7.5 6.1 9.8 10.6 8.3 14.4 (1.5) 0.8 2.0 1.8 16 17
Airports ADP 28.2 0.0 35.7 11.7 10.5 14.1 19.1 17.3 23.1 2 2 1.7 1.7 6.1 6.5 Fraport 23.8 0.0 23.9 9.2 8.9 9.2 18.1 17.7 18.1 (9) (8) 1.6 1.5 7.2 6.4 SAVE 16.9 0.0 17.7 7.8 6.2 8.1 10.0 7.5 10.4 5 7 1.7 1.6 14.9 10.8 Average 23.0 0.0 25.8 9.6 8.5 10.5 15.7 14.2 17.2 (0.8) 0.5 1.7 1.6 9 8
Shipping & Logistics A.P Moller-Maersk 10.7 8.9 12.9 4.4 3.9 5.3 6.4 5.5 7.6 0.9 5.3 1.2 1.1 12.7 13.4 Deutsche Post 9.0 0.0 11.7 4.7 4.3 6.2 6.6 6.1 8.8 8.3 7.1 1.6 1.5 39 40 Average 9.8 4.4 12.3 4.5 4.1 5.7 6.5 5.8 8.2 4.6 6.2 1.4 1.3 26 27
Note: data are based on closing share prices of 19 November 2007; data for Air France-KLM, British Airways, easyJet and Ryanair are calendarised
Source: Exane BNP Paribas estimates
11 Air France-KLM
At 12% for 2008e and 9% for 2009e (both calendarised), Air France-KLM�s projected FCF yield is higher than those of BA and Lufthansa, largely because Air France-KLM already generates strong cash flow, reflecting in part its decision to renew the long-haul fleet earlier than its main rivals.
We believe the discount applied to Air France-KLM is unjustified, as we see considerably fewer operational risks for Air France-KLM than for BA. This is particularly the case because of the vulnerability of the latter�s North Atlantic yields to an Open Skies agreement and its free cash flow erosion following the sharply increased capex requirements in connection with the long-haul fleet renewal from 2009.
Our adjusted EBIT margin forecasts have changed in accordance with our revised fuel cost assumptions but synergy upgrades, and in particular the contribution from the new joint ventures, should provide scope to increase them in the future.
Valuation risks The main risk to our valuation scenario for Air France-KLM relates to the possibility of a downturn in traffic based on a fall-off in demand. However, the consensus remains in favour of a positive outlook for global growth in airline traffic volumes and for Air France-KLM in particular, based on sustained growth of the emerging economies.
There is also the threat of a much higher level of jet fuel prices, and as noted we have raised our cost estimates for 2008/09 and onwards to take account of this. However, these are chiefly short/medium-term earnings risks that apply to all airlines. As noted, Air France-KLM has a highly protective hedge in place through 2007/08 and lower, but still significant, levels of hedging that are higher than those of competitors for 2008/09 and 2009/10. Our emphasis is on the medium-term opportunities for cash flow enhancement through the greater market presence and higher asset utilisation achieved through the merger, as well as the opportunities to cut costs. We believe the fuel price risk is factored into the shares� current valuation and the valuation discount has been overstated. As discussed in the section, �Airline acquisitions: risk/return trade-off�, later in this report, we believe the possibility of a loss of value as a consequence of overpaying for second-tier airlines is minimal, given management�s track record and continuing cautious approach to acquisitions.
12 Air France-KLM
Scale effects/cost cutting support margins
The logic behind the Air France-KLM merger in 2004 was to increase revenues through a widening of the marketing reach (economies of scope) and to reduce joint costs and improve aircraft utilisation through process reorganisation and integration (economies of scale). In our view, both factors are already resulting in, and continue to underpin, progressive improvements in asset utilisation and thus in margins and ROCE. Air France-KLM brought forward its 7% post-tax ROCE target by two years to the current year and raised its 2009/10 target by 1.5% to 8.5%. In our view, this implies that Air France-KLM is confident of achieving a 2009/10 EBIT margin adjusted for leases of at least 8%.
In this section, we examine two areas where margin has or could grow, based on increased scale effects. The first is an analysis of the scale effects which have built margin expansion since the merger between Air France and KLM and which create the platform for further growth. The second, more speculative, but nonetheless, real analysis is an attempt to quantify the potential earnings enhancement that could be created through an acquisition of either Alitalia or Iberia, as well as the potential benefits from the establishment of transatlantic joint venture operations between Air France-KLM and their US SkyTeam alliance partners, Delta and Northwest Airlines.
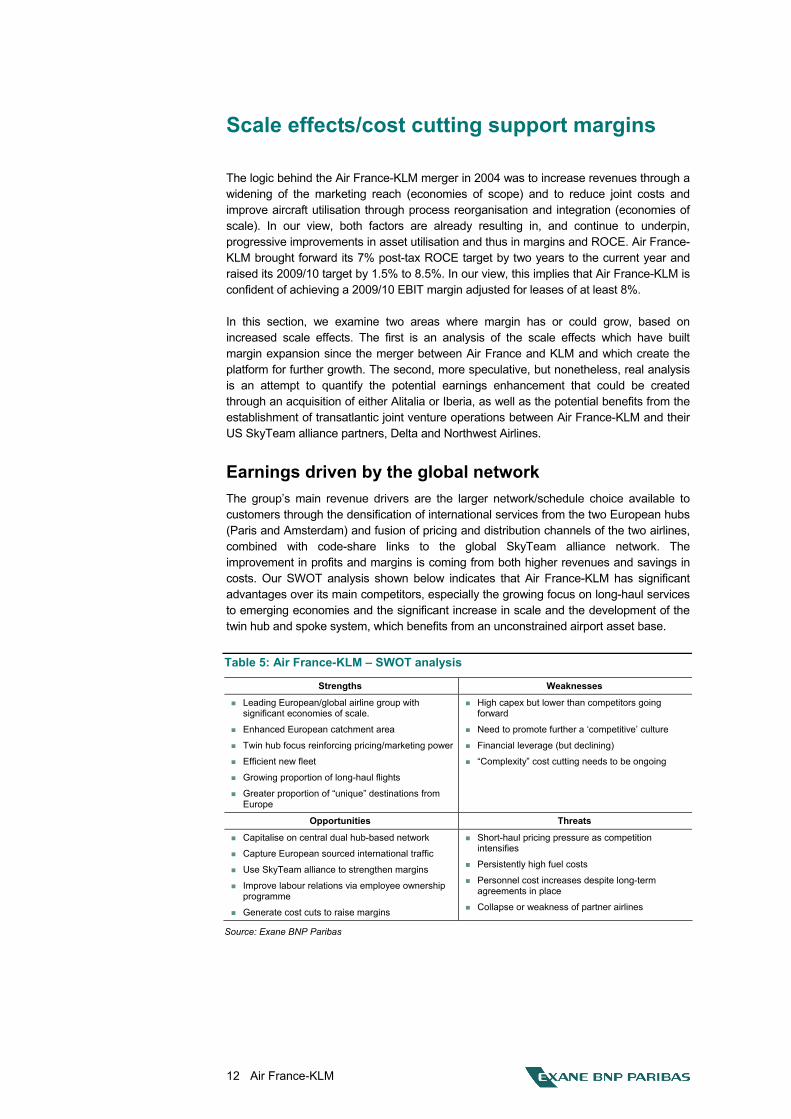
Earnings driven by the global network The group�s main revenue drivers are the larger network/schedule choice available to customers through the densification of international services from the two European hubs (Paris and Amsterdam) and fusion of pricing and distribution channels of the two airlines, combined with code-share links to the global SkyTeam alliance network. The improvement in profits and margins is coming from both higher revenues and savings in costs. Our SWOT analysis shown below indicates that Air France-KLM has significant advantages over its main competitors, especially the growing focus on long-haul services to emerging economies and the significant increase in scale and the development of the twin hub and spoke system, which benefits from an unconstrained airport asset base.
Table 5: Air France-KLM � SWOT analysis
Strengths Weaknesses
! Leading European/global airline group with significant economies of scale.
! Enhanced European catchment area
! Twin hub focus reinforcing pricing/marketing power
! Efficient new fleet
! Growing proportion of long-haul flights
! Greater proportion of �unique� destinations from Europe
! High capex but lower than competitors going forward
! Need to promote further a �competitive� culture
! Financial leverage (but declining)
! �Complexity� cost cutting needs to be ongoing
Opportunities Threats
! Capitalise on central dual hub-based network
! Capture European sourced international traffic
! Use SkyTeam alliance to strengthen margins
! Improve labour relations via employee ownership programme
! Generate cost cuts to raise margins
! Short-haul pricing pressure as competition intensifies
! Persistently high fuel costs
! Personnel cost increases despite long-term agreements in place
! Collapse or weakness of partner airlines
Source: Exane BNP Paribas
13 Air France-KLM
New management structure in place
Earlier this year, Air France-KLM introduced a new combined executive management structure on a functional basis, replacing the separate management structures in Air France and KLM. In place of the Strategic Management Committee, which had supervised the development of Air France and KLM over 2004�2007, the business is being managed from 2007 through an Executive Committee whose members have a group level responsibility and can come from either Air France or KLM while retaining their responsibilities at a company level. This should facilitate the introduction of the process and productivity improvements which are part of the �Challenge 10� cost-savings programme, discussed in the later section, �Moving towards the 8.5% ROCE target�.
Global network is a platform for growth
Since the merger, there has been consistently strong growth on routes to the Americas (North and South America) and to the Asia-Pacific region. These growth rates outstrip other carriers. BA no longer provides comparable information (disclosure is by origin of sale which has less information value) but passenger traffic (in RPKs) was only 0.5% higher on routes to the Americas and actually fell by 4% on routes to Asia in 2006/07. It is therefore clear that Air France-KLM is substantially outperforming its competitors on those routes. This is confirmed by the Association of European Airlines� (AEA) market share data, which shows Air France-KLM raising its market share among the AEA (excluding low-cost carriers) from 26.2% to 27.1% over the period May 2004�December 2006, whereas BA�s market share declined from 16.9% to 16% and Lufthansa�s (including Swiss) fell from 20.2% to 18.9%.
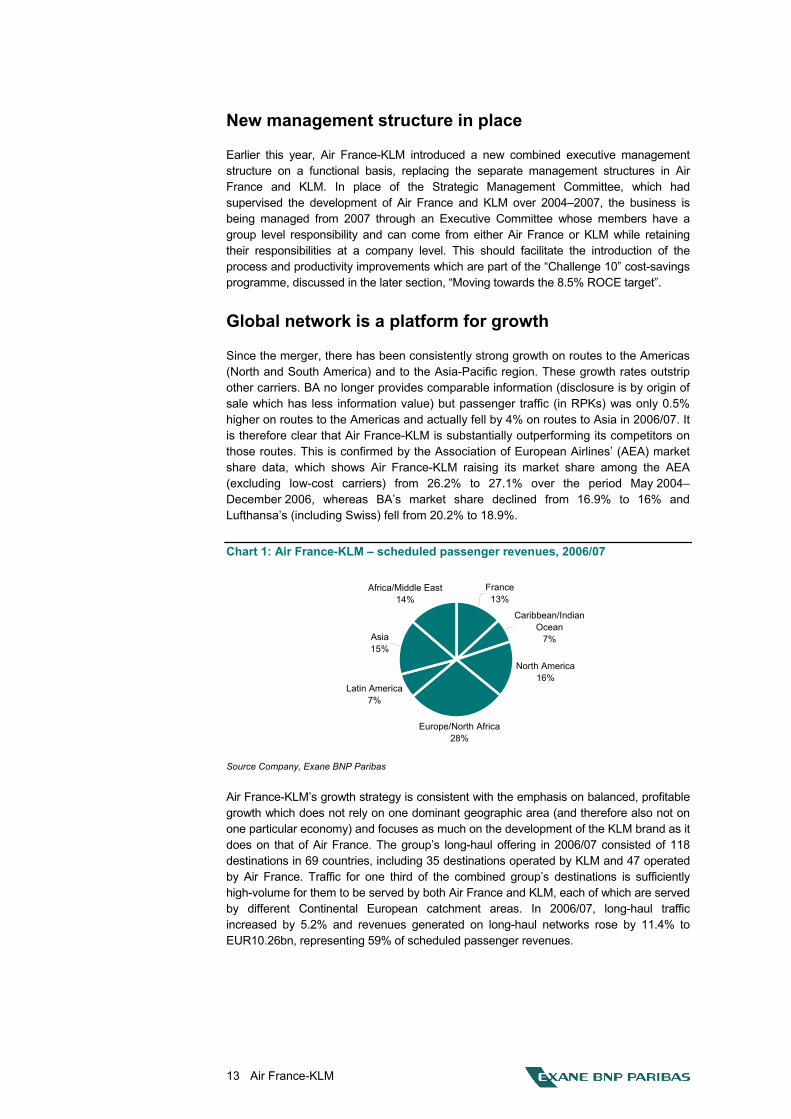
Chart 1: Air France-KLM � scheduled passenger revenues, 2006/07
France13%
Caribbean/Indian Ocean
7%
North America16%
Europe/North Africa28%
Latin America7%
Africa/Middle East14%
Asia15%
Source Company, Exane BNP Paribas
Air France-KLM�s growth strategy is consistent with the emphasis on balanced, profitable growth which does not rely on one dominant geographic area (and therefore also not on one particular economy) and focuses as much on the development of the KLM brand as it does on that of Air France. The group�s long-haul offering in 2006/07 consisted of 118 destinations in 69 countries, including 35 destinations operated by KLM and 47 operated by Air France. Traffic for one third of the combined group�s destinations is sufficiently high-volume for them to be served by both Air France and KLM, each of which are served by different Continental European catchment areas. In 2006/07, long-haul traffic increased by 5.2% and revenues generated on long-haul networks rose by 11.4% to EUR10.26bn, representing 59% of scheduled passenger revenues.
14 Air France-KLM
KLM appears to be participating equally in long-haul growth. This has been the consistent trend since the merger took place, showing the predicted benefits to KLM of access to Air France�s much larger network and customer base. Both operating companies have started to see a greater correlation of their business with the global economy rather than with their home markets, as evidenced by recent traffic figures. Air France-KLM is successfully expanding its premium passenger base from destination countries and through connecting passengers, as reflected in the results (2006/07 showed a 17% increase in the premium transfer passenger yield, the RASK, excluding currency effects) on long-haul traffic compared to a rise in the economy class yield of only 6%). Around 40% of passengers on Asian routes originate in Asia.
The merged Air France-KLM group is now playing to its strength, which is the increasing power of its combined schedules and common ticketing system to attract long-haul business and leisure passengers (hence load factors that are significantly higher than at either BA or Lufthansa). This is not a weak position which relies too heavily on lower-yield transfer passengers. In our view, it is more important to fill the aircraft with a mix of connecting and point-to-point high yield passengers as this maximises revenues and asset utilisation while spreading the traffic risks. Whereas BA�s earnings look vulnerable to traffic or yield erosion on North Atlantic traffic, Air France-KLM has a more robust spread of business (with, for example, the strongest European carrier position in Japan which is now showing good growth, along with leading positions in all long-haul markets).
Long-haul passenger demand remains strong, exceeding supply, and supporting yields and load factors. Despite some aberrations in May traffic figures because of the number of holidays (traffic was nevertheless 3.9% higher in that month with the load factor flat, compared to a 2.1% traffic decline and a 1.5 point fall in the load factor for BA) long-haul demand remains strong for Air France-KLM, powered by the hub synchronisation effect (linked schedules) between Paris and Amsterdam which is driving Air France-KLM's growth, both in absolute terms and in terms of market share. Overall long-haul capacity grew at 5.6% this summer, with the leading European carriers increasing capacity by 6% and capacity from non-European competitors increasing by 4%. KLM�s transatlantic capacity is increasing at a higher rate because Northwest is raising capacity more than the average and KLM is seeking to rebalance its contribution to the existing transatlantic joint venture. Such strategic changes in capacity are likely to be seen increasingly after Open Skies in March 2008 following the joint venture with Delta, especially if Air France-KLM is successful in achieving the four-party anti-trust immunity for Air France, KLM, Delta and Northwest, for which an application to the US Department of Justice has been made.
The synchronised hub strategy works
This progressive construction of the twin hub system in Paris and Amsterdam, both of which are relatively unconstrained in terms of infrastructure capacity compared to Heathrow and Frankfurt, is paying off. Between May 2004 and December 2006, Air France-KLM increased its market share (AEA traffic) from 26.2% to 27.1% and now has critical mass in most of its main markets. In contrast, BA and Lufthansa have both lost market share.
15 Air France-KLM
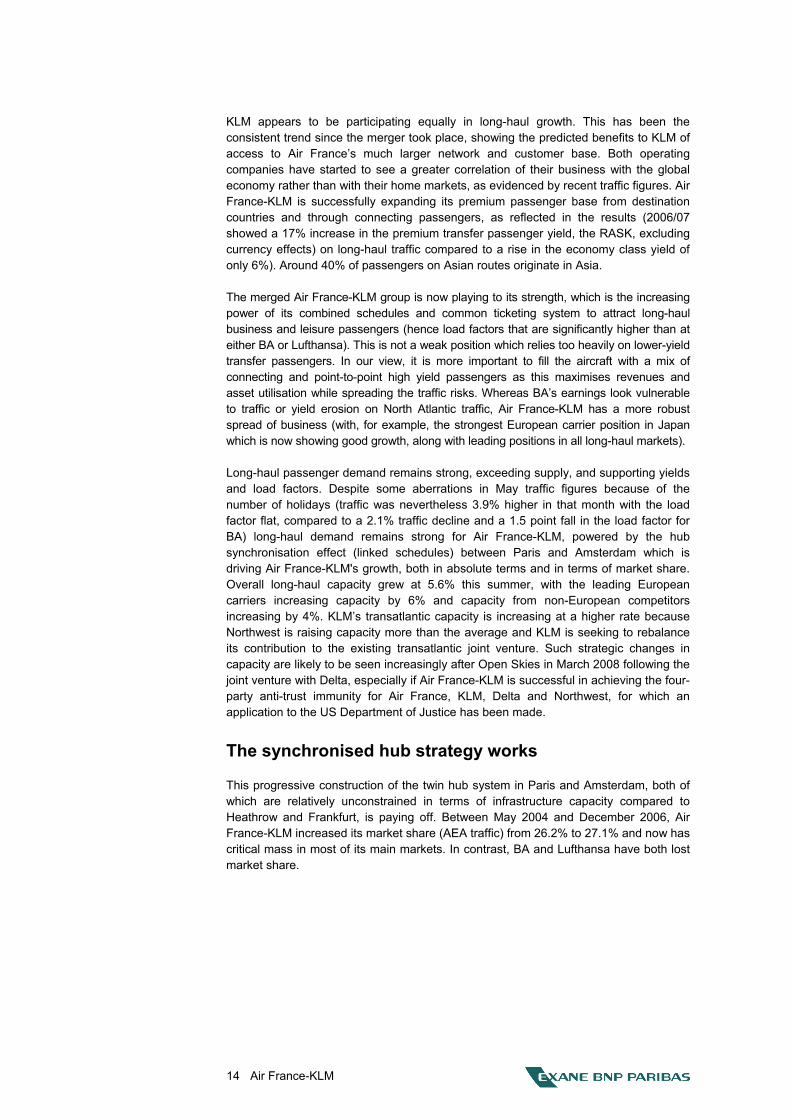
Chart 2: Medium-haul, long-haul connections under two hours (summer 2007)
20,695
7,193
3,0974,110
13,020
7,070
0
5,000
10,000
15,000
20,000
25,000
Paris-CDG Amsterdam Zurich Munich Frankfurt London-Heathrow
MH
-LH
con
nect
ions
Source: Exane BNP Paribas estimates
This is because Air Fance-KLM offers more destinations and route combinations through its twin hubs. This is attractive for the large corporate accounts. BA's alternative strategy of focusing on point-to-point premium business from Heathrow produces high yields on dense long-haul routes but is highly vulnerable to new competition, such as the business class only airlines, Eos and Maxjet, and after March 2008 from new services by the large US airlines which are currently excluded from the rich Heathrow�US market (9 out of the 12 most profitable routes from Europe to the US are from Heathrow).
Network improvements drive gains
Network improvements and increasing coordination of sales and revenue management activities have contributed to sustainable improvements in the group�s market position, especially with global corporate accounts. This is expected to be given a further boost in 2008�2010 from the introduction of a common sales and marketing IT backbone (the Amadeus Altea system) which is also expected to lead to increased on-line sales and e-ticketing. This leads to a virtuous circle in terms of customer capture and retention, along with lower sales and distribution costs.
In 2006/07, traffic in Asia traffic (RPKs) was 9.9% higher, while capacity grew by 7.9%. The seat load factor rose by 1.5 points to 86.8%. In Latin America, growth was even stronger; traffic was 11.2% higher while capacity increased by 6.6% and the yield (RASK) was up 22%. Routes to Middle East/Africa saw traffic grow by 6.8%, 0.8 points higher than the growth in capacity. Even in Europe, there was a difference between growth in traffic at 6.3% and capacity at 5.2%. Traffic grew by over 6% yoy over June�August. Statistics for September showed traffic growth of 5.3% and seat load factors broadly stable at high levels with the exception of the Americas, where a capacity increase of 12.3% yoy and traffic growth of 9.2% saw a 2.4 point fall in the seat load factor.
The October traffic figures showed underlying growth of 4.5% yoy and a seat load factor maintained at the high level of 80.6%, although the reported figures showed a decline of 0.7% because of the impact of the strike (which mainly affected European traffic).
16 Air France-KLM
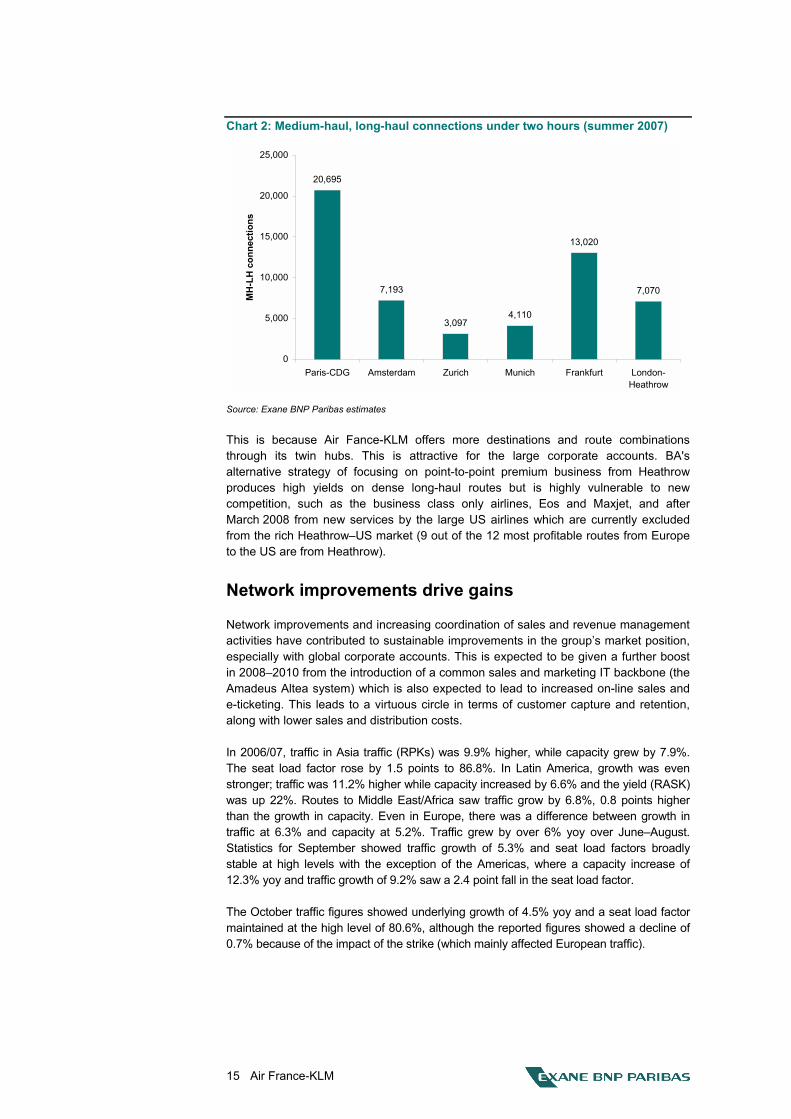
Chart 3: Air France-KLM and BA � monthly traffic growth, yoy
(6)
(4)
(2)
0
2
4
6
8
10
Oct-06 Dec-06 Feb-07 Apr-07 Jun-07 Aug-07 Oct-07
RPK
gro
wth
(%)
0
10
20
30
40
50
60
70
80
90
100
Load
fact
or (%
)
Air France-KLM traffic growth BA traffic growth
AF-KLM load factor (rhs) BA load factor (rhs)
Source: Exane BNP Paribas from company statistics
The reasons for this are: 1) Air France-KLM�s management realised early on that airline consolidation was both possible and desirable, despite the risks, 2) the merger of Air France with KLM was carefully planned and executed, leading to clear success over a three-year period; and 3) the group pioneered the model of separate brands but closely coordinated activities based around synchronised hub and spoke systems which delivered economies of scale and improved asset utilisation. In addition, considerable focus was given to the development of networks in high traffic growth regions, such as Asia-Pacific and Latin America, and this continues to bear fruit in terms of growth and load factor improvements. The infrastructure for this development continues to improve, both at Paris-CDG airport and at Amsterdam-Schiphol, most recently with the opening of satellite S3 at Paris-CDG in June 2007.
Strongly positioned in Asia Capacity (and traffic) have been growing over-proportionately on Europe�Asia routes and this is expected to continue for the next decade. Air France was traditionally the leading European carrier to Japan and this position has been consolidated, while KLM brings a strong network to South-East Asia (Jakarta was one of KLM�s first international routes). Air France-KLM had the leading capacity share (and high seat load factors) on Europe-Asia routes in summer 2007 at 12.9% compared to 11% in summer 2006. This route area is targeted for the highest growth.
Table 6: Capacity shares on routes to Europe�Asia, summer 2007 Airline Capacity share (%)
Air France-KLM 12.9Lufthansa-Swiss 11.0British Airways 7.7Thai Airways 7.0Singapore Airlines 6.4Cathay Pacific 4.7JAL 4.4
Source: Company data, Exane BNP Paribas estimates
There has been a notable change in the customer profile on Europe-Asia routes in the past five years, with around 40% of passengers now originating in Asia. This is convincing evidence of the increasing globalisation of the leading international airlines, especially Air France-KLM.
17 Air France-KLM
El Dorado in Latin America Air France-KLM�s strong expansion in Latin America following the merger appears to have been a successful strategic move, as the Latin American economies grew strongly and demand for airline services rose strongly, but financial difficulties at national airlines, such as Varig, meant that supply was restricted.
Middle East/Africa also showing good growth Development of the African market has likewise been a success for Air France-KLM, as Air France�s dominant presence in French speaking West African markets was complemented by KLM�s presence in Eastern and Southern Africa. KLM�s route network to the Middle East also boosted the group�s presence considerably in this fast-growing region.
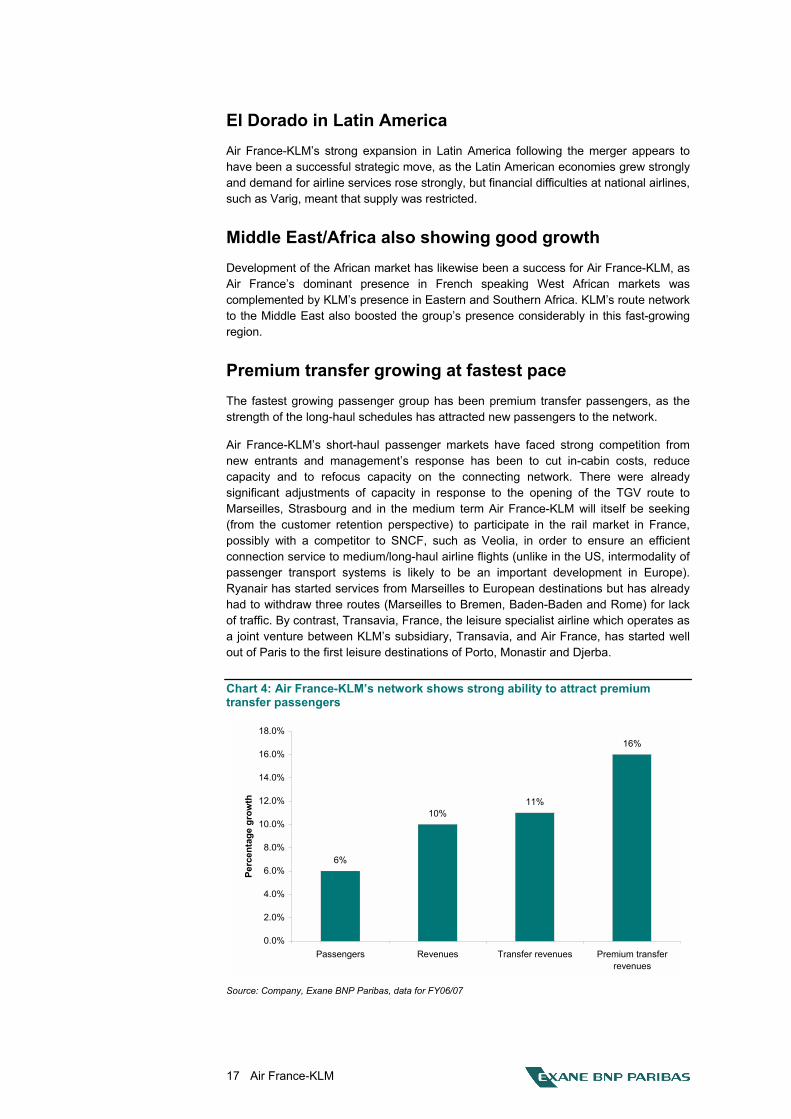
Premium transfer growing at fastest pace The fastest growing passenger group has been premium transfer passengers, as the strength of the long-haul schedules has attracted new passengers to the network.
Air France-KLM�s short-haul passenger markets have faced strong competition from new entrants and management�s response has been to cut in-cabin costs, reduce capacity and to refocus capacity on the connecting network. There were already significant adjustments of capacity in response to the opening of the TGV route to Marseilles, Strasbourg and in the medium term Air France-KLM will itself be seeking (from the customer retention perspective) to participate in the rail market in France, possibly with a competitor to SNCF, such as Veolia, in order to ensure an efficient connection service to medium/long-haul airline flights (unlike in the US, intermodality of passenger transport systems is likely to be an important development in Europe). Ryanair has started services from Marseilles to European destinations but has already had to withdraw three routes (Marseilles to Bremen, Baden-Baden and Rome) for lack of traffic. By contrast, Transavia, France, the leisure specialist airline which operates as a joint venture between KLM�s subsidiary, Transavia, and Air France, has started well out of Paris to the first leisure destinations of Porto, Monastir and Djerba.
Chart 4: Air France-KLM�s network shows strong ability to attract premium transfer passengers
6%
10%11%
16%
0.0%
2.0%
4.0%
6.0%
8.0%
10.0%
12.0%
14.0%
16.0%
18.0%
Passengers Revenues Transfer revenues Premium transferrevenues
Perc
enta
ge g
row
th
Source: Company, Exane BNP Paribas, data for FY06/07
18 Air France-KLM
Growth in airport infrastructure will improve efficiency Of all the network airlines, Air France and KLM enjoy the best hub airport infrastructure. Heathrow will have additional terminal capacity following the commissioning of Terminal 5 from March 2008 but is constrained by only having two runways. Frankfurt, Lufthansa�s main hub, similarly has adequate terminal capacity, which is being extended but only two parallel runways and a cross runway. If it is not delayed further, the earliest date for a new runway at Frankfurt is 2011. There are no runway constraints at Paris-CDG, which has four runways arranged in twin parallel systems, and Amsterdam-Schiphol, which operates five runways.
Next year, Air France will gain considerably from the expansion of infrastructure capacity at Paris-CDG airport, with incremental capacity for 19.4m passengers and a large number of additional contact stands by the end of 2008. The first phase of this expansion, a spacious new boarding terminal, Satellite S3, with capacity for 7m passengers, was opened in June 2007.
Paris-CDG airport�s four parallel runways are sufficient for at least 120m passengers, or a doubling of current capacity. Satellite S3 (�La Galérie Parisienne�) a boarding satellite for Terminal 2, was completed in June 2007, adding space for an extra 8.5m passengers. The reconstructed Terminal 2E, a refurbished CDG1 and a new terminal for Air France-KLM�s regional airline subsidiaries will be completed in 2008, adding capacity for a further 10.9m passengers (19.4m in total). These are served by a new light rail system connecting the terminals and a new automatic baggage handling system under Terminal 2. More importantly, the number of contact stands for Air France is rising dramatically and brings an A380 docking capability. This greatly improves efficiency for the airline and significantly reduces internal airport transport and passenger transfer costs.
KLM similarly enjoys unconstrained infrastructure capacity at Amsterdam-Schiphol, with its new terminal, five runways and direct road and rail links into Europe.
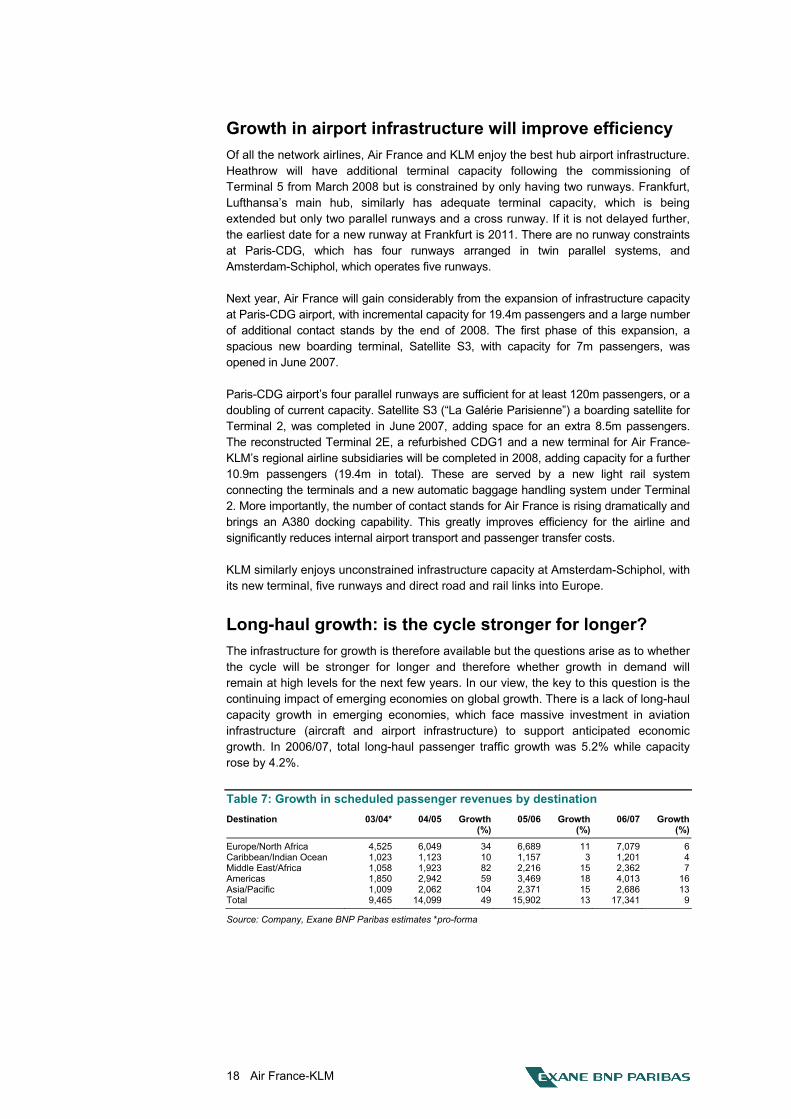
Long-haul growth: is the cycle stronger for longer? The infrastructure for growth is therefore available but the questions arise as to whether the cycle will be stronger for longer and therefore whether growth in demand will remain at high levels for the next few years. In our view, the key to this question is the continuing impact of emerging economies on global growth. There is a lack of long-haul capacity growth in emerging economies, which face massive investment in aviation infrastructure (aircraft and airport infrastructure) to support anticipated economic growth. In 2006/07, total long-haul passenger traffic growth was 5.2% while capacity rose by 4.2%.
Table 7: Growth in scheduled passenger revenues by destination Destination 03/04* 04/05 Growth
(%)05/06 Growth
(%) 06/07 Growth
(%)
Europe/North Africa 4,525 6,049 34 6,689 11 7,079 6Caribbean/Indian Ocean 1,023 1,123 10 1,157 3 1,201 4Middle East/Africa 1,058 1,923 82 2,216 15 2,362 7Americas 1,850 2,942 59 3,469 18 4,013 16Asia/Pacific 1,009 2,062 104 2,371 15 2,686 13Total 9,465 14,099 49 15,902 13 17,341 9
Source: Company, Exane BNP Paribas estimates *pro-forma
19 Air France-KLM
The previous table shows the growth in revenues by destination since the merger. The figures for 2004/05, the first year of the merger, show that KLM brought to Air France a strong rise in revenues on routes to the Asia-Pacific region (+104%), Middle East/Africa (+82%) and the Americas (+59%). Given the proportionately higher long-haul business of KLM, the increase in revenues on European routes was less spectacular (+34%).
Table 8: Long-haul capacity and demand growth, 2007e�2011e
Country/region Demand growth Air France-KLM capacity growth
Europe 6.2 4.5Latin America 8.3 8.0Africa 4.8 4.5Middle East 7.7 3.5India 8.0 11.0China 12.0 14.5Japan 5.0 8.0
Source: Company, Exane BNP Paribas estimates
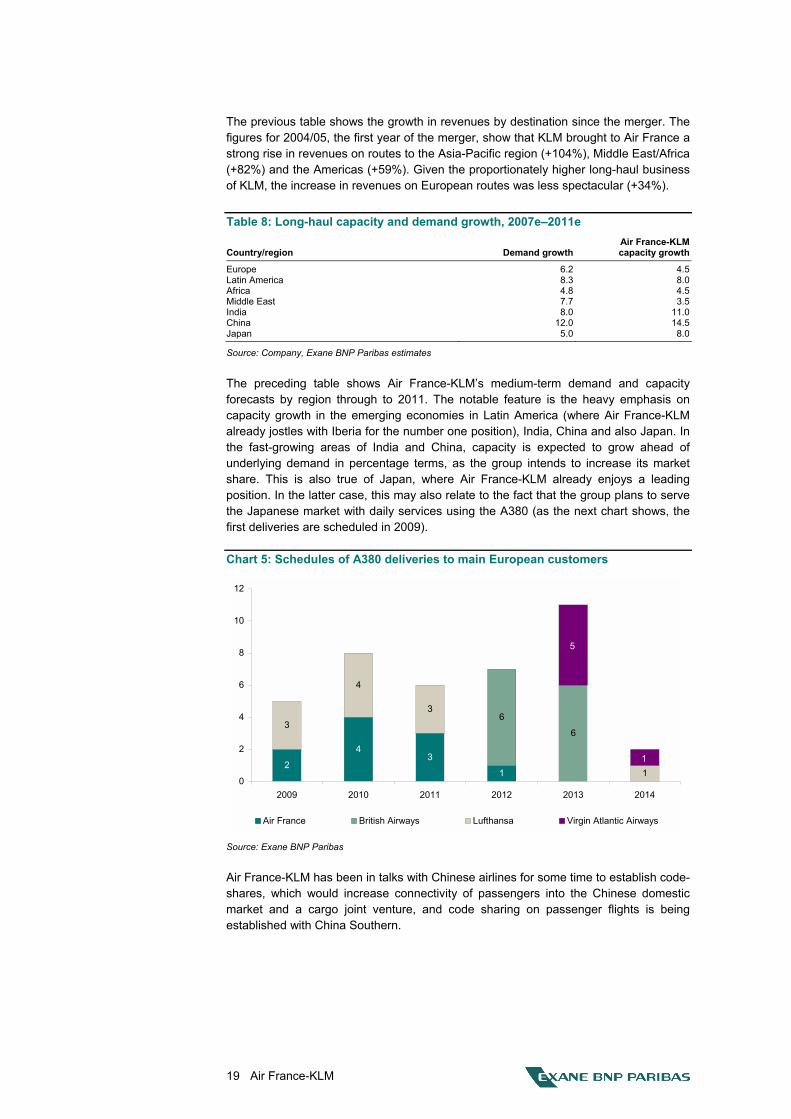
The preceding table shows Air France-KLM�s medium-term demand and capacity forecasts by region through to 2011. The notable feature is the heavy emphasis on capacity growth in the emerging economies in Latin America (where Air France-KLM already jostles with Iberia for the number one position), India, China and also Japan. In the fast-growing areas of India and China, capacity is expected to grow ahead of underlying demand in percentage terms, as the group intends to increase its market share. This is also true of Japan, where Air France-KLM already enjoys a leading position. In the latter case, this may also relate to the fact that the group plans to serve the Japanese market with daily services using the A380 (as the next chart shows, the first deliveries are scheduled in 2009).
Chart 5: Schedules of A380 deliveries to main European customers
2
43
1
6
63
4
3
1
5
1
0
2
4
6
8
10
12
2009 2010 2011 2012 2013 2014
Air France British Airways Lufthansa Virgin Atlantic Airways
Source: Exane BNP Paribas
Air France-KLM has been in talks with Chinese airlines for some time to establish code-shares, which would increase connectivity of passengers into the Chinese domestic market and a cargo joint venture, and code sharing on passenger flights is being established with China Southern.
20 Air France-KLM
Consolidation underpins asset utilisation improvements
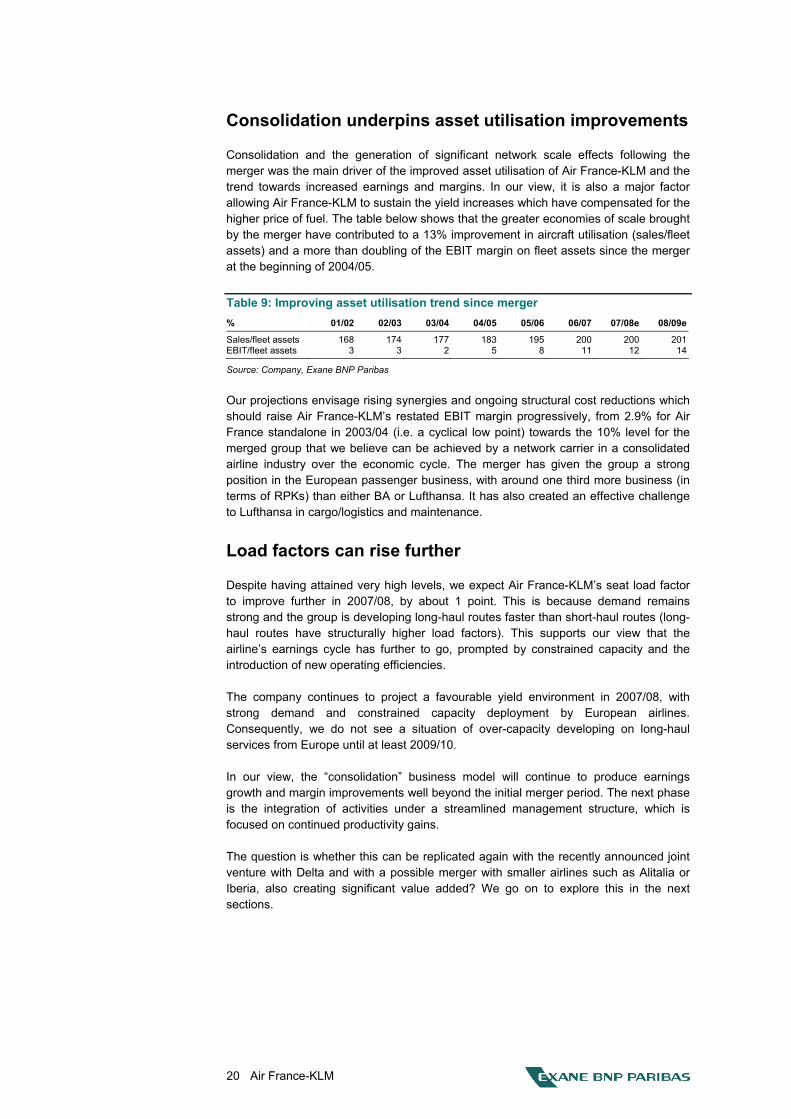
Consolidation and the generation of significant network scale effects following the merger was the main driver of the improved asset utilisation of Air France-KLM and the trend towards increased earnings and margins. In our view, it is also a major factor allowing Air France-KLM to sustain the yield increases which have compensated for the higher price of fuel. The table below shows that the greater economies of scale brought by the merger have contributed to a 13% improvement in aircraft utilisation (sales/fleet assets) and a more than doubling of the EBIT margin on fleet assets since the merger at the beginning of 2004/05.
Table 9: Improving asset utilisation trend since merger % 01/02 02/03 03/04 04/05 05/06 06/07 07/08e 08/09e
Sales/fleet assets 168 174 177 183 195 200 200 201EBIT/fleet assets 3 3 2 5 8 11 12 14
Source: Company, Exane BNP Paribas
Our projections envisage rising synergies and ongoing structural cost reductions which should raise Air France-KLM�s restated EBIT margin progressively, from 2.9% for Air France standalone in 2003/04 (i.e. a cyclical low point) towards the 10% level for the merged group that we believe can be achieved by a network carrier in a consolidated airline industry over the economic cycle. The merger has given the group a strong position in the European passenger business, with around one third more business (in terms of RPKs) than either BA or Lufthansa. It has also created an effective challenge to Lufthansa in cargo/logistics and maintenance.
Load factors can rise further
Despite having attained very high levels, we expect Air France-KLM�s seat load factor to improve further in 2007/08, by about 1 point. This is because demand remains strong and the group is developing long-haul routes faster than short-haul routes (long-haul routes have structurally higher load factors). This supports our view that the airline�s earnings cycle has further to go, prompted by constrained capacity and the introduction of new operating efficiencies.
The company continues to project a favourable yield environment in 2007/08, with strong demand and constrained capacity deployment by European airlines. Consequently, we do not see a situation of over-capacity developing on long-haul services from Europe until at least 2009/10.
In our view, the �consolidation� business model will continue to produce earnings growth and margin improvements well beyond the initial merger period. The next phase is the integration of activities under a streamlined management structure, which is focused on continued productivity gains.
The question is whether this can be replicated again with the recently announced joint venture with Delta and with a possible merger with smaller airlines such as Alitalia or Iberia, also creating significant value added? We go on to explore this in the next sections.
21 Air France-KLM
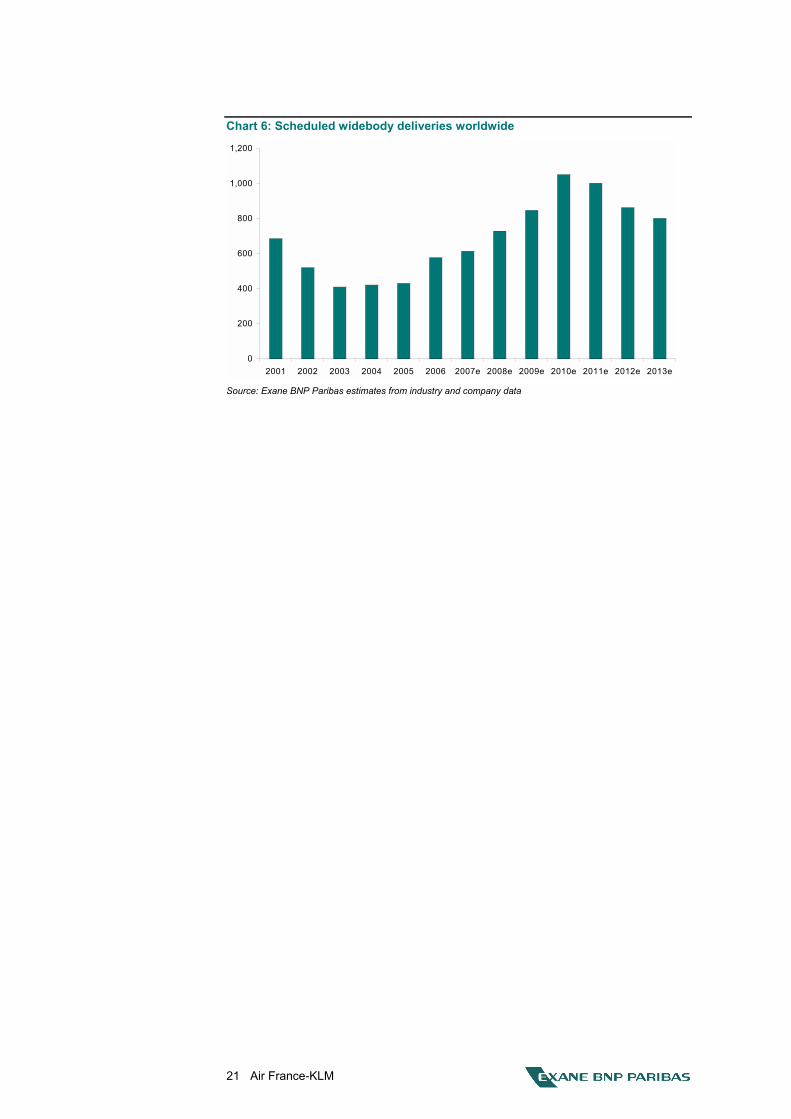
Chart 6: Scheduled widebody deliveries worldwide
0
200
400
600
800
1,000
1,200
2001 2002 2003 2004 2005 2006 2007e 2008e 2009e 2010e 2011e 2012e 2013e Source: Exane BNP Paribas estimates from industry and company data
22 Air France-KLM
Delta JV: taking advantage of Open Skies
In the global airline industry, one clear form of consolidation is through capacity-sharing joint ventures, which restrict the amount of capacity that is introduced on selected routes or �sub-systems�. In late October 2007, the Air France airline announced a major new joint venture with Delta which is initially aimed at targeting the premium yield market for business travellers from the US to London-Heathrow. Air France-KLM has applied for four-party anti-trust immunity for Air France and KLM with Delta and Northwest (and also for Alitalia). It expects to have a new joint venture structure in place with Delta by the end of 2007, followed by Northwest afterwards. This could strengthen considerably the position of SkyTeam on transatlantic routes where it currently trails BA/oneworld and Lufthansa/United Airlines. We expect this to be a major source of revenue growth, complementing the strong organic revenue growth that we expect to see on Asian and Latin American routes.
The new joint venture constitutes a positive development for Delta, which was hitherto blocked from entering the lucrative US-Heathrow market because of the restrictive Bermuda II agreement between the UK and the US. It is also positive for Air France, which has an (almost) asset-free way of developing its presence in the US�Europe transatlantic market, where it currently trails both BA and Lufthansa. It is expected that KLM will follow suit with the announcement of a joint venture with Northwest airlines on routes from the US to Heathrow, building on their existing joint venture on routes from the US to Amsterdam-Schiphol, which has been in place since 1993 and currently has structurally high margins.
It is intended that, following approval of anti-trust immunity, all four airlines will share a common four-party joint venture.
Air France/Delta announcement is a virtual merger On 17 October, Air France and Delta signed an agreement to extend their joint venture across the Atlantic. The two airlines already have anti-trust immunity on routes between the US and France, which permits them to cooperate on pricing, capacity and routes. J-C Spinetta, Air France-KLM�s President and CEO, confirmed that slots operated by Air France and KLM at Heathrow will be available to their respective alliance partners, Delta and Northwest, to operate direct flights between London and the US, probably through a series of joint ventures. It was also confirmed that 9 of 12 top point-to-point destinations to the US from Europe are from London-Heathrow.
In our view, Open Skies will lead to an increased interest in cooperation between those alliance partners which enjoy anti-trust immunity. This should also reinforce the consolidation effects on aircraft capacity levels, since closer cooperation implies joint targeting of routes, frequencies and seats on offer.
23 Air France-KLM
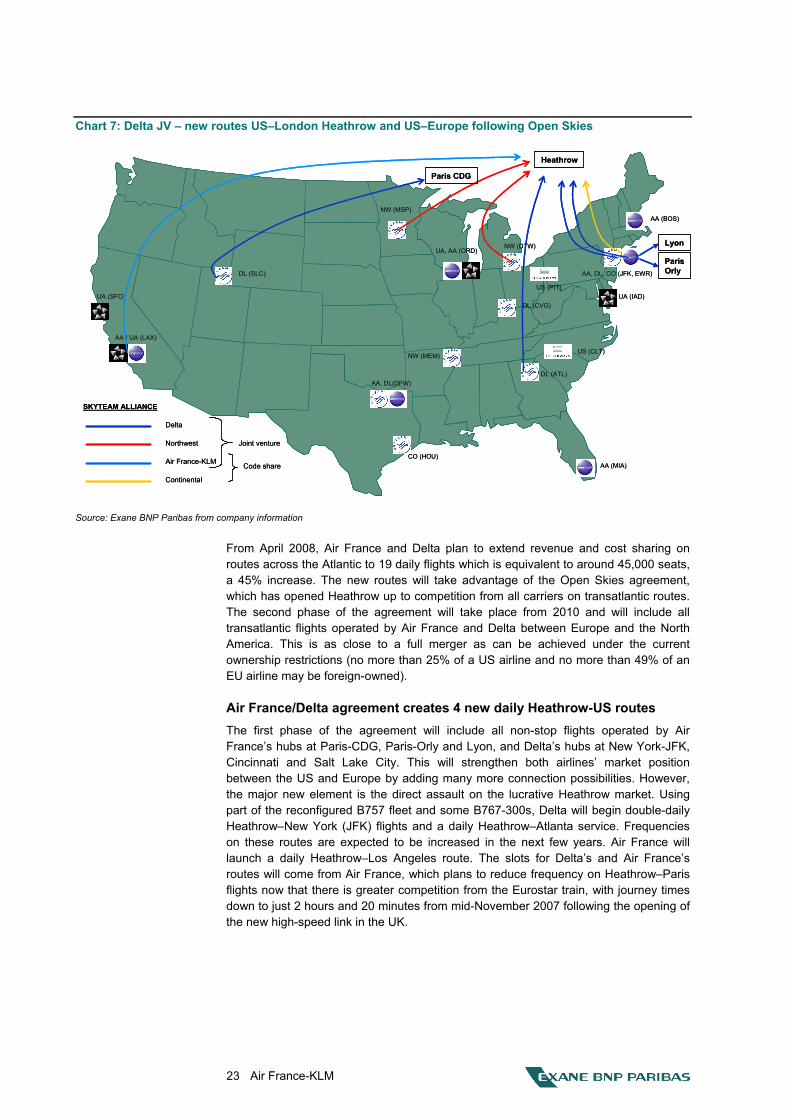
Chart 7: Delta JV � new routes US�London Heathrow and US�Europe following Open Skies
NW (MEM)
NW (DTW)
NW (MSP)
AA, DL(DFW)
CO (HOU)
AA / UA (LAX)
UA, AA (ORD)
DL (SLC)
DL (CVG)UA (SFO)
DL (ATL)
UA (IAD)
AA, DL, CO (JFK, EWR)
AA (BOS)
AA (MIA)
US (PIT)
US (CLT)
Air France-KLM
Delta
Northwest Joint venture
Continental
SKYTEAM ALLIANCE
Code share
Paris CDG
Heathrow
Lyon
Paris Orly
NW (MEM)
NW (DTW)
NW (MSP)
AA, DL(DFW)
CO (HOU)
AA / UA (LAX)
UA, AA (ORD)
DL (SLC)
DL (CVG)UA (SFO)
DL (ATL)
UA (IAD)
AA, DL, CO (JFK, EWR)
AA (BOS)
AA (MIA)
US (PIT)
US (CLT)
Air France-KLM
Delta
Northwest Joint venture
Continental
SKYTEAM ALLIANCE
Code share
Paris CDG
Heathrow
Lyon
Paris Orly
Source: Exane BNP Paribas from company information
From April 2008, Air France and Delta plan to extend revenue and cost sharing on routes across the Atlantic to 19 daily flights which is equivalent to around 45,000 seats, a 45% increase. The new routes will take advantage of the Open Skies agreement, which has opened Heathrow up to competition from all carriers on transatlantic routes. The second phase of the agreement will take place from 2010 and will include all transatlantic flights operated by Air France and Delta between Europe and the North America. This is as close to a full merger as can be achieved under the current ownership restrictions (no more than 25% of a US airline and no more than 49% of an EU airline may be foreign-owned).
Air France/Delta agreement creates 4 new daily Heathrow-US routes The first phase of the agreement will include all non-stop flights operated by Air France�s hubs at Paris-CDG, Paris-Orly and Lyon, and Delta�s hubs at New York-JFK, Cincinnati and Salt Lake City. This will strengthen both airlines� market position between the US and Europe by adding many more connection possibilities. However, the major new element is the direct assault on the lucrative Heathrow market. Using part of the reconfigured B757 fleet and some B767-300s, Delta will begin double-daily Heathrow�New York (JFK) flights and a daily Heathrow�Atlanta service. Frequencies on these routes are expected to be increased in the next few years. Air France will launch a daily Heathrow�Los Angeles route. The slots for Delta�s and Air France�s routes will come from Air France, which plans to reduce frequency on Heathrow�Paris flights now that there is greater competition from the Eurostar train, with journey times down to just 2 hours and 20 minutes from mid-November 2007 following the opening of the new high-speed link in the UK.
24 Air France-KLM
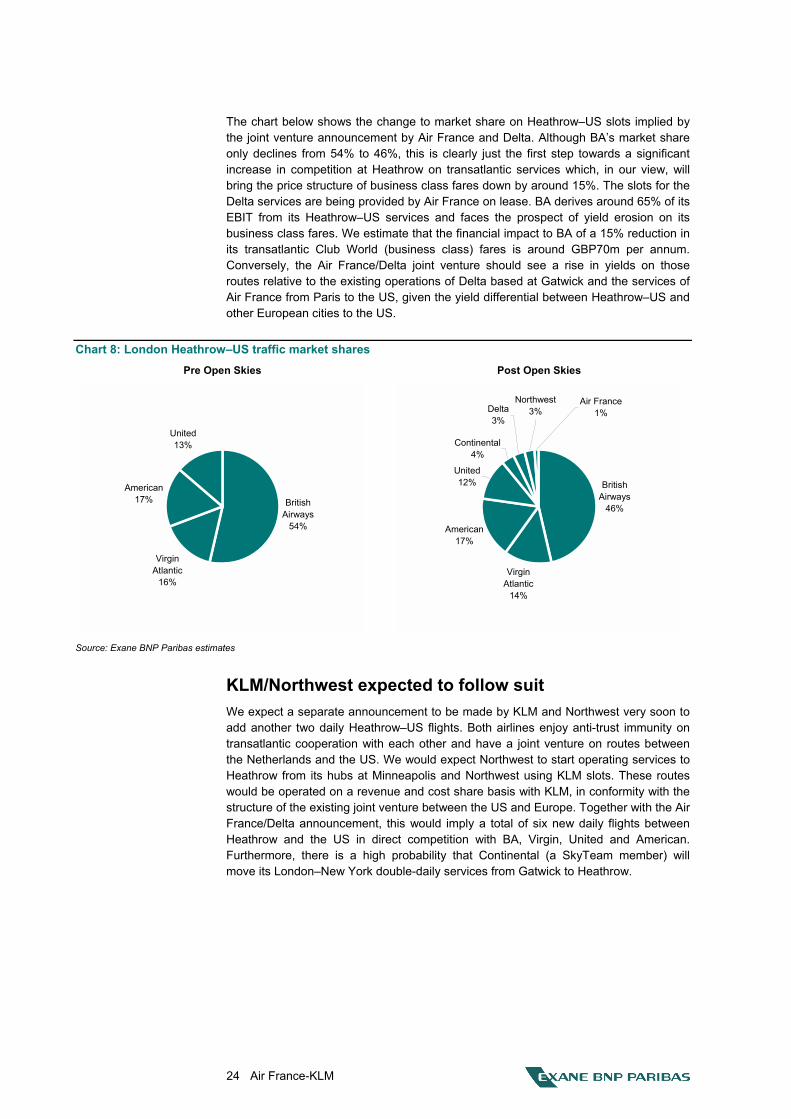
The chart below shows the change to market share on Heathrow�US slots implied by the joint venture announcement by Air France and Delta. Although BA�s market share only declines from 54% to 46%, this is clearly just the first step towards a significant increase in competition at Heathrow on transatlantic services which, in our view, will bring the price structure of business class fares down by around 15%. The slots for the Delta services are being provided by Air France on lease. BA derives around 65% of its EBIT from its Heathrow�US services and faces the prospect of yield erosion on its business class fares. We estimate that the financial impact to BA of a 15% reduction in its transatlantic Club World (business class) fares is around GBP70m per annum. Conversely, the Air France/Delta joint venture should see a rise in yields on those routes relative to the existing operations of Delta based at Gatwick and the services of Air France from Paris to the US, given the yield differential between Heathrow�US and other European cities to the US.
Chart 8: London Heathrow�US traffic market shares Pre Open Skies Post Open Skies
British Airways
54%
Virgin Atlantic
16%
American17%
United13%
British Airways
46%
Virgin Atlantic
14%
American17%
United12%
Continental4%
Delta3%
Air France1%
Northwest3%
Source: Exane BNP Paribas estimates
KLM/Northwest expected to follow suit We expect a separate announcement to be made by KLM and Northwest very soon to add another two daily Heathrow�US flights. Both airlines enjoy anti-trust immunity on transatlantic cooperation with each other and have a joint venture on routes between the Netherlands and the US. We would expect Northwest to start operating services to Heathrow from its hubs at Minneapolis and Northwest using KLM slots. These routes would be operated on a revenue and cost share basis with KLM, in conformity with the structure of the existing joint venture between the US and Europe. Together with the Air France/Delta announcement, this would imply a total of six new daily flights between Heathrow and the US in direct competition with BA, Virgin, United and American. Furthermore, there is a high probability that Continental (a SkyTeam member) will move its London�New York double-daily services from Gatwick to Heathrow.
25 Air France-KLM
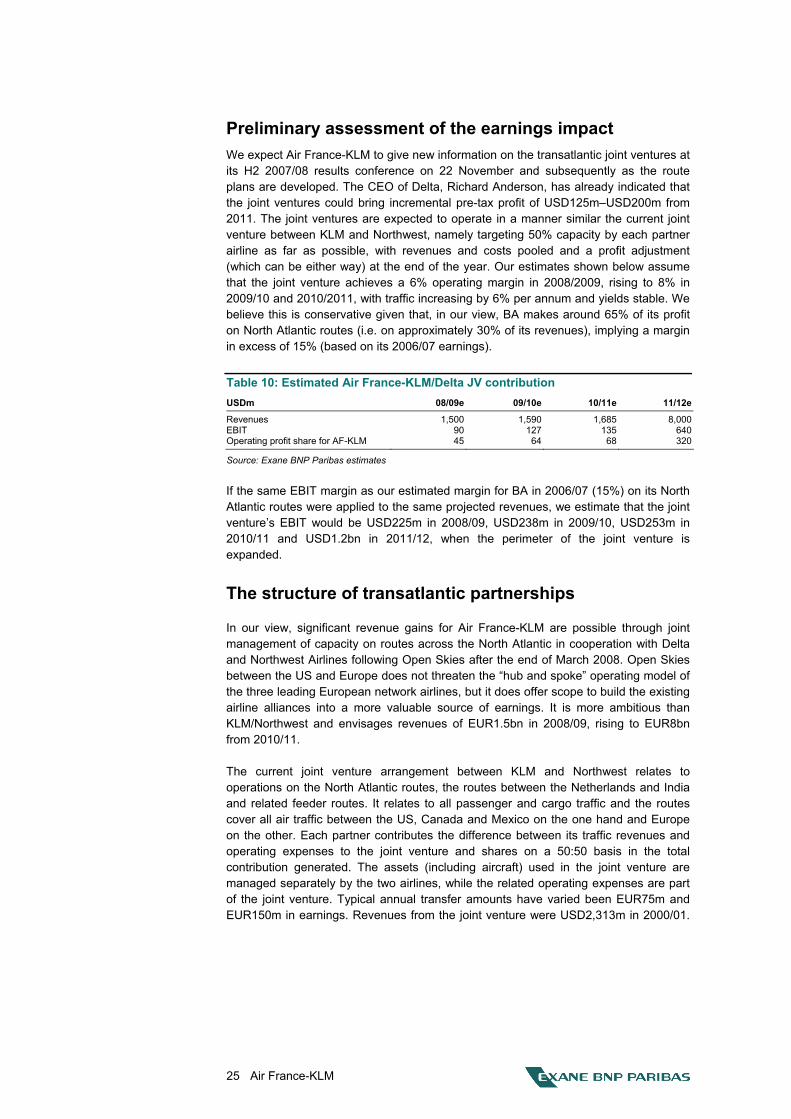
Preliminary assessment of the earnings impact We expect Air France-KLM to give new information on the transatlantic joint ventures at its H2 2007/08 results conference on 22 November and subsequently as the route plans are developed. The CEO of Delta, Richard Anderson, has already indicated that the joint ventures could bring incremental pre-tax profit of USD125m�USD200m from 2011. The joint ventures are expected to operate in a manner similar the current joint venture between KLM and Northwest, namely targeting 50% capacity by each partner airline as far as possible, with revenues and costs pooled and a profit adjustment (which can be either way) at the end of the year. Our estimates shown below assume that the joint venture achieves a 6% operating margin in 2008/2009, rising to 8% in 2009/10 and 2010/2011, with traffic increasing by 6% per annum and yields stable. We believe this is conservative given that, in our view, BA makes around 65% of its profit on North Atlantic routes (i.e. on approximately 30% of its revenues), implying a margin in excess of 15% (based on its 2006/07 earnings).
Table 10: Estimated Air France-KLM/Delta JV contribution USDm 08/09e 09/10e 10/11e 11/12e
Revenues 1,500 1,590 1,685 8,000EBIT 90 127 135 640Operating profit share for AF-KLM 45 64 68 320
Source: Exane BNP Paribas estimates
If the same EBIT margin as our estimated margin for BA in 2006/07 (15%) on its North Atlantic routes were applied to the same projected revenues, we estimate that the joint venture�s EBIT would be USD225m in 2008/09, USD238m in 2009/10, USD253m in 2010/11 and USD1.2bn in 2011/12, when the perimeter of the joint venture is expanded.
The structure of transatlantic partnerships
In our view, significant revenue gains for Air France-KLM are possible through joint management of capacity on routes across the North Atlantic in cooperation with Delta and Northwest Airlines following Open Skies after the end of March 2008. Open Skies between the US and Europe does not threaten the �hub and spoke� operating model of the three leading European network airlines, but it does offer scope to build the existing airline alliances into a more valuable source of earnings. It is more ambitious than KLM/Northwest and envisages revenues of EUR1.5bn in 2008/09, rising to EUR8bn from 2010/11.
The current joint venture arrangement between KLM and Northwest relates to operations on the North Atlantic routes, the routes between the Netherlands and India and related feeder routes. It relates to all passenger and cargo traffic and the routes cover all air traffic between the US, Canada and Mexico on the one hand and Europe on the other. Each partner contributes the difference between its traffic revenues and operating expenses to the joint venture and shares on a 50:50 basis in the total contribution generated. The assets (including aircraft) used in the joint venture are managed separately by the two airlines, while the related operating expenses are part of the joint venture. Typical annual transfer amounts have varied been EUR75m and EUR150m in earnings. Revenues from the joint venture were USD2,313m in 2000/01.
26 Air France-KLM
The relationship of Air France with Delta Air Lines was originally negotiated in June 1999. Air France�s alliance with Delta, which was followed by an �Open Skies� agreement between France and the US, expanded the number of connecting opportunities for Air France in the US from nine to 110 over a three-year period, drawing potential European passengers seeking US destinations away from competing networks and leading to an increase in Air France�s overall AEA market share at the time from 14% to 17%. The relationship was strengthened further following the granting of anti-trust immunity on North Atlantic routes in January 2002 to Air France and the other European SkyTeam members (Alitalia and CSA Czech Airlines) for their alliance with Delta on North Atlantic routes. Anti-trust immunity was extended to SkyTeam members, including Korean Airlines, on Pacific routes, in June 2002. KLM, Northwest and Continental Airlines became part of the SkyTeam Alliance in September 2004.
The prospect now is of intensification of the SkyTeam connections and shared anti-trust immunity, so as to reinforce the profitable network across the Atlantic from Amsterdam and Paris and extend its scope via joint ventures for example from Heathrow.
Background to the relationship with Alitalia
A joint venture has operated between Air France and Alitalia since April 2002, with a focus on the Italy�France �bundle� of routes. It is designed to optimise operating profits from passenger traffic between France and Italy by coordinating flight destinations and frequencies as well as aircraft types and crew rosters. J-C Spinetta (Air France-KLM�s President and CEO), joined the Board of Alitalia from 2002 and was a member until the first auction process was launched in 2006. He is therefore very well aware of the value of Alitalia (or lack of value, if the correct restructuring measures are not allowed to be taken).
On 30 September 2003, Air France, KLM and Alitalia entered into a tripartite agreement listing the conditions and principles under which to conduct a three-way commercial alliance.
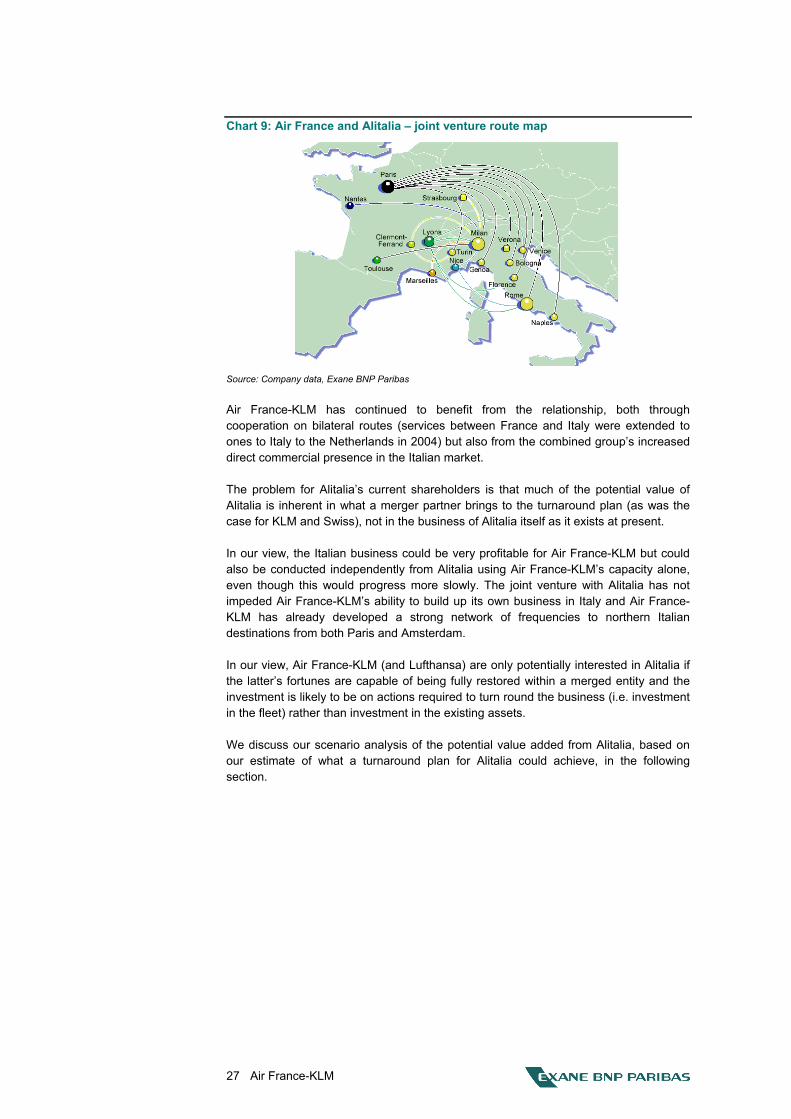
The original joint venture with Air France was cemented by the purchase of a 2% shareholding by each company in the other. It is focused on trunk routes into and out of Italy, on both premium and leisure traffic. As displayed in the chart that follows, these routes connect Alitalia�s twin hubs at Milan and Rome and other Italian cities with Paris-CDG, and also Air France�s secondary hubs at Lyon, and Marseilles. Point-to-point routes are also operated to major cities such as Toulouse, Nice and Strasbourg.
Air France and Alitalia also cooperate on long-haul business across the Paris hub, given the developing sophistication of Air France�s connecting network through Paris-CDG and Alitalia�s funding constraints and the relatively underdeveloped nature of its long-haul fleet network. The framework for sharing the economic benefits from joint ventures on specific routes was established in July 2001, with a profit-sharing formula of 60:40 in favour of Air France initially (reflecting its network contribution), reverting to 50:50 after three years.
27 Air France-KLM
Chart 9: Air France and Alitalia � joint venture route map
Source: Company data, Exane BNP Paribas
Air France-KLM has continued to benefit from the relationship, both through cooperation on bilateral routes (services between France and Italy were extended to ones to Italy to the Netherlands in 2004) but also from the combined group�s increased direct commercial presence in the Italian market.
The problem for Alitalia�s current shareholders is that much of the potential value of Alitalia is inherent in what a merger partner brings to the turnaround plan (as was the case for KLM and Swiss), not in the business of Alitalia itself as it exists at present.
In our view, the Italian business could be very profitable for Air France-KLM but could also be conducted independently from Alitalia using Air France-KLM�s capacity alone, even though this would progress more slowly. The joint venture with Alitalia has not impeded Air France-KLM�s ability to build up its own business in Italy and Air France-KLM has already developed a strong network of frequencies to northern Italian destinations from both Paris and Amsterdam.
In our view, Air France-KLM (and Lufthansa) are only potentially interested in Alitalia if the latter�s fortunes are capable of being fully restored within a merged entity and the investment is likely to be on actions required to turn round the business (i.e. investment in the fleet) rather than investment in the existing assets.
We discuss our scenario analysis of the potential value added from Alitalia, based on our estimate of what a turnaround plan for Alitalia could achieve, in the following section.
28 Air France-KLM
Airline acquisitions: risk/return trade-off
Air France-KLM has stated that it is open to new consolidation opportunities, as it is now clear from Air France�s merger with KLM and the takeover of Swiss International by Lufthansa that full synergies in Europe�s airline business can only be delivered through mergers, with immediate and substantial benefits in terms of revenue synergies and improvements in asset utilisation, followed by both revenue and cost synergies over several years following such mergers. Consolidation activity so far has shown that the scale effects and improved asset utilisation have a positive impact on average margins. In our view, the competitive environment after Open Skies will put great pressure on smaller airlines with limited networks to seek to merge with larger partners, which have bigger scale and stronger balance sheets. For Air France-KLM, the successful merger with KLM has given the group considerable integration experience and we expect this to be deployed by its participation in further consolidation.
Alitalia or Iberia, it�s a buyers� market
The most immediate consolidation targets in the European airline industry (excluding low-cost carriers) are Alitalia and Iberia, both of which have been put up for sale. We expect that Austrian Airlines and SAS will attempt to negotiate entry into one of the larger airline groups once their current restructuring programmes are at, or near, completion. There has been some concern that Air France-KLM might overpay for these assets in order to obtain market share.
In our view, there is no need for Air France-KLM to overpay for either company. Indeed, J-C Spinetta (the group�s President and CEO) has said that he would not do a deal that was not in the interests of shareholders. Moreover, he has further committed that any deal should not jeopardise the group�s ability to achieve its 2009/10 post-tax ROCE target of 8.5%. Each of the two airlines, Alitalia and Iberia, represents a different and specific business opportunity and we believe it is worth reviewing the history of engagement and the potential synergies and NPV benefits that we estimate can accrue to Air France-KLM from each consolidation opportunity.
A summary of our analysis is set out in the table below. This shows that the potential NPV benefits, based on our assumptions of the potential acquisition price, would be greater for a merger of Air France-KLM with Alitalia than for a merger of Air France-KLM with Iberia. Closer cooperation on a multilateral basis (rather than the present, separate bilateral relationships between Air France and Delta and KLM and Northwest) is a �win-win� situation which we estimate could potentially generate synergy benefits of EUR625m for a merged Air France-KLM/Alitalia entity.
Table 11: Potential merger with Iberia or Alitalia � estimated merger synergies EURm Year one Year two Year three Total
Estimated Air France-KLM/Iberia synergies 92 188 120 400Discount applied at 7.5% 0.86 0.80 0.75 Discounted synergies 79 150 90 319Value per share to Air France-KLM (EUR) 1.06 Estimated Air France-KLM/Alitalia synergies 100 297 228 625Discount applied at 7.5% 0.86 0.80 0.75 Discounted synergies 86 238 171 495Value per share to Air France-KLM (EUR) 1.65
Source: Exane BNP Paribas estimates
This is not included in our valuation and target price but shows the potential upside to the share price if consolidation moves can be managed successfully.
29 Air France-KLM
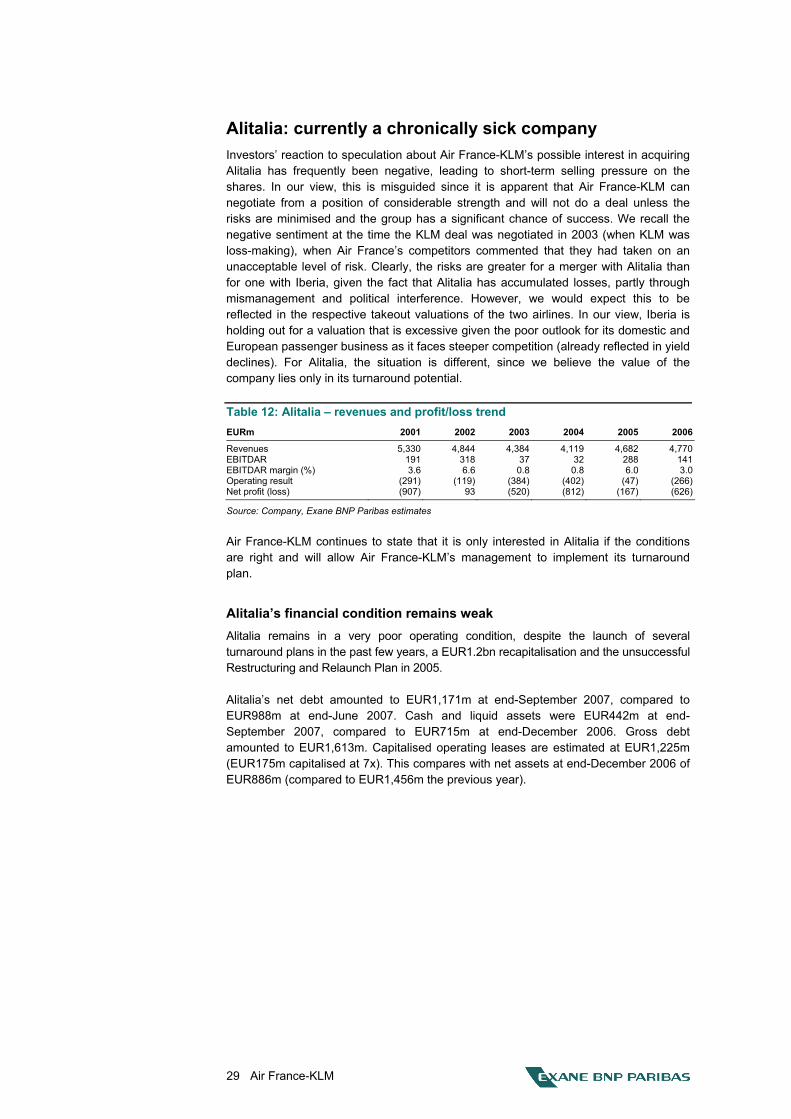
Alitalia: currently a chronically sick company Investors� reaction to speculation about Air France-KLM�s possible interest in acquiring Alitalia has frequently been negative, leading to short-term selling pressure on the shares. In our view, this is misguided since it is apparent that Air France-KLM can negotiate from a position of considerable strength and will not do a deal unless the risks are minimised and the group has a significant chance of success. We recall the negative sentiment at the time the KLM deal was negotiated in 2003 (when KLM was loss-making), when Air France�s competitors commented that they had taken on an unacceptable level of risk. Clearly, the risks are greater for a merger with Alitalia than for one with Iberia, given the fact that Alitalia has accumulated losses, partly through mismanagement and political interference. However, we would expect this to be reflected in the respective takeout valuations of the two airlines. In our view, Iberia is holding out for a valuation that is excessive given the poor outlook for its domestic and European passenger business as it faces steeper competition (already reflected in yield declines). For Alitalia, the situation is different, since we believe the value of the company lies only in its turnaround potential.
Table 12: Alitalia � revenues and profit/loss trend EURm 2001 2002 2003 2004 2005 2006
Revenues 5,330 4,844 4,384 4,119 4,682 4,770EBITDAR 191 318 37 32 288 141EBITDAR margin (%) 3.6 6.6 0.8 0.8 6.0 3.0Operating result (291) (119) (384) (402) (47) (266)Net profit (loss) (907) 93 (520) (812) (167) (626)
Source: Company, Exane BNP Paribas estimates
Air France-KLM continues to state that it is only interested in Alitalia if the conditions are right and will allow Air France-KLM�s management to implement its turnaround plan.
Alitalia�s financial condition remains weak Alitalia remains in a very poor operating condition, despite the launch of several turnaround plans in the past few years, a EUR1.2bn recapitalisation and the unsuccessful Restructuring and Relaunch Plan in 2005.
Alitalia�s net debt amounted to EUR1,171m at end-September 2007, compared to EUR988m at end-June 2007. Cash and liquid assets were EUR442m at end-September 2007, compared to EUR715m at end-December 2006. Gross debt amounted to EUR1,613m. Capitalised operating leases are estimated at EUR1,225m (EUR175m capitalised at 7x). This compares with net assets at end-December 2006 of EUR886m (compared to EUR1,456m the previous year).
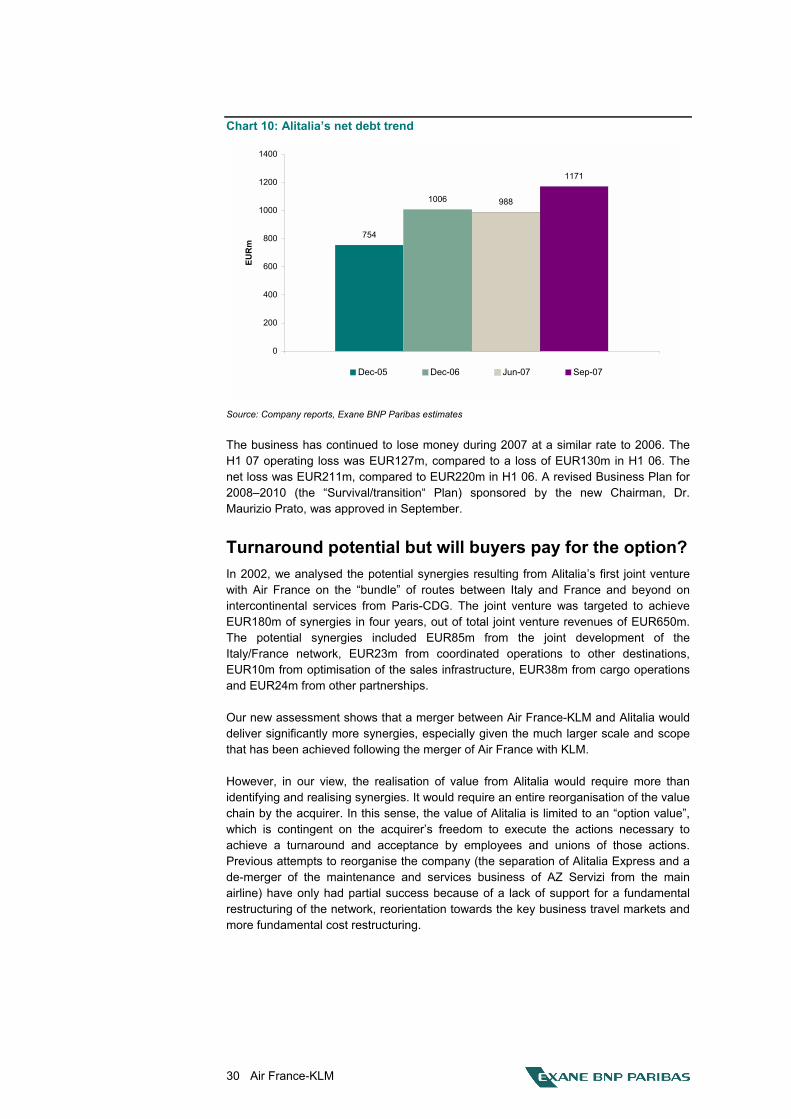
30 Air France-KLM
Chart 10: Alitalia�s net debt trend
754
1006 988
1171
0
200
400
600
800
1000
1200
1400
1
EUR
m
Dec-05 Dec-06 Jun-07 Sep-07
Source: Company reports, Exane BNP Paribas estimates
The business has continued to lose money during 2007 at a similar rate to 2006. The H1 07 operating loss was EUR127m, compared to a loss of EUR130m in H1 06. The net loss was EUR211m, compared to EUR220m in H1 06. A revised Business Plan for 2008�2010 (the �Survival/transition� Plan) sponsored by the new Chairman, Dr. Maurizio Prato, was approved in September.
Turnaround potential but will buyers pay for the option? In 2002, we analysed the potential synergies resulting from Alitalia�s first joint venture with Air France on the �bundle� of routes between Italy and France and beyond on intercontinental services from Paris-CDG. The joint venture was targeted to achieve EUR180m of synergies in four years, out of total joint venture revenues of EUR650m. The potential synergies included EUR85m from the joint development of the Italy/France network, EUR23m from coordinated operations to other destinations, EUR10m from optimisation of the sales infrastructure, EUR38m from cargo operations and EUR24m from other partnerships.
Our new assessment shows that a merger between Air France-KLM and Alitalia would deliver significantly more synergies, especially given the much larger scale and scope that has been achieved following the merger of Air France with KLM.
However, in our view, the realisation of value from Alitalia would require more than identifying and realising synergies. It would require an entire reorganisation of the value chain by the acquirer. In this sense, the value of Alitalia is limited to an �option value�, which is contingent on the acquirer�s freedom to execute the actions necessary to achieve a turnaround and acceptance by employees and unions of those actions. Previous attempts to reorganise the company (the separation of Alitalia Express and a de-merger of the maintenance and services business of AZ Servizi from the main airline) have only had partial success because of a lack of support for a fundamental restructuring of the network, reorientation towards the key business travel markets and more fundamental cost restructuring.
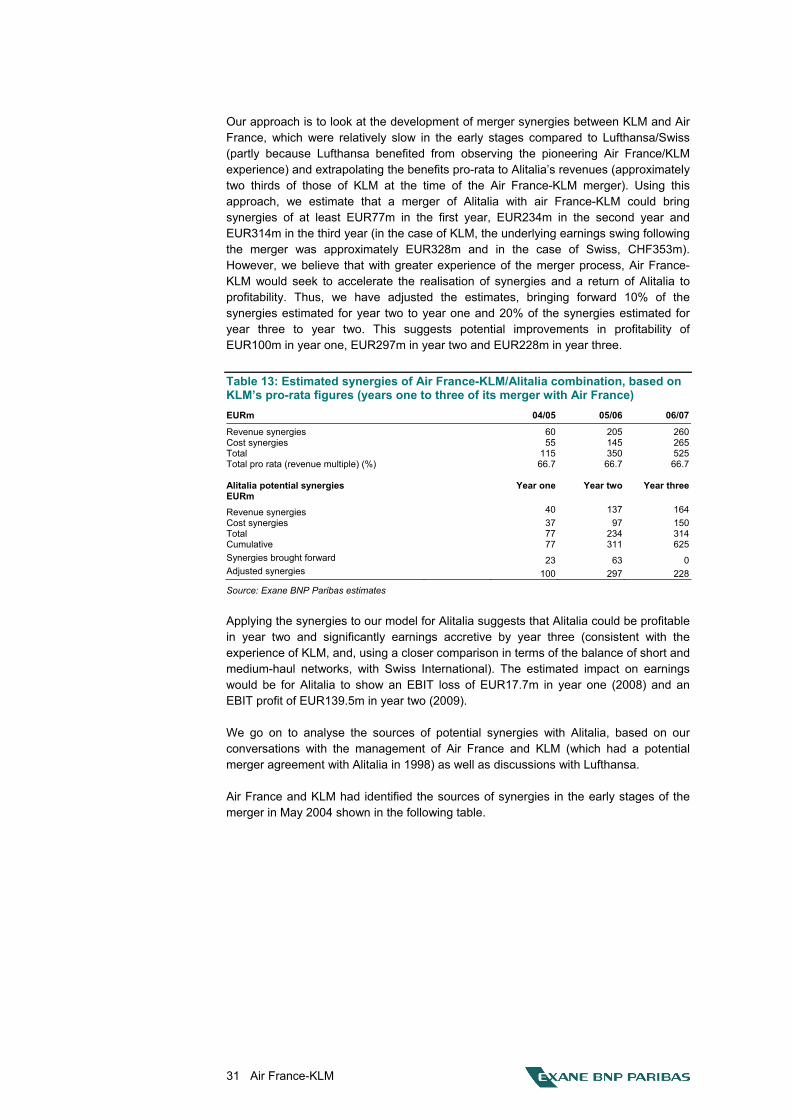
31 Air France-KLM
Our approach is to look at the development of merger synergies between KLM and Air France, which were relatively slow in the early stages compared to Lufthansa/Swiss (partly because Lufthansa benefited from observing the pioneering Air France/KLM experience) and extrapolating the benefits pro-rata to Alitalia�s revenues (approximately two thirds of those of KLM at the time of the Air France-KLM merger). Using this approach, we estimate that a merger of Alitalia with air France-KLM could bring synergies of at least EUR77m in the first year, EUR234m in the second year and EUR314m in the third year (in the case of KLM, the underlying earnings swing following the merger was approximately EUR328m and in the case of Swiss, CHF353m). However, we believe that with greater experience of the merger process, Air France-KLM would seek to accelerate the realisation of synergies and a return of Alitalia to profitability. Thus, we have adjusted the estimates, bringing forward 10% of the synergies estimated for year two to year one and 20% of the synergies estimated for year three to year two. This suggests potential improvements in profitability of EUR100m in year one, EUR297m in year two and EUR228m in year three.
Table 13: Estimated synergies of Air France-KLM/Alitalia combination, based on KLM�s pro-rata figures (years one to three of its merger with Air France) EURm 04/05 05/06 06/07
Revenue synergies 60 205 260Cost synergies 55 145 265Total 115 350 525Total pro rata (revenue multiple) (%) 66.7 66.7 66.7 Alitalia potential synergies Year one Year two Year threeEURm Revenue synergies 40 137 164Cost synergies 37 97 150Total 77 234 314Cumulative 77 311 625Synergies brought forward 23 63 0Adjusted synergies 100 297 228
Source: Exane BNP Paribas estimates
Applying the synergies to our model for Alitalia suggests that Alitalia could be profitable in year two and significantly earnings accretive by year three (consistent with the experience of KLM, and, using a closer comparison in terms of the balance of short and medium-haul networks, with Swiss International). The estimated impact on earnings would be for Alitalia to show an EBIT loss of EUR17.7m in year one (2008) and an EBIT profit of EUR139.5m in year two (2009).
We go on to analyse the sources of potential synergies with Alitalia, based on our conversations with the management of Air France and KLM (which had a potential merger agreement with Alitalia in 1998) as well as discussions with Lufthansa.
Air France and KLM had identified the sources of synergies in the early stages of the merger in May 2004 shown in the following table.
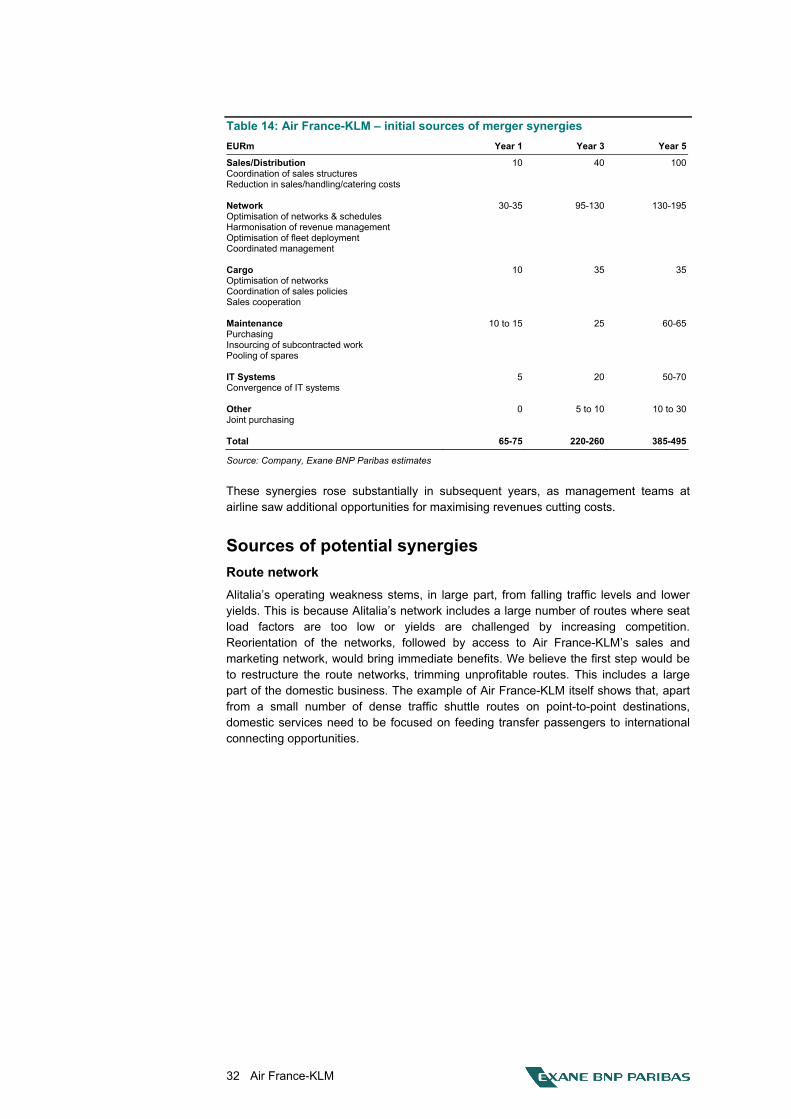
32 Air France-KLM
Table 14: Air France-KLM � initial sources of merger synergies EURm Year 1 Year 3 Year 5
Sales/Distribution 10 40 100Coordination of sales structures Reduction in sales/handling/catering costs Network 30-35 95-130 130-195Optimisation of networks & schedules Harmonisation of revenue management Optimisation of fleet deployment Coordinated management Cargo 10 35 35Optimisation of networks Coordination of sales policies Sales cooperation Maintenance 10 to 15 25 60-65Purchasing Insourcing of subcontracted work Pooling of spares IT Systems 5 20 50-70Convergence of IT systems Other 0 5 to 10 10 to 30Joint purchasing Total 65-75 220-260 385-495
Source: Company, Exane BNP Paribas estimates
These synergies rose substantially in subsequent years, as management teams at airline saw additional opportunities for maximising revenues cutting costs.
Sources of potential synergies
Route network Alitalia�s operating weakness stems, in large part, from falling traffic levels and lower yields. This is because Alitalia�s network includes a large number of routes where seat load factors are too low or yields are challenged by increasing competition. Reorientation of the networks, followed by access to Air France-KLM�s sales and marketing network, would bring immediate benefits. We believe the first step would be to restructure the route networks, trimming unprofitable routes. This includes a large part of the domestic business. The example of Air France-KLM itself shows that, apart from a small number of dense traffic shuttle routes on point-to-point destinations, domestic services need to be focused on feeding transfer passengers to international connecting opportunities.
33 Air France-KLM
Hub selection It is difficult to see a full-scale mega-hub becoming established in Italy following the creation of comprehensive links by Lufthansa between individual north Italian cities and Frankfurt and Munich (and prospectively Zurich) and competing networks established by Air France and KLM through Paris and Amsterdam respectively. The capital expenditure on long-haul fleet required to establish a fully competing long-haul hub and spoke network based on Milan or Rome would be enormous and also uneconomic. Rome also faces the problem that it is primarily a major destination for tourism and visits to the Vatican, etc., but not a major centre of business. In our view, the most efficient system would be to link Milan and Rome more closely with Amsterdam and Paris in order to improve the destination network and frequencies for Italian business travellers, while restricting long-haul point-to-point services to those destinations with heavy natural traffic flows.
Benefits from larger corporate accounts/Frequent Flyer Programmes As we saw from the KLM merger (and are also seeing in the case of Swiss at Lufthansa), many of the synergy benefits from airline mergers result from the advantages that the larger partner brings in terms of balance sheet strength (enabling fleet modernisation and improved fuel hedge cover, as well as lower debt financing costs), access to Europe-wide corporate accounts and a leveraging of the worldwide schedules and network of destinations. This is likely to lead to significant improvements in seat load factors and rising asset utilisation.
Fleet changes Major savings could be derived from fleet changes. The ability to improve the fleet�s cost structure and suitability was one of principal reasons why KLM actively sought a merger in 2003. The fleet age and structure of Alitalia is significantly worse than that of KLM in 2003, and thus the potential earnings leverage from an overhaul of the fleet is even higher, in our view, even if the management challenges are also significantly greater. Alitalia has a fleet of 30 long-haul aircraft (at end-December 2006), including 10 B777s, 15 B767s and 5 cargo MD11s, along with 156 short or medium-haul aircraft. At end-December 2003, KLM had a fleet of 54 long-haul aircraft (22 B747-400s, 2 B747 freighters, 4 B747-300s, 4 B777-200 ERs, 10 MD11s and 12 B767-300ERs) and 70 medium-haul aircraft, mainly of the B737 family plus 54 regional aircraft. Following the merger with Air France, KLM undertook an active fleet replacement programme focused on the long-haul aircraft (predominantly replacing 2 engine B777s with older 4 engine B747s). This had a strongly positive effect on both asset utilisation and fuel costs. Alitalia has the problem of having too many aircraft types (12 types) which increase maintenance and pilot training costs. It also has a large number of old aircraft, especially 70 Boeing MD-82s and several cargo MD11s which have a high degree of fuel inefficiency.
Fuel cost hedging At present, Alitalia�s fuel hedging programme is weak. Hedge cover negotiated under the Air France-KLM umbrella would lead to lower actual fuel costs, as was evident, for example, from the hedge cover extended to Swiss International by Lufthansa (KLM already had an effective hedge programme when it merged with Air France but the structure was further improved by combining the best practices of both airlines).
34 Air France-KLM
Maintenance and depreciation Alitalia�s maintenance and depreciation costs would appear to be significantly higher than those of its peers. At present, Alitalia�s aged fleet is maintained by AZ Servizi under what appear to be highly-priced contracts. Switching these contracts to Air France-KLM�s maintenance and engineering or to outside contractors would provide immediate benefits.
Information technology Information technology is a major potential source of revenue and cost synergies. We believe that rapid advances could be made in this area, given the extensive work on technology integration done by teams from Air France and KLM in the last few years and the current migration of KLM�s system to Amadeus-based applications.
Purchasing/contract renegotiation The separation of Air Servizi from Alitalia�s airline operations has had a positive effect on staffing, reducing personnel from 18,780 at the end of 2005 to 11,465 at the end of 2006. However, Alitalia has been saddled with continuing handling and services contracts with Air Servizi, which we believe are on highly disadvantageous terms. Cancellation of these contracts and an open tender for the materials and services would assist greatly to create a firm platform for profitability.
Personnel/productivity improvements Trimming the workforce through restructuring has exchanged direct labour costs for indirect labour costs (through services contracts with AZ Servizi). Alitalia�s productivity levels in the passenger business are lower than its peers and significant changes would need to be made to working practices, as well as a reduction of headcount.
Financing costs
Financing costs would be reduced given the much stronger credit status and lower debt financing costs of Air France and KLM. Alitalia�s fleet rental costs are significantly higher than its peers, which we believe relates to the cost of operating leases following the sale and leasebacks in times of difficulty, when Alitalia was attempting to raise cash prior to the capital raising. Refinancing of a large proportion of the operating leases could provide substantial savings.
Sales/marketing costs Our analysis indicates that Alitalia has exceptionally high sales/marketing costs per passenger. These could be reduced significantly by joining the Air France-KLM distribution system. In our view, the greater selling power of a larger network with more frequencies would lift quickly the passenger revenues of Alitalia, currently one of the main problems of its operations.
Best-case scenario: valuation of EUR0.42 per share Our analysis, using the assumptions about possible synergies, shows that a turnaround of Alitalia is possible by a larger airline group such as Air France-KLM giving a DCF valuation for Alitalia�s equity of EUR576m or EUR0.42 per share. It should be emphasized that this is not the value which we believe Air France-KLM would pay for Alitalia but the value which, on best base assumptions, could be created by Air France-KLM for their shareholders (the shareholders of the enlarged Group) if management time and capital is invested in a turnaround.
35 Air France-KLM
Worst-case scenario: zero value In our view, the worst-case scenario would be that the Italian government would not allow an acquirer the freedom to make the changes necessary to achieve a turnaround and Alitalia�s employees and labour unions would not cooperate with a turnaround plan, Alitalia would continue to lose passengers, the operating losses would continue and the airline would be closed down. Our assumption is that Alitalia will not be able to achieve a turnaround on its own, as the main requirement is for a business plan based on the needs of Italian businessmen for efficient airline connections to the rest of the world, rather than for one that would compete head-to-head with low-cost airlines on short-haul routes, a strategy which can never succeed. Our worst-case scenario is that Alitalia�s liabilities could exceed its assets (net debt of EUR1,171m plus average closure costs of EUR100,000 per employee multiplied by 11,465 employees, so totalling EUR1,146m) plus a provision of EUR100m for termination of the Servizi contracts, implying total liabilities of EUR2.4bn. This would compare to fleet assets and property on the balance sheet of EUR2.34bn (before taking into account the necessary fire-sale discount).
Possible deal structure Given the risks of the worst-case scenario materialising, we believe the approach taken by a possible acquirer of Alitalia, whether this is Air France-KLM or another airline, is likely to be to shift the financial risks as far as possible onto the Italian government and other existing shareholders.
As in the case of the performance-related Earnout bond used in the Swiss International takeover by Lufthansa, or the warrant incentive offered by the new Air France-KLM holding company to KLM shareholders, a large part of the payment for Alitalia would probably be on a deferred or performance basis, with management time and investment in fleet assets, for example, being the main immediate contribution, rather than cash. This would minimise the financial risks while offering significant upside potential.
Iberia: main risk is overpaying
The situation in respect of Iberia is completely different from that of Alitalia. We believe the potential NPV benefits to Air France-KLM from an acquisition of Iberia could be lower than from an acquisition of Alitalia. The main reason for this is that there are more overlaps between Iberia and Air France-KLM in respect of Iberia�s most valuable business, namely the Europe-Latin America network and we believe these are already priced into the company�s market value. Approximately one third of Iberia�s flight revenues (but most of its profits) are derived from routes to Latin America, one third are derived from domestic airline operations and one third come from medium-haul flights to Europe and North Africa. The other main factor restraining value creation from Iberia is that it is a profitable and relatively well-managed business, even if a large part of its business is in slow decline as competition from low-cost carriers increases. Iberia can therefore currently justify higher acquisition multiples than Alitalia, where by contrast a restoration of profitability is dependent on the successful management of integration by an external partner such as Air France-KLM.
36 Air France-KLM
Iberia is in good health but with peaking earnings
While Iberia has a solid and sustainable business in its strong long-haul network to Central and South America, we would ascribe little value to the airline�s domestic and medium-haul passenger airline businesses, which face strong competition from low-cost carriers. However, Air France-KLM also has its own strong business to Latin America and can continue to build this organically, with limited risk. This limits the potential for synergies and in our view, Air France-KLM is only likely to participate in an auction of Iberia if the main financial risk is taken on by third parties. A possible scenario in this case would be for Air France-KLM to be a minority investor with limited financial exposure together with Spanish or other co-investors, who would be the main financial investors. On a pure operating basis, we value Iberia at no more than EUR3.04 per share (EUR2.70 per share in intrinsic value through the DCF approach, plus EUR0.34 per share in possible synergies). We therefore see a bid for Iberia significantly above EUR3 per share as being highly unlikely, with the risks of erosion of its domestic and medium-haul businesses through competition with low-cost carriers continuing to rise. Iberia needs to operate within the framework of a larger-scale airline organisation, as we believe its own management recognises.
Based on a scenario where Air France-KLM would pay about EUR2.89bn (equating to EUR3.04 per share) for Iberia�s equity and would absorb the company�s EUR2.6bn of net debt (including capitalised operating leases), we see the potential for value creation in NPV terms for Air France-KLM at EUR319m. We summarise this in the table that follows.
Table 15: Estimated synergies of an Air France-KLM/Iberia combination EURm Year 1 Year 2 Year 3 TotalAir France-KLM synergies 115 235 150 500Estimated Air France-KLM/Iberia synergies 92 188 120 400 Discount applied at 7.5% 0.86 0.80 0.75 Discounted revenue synergies 79 150 90 319Value per share (EUR) 0.34Standalone value of Iberia (with property) (EUR) 2.70Value of Iberia with synergies (EUR) 3.04
Source: Exane BNP Paribas estimates
We have assumed that there would be greater overlaps between the businesses of Air France and Iberia which would require a reduction of services by competition regulators. We therefore estimate only 80% of the merger synergies to Air France-KLM, to arrive at a discounted total of EUR319m or EUR0.34 per share. Based on our standalone DCF valuation for Iberia of EUR2.70 per share, this implies that a deal could be value accretive for Air France-KLM at up to EUR3.04 per share. The risks would be significantly lower than a deal with Alitalia. Nevertheless, the upside would be limited to any future organic growth and the structure of the financing of any deal.
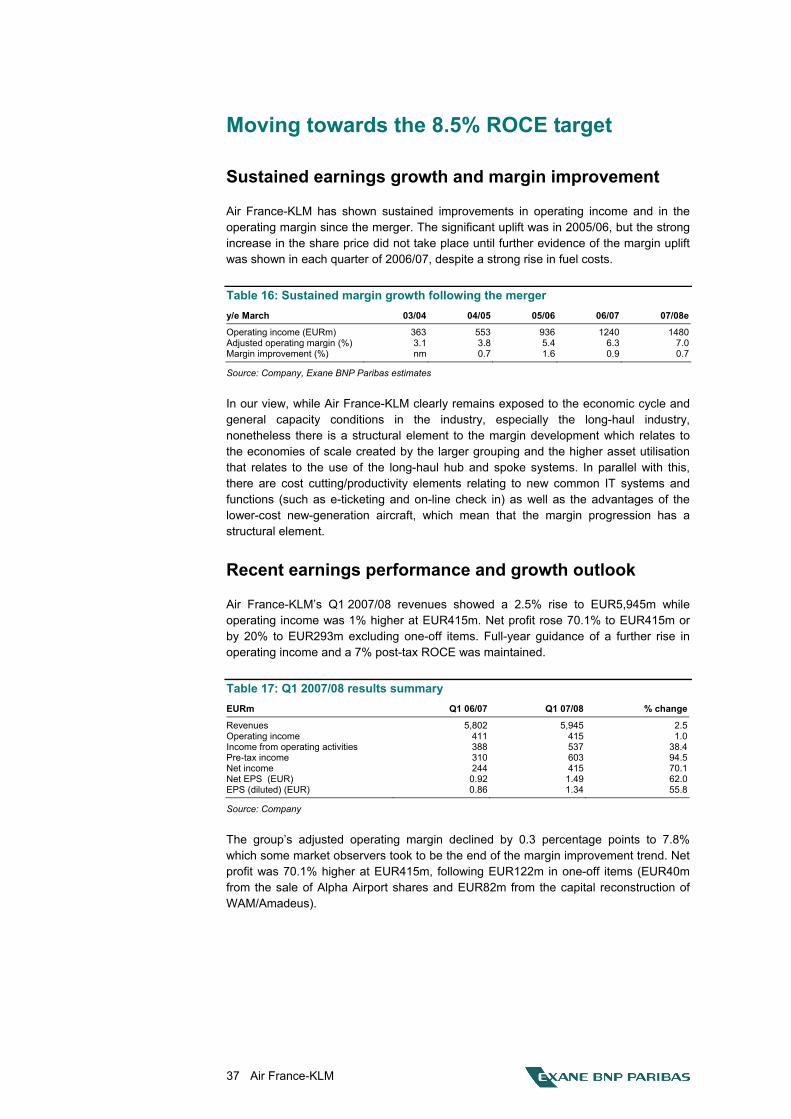
37 Air France-KLM
Moving towards the 8.5% ROCE target
Sustained earnings growth and margin improvement
Air France-KLM has shown sustained improvements in operating income and in the operating margin since the merger. The significant uplift was in 2005/06, but the strong increase in the share price did not take place until further evidence of the margin uplift was shown in each quarter of 2006/07, despite a strong rise in fuel costs.
Table 16: Sustained margin growth following the merger y/e March 03/04 04/05 05/06 06/07 07/08e
Operating income (EURm) 363 553 936 1240 1480Adjusted operating margin (%) 3.1 3.8 5.4 6.3 7.0Margin improvement (%) nm 0.7 1.6 0.9 0.7
Source: Company, Exane BNP Paribas estimates
In our view, while Air France-KLM clearly remains exposed to the economic cycle and general capacity conditions in the industry, especially the long-haul industry, nonetheless there is a structural element to the margin development which relates to the economies of scale created by the larger grouping and the higher asset utilisation that relates to the use of the long-haul hub and spoke systems. In parallel with this, there are cost cutting/productivity elements relating to new common IT systems and functions (such as e-ticketing and on-line check in) as well as the advantages of the lower-cost new-generation aircraft, which mean that the margin progression has a structural element.
Recent earnings performance and growth outlook
Air France-KLM�s Q1 2007/08 revenues showed a 2.5% rise to EUR5,945m while operating income was 1% higher at EUR415m. Net profit rose 70.1% to EUR415m or by 20% to EUR293m excluding one-off items. Full-year guidance of a further rise in operating income and a 7% post-tax ROCE was maintained.
Table 17: Q1 2007/08 results summary EURm Q1 06/07 Q1 07/08 % change
Revenues 5,802 5,945 2.5Operating income 411 415 1.0Income from operating activities 388 537 38.4Pre-tax income 310 603 94.5Net income 244 415 70.1Net EPS (EUR) 0.92 1.49 62.0EPS (diluted) (EUR) 0.86 1.34 55.8
Source: Company
The group�s adjusted operating margin declined by 0.3 percentage points to 7.8% which some market observers took to be the end of the margin improvement trend. Net profit was 70.1% higher at EUR415m, following EUR122m in one-off items (EUR40m from the sale of Alpha Airport shares and EUR82m from the capital reconstruction of WAM/Amadeus).
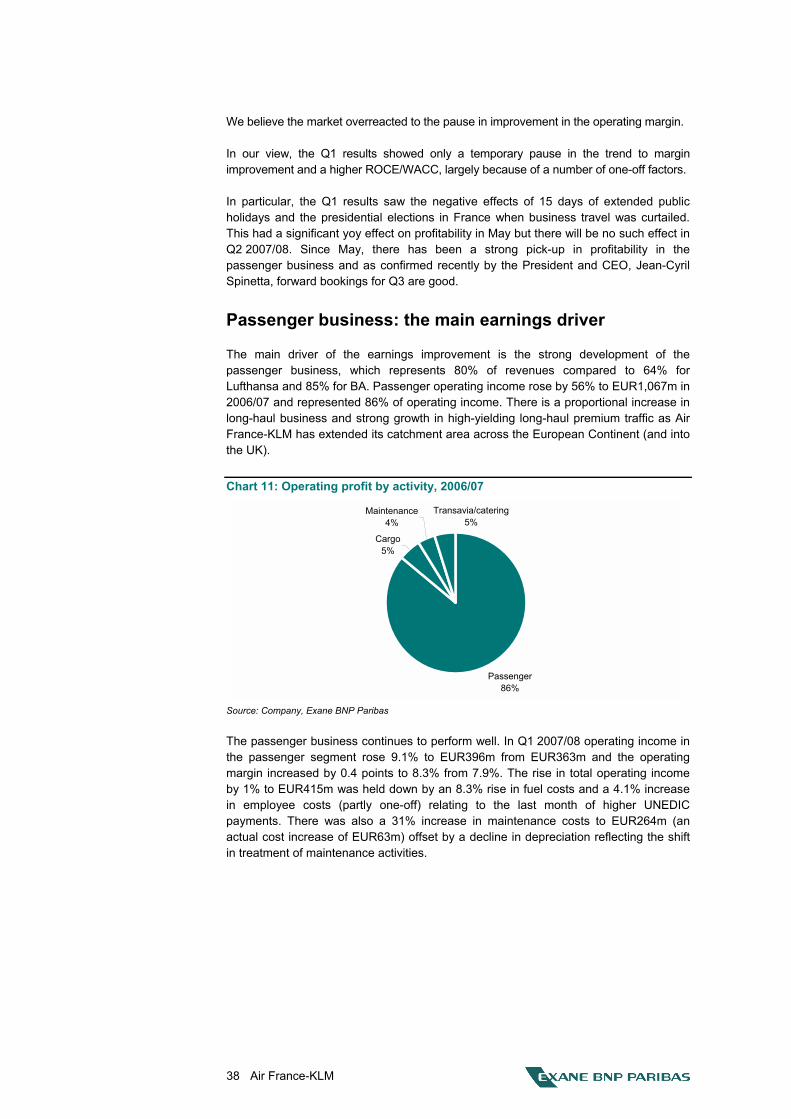
38 Air France-KLM
We believe the market overreacted to the pause in improvement in the operating margin.
In our view, the Q1 results showed only a temporary pause in the trend to margin improvement and a higher ROCE/WACC, largely because of a number of one-off factors.
In particular, the Q1 results saw the negative effects of 15 days of extended public holidays and the presidential elections in France when business travel was curtailed. This had a significant yoy effect on profitability in May but there will be no such effect in Q2 2007/08. Since May, there has been a strong pick-up in profitability in the passenger business and as confirmed recently by the President and CEO, Jean-Cyril Spinetta, forward bookings for Q3 are good.
Passenger business: the main earnings driver
The main driver of the earnings improvement is the strong development of the passenger business, which represents 80% of revenues compared to 64% for Lufthansa and 85% for BA. Passenger operating income rose by 56% to EUR1,067m in 2006/07 and represented 86% of operating income. There is a proportional increase in long-haul business and strong growth in high-yielding long-haul premium traffic as Air France-KLM has extended its catchment area across the European Continent (and into the UK).
Chart 11: Operating profit by activity, 2006/07
Passenger86%
Cargo5%
Maintenance4%
Transavia/catering5%
Source: Company, Exane BNP Paribas
The passenger business continues to perform well. In Q1 2007/08 operating income in the passenger segment rose 9.1% to EUR396m from EUR363m and the operating margin increased by 0.4 points to 8.3% from 7.9%. The rise in total operating income by 1% to EUR415m was held down by an 8.3% rise in fuel costs and a 4.1% increase in employee costs (partly one-off) relating to the last month of higher UNEDIC payments. There was also a 31% increase in maintenance costs to EUR264m (an actual cost increase of EUR63m) offset by a decline in depreciation reflecting the shift in treatment of maintenance activities.
39 Air France-KLM
Other divisions: mixed earnings performance
The profit performance of the other divisions, which represent 20% of revenues and 14% of operating profit, was mixed. Cargo performed poorly, continuing the downturn in profitability shown in Q3. Full-year cargo earnings fell by 63% from EUR166m to EUR62m. This will be countered with planned reductions in capacity and replacement of high fuel cost with lower fuel-burning aircraft. Maintenance showed a yoy decline in profitability to EUR40m from EUR54m but Catering and Transavia doubled profits to EUR67m from EUR30m. Transavia�s new joint venture with Air France from Paris is already showing considerable promise in terms of bookings and web �hits�.
Cargo outlook is improving Cargo�s performance (12.6% of revenues, 5% of operating profit) has remained weak, as yields remain low and the price of fuel makes older aircraft uneconomic. In 2006, trade growth on Asian routes was 8%, ocean freight grew by 16% but air freight rose by only 4%. Remedial action is therefore being taken by Air France-KLM�s cargo management. This involves reductions in cargo capacity and a re-examination of the strategic options for the medium term such as a focus on higher value-added Express business, B777-300s to replace B747 combis, interim use of MD11 freighter aircraft and a bigger focus on belly capacity.
In Q1 2007/08 there was continuing weak performance in Cargo, and the net currency effect on operating profit was worse than usual. Cargo revenues declined 5.5% and the operating profit in Cargo went from a profit of EUR28m to a EUR17m loss. However, signs of a recovery have already become apparent in July. Currency effects, mainly the weaker dollar reduced the yield expressed in unit revenue per EASK by 2.7% from a positive 1.8% to a negative 0.9% and because of the structure of the fuel hedge position there was less of a corresponding benefit to USD-priced fuel costs.
ROCE target achieved earlier than anticipated
As a result of the underlying business improvement, Air France-KLM is reaching its 7% post-tax ROCE target far earlier than expected and at a lower EBIT margin than anticipated. The trend is for a further improvement this year to 7% after 6.5% in 2006/07. The target for 2009/10 is for a post-tax ROCE of 8.5%. We examine below the synergy and cost-cutting developments that continue to support the improvements in margins.
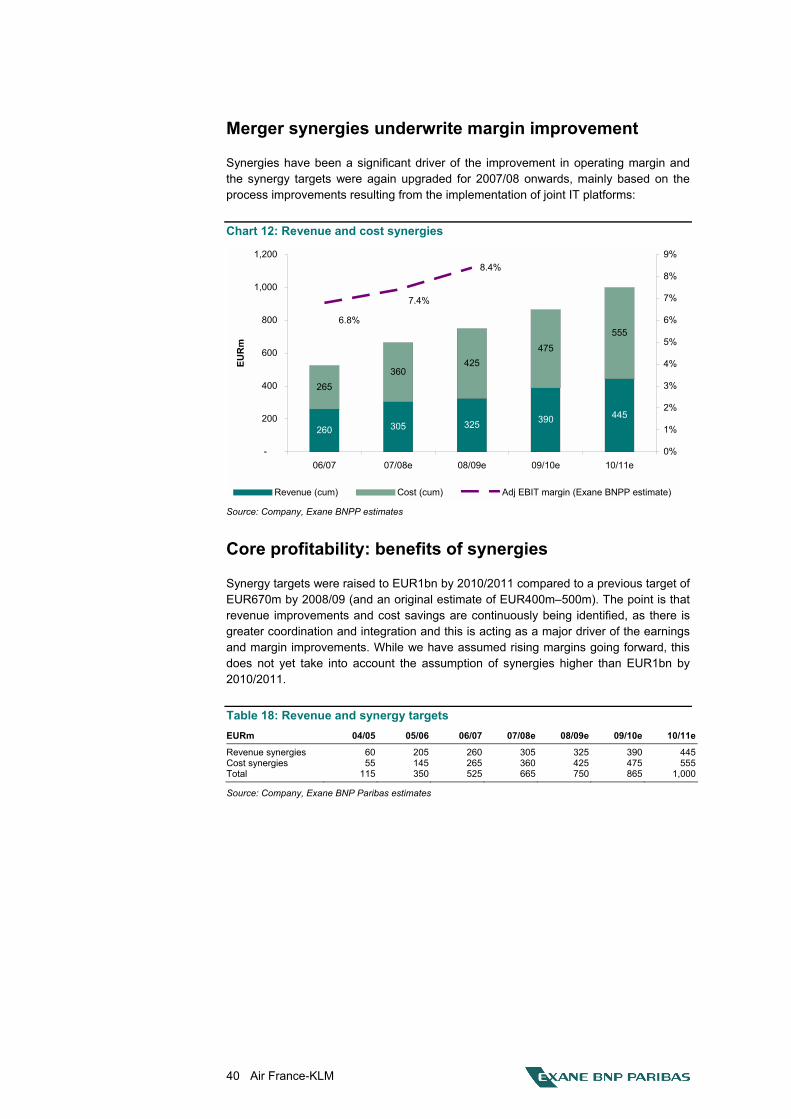
40 Air France-KLM
Merger synergies underwrite margin improvement
Synergies have been a significant driver of the improvement in operating margin and the synergy targets were again upgraded for 2007/08 onwards, mainly based on the process improvements resulting from the implementation of joint IT platforms:
Chart 12: Revenue and cost synergies
260 305 325 390 445
265360
425475
555
8.4%
6.8%
7.4%
-
200
400
600
800
1,000
1,200
06/07 07/08e 08/09e 09/10e 10/11e
EUR
m
0%
1%
2%
3%
4%
5%
6%
7%
8%
9%
Revenue (cum) Cost (cum) Adj EBIT margin (Exane BNPP estimate)
Source: Company, Exane BNPP estimates
Core profitability: benefits of synergies
Synergy targets were raised to EUR1bn by 2010/2011 compared to a previous target of EUR670m by 2008/09 (and an original estimate of EUR400m�500m). The point is that revenue improvements and cost savings are continuously being identified, as there is greater coordination and integration and this is acting as a major driver of the earnings and margin improvements. While we have assumed rising margins going forward, this does not yet take into account the assumption of synergies higher than EUR1bn by 2010/2011.
Table 18: Revenue and synergy targets EURm 04/05 05/06 06/07 07/08e 08/09e 09/10e 10/11e
Revenue synergies 60 205 260 305 325 390 445Cost synergies 55 145 265 360 425 475 555Total 115 350 525 665 750 865 1,000
Source: Company, Exane BNP Paribas estimates
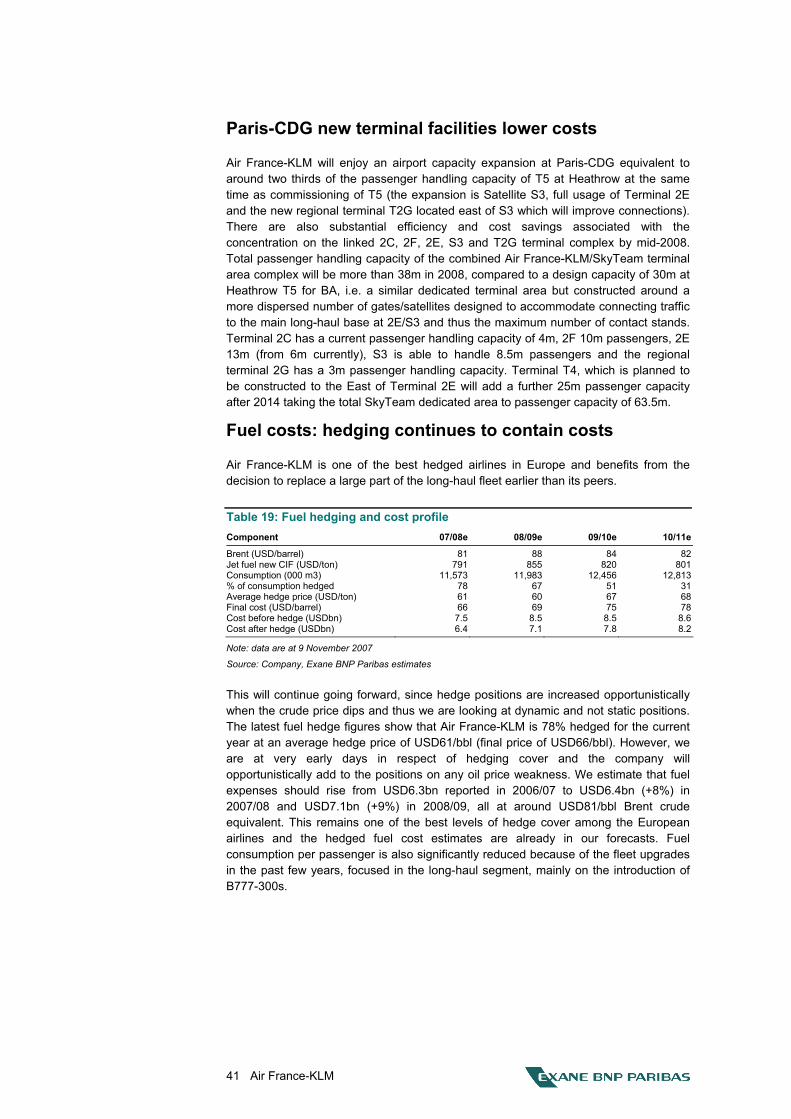
41 Air France-KLM
Paris-CDG new terminal facilities lower costs
Air France-KLM will enjoy an airport capacity expansion at Paris-CDG equivalent to around two thirds of the passenger handling capacity of T5 at Heathrow at the same time as commissioning of T5 (the expansion is Satellite S3, full usage of Terminal 2E and the new regional terminal T2G located east of S3 which will improve connections). There are also substantial efficiency and cost savings associated with the concentration on the linked 2C, 2F, 2E, S3 and T2G terminal complex by mid-2008. Total passenger handling capacity of the combined Air France-KLM/SkyTeam terminal area complex will be more than 38m in 2008, compared to a design capacity of 30m at Heathrow T5 for BA, i.e. a similar dedicated terminal area but constructed around a more dispersed number of gates/satellites designed to accommodate connecting traffic to the main long-haul base at 2E/S3 and thus the maximum number of contact stands. Terminal 2C has a current passenger handling capacity of 4m, 2F 10m passengers, 2E 13m (from 6m currently), S3 is able to handle 8.5m passengers and the regional terminal 2G has a 3m passenger handling capacity. Terminal T4, which is planned to be constructed to the East of Terminal 2E will add a further 25m passenger capacity after 2014 taking the total SkyTeam dedicated area to passenger capacity of 63.5m.
Fuel costs: hedging continues to contain costs
Air France-KLM is one of the best hedged airlines in Europe and benefits from the decision to replace a large part of the long-haul fleet earlier than its peers.
Table 19: Fuel hedging and cost profile Component 07/08e 08/09e 09/10e 10/11e
Brent (USD/barrel) 81 88 84 82Jet fuel new CIF (USD/ton) 791 855 820 801Consumption (000 m3) 11,573 11,983 12,456 12,813% of consumption hedged 78 67 51 31Average hedge price (USD/ton) 61 60 67 68Final cost (USD/barrel) 66 69 75 78Cost before hedge (USDbn) 7.5 8.5 8.5 8.6Cost after hedge (USDbn) 6.4 7.1 7.8 8.2
Note: data are at 9 November 2007
Source: Company, Exane BNP Paribas estimates
This will continue going forward, since hedge positions are increased opportunistically when the crude price dips and thus we are looking at dynamic and not static positions. The latest fuel hedge figures show that Air France-KLM is 78% hedged for the current year at an average hedge price of USD61/bbl (final price of USD66/bbl). However, we are at very early days in respect of hedging cover and the company will opportunistically add to the positions on any oil price weakness. We estimate that fuel expenses should rise from USD6.3bn reported in 2006/07 to USD6.4bn (+8%) in 2007/08 and USD7.1bn (+9%) in 2008/09, all at around USD81/bbl Brent crude equivalent. This remains one of the best levels of hedge cover among the European airlines and the hedged fuel cost estimates are already in our forecasts. Fuel consumption per passenger is also significantly reduced because of the fleet upgrades in the past few years, focused in the long-haul segment, mainly on the introduction of B777-300s.
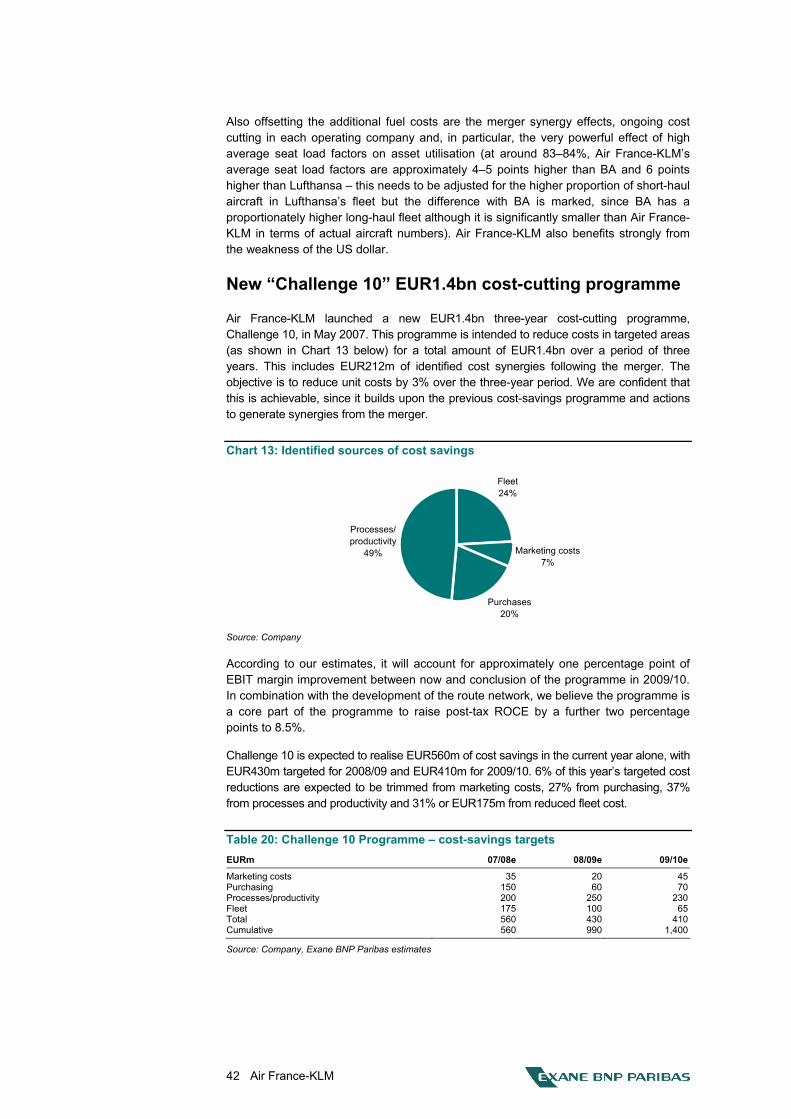
42 Air France-KLM
Also offsetting the additional fuel costs are the merger synergy effects, ongoing cost cutting in each operating company and, in particular, the very powerful effect of high average seat load factors on asset utilisation (at around 83�84%, Air France-KLM�s average seat load factors are approximately 4�5 points higher than BA and 6 points higher than Lufthansa � this needs to be adjusted for the higher proportion of short-haul aircraft in Lufthansa�s fleet but the difference with BA is marked, since BA has a proportionately higher long-haul fleet although it is significantly smaller than Air France-KLM in terms of actual aircraft numbers). Air France-KLM also benefits strongly from the weakness of the US dollar.
New �Challenge 10� EUR1.4bn cost-cutting programme
Air France-KLM launched a new EUR1.4bn three-year cost-cutting programme, Challenge 10, in May 2007. This programme is intended to reduce costs in targeted areas (as shown in Chart 13 below) for a total amount of EUR1.4bn over a period of three years. This includes EUR212m of identified cost synergies following the merger. The objective is to reduce unit costs by 3% over the three-year period. We are confident that this is achievable, since it builds upon the previous cost-savings programme and actions to generate synergies from the merger.
Chart 13: Identified sources of cost savings
Fleet24%
Marketing costs7%
Purchases20%
Processes/ productivity
49%
Source: Company
According to our estimates, it will account for approximately one percentage point of EBIT margin improvement between now and conclusion of the programme in 2009/10. In combination with the development of the route network, we believe the programme is a core part of the programme to raise post-tax ROCE by a further two percentage points to 8.5%.
Challenge 10 is expected to realise EUR560m of cost savings in the current year alone, with EUR430m targeted for 2008/09 and EUR410m for 2009/10. 6% of this year�s targeted cost reductions are expected to be trimmed from marketing costs, 27% from purchasing, 37% from processes and productivity and 31% or EUR175m from reduced fleet cost.
Table 20: Challenge 10 Programme � cost-savings targets EURm 07/08e 08/09e 09/10e
Marketing costs 35 20 45Purchasing 150 60 70Processes/productivity 200 250 230Fleet 175 100 65Total 560 430 410Cumulative 560 990 1,400
Source: Company, Exane BNP Paribas estimates
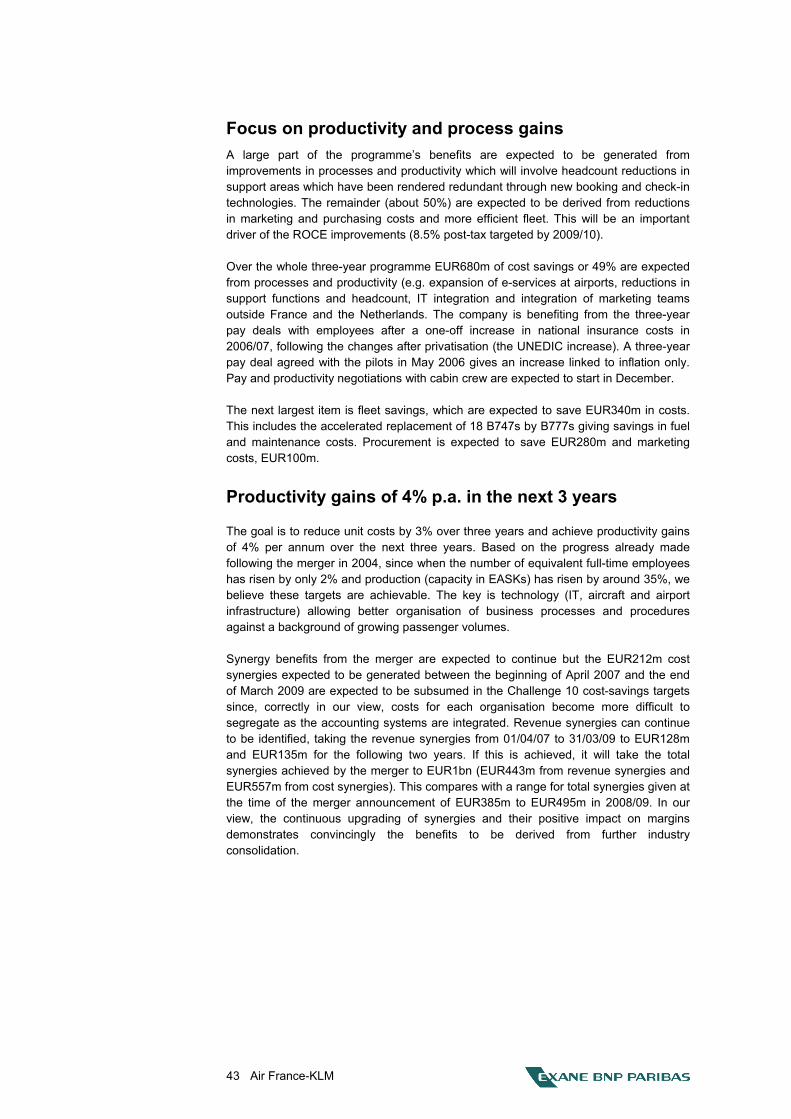
43 Air France-KLM
Focus on productivity and process gains A large part of the programme�s benefits are expected to be generated from improvements in processes and productivity which will involve headcount reductions in support areas which have been rendered redundant through new booking and check-in technologies. The remainder (about 50%) are expected to be derived from reductions in marketing and purchasing costs and more efficient fleet. This will be an important driver of the ROCE improvements (8.5% post-tax targeted by 2009/10).
Over the whole three-year programme EUR680m of cost savings or 49% are expected from processes and productivity (e.g. expansion of e-services at airports, reductions in support functions and headcount, IT integration and integration of marketing teams outside France and the Netherlands. The company is benefiting from the three-year pay deals with employees after a one-off increase in national insurance costs in 2006/07, following the changes after privatisation (the UNEDIC increase). A three-year pay deal agreed with the pilots in May 2006 gives an increase linked to inflation only. Pay and productivity negotiations with cabin crew are expected to start in December.
The next largest item is fleet savings, which are expected to save EUR340m in costs. This includes the accelerated replacement of 18 B747s by B777s giving savings in fuel and maintenance costs. Procurement is expected to save EUR280m and marketing costs, EUR100m.
Productivity gains of 4% p.a. in the next 3 years
The goal is to reduce unit costs by 3% over three years and achieve productivity gains of 4% per annum over the next three years. Based on the progress already made following the merger in 2004, since when the number of equivalent full-time employees has risen by only 2% and production (capacity in EASKs) has risen by around 35%, we believe these targets are achievable. The key is technology (IT, aircraft and airport infrastructure) allowing better organisation of business processes and procedures against a background of growing passenger volumes.
Synergy benefits from the merger are expected to continue but the EUR212m cost synergies expected to be generated between the beginning of April 2007 and the end of March 2009 are expected to be subsumed in the Challenge 10 cost-savings targets since, correctly in our view, costs for each organisation become more difficult to segregate as the accounting systems are integrated. Revenue synergies can continue to be identified, taking the revenue synergies from 01/04/07 to 31/03/09 to EUR128m and EUR135m for the following two years. If this is achieved, it will take the total synergies achieved by the merger to EUR1bn (EUR443m from revenue synergies and EUR557m from cost synergies). This compares with a range for total synergies given at the time of the merger announcement of EUR385m to EUR495m in 2008/09. In our view, the continuous upgrading of synergies and their positive impact on margins demonstrates convincingly the benefits to be derived from further industry consolidation.
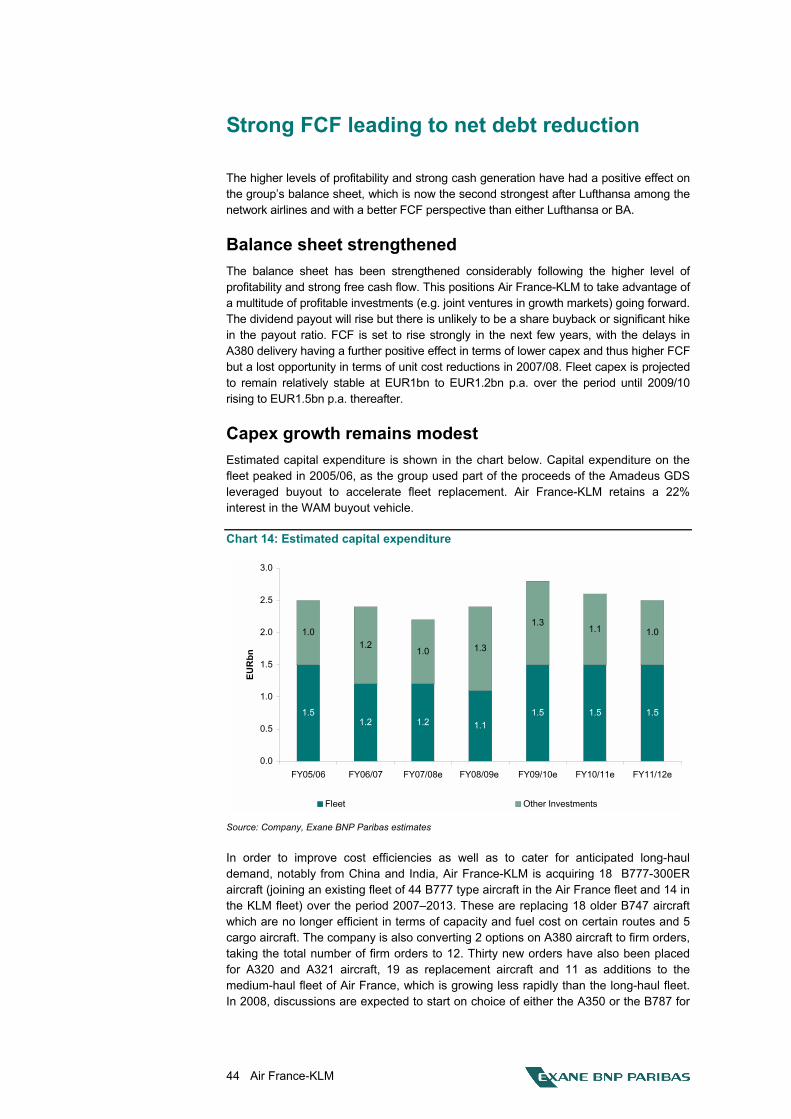
44 Air France-KLM
Strong FCF leading to net debt reduction
The higher levels of profitability and strong cash generation have had a positive effect on the group�s balance sheet, which is now the second strongest after Lufthansa among the network airlines and with a better FCF perspective than either Lufthansa or BA.
Balance sheet strengthened The balance sheet has been strengthened considerably following the higher level of profitability and strong free cash flow. This positions Air France-KLM to take advantage of a multitude of profitable investments (e.g. joint ventures in growth markets) going forward. The dividend payout will rise but there is unlikely to be a share buyback or significant hike in the payout ratio. FCF is set to rise strongly in the next few years, with the delays in A380 delivery having a further positive effect in terms of lower capex and thus higher FCF but a lost opportunity in terms of unit cost reductions in 2007/08. Fleet capex is projected to remain relatively stable at EUR1bn to EUR1.2bn p.a. over the period until 2009/10 rising to EUR1.5bn p.a. thereafter.
Capex growth remains modest Estimated capital expenditure is shown in the chart below. Capital expenditure on the fleet peaked in 2005/06, as the group used part of the proceeds of the Amadeus GDS leveraged buyout to accelerate fleet replacement. Air France-KLM retains a 22% interest in the WAM buyout vehicle.
Chart 14: Estimated capital expenditure
1.51.2 1.2 1.1
1.5 1.5 1.5
1.21.0 1.3
1.31.1 1.01.0
0.0
0.5
1.0
1.5
2.0
2.5
3.0
FY05/06 FY06/07 FY07/08e FY08/09e FY09/10e FY10/11e FY11/12e
EUR
bn
Fleet Other Investments
Source: Company, Exane BNP Paribas estimates
In order to improve cost efficiencies as well as to cater for anticipated long-haul demand, notably from China and India, Air France-KLM is acquiring 18 B777-300ER aircraft (joining an existing fleet of 44 B777 type aircraft in the Air France fleet and 14 in the KLM fleet) over the period 2007�2013. These are replacing 18 older B747 aircraft which are no longer efficient in terms of capacity and fuel cost on certain routes and 5 cargo aircraft. The company is also converting 2 options on A380 aircraft to firm orders, taking the total number of firm orders to 12. Thirty new orders have also been placed for A320 and A321 aircraft, 19 as replacement aircraft and 11 as additions to the medium-haul fleet of Air France, which is growing less rapidly than the long-haul fleet. In 2008, discussions are expected to start on choice of either the A350 or the B787 for
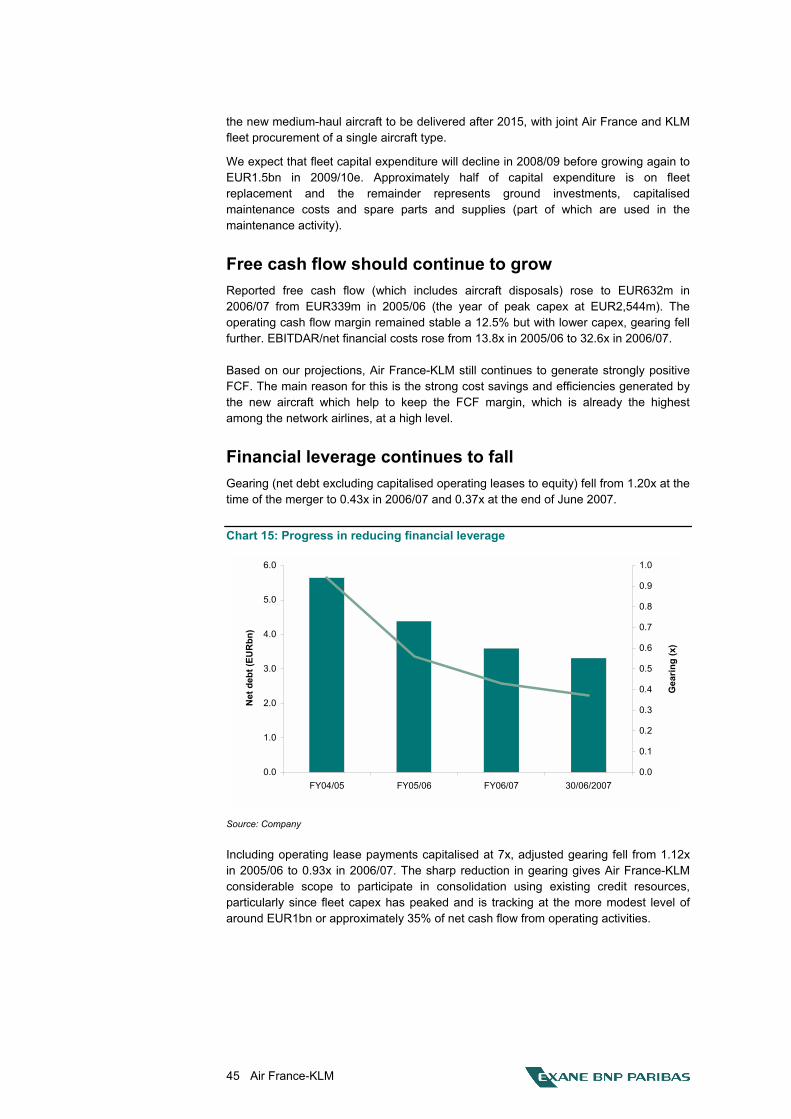
45 Air France-KLM
the new medium-haul aircraft to be delivered after 2015, with joint Air France and KLM fleet procurement of a single aircraft type.
We expect that fleet capital expenditure will decline in 2008/09 before growing again to EUR1.5bn in 2009/10e. Approximately half of capital expenditure is on fleet replacement and the remainder represents ground investments, capitalised maintenance costs and spare parts and supplies (part of which are used in the maintenance activity).
Free cash flow should continue to grow Reported free cash flow (which includes aircraft disposals) rose to EUR632m in 2006/07 from EUR339m in 2005/06 (the year of peak capex at EUR2,544m). The operating cash flow margin remained stable a 12.5% but with lower capex, gearing fell further. EBITDAR/net financial costs rose from 13.8x in 2005/06 to 32.6x in 2006/07.
Based on our projections, Air France-KLM still continues to generate strongly positive FCF. The main reason for this is the strong cost savings and efficiencies generated by the new aircraft which help to keep the FCF margin, which is already the highest among the network airlines, at a high level.
Financial leverage continues to fall Gearing (net debt excluding capitalised operating leases to equity) fell from 1.20x at the time of the merger to 0.43x in 2006/07 and 0.37x at the end of June 2007.
Chart 15: Progress in reducing financial leverage
0.0
1.0
2.0
3.0
4.0
5.0
6.0
FY04/05 FY05/06 FY06/07 30/06/2007
Net
deb
t (EU
Rbn
)
0.0
0.1
0.2
0.3
0.4
0.5
0.6
0.7
0.8
0.9
1.0
Gea
ring
(x)
Source: Company
Including operating lease payments capitalised at 7x, adjusted gearing fell from 1.12x in 2005/06 to 0.93x in 2006/07. The sharp reduction in gearing gives Air France-KLM considerable scope to participate in consolidation using existing credit resources, particularly since fleet capex has peaked and is tracking at the more modest level of around EUR1bn or approximately 35% of net cash flow from operating activities.
46 Air France-KLM
Dividend outlook should mirror earnings growth We expect Air France-KLM to continue to maintain a progressive dividend policy in line with the development of net income. Our dividend estimate for 2007/08 is EUR0.54, for 2008/09 EUR0.64 and for 2009/10, EUR0.74, representing a payout ratio of around 15% and a current yield of approximately 3%. In our view, there is the possibility of a higher dividend in 2007/08 based on the proceeds of the WAM capital restructuring but we have not yet factored this into our estimates.
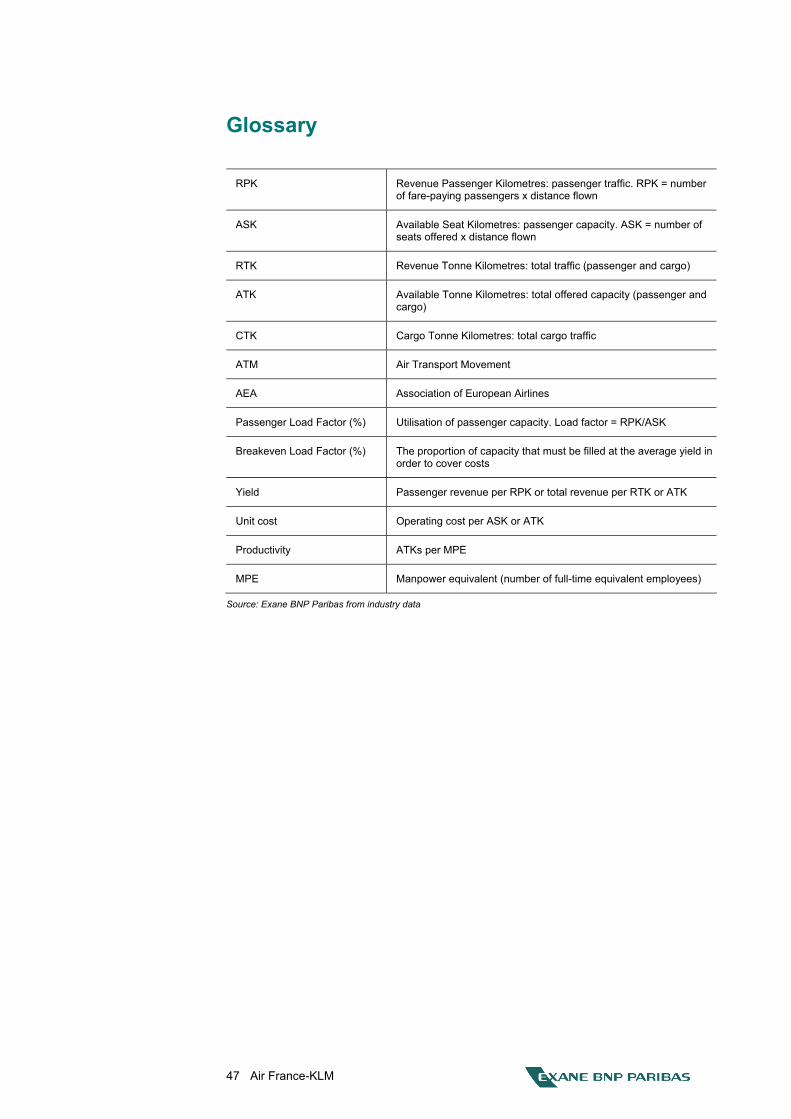
47 Air France-KLM
Glossary
RPK Revenue Passenger Kilometres: passenger traffic. RPK = number of fare-paying passengers x distance flown
ASK Available Seat Kilometres: passenger capacity. ASK = number of seats offered x distance flown
RTK Revenue Tonne Kilometres: total traffic (passenger and cargo)
ATK Available Tonne Kilometres: total offered capacity (passenger and cargo)
CTK Cargo Tonne Kilometres: total cargo traffic
ATM Air Transport Movement
AEA Association of European Airlines
Passenger Load Factor (%) Utilisation of passenger capacity. Load factor = RPK/ASK
Breakeven Load Factor (%) The proportion of capacity that must be filled at the average yield in order to cover costs
Yield Passenger revenue per RPK or total revenue per RTK or ATK
Unit cost Operating cost per ASK or ATK
Productivity ATKs per MPE
MPE Manpower equivalent (number of full-time equivalent employees)
Source: Exane BNP Paribas from industry data
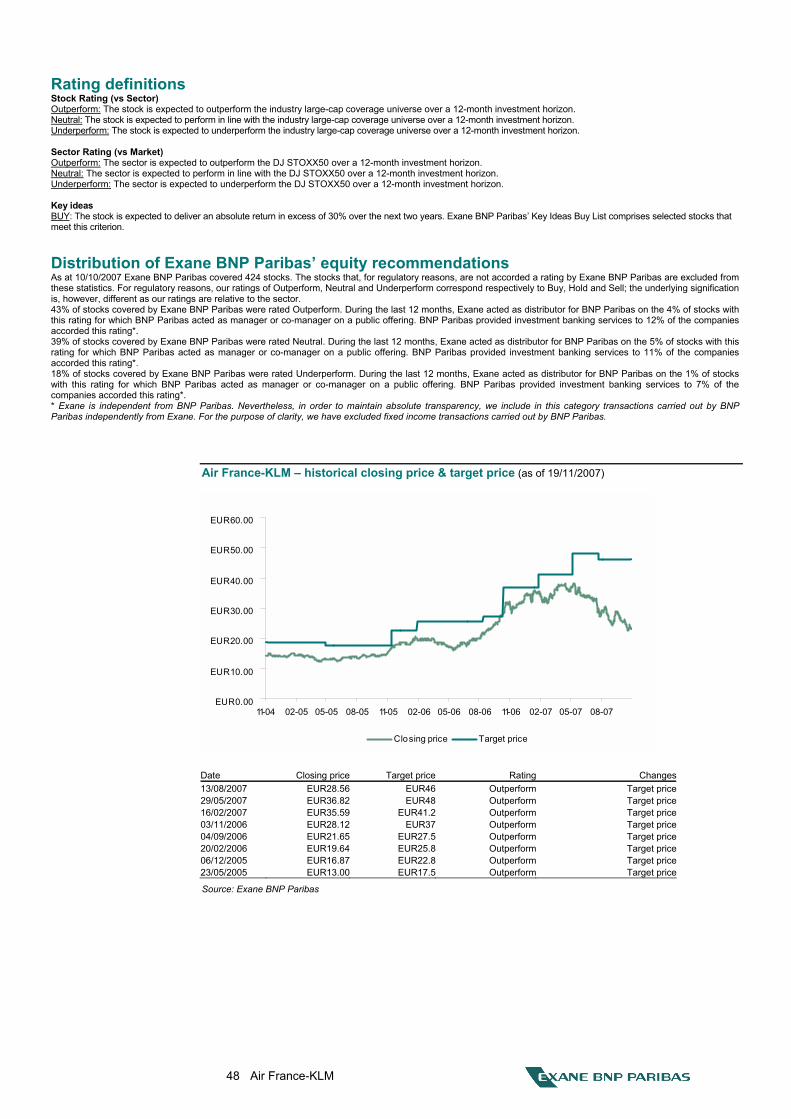
48 Air France-KLM
Rating definitions Stock Rating (vs Sector) Outperform: The stock is expected to outperform the industry large-cap coverage universe over a 12-month investment horizon. Neutral: The stock is expected to perform in line with the industry large-cap coverage universe over a 12-month investment horizon. Underperform: The stock is expected to underperform the industry large-cap coverage universe over a 12-month investment horizon. Sector Rating (vs Market) Outperform: The sector is expected to outperform the DJ STOXX50 over a 12-month investment horizon. Neutral: The sector is expected to perform in line with the DJ STOXX50 over a 12-month investment horizon. Underperform: The sector is expected to underperform the DJ STOXX50 over a 12-month investment horizon. Key ideas BUY: The stock is expected to deliver an absolute return in excess of 30% over the next two years. Exane BNP Paribas� Key Ideas Buy List comprises selected stocks that meet this criterion.
Distribution of Exane BNP Paribas� equity recommendations As at 10/10/2007 Exane BNP Paribas covered 424 stocks. The stocks that, for regulatory reasons, are not accorded a rating by Exane BNP Paribas are excluded from these statistics. For regulatory reasons, our ratings of Outperform, Neutral and Underperform correspond respectively to Buy, Hold and Sell; the underlying signification is, however, different as our ratings are relative to the sector. 43% of stocks covered by Exane BNP Paribas were rated Outperform. During the last 12 months, Exane acted as distributor for BNP Paribas on the 4% of stocks with this rating for which BNP Paribas acted as manager or co-manager on a public offering. BNP Paribas provided investment banking services to 12% of the companies accorded this rating*. 39% of stocks covered by Exane BNP Paribas were rated Neutral. During the last 12 months, Exane acted as distributor for BNP Paribas on the 5% of stocks with this rating for which BNP Paribas acted as manager or co-manager on a public offering. BNP Paribas provided investment banking services to 11% of the companies accorded this rating*. 18% of stocks covered by Exane BNP Paribas were rated Underperform. During the last 12 months, Exane acted as distributor for BNP Paribas on the 1% of stocks with this rating for which BNP Paribas acted as manager or co-manager on a public offering. BNP Paribas provided investment banking services to 7% of the companies accorded this rating*. * Exane is independent from BNP Paribas. Nevertheless, in order to maintain absolute transparency, we include in this category transactions carried out by BNP Paribas independently from Exane. For the purpose of clarity, we have excluded fixed income transactions carried out by BNP Paribas.
Air France-KLM � historical closing price & target price (as of 19/11/2007)
EUR0.00
EUR10.00
EUR20.00
EUR30.00
EUR40.00
EUR50.00
EUR60.00
11-04 02-05 05-05 08-05 11-05 02-06 05-06 08-06 11-06 02-07 05-07 08-07
Closing price Target price
Date Closing price Target price Rating Changes13/08/2007 EUR28.56 EUR46 Outperform Target price29/05/2007 EUR36.82 EUR48 Outperform Target price16/02/2007 EUR35.59 EUR41.2 Outperform Target price03/11/2006 EUR28.12 EUR37 Outperform Target price04/09/2006 EUR21.65 EUR27.5 Outperform Target price20/02/2006 EUR19.64 EUR25.8 Outperform Target price06/12/2005 EUR16.87 EUR22.8 Outperform Target price23/05/2005 EUR13.00 EUR17.5 Outperform Target price
Source: Exane BNP Paribas
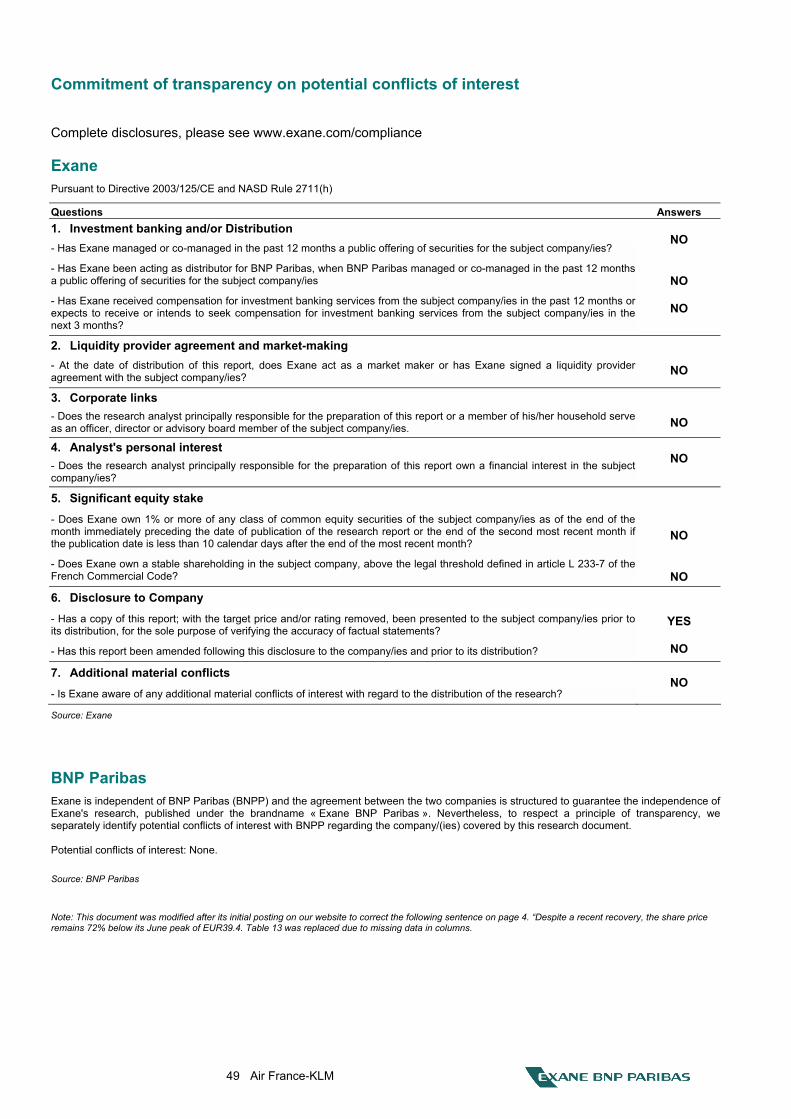
49 Air France-KLM
Commitment of transparency on potential conflicts of interest
Complete disclosures, please see www.exane.com/compliance
Exane Pursuant to Directive 2003/125/CE and NASD Rule 2711(h)
Questions Answers 1. Investment banking and/or Distribution - Has Exane managed or co-managed in the past 12 months a public offering of securities for the subject company/ies?
- Has Exane been acting as distributor for BNP Paribas, when BNP Paribas managed or co-managed in the past 12 months a public offering of securities for the subject company/ies
- Has Exane received compensation for investment banking services from the subject company/ies in the past 12 months or expects to receive or intends to seek compensation for investment banking services from the subject company/ies in the next 3 months?
NO
NO
NO
2. Liquidity provider agreement and market-making - At the date of distribution of this report, does Exane act as a market maker or has Exane signed a liquidity provider agreement with the subject company/ies?
NO
3. Corporate links - Does the research analyst principally responsible for the preparation of this report or a member of his/her household serve as an officer, director or advisory board member of the subject company/ies.
NO
4. Analyst's personal interest - Does the research analyst principally responsible for the preparation of this report own a financial interest in the subject company/ies?
NO
5. Significant equity stake - Does Exane own 1% or more of any class of common equity securities of the subject company/ies as of the end of the month immediately preceding the date of publication of the research report or the end of the second most recent month if the publication date is less than 10 calendar days after the end of the most recent month?
- Does Exane own a stable shareholding in the subject company, above the legal threshold defined in article L 233-7 of the French Commercial Code?
NO
NO
6. Disclosure to Company - Has a copy of this report; with the target price and/or rating removed, been presented to the subject company/ies prior to its distribution, for the sole purpose of verifying the accuracy of factual statements?
- Has this report been amended following this disclosure to the company/ies and prior to its distribution?
YES
NO
7. Additional material conflicts - Is Exane aware of any additional material conflicts of interest with regard to the distribution of the research?
NO
Source: Exane
BNP Paribas Exane is independent of BNP Paribas (BNPP) and the agreement between the two companies is structured to guarantee the independence of Exane's research, published under the brandname « Exane BNP Paribas ». Nevertheless, to respect a principle of transparency, we separately identify potential conflicts of interest with BNPP regarding the company/(ies) covered by this research document. Potential conflicts of interest: None. Source: BNP Paribas
Note: This document was modified after its initial posting on our website to correct the following sentence on page 4. �Despite a recent recovery, the share price remains 72% below its June peak of EUR39.4. Table 13 was replaced due to missing data in columns.
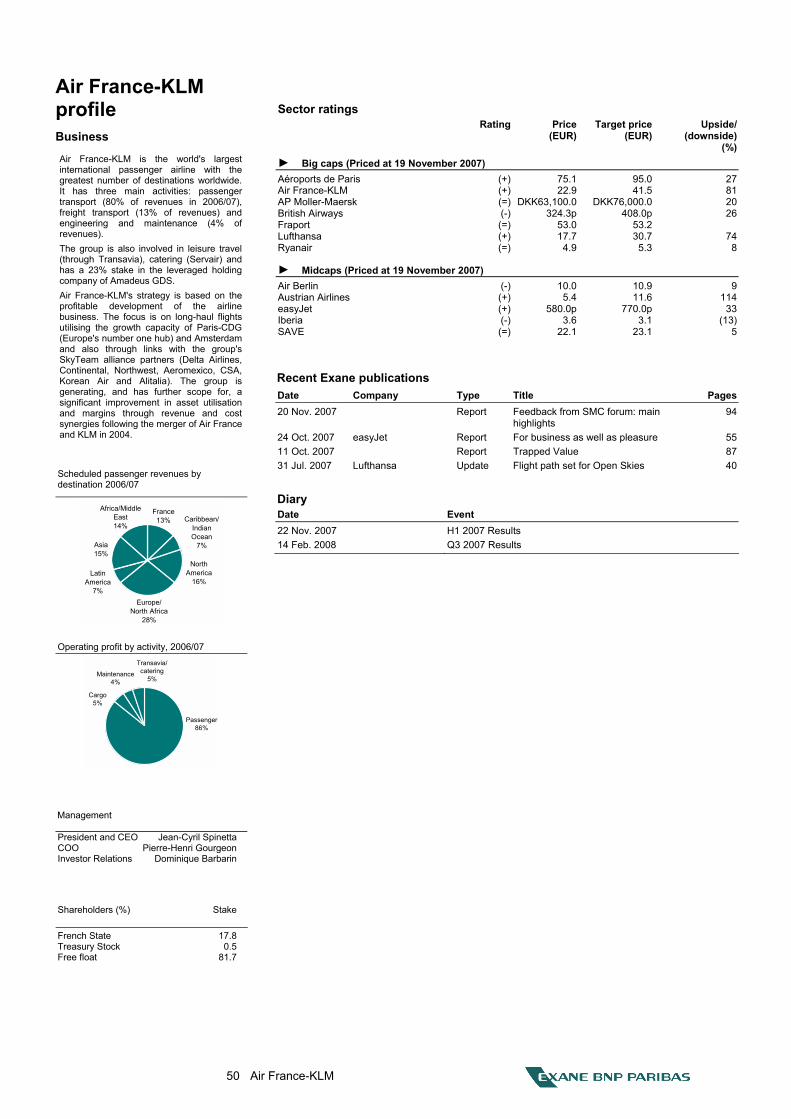
50 Air France-KLM
Air France-KLM profile Business
Air France-KLM is the world's largest international passenger airline with the greatest number of destinations worldwide. It has three main activities: passenger transport (80% of revenues in 2006/07), freight transport (13% of revenues) and engineering and maintenance (4% of revenues). The group is also involved in leisure travel (through Transavia), catering (Servair) and has a 23% stake in the leveraged holding company of Amadeus GDS. Air France-KLM's strategy is based on the profitable development of the airline business. The focus is on long-haul flights utilising the growth capacity of Paris-CDG (Europe's number one hub) and Amsterdam and also through links with the group's SkyTeam alliance partners (Delta Airlines, Continental, Northwest, Aeromexico, CSA, Korean Air and Alitalia). The group is generating, and has further scope for, a significant improvement in asset utilisation and margins through revenue and cost synergies following the merger of Air France and KLM in 2004.
Scheduled passenger revenues by destination 2006/07
North America
16%
France13%
Europe/North Africa
28%
Caribbean/Indian Ocean
7%
Latin America
7%
Africa/Middle East14%
Asia15%
Operating profit by activity, 2006/07
Maintenance4%
Transavia/catering
5%
Cargo5%
Passenger86%
Management
President and CEO Jean-Cyril Spinetta COO Pierre-Henri Gourgeon Investor Relations Dominique Barbarin
Shareholders (%) Stake French State 17.8 Treasury Stock 0.5 Free float 81.7
Sector ratings Rating Price Target price Upside/ (EUR) (EUR) (downside) (%)► Big caps (Priced at 19 November 2007) Aéroports de Paris (+) 75.1 95.0 27Air France-KLM (+) 22.9 41.5 81AP Moller-Maersk (=) DKK63,100.0 DKK76,000.0 20British Airways (-) 324.3p 408.0p 26Fraport (=) 53.0 53.2 Lufthansa (+) 17.7 30.7 74Ryanair (=) 4.9 5.3 8
► Midcaps (Priced at 19 November 2007) Air Berlin (-) 10.0 10.9 9Austrian Airlines (+) 5.4 11.6 114easyJet (+) 580.0p 770.0p 33Iberia (-) 3.6 3.1 (13)SAVE (=) 22.1 23.1 5
Recent Exane publications Date Company Type Title Pages20 Nov. 2007 Report Feedback from SMC forum: main
highlights 94
24 Oct. 2007 easyJet Report For business as well as pleasure 5511 Oct. 2007 Report Trapped Value 8731 Jul. 2007 Lufthansa Update Flight path set for Open Skies 40
Diary Date Event 22 Nov. 2007 H1 2007 Results 14 Feb. 2008 Q3 2007 Results
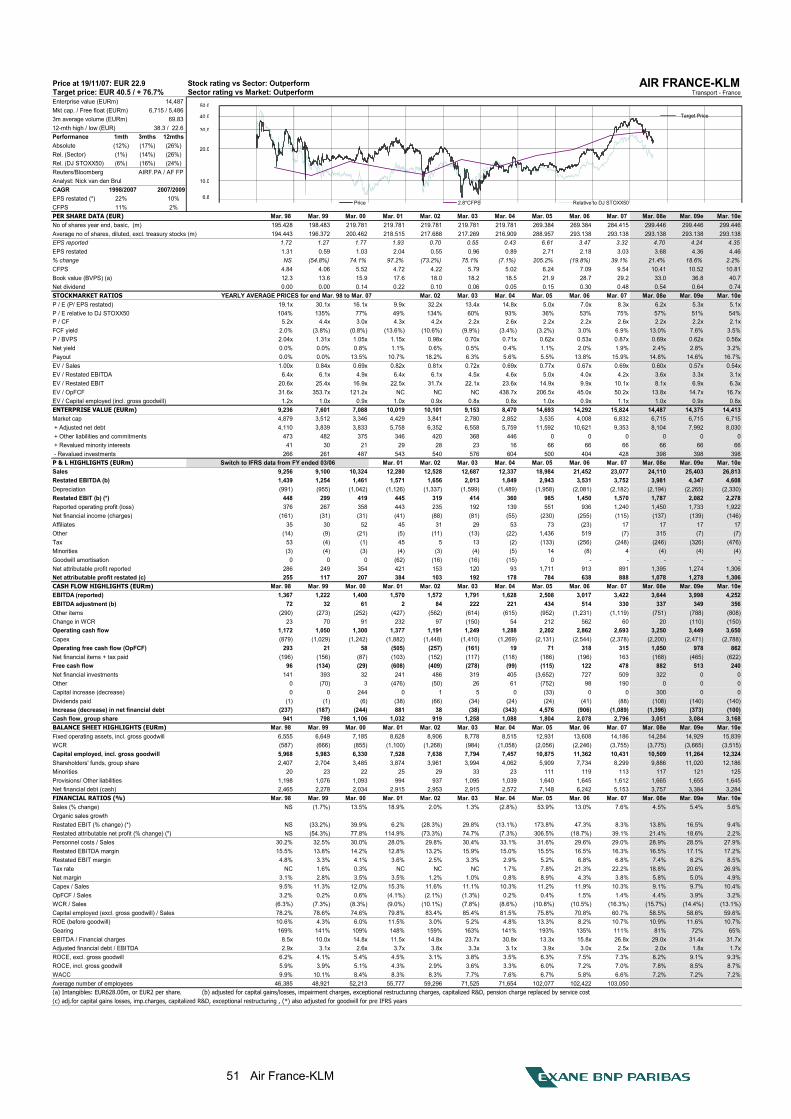
51 Air France-KLM
Stock rating vs Sector: Outperform AIR FRANCE-KLMTarget price: EUR 40.5 / + 76.7% Sector rating vs Market: Outperform Transport - FranceEnterprise value (EURm) 14,487 Mkt cap. / Free float (EURm) 6,715 / 5,486 3m average volume (EURm) 69.83 12-mth high / low (EUR) 38.3 / 22.6 Performance 1mth 3mths 12mthsAbsolute (12%) (17%) (26%)Rel. (Sector) (1%) (14%) (26%)Rel. (DJ STOXX50) (6%) (16%) (24%)Reuters/BloombergAnalyst: Nick van den BrulCAGR 1998/2007 2007/2009EPS restated (*) 22% 10%CFPS 11% 2%PER SHARE DATA (EUR) Mar. 98 Mar. 99 Mar. 00 Mar. 01 Mar. 02 Mar. 03 Mar. 04 Mar. 05 Mar. 06 Mar. 07 Mar. 08e Mar. 09e Mar. 10eNo of shares year end, basic, (m) 195.428 198.483 219.781 219.781 219.781 219.781 219.781 269.384 269.384 284.415 299.446 299.446 299.446Average no of shares, diluted, excl. treasury stocks (m) 194.443 196.372 200.462 218.515 217.688 217.269 216.909 288.957 293.138 293.138 293.138 293.138 293.138EPS reported 1.72 1.27 1.77 1.93 0.70 0.55 0.43 6.61 3.47 3.32 4.70 4.24 4.35EPS restated 1.31 0.59 1.03 2.04 0.55 0.96 0.89 2.71 2.18 3.03 3.68 4.36 4.46% change NS (54.8%) 74.1% 97.2% (73.2%) 75.1% (7.1%) 205.2% (19.8%) 39.1% 21.4% 18.6% 2.2%CFPS 4.84 4.06 5.52 4.72 4.22 5.79 5.02 6.24 7.09 9.54 10.41 10.52 10.81Book value (BVPS) (a) 12.3 13.6 15.9 17.6 18.0 18.2 18.5 21.9 28.7 29.2 33.0 36.8 40.7Net dividend 0.00 0.00 0.14 0.22 0.10 0.06 0.05 0.15 0.30 0.48 0.54 0.64 0.74STOCKMARKET RATIOS Mar. 02 Mar. 03 Mar. 04 Mar. 05 Mar. 06 Mar. 07 Mar. 08e Mar. 09e Mar. 10eP / E (P/ EPS restated) 19.1x 30.1x 16.1x 9.9x 32.2x 13.4x 14.8x 5.0x 7.0x 8.3x 6.2x 5.3x 5.1xP / E relative to DJ STOXX50 104% 135% 77% 49% 134% 60% 93% 36% 53% 75% 57% 51% 54%P / CF 5.2x 4.4x 3.0x 4.3x 4.2x 2.2x 2.6x 2.2x 2.2x 2.6x 2.2x 2.2x 2.1xFCF yield 2.0% (3.8%) (0.8%) (13.6%) (10.6%) (9.9%) (3.4%) (3.2%) 3.0% 6.9% 13.0% 7.6% 3.5%P / BVPS 2.04x 1.31x 1.05x 1.15x 0.98x 0.70x 0.71x 0.62x 0.53x 0.87x 0.69x 0.62x 0.56xNet yield 0.0% 0.0% 0.8% 1.1% 0.6% 0.5% 0.4% 1.1% 2.0% 1.9% 2.4% 2.8% 3.2%Payout 0.0% 0.0% 13.5% 10.7% 18.2% 6.3% 5.6% 5.5% 13.8% 15.9% 14.8% 14.6% 16.7%EV / Sales 1.00x 0.84x 0.69x 0.82x 0.81x 0.72x 0.69x 0.77x 0.67x 0.69x 0.60x 0.57x 0.54xEV / Restated EBITDA 6.4x 6.1x 4.9x 6.4x 6.1x 4.5x 4.6x 5.0x 4.0x 4.2x 3.6x 3.3x 3.1xEV / Restated EBIT 20.6x 25.4x 16.9x 22.5x 31.7x 22.1x 23.6x 14.9x 9.9x 10.1x 8.1x 6.9x 6.3xEV / OpFCF 31.6x 353.7x 121.2x NC NC NC 438.7x 206.5x 45.0x 50.2x 13.8x 14.7x 16.7xEV / Capital employed (incl. gross goodwill) 1.2x 1.0x 0.9x 1.0x 0.9x 0.8x 0.8x 1.0x 0.9x 1.1x 1.0x 0.9x 0.8xENTERPRISE VALUE (EURm) 9,236 7,601 7,088 10,019 10,101 9,153 8,470 14,693 14,292 15,824 14,487 14,375 14,413Market cap 4,879 3,512 3,346 4,429 3,841 2,780 2,852 3,535 4,008 6,832 6,715 6,715 6,715 + Adjusted net debt 4,110 3,839 3,833 5,758 6,352 6,558 5,759 11,592 10,621 9,353 8,104 7,992 8,030 + Other liabilities and commitments 473 482 375 346 420 368 446 0 0 0 0 0 0 + Revalued minority interests 41 30 21 29 28 23 16 66 66 66 66 66 66 - Revalued investments 266 261 487 543 540 576 604 500 404 428 398 398 398P & L HIGHLIGHTS (EURm) Mar. 01 Mar. 02 Mar. 03 Mar. 04 Mar. 05 Mar. 06 Mar. 07 Mar. 08e Mar. 09e Mar. 10eSales 9,256 9,100 10,324 12,280 12,528 12,687 12,337 18,984 21,452 23,077 24,110 25,403 26,813Restated EBITDA (b) 1,439 1,254 1,461 1,571 1,656 2,013 1,849 2,943 3,531 3,752 3,981 4,347 4,608Depreciation (991) (955) (1,042) (1,126) (1,337) (1,599) (1,489) (1,958) (2,081) (2,182) (2,194) (2,265) (2,330)Restated EBIT (b) (*) 448 299 419 445 319 414 360 985 1,450 1,570 1,787 2,082 2,278Reported operating profit (loss) 376 267 358 443 235 192 139 551 936 1,240 1,450 1,733 1,922Net financial income (charges) (161) (31) (31) (41) (88) (81) (55) (230) (255) (115) (137) (139) (146)Affiliates 35 30 52 45 31 29 53 73 (23) 17 17 17 17Other (14) (9) (21) (5) (11) (13) (22) 1,436 519 (7) 315 (7) (7)Tax 53 (4) (1) 45 5 13 (2) (133) (256) (248) (246) (326) (476)Minorities (3) (4) (3) (4) (3) (4) (5) 14 (8) 4 (4) (4) (4)Goodwill amortisation 0 0 0 (62) (16) (16) (15) 0 - - - - -Net attributable profit reported 286 249 354 421 153 120 93 1,711 913 891 1,395 1,274 1,306Net attributable profit restated (c) 255 117 207 384 103 192 178 784 638 888 1,078 1,278 1,306CASH FLOW HIGHLIGHTS (EURm) Mar. 98 Mar. 99 Mar. 00 Mar. 01 Mar. 02 Mar. 03 Mar. 04 Mar. 05 Mar. 06 Mar. 07 Mar. 08e Mar. 09e Mar. 10eEBITDA (reported) 1,367 1,222 1,400 1,570 1,572 1,791 1,628 2,508 3,017 3,422 3,644 3,998 4,252EBITDA adjustment (b) 72 32 61 2 84 222 221 434 514 330 337 349 356Other items (290) (273) (252) (427) (562) (614) (615) (952) (1,231) (1,119) (751) (788) (808)Change in WCR 23 70 91 232 97 (150) 54 212 562 60 20 (110) (150)Operating cash flow 1,172 1,050 1,300 1,377 1,191 1,249 1,288 2,202 2,862 2,693 3,250 3,449 3,650Capex (879) (1,029) (1,242) (1,882) (1,448) (1,410) (1,269) (2,131) (2,544) (2,378) (2,200) (2,471) (2,788)Operating free cash flow (OpFCF) 293 21 58 (505) (257) (161) 19 71 318 315 1,050 978 862Net financial items + tax paid (196) (156) (87) (103) (152) (117) (118) (186) (196) 163 (168) (465) (622)Free cash flow 96 (134) (29) (608) (409) (278) (99) (115) 122 478 882 513 240Net financial investments 141 393 32 241 486 319 405 (3,652) 727 509 322 0 0Other 0 (70) 3 (476) (50) 26 61 (752) 98 190 0 0 0Capital increase (decrease) 0 0 244 0 1 5 0 (33) 0 0 300 0 0Dividends paid (1) (1) (6) (38) (66) (34) (24) (24) (41) (88) (108) (140) (140)Increase (decrease) in net financial debt (237) (187) (244) 881 38 (38) (343) 4,576 (906) (1,089) (1,396) (373) (100)Cash flow, group share 941 798 1,106 1,032 919 1,258 1,088 1,804 2,078 2,796 3,051 3,084 3,168BALANCE SHEET HIGHLIGHTS (EURm) Mar. 98 Mar. 99 Mar. 00 Mar. 01 Mar. 02 Mar. 03 Mar. 04 Mar. 05 Mar. 06 Mar. 07 Mar. 08e Mar. 09e Mar. 10eFixed operating assets, incl. gross goodwill 6,555 6,649 7,185 8,628 8,906 8,778 8,515 12,931 13,608 14,186 14,284 14,929 15,839WCR (587) (666) (855) (1,100) (1,268) (984) (1,058) (2,056) (2,246) (3,755) (3,775) (3,665) (3,515)Capital employed, incl. gross goodwill 5,968 5,983 6,330 7,528 7,638 7,794 7,457 10,875 11,362 10,431 10,509 11,264 12,324Shareholders' funds, group share 2,407 2,704 3,485 3,874 3,961 3,994 4,062 5,909 7,734 8,299 9,886 11,020 12,186Minorities 20 23 22 25 29 33 23 111 119 113 117 121 125Provisions/ Other liabilities 1,198 1,076 1,093 994 937 1,095 1,039 1,640 1,645 1,612 1,665 1,655 1,645Net financial debt (cash) 2,465 2,278 2,034 2,915 2,953 2,915 2,572 7,148 6,242 5,153 3,757 3,384 3,284FINANCIAL RATIOS (%) Mar. 98 Mar. 99 Mar. 00 Mar. 01 Mar. 02 Mar. 03 Mar. 04 Mar. 05 Mar. 06 Mar. 07 Mar. 08e Mar. 09e Mar. 10eSales (% change) NS (1.7%) 13.5% 18.9% 2.0% 1.3% (2.8%) 53.9% 13.0% 7.6% 4.5% 5.4% 5.6%Organic sales growthRestated EBIT (% change) (*) NS (33.2%) 39.9% 6.2% (28.3%) 29.8% (13.1%) 173.8% 47.3% 8.3% 13.8% 16.5% 9.4%Restated attributable net profit (% change) (*) NS (54.3%) 77.8% 114.9% (73.3%) 74.7% (7.3%) 306.5% (18.7%) 39.1% 21.4% 18.6% 2.2%Personnel costs / Sales 30.2% 32.5% 30.0% 28.0% 29.8% 30.4% 33.1% 31.6% 29.6% 29.0% 28.9% 28.5% 27.9%Restated EBITDA margin 15.5% 13.8% 14.2% 12.8% 13.2% 15.9% 15.0% 15.5% 16.5% 16.3% 16.5% 17.1% 17.2%Restated EBIT margin 4.8% 3.3% 4.1% 3.6% 2.5% 3.3% 2.9% 5.2% 6.8% 6.8% 7.4% 8.2% 8.5%Tax rate NC 1.6% 0.3% NC NC NC 1.7% 7.8% 21.3% 22.2% 18.8% 20.6% 26.9%Net margin 3.1% 2.8% 3.5% 3.5% 1.2% 1.0% 0.8% 8.9% 4.3% 3.8% 5.8% 5.0% 4.9%Capex / Sales 9.5% 11.3% 12.0% 15.3% 11.6% 11.1% 10.3% 11.2% 11.9% 10.3% 9.1% 9.7% 10.4%OpFCF / Sales 3.2% 0.2% 0.6% (4.1%) (2.1%) (1.3%) 0.2% 0.4% 1.5% 1.4% 4.4% 3.9% 3.2%WCR / Sales (6.3%) (7.3%) (8.3%) (9.0%) (10.1%) (7.8%) (8.6%) (10.8%) (10.5%) (16.3%) (15.7%) (14.4%) (13.1%)Capital employed (excl. gross goodwill) / Sales 78.2% 78.6% 74.6% 79.8% 83.4% 85.4% 81.5% 75.8% 70.8% 60.7% 58.5% 58.6% 59.6%ROE (before goodwill) 10.6% 4.3% 6.0% 11.5% 3.0% 5.2% 4.8% 13.3% 8.2% 10.7% 10.9% 11.6% 10.7%Gearing 169% 141% 109% 148% 159% 163% 141% 193% 135% 111% 81% 72% 65%EBITDA / Financial charges 8.5x 10.0x 14.8x 11.5x 14.8x 23.7x 30.8x 13.3x 15.8x 26.8x 29.0x 31.4x 31.7xAdjusted financial debt / EBITDA 2.9x 3.1x 2.6x 3.7x 3.8x 3.3x 3.1x 3.9x 3.0x 2.5x 2.0x 1.8x 1.7xROCE, excl. gross goodwill 6.2% 4.1% 5.4% 4.5% 3.1% 3.8% 3.5% 6.3% 7.5% 7.3% 8.2% 9.1% 9.3%ROCE, incl. gross goodwill 5.9% 3.9% 5.1% 4.3% 2.9% 3.6% 3.3% 6.0% 7.2% 7.0% 7.8% 8.5% 8.7%WACC 9.9% 10.1% 8.4% 8.3% 8.3% 7.7% 7.6% 6.7% 5.8% 6.6% 7.2% 7.2% 7.2%Average number of employees 46,385 48,921 52,213 55,777 59,296 71,525 71,654 102,077 102,422 103,050(a) Intangibles: EUR628.00m, or EUR2 per share. (b) adjusted for capital gains/losses, impairment charges, exceptional restructuring charges, capitalized R&D, pension charge replaced by service cost(c) adj.for capital gains losses, imp.charges, capitalized R&D, exceptional restructuring , (*) also adjusted for goodwill for pre IFRS years
Switch to IFRS data from FY ended 03/06
YEARLY AVERAGE PRICES for end Mar. 98 to Mar. 07
AIRF.PA / AF FP
Price at 19/11/07: EUR 22.9
Price 2.8*CFPS Relative to DJ STOXX506.8
50.0
10.0
20.0
30.0
40.0 Target Price
Important notice: Please refer to our complete disclosure notice available on www.exane.com/compliance This research is produced by EXANE SA and / or EXANE LTD (�EXANE�) on behalf of themselves. EXANE SA is regulated by the "Autorité des Marchés Financiers" (AMF) and EXANE LTD is regulated by the "Financial Services Authority" (FSA). In accordance with the requirements of FSA COB 7.16.7R and associated guidances �Exane�s policy for managing conflicts of interest in relation to investment research" is published on Exane�s web site (www.exane.com). Exane also follows the guidelines described in the code of conduct of the AFEI (Association Francaise des Entreprises d'Investissement) on "managing conflicts of interest in the field of investment research". This code of conduct is available on Exane�s web site (www.exane.com). This research is solely for the private information of the recipients. All information contained in this research report has been compiled from sources believed to be reliable. However, no representation or warranty, express or implied, is made with respect to the completeness or accuracy of its contents, and it is not to be relied upon as such. Opinions contained in this research report represent Exane's current opinions on the date of the report only. Exane is not soliciting an action based upon it, and under no circumstances is it to be used or considered as an offer to sell, or a solicitation of any offer to buy. While Exane endeavours to update its research reports from time to time, there may be legal and/or other reasons why Exane cannot do so and, accordingly, Exane disclaims any obligation to do so. This report is provided solely for the information of professional investors who are expected to make their own investment decisions without undue reliance on this report and Exane accepts no liability whatsoever for any direct or consequential loss arising from any use of this report or its contents. This report may not be reproduced, distributed or published by any recipient for any purpose. Any United States person wishing to obtain further information or to effect a transaction in any security discussed in this report should do so only through Exane Inc., which has distributed this report in the United States and, subject to the above, accepts responsibility for its contents. BNP PARIBAS has acquired an interest in VERNER INVESTISSEMENTS the parent company of EXANE. VERNER INVESTISSEMENTS is controlled by the management of EXANE. BNP PARIBAS�s voting rights as a shareholder of VERNER INVESTISSEMENTS will be limited to 40% of overall voting rights of VERNER INVESTISSEMENTS.
PARIS Exane S.A. 16 Avenue Matignon 75008 Paris France Tel: (+33) 1 44 95 40 00 Fax: (+33) 1 44 95 40 01 FRANKFURT Branch of Exane S.A. Bockenheimer Landstrasse 23 60325 Frankfurt am Main Germany Tel: (+49) 69 42 72 97 300 Fax: (+49) 69 42 72 97 301 GENEVA Branch of Exane S.A. Cours de Rive 10 1204 Geneva Switzerland Tel: (+41) 22 718 65 65 Fax: (+41) 22 718 65 00 LONDON Exane Ltd 20 St. James�s Street London SW1A 1ES UK Tel: (+44) 20 7039 9400 Fax: (+44) 20 7039 9432 / 9433 MILAN Branch of Exane S.A. Via dei Bossi 4 20121 Milan Italy Tel: (+39) 02 89631713 Fax: (+39) 02 89631701 NEW YORK Exane Inc. 640 Fifth Avenue 15th Floor New York, NY 10019 USA Tel: (+1) 212 634 4990 Fax: (+1) 212 634 5171 SINGAPORE Branch of Exane Ltd 20 Collyer Quay 08-01 Tung Center Singapore 049319 Tel: (+65) 6210 1909 Fax: (+65) 6210 1982 ZURICH Representative office of Exane S.A. Lintheschergasse 12 8001 Zurich Switzerland Tel: (+41) 1 228 66 00 Fax: (+41) 1 228 66 40 Exane research is also available on the website (www.exanebnpparibas-equities.com) as well as on Bloomberg (EXAA), First Call and Reuters.