air pollution and causes of death
TRANSCRIPT

Brit. J. prev. soc. Med. (1959), 13, 14-27
AIR POLLUTION AND CAUSES OF DEATHBY
CHARLES DALYUlverston, Lancs.
This paper describes a study of the relationshipbetween indices of air pollution and respiratory andother causes of death in the large towns of Englandand Wales.*
Although there are now well over a thousand in-
struments measuring air pollution in one way or
another in England and Wales, grave difficulties are
involved in using their results to measure the average
exposure to pollution experienced by the inhabitantsof any given town. Many instruments, for instance,have deliberately been sited near known sources ofpollution to measure changes in the level of pollu-tion over the years; and few towns have manyinstruments-Liverpool, for example, had only twoin 1954 (Department of Scientific and IndustrialResearch, 1955) and there is often considerablevariation in the levels indicated.
An attempt has therefore been made to find some
better and more meaningful measure of the degreeof air pollution to which the inhabitants of anytown have been exposed. The indices adopted were
based on the quantities of different fuels burntannually in each town, and the area in which theyare burnt.The 83 county boroughs (C.Bs) of England and
Wales were chosen for study because details of thenumbers of deaths in these towns have been pub-lished or otherwise made available by the GeneralRegister Office over a considerable period; 79 ofthem are in England, and four in Wales, and theyvary in size from Canterbury with a population of28,000, to Birmingham with a population of over
one million, the average (median) being about110,000.
Six groups of causes of death have been studied:
(1) Bronchitis(2) Pneumonia(3) Respiratory Tuberculosis(4) Lung Cancer(5) Other Respiratory Diseases(6) All Non-Respiratory Diseases.
The standard of diagnosis of these diseases may
vary in different parts of the country, but it is feltthat this is unlikely to invalidate the results obtained.Any relationship between the "social status" of a
town and the diagnostic criteria adopted by itsdoctors has been taken into account to some extentin the statistical techniques used in the study ofsocial indices. The death rates refer almost entirely tomales in the age group 45-64 years and cover the7-year period, 1948-54. Death rates for the age group
65-74 years refer to the 5-year period 1950-54, sincethe figures available were less detailed before 1950.The populations on which the various rates are
based are those of the 1951 Census. Details of thesedeath rates have been published by the GeneralRegister Office (1957).
MEASUREMENT OF FUEL CONSUMPTIONData on the consumption of different types of fuel
in the 1,330 local fuel overseer (L.F.O.) areas were
published by the Ministry of Fuel and Power (1955).Since most of the county boroughs were completeL.F.O. areas, the required statistics were readilyavailable and access to much unpublished data per-mitted reasonable estimates to be made of theamount of different types of fuel consumed in eachtown in, or about, the year May, 1951 to May, 1952.The domestic fuels are house coal, coke, anthracite,and boiler fuel, and the industrial fuels are smokelesssolid fuel, other solid fuel, and liquid fuels (i.e. gas/diesel oil, fuel oil, and creosote/pitch mixture).
* Most of this work was done while the author was a member ofthe staff of the Social Medicine Research Unit of the Medical Re-search Council.
14

AIR POLLUTION AND CAUSES OF DEATH
Details of the fuel consumed by the electricitygenerating stations were also available, but this hasnot been classed here as "industrial" fuel, the ques-
tion of air pollution by power stations being dealtwith separately. It was unfortunately impossible toobtain any information about air pollution by rail-ways and shipping. (For details of these statisticsand methods used to make certain estimates, see
Appendix.)One aim of the inquiry was to differentiate be-
tween the effects of smoke and sulphur pollution,and for this purpose the Fuel Research Station ofthe Department of Scientific and Industrial Researchsupplied estimates of the amounts of smoke andsulphur dioxide emitted by given quantities of eachof the fuels mentioned above. The amount of smokeand sulphur dioxide emitted annually in each C.B.was then estimated on this basis.
MEASUREMENT OF AREA
The area of a town in which fuel is burnt is the"built-up area". In a previous communication ofpreliminary results (Daly, 1954), use was made ofthe total area of each C.B., though it was pointedout that these areas often include considerable por-tions of agricultural or park land. Subsequentstudies showed a great range of variation in theproportion of a town's area which is "built-up".Smethwick, for example, is completely built-up,(according to the definition given below), whereasmore than 14,000 of Merthyr Tydfil's 17,760 acresdo not appear to be built on at all.
Since no data existed on the exact proportion ofbuilt-up area in each C.B., a separate inquiry wasundertaken to obtain the relevant information. TheMinistry of Housing and Local Government gaveaccess to the 6 in. to the mile maps of presentland utilization which had been submitted by eachcounty borough under the Town and Country Plan-ning Act, 1947. Details of the techniques involvedin delineating the requisite areas are given in theAppendix, but it can be mentioned here that thework was carried out independently by a geographer,W. T. W. Morgan, B.A., M.Sc. To reach the re-
quired figure, built-up areas were defined as allindustrial areas, together with residential areas,comprising as a minimum requirement "detachedor semi-detached houses with large gardens. Ex-cluded are those areas with detached houses havinggardens of more than one-third of an acre, usuallynot fronting a road."
MEASUREMENT OF AIR POLLUTION
In towns of the same built-up area, it is reasonableto assume that there is a direct relationship betweenthe amount of fuel burnt and the level of air pollu-tion. The amount of smoke emitted annually per
acre of built-up area was therefore taken as an indexof a town's pollution by smoke. A similar proceduregave an index of sulphur pollution, but it was foundthat these two indices were so highly correlated inthe 83 C.Bs, that it was impossible to differentiatebetween their respective effects, if any. For thisreason results for only one set of indices (i.e. dom-estic smoke and industrial smoke) are presented andthe indices have been termed "domestic pollution"and "industrial pollution".* (For values of theseindices for each C.B., see Appendix.) The twoindices have not been amalgamated to give some
general measure of air pollution, since the relation-ship between each index and the various causes ofdeath seems to differ. On a priori grounds, also, it isnot unreasonable to keep the two measures separate.For example, industrial chimneys are not so evenlyspread throughout a town as domestic chimneys andthe measure of their coal consumption per acre ofbuilt-up area may, therefore, be less meaningful.Further, industrial chimneys are very much higher,so that a much greater proportion of their emissionis probably dispersed into the atmosphere. It followsthat the "arbitrary units" adopted in this paper can
validly be used in comparisons between towns butmust not be taken to demonstrate the relative mag-nitudes of the domestic and industrial air pollutioneffects.Although a study of domestic and industrial fuel
consumption fails to indicate the relative importanceof the effects of smoke and sulphur emission onhealth (as measured by mortality rates), it has beenpossible to study the problem in another way. Powerstations are essentially sulphur-emitting agents, andif pollution from this source is shown to have an
effect on health then sulphur would probably beincriminated. Since they are point sources of pollu-tion, however, the techniques used for measuringdomestic and industrial pollution are inapplicable.This particular problem is approached by a differentmethod which is outlined later.
Correlation.-In correlating the indices of pollu-tion with the death rates, one important feature must
* For reasons which will be discussed later the logarithm of indus-trial smoke per acre has been used as the "industrial pollution" indexin the calculation of correlation co-efficients.
15

CHARLES DALY
be mentioned. When any variables are subject tosampling error, the correlation co-efficient tends tounderestimate the true relationship between the twocharacteristics. Technically, it is said to be "attenu-ated". Death rates in a town vary from year to year,and even rates based on 7-year data are only esti-mates of some hypothetical death rates. This facthas had to be taken into account in the resultswhich follow, since six causes of death are dealt with,each affected by attenuation error to a varyingextent. When bronchitis death rates are involved,the corrected value of r is 3 per cent. greater thanthe calculated value; for pneumonia the correspond-ing figure is 16 per cent.; for respiratory tuberculosis9 per cent.; for lung cancer 12 per cent.; for otherrespiratory diseases 29 per cent.; and for all non-respiratory diseases 5 per cent.* It should be noted,however, that these values may still be under-esti-mates, since they do not take into account anydiagnostic error.
There is no doubt that the air pollution indicesare also subject to considerable error, but it is im-possible to measure the extent of this, and no attempthas been made to correct the relevant values of r.The same applies to the various social indicesstudied; these are probably imperfect measures ofsome underlying "social factor", but how imperfectthey are is unknown.
EFFECTS OF DoMESTIC AND INDUSTRIAL AIRPOLLUTION
The basic results are presented in Table I, whichshows a high correlation between domestic airpollution and five of the six groups of causes ofdeath, including the non-respiratory diseases.
TABLE IASSOCIATION BETWEEN INDICES OF DOMESTIC ANDINDUSTRIAL AIR POLLUTION AND DEATH RATES FROMCERTAIN CAUSES IN THE 83 COUNTY BOROUGHS OFENGLAND AND WALES, MALES AGED 45-64 YEARS; 1948-54
Air PollutionCause of Death
Domestic Industrial
Bronchitis .070 (0 68) 062 (0*60)Pneumonia . .060 (052) 052 (0*45)Respiratory tuberculosis 0*59 (0 54) 0*22 (0*20)Lung cancer . .54 (0*48) 020 (0*,18)Other respiratory diseases 0*27 (0*21) 0*01 (001)All non-respiratory diseases 0*50 (0-48) 0* 35 (0* 33)
Values of the correlation co-efficient r corrected forattenuation error.
Uncorrected values are given in brackets.
* It is hoped to publish a paper describing the mathematical treat-ment of this problem in due course.
Bronchitis shows the highest degree of association,followed by pneumonia, respiratory tuberculosis,lung cancer, and all non-respiratory diseases-inthat order-all showing a substantial associationwith domestic pollution. Other respiratory diseasesshow the least close association. Industrial pollutionshows a clear association with bronchitis and withpneumonia, rather less with the non-respiratorydiseases, and no significant degree of relationshipwith tuberculosis, lung cancer, and other respiratorydiseases.
Bronchitis and lung cancer are probably of mostinterest here, and Figs 1 and 2 (opposite) presentgraphically the associations between these causes ofdeath in middle-aged males and the two pollutionindices. Bronchitis shows a clear upward trend withdomestic air pollution, those towns with lowpollutionhaving low rates, and those towns with high pollutiontending to have the highest rates. With cancer ofthe lung there is a slight upward trend, but it is clearthat domestic air pollution cannot account for muchof the differences in the death rates between thevarious towns.
Fig. 2 picks out three towns (St. Helens, Middles-brough, and Stoke-on-Trent) with exceptionallyhigh indices of industrial air pollution (as measuredhere). Their bronchitis death rates, however, are notcorrespondingly high-being only a little above theaverage. The inclusion of these towns in the calcu-lation of the correlation co-efficient would have adisproportionate effect, and the logarithm of "in-dustrial smoke per acre" has therefore been used asthe index of industrial air pollution. This procedureis not applied without precedent, since one isaccustomed in biological work to encounter "dose-response curves" in which there is a linear relationbetween the res~ponse and the logarithm of the dose.It is worth noting that the co-efficient measuring thecorrelation between the bronchitis death rates andthe logarithm of the industrial air pollution indexis very similar to that obtained when the same deathrates are correlated with the unadjusted index of airpollution for all the C.Bs excluding the three alreadymentioned. Fig. 2A shows a clear upward trend, butFig. 2B shows only a slight trend.
OCCUPATIONAL FACTORSBefore further discussing the various features of
Table I, some mention should be made of the groupof "other respiratory diseases". This miscellaneousgroup may sometimes include many deaths due tooccupational hazards:-Stoke-on-Trent and MerthyrTydfil have rates of 89 and 131 per 100,000 respec-tively, while no other town has a rate greater than
16

AIR POLLUTION AND CAUSES OF DEATH
[Al BRONCHITIS
* : * *: **
*~~~~~~
* . .% .
. .
0
...
*1- *.
01:0
. .,
q
[B] LUNG CANCER
* *
* :*. .***.0
10 20 30 40 50 60 70 80 10 20 30 40 50 60 70DOME ST I C AI R PO L L UT ION [Arbirrary Units]
FIG. I.-Death rate per 100,000 males aged 45 to 64 years from (A) Bronchitis and (B) Lung Cancer related to air pollutionin 83 county boroughs.
80
[A] BRONCHITI S
o°0 200-0O0W. ISO -
cUa.
100-4aU
.0
.0
531@E0K0-TUENT NIOOLIOSOOUGH
ST HELIN3
20 40 60 80 100 120 140 160 180;INDUSTRIAL AIR POLLUTION ['Arbitrary Units I
FIG. 2A.-Death rate per 100,000 males aged 45 to 64 years from bronchitis relatedto industrial air pollution in 83 county boroughs.
300 [8] LUNG CANCER
25000° 200-00w 150-00
004cm
so5
.0 0 0
0 0:%0 0
-W t.-00.0%*b% ,. oO.. 840 0 0
0160
007
2501000 200-d0
= 1 0-
00CLU)
a
50-
17
STAlMOM
20 40 60 80 100 120 140 160 I8O 200INDUSTRIAL AIR POLLUTION [Arbitrary Units I
FIG. 2B.-Death rate per 100,000 males aged 45 to 64 years from lung cancerrelated to industrial air pollution in 83 county boroughs.
IA
n I
I
.& 0
09
: .0
I

CHARLES DAL Y
50 per 100,000. These figures presumably reflect theincidence of silicosis among potters, and of pneumo-coniosis among coal miners. In view of this, it isnecessary to bear in mind that the rates for "otherrespiratory diseases" may be distorted by occupa-tional differences between the populations in eachtown.
That occupational differences probably have littleeffect on the male death rates from bronchitis isdemonstrated by Fig. 3, which compares male andfemale mortality from bronchitis at ages 45-64 years.With the exception of Oldham and to a lesser extentBolton, Bury, and Burnley, the points on the scatterdiagram all lie very near to a straight line, indicatingthat the ratio of the male to the female death rate(about 4:1) is approximately the same in each C.B.As far as the four Lancashire towns are concerned,it is not unreasonable to suggest that an occupationalfactor affects the female cotton workers particularlyin Oldham. This is in agreement with some of thework of Schilling (1956) on byssinosis in Oldham.A similar technique cannot be applied to the com-
parison of male and female mortality from lungcancer, since the female death rates are based onrelatively small numbers of deaths and liable to con-siderable error. Alternative methods of statisticalanalysis (Woolf, 1955) do show, however, that aftertaking these errors into account the ratio of male tofemale death rates in each town could be constant.(Bury may be a possible exception to this, since inthe period studied 5 77 female deaths were to beexpected, whereas fifteen actually occurred.)
INFLUENZA EPIDEMICS
Because epidemics of influenza affect the recordedbronchitis death rates it was thought worthwhile toexamine the statistics to see whether this had beenimportant in the period studied-which includes two"flu" years. Ten C.Bs were chosen at random and
tu 100-
so-
080-
S<< °.60-lgo0
10ut)-40 -w*- *5*
20#
og
the numbers of deaths from bronchitis in each townwere tabulated for each year separately. A test wasthen carried out to see if the pattern of deathsbetween the towns varied from year to year. Theresulting value of X2 = 60 77, 54 d.f. (P = 0 25)gave no grounds for believing that the inclusion ofthese "flu" years had noticeably disturbed the patternof the bronchitis death rates.
OTHER FACTORS
The chief feature of Table I is the importance ofthe relationship between both indices of air pollutionand the bronchitis death rates. When the combined"effects" of the pollution indices are considered(using the technique of multiple correlation), it isfound that they could together account for about 60per cent. of the existing variation in the death ratesbetween towns. (Since the pollution indices aresubject to error, it is probable that this value is anunderestimate.) However, no account has yet beentaken of the fact that the 83 C.Bs differ greatly inmany ways apart from air pollution. The extent ofovercrowding, the social structure, and the tempera-ture, humidity, and other climatic factors are allvariable. It is impractical for every possible factorto be taken into account, but data from the 1951Census give indications of the "social" differences.As far as climatic effects are concerned, though theC.Bs on Tyneside compare unfavourably with thoseon Merseyside and near Manchester as far as tem-perature* is concerned, they have lower death ratesfrom bronchitis.For topographical reasons, some towns have more
natural fog than others and are therefore more liableto episodes of "smog". It has not been possible,however, to take this into account.
* Tyneside also compares unfavourably with Merseyside andManchester with regard to overcrowding.
"OHA#
W" y BURLEY 0
.BOLTON
*I .00* --a * *O0
.
0 ~ ~
300
FiG. 3.-Male and female death rates per 100,000 persons aged 45 to 64 years in 83 county boroughs.
50 100 160 200 260MALE BRONCHITIS DEATH RATE. PER 100.000
V
18

AIR POLLUTION AND CAUSES OF DEATH
Towns also differ in the amount of air pollutionreceived from external sources. Apart from emis-sions from its own chimneys, a town such as Bootlemust receive pollution from those of its neighbourLiverpool, whereas a town such as Norwich is rela-tively unaffected by pollution from other areas. Totest whether the nature of the surrounding areaintroduced any bias to the results, the sixteen C.Bscompletely surrounded by rural areas were studied.Although these include Warrington, situated be-tween, and only a few miles from, the Manchesterand Merseyside "conurbations" the degree of rela-tionship between bronchitis mortality and domesticair pollution is still high-r = 0 55. (A similarfigure is obtained when Warrington is excluded fromthe analysis.)
Table II shows the association between the deathrates and four social indices: (a) "social class"structure; (b) overcrowding; (c) population density;and (d) education.
Calculation of Indices. (For the values for eachC.B. see Appendix):
(a) Using the Registrar General's classification ofoccupations (General Register Office, 1951), and1951 Census data on the proportions of the five socialclasses so defined which were to be found in theC.Bs, a score of 1 to 5 was assigned to each of thesocial classes and a weighted average score wasobtained for each C.B.t They ranged from 2.90 inBournemouth to 3- 64 in Bootle.
(b) The index of overcrowding adopted was theproportion of households living more than oneperson per room. It ranged from 8 1 per cent. inGreat Yarmouth to 34 9 per cent. in Gateshead.
(c) From the point of view of spread of infectionit may be argued that people living in towns with ahigh density of population (measured by the number
t Similar results were obtained using "the proportion in SocialClasses IV and V".
of persons per acre) are more liable to respiratorydiseases than people living in towns with a lowerdensity. But any measure of density obtained bydividing the total population by the area of a townis obviously highly correlated with domestic airpollution. The following procedure was used toobtain a more meaningful measure of populationdensity, and one which is less highly related to airpollution, so that it is easier to distinguish betweenthe effects, if any, of both of these factors.
Besides the maps of present land utilization at theMinistry of Housing and Local Government alreadydescribed, there exist certain statistics about landuse, such as the population densities in a number of"areas of similar development" within each town.(These areas might comprise a new council housingestate, or several streets of terraced houses, and soon.) The average (median) of these densities has beentaken as the required measure. For instance, themedian population density of Stoke-on-Trent is48-6 persons per acre, which means that half thepopulation live at a lower population density andhalf at a higher density. The values obtained for the83 C.Bs ranged from 21 * 3 persons per acre inBournemouth to 87 6 persons per acre in Bootle.
(d) The proportion of occupied males in any townwho left school before the age of 15 years was usedas a measure of differences in education. The pro-portion ranged from 64- 5 per cent. in Plymouth to87 5 per cent. in Stoke-on-Trent and Warrington.
BRONCHITIS
Table II shows that with bronchitis the correlationco-efficients are about the same level for the socialindices as for the air pollution indices. The highestdegree of association appears to be with "educa-tional level" and the lowest, surprisingly, with"population density", but all four social indices arehighly inter-related, and it is likely that they are
TABLE IIASSOCIATION BETWEEN FOUR "SOCIAL" IND1WES AND DEATH RATES FROM CERTAIN CAUSES IN THE 83 COUNTY
BOROUGHS OF ENGLAND AND WALES. MALES AGED 45-64 YEARS; 1948-54
Social IndicesCause of Death
Social Class Overcrowding Population Density Education
Bronchitis 0-64 (0 62) 0 50 (0 48) 0-47 (0-46) 0-73 (0 71)Pneumonia .063 (0 54) 0*51(0*44) 0*47 (0*40) 0*44 (0 38)Respiratory tuberculosis. 049 (0*45) 0*64 (0*59) 0*47 (0*43) 0*31 (0*28)Lung cancer. 038 (0*34) 0*48 (0*43) 0*45 (0*40) 0*21 (0*19)Other respiratory diseases. 028 (0*22) 0*11 (0*09) 0*02 (0*02) 0*16 (0*12)All non-respiratory diseases. 034 (0*32) 0*31 (0*30) 0 37 (0 35) 0*27 (0*26)
Values of the correlation co-efficient r corrected for attenuation error.Uncorrected values are given in brackets.
19

CHARLES DALY
simply different aspects of a certain factor which insome very complex way, can be thought of asmeasuring social differences between towns.While clearly it would be desirable to analyse the
data so as to be able to state that a certain propor-tion of the variation in the bronchitis rates was dueto air pollution, and another proportion to socialfactors, this is not possible with any reasonabledegree of precision. Broad conclusions can, however,be drawn. When bronchitis mortality is correlatedwith domestic and industrial air pollution, and the"effects" of social factors (assuming these to be directeffects) are eliminated,* a correlation co-efficientr = 0-47 is obtained. When bronchitis mortalityis correlated with "social" factors, and the "effects"of air pollution (assuming now that these aredirect effects) are eliminated, we obtain r 0-39.Both these values are highly significant, indicatingthat air pollution and social factors have an inde-pendent and real effect, and in view of the similarityof these correlation co-efficients, it is not unreason-able to infer that these effects are of similar magni-tude. Since it can be shown that about two-thirdsof the variation in the bronchitis death rates couldbe attributed to the combined effects of air pollutionand social factors (as measured), it follows that aboutone-third of the variation in mortality could beattributed to air pollution and about one-third tosocial factors. In view of the imperfections of theindices used, it is likely that these proportions are
under-estimated, but it is not possible with thematerial available to determine the reasons for theresidual third of the variation in mortality.
It can be noted that, in the London area, theMetropolitan Borough with the lowest bronchitisdeath rates for males aged 45-64 years or 65-74years is Chelsea, which has both a high "socialstatus"t and an above average level of air pollution-(and incidentally, several large power stations inthe near vicinity). It could be inferred from this thatair pollution is less important than social factors.However, even if air pollution is implicated in only30 per cent. of all bronchitis deaths in England andWales, this is equivalent to more than 7,500 deathsin any one year.
LUNG CANCER
Table I and Figs 1 and 2 have shown that therelationship between lung cancer deaths and air
pollution is less than that between bronchitis deathsand air pollution. As far as the present indices areconcerned, only 'about 35 per cent. of the variationin lung cancer mortality between the towns could beattributed to the combined effect of both pollutionand social indices. A co-efficient of r = 0-31 isobtained when the death rates are correlated withair pollution after eliminating the effects of thesocial indices, and a co-efficient of r = 0-25 whenthey are correlated with social indices after elimin-ating the effects of air pollution. There is, therefore,no indication here that air pollution is a major factorin the aetiology of lung cancer. The fact that dom-estic air pollution demonstrates a rather highercorrelation with this cause of death than does in-dustrial air pollution may be relevant to the hypo-thesis that the benzpyrene in town air is an aetio-logical agent; Waller (1952), who made measure-
ments in various towns, expressed the opinion thatmost of this benzpyrene derived from domestic fires.
If only 35 per cent. of the difference in the lungcancer death rates between county boroughs can beascribed to differences in air pollution or to "social"differences, can the remainder be ascribed to differ-ences in smoking habits between the towns? In an
attempt to answer this question, the results of amarket survey study by Research Services Ltd. havebeen used. Their data cover the period August, 1952,to December, 1955. Using the technique of quotasampling, men and women of different ages were
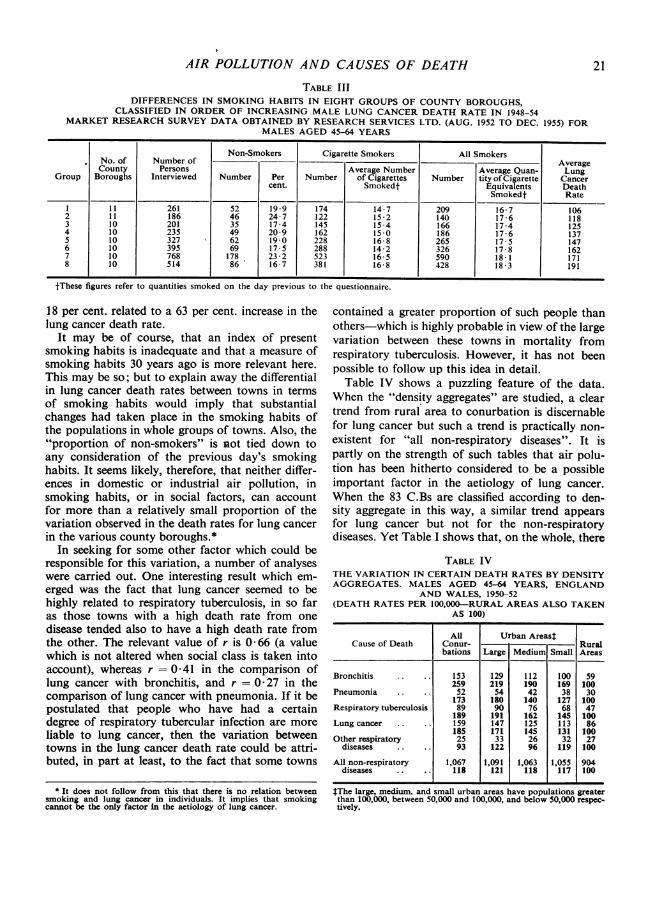
interviewed in almost every administrative area inEngland and Wales and their smoking habits dis-cussed. The following results were confined to malesaged 45-64 years. Only one county borough (Dews-bury) was missed in this study. Some of these townsare relatively small, and consequently had few inter-views. It was decided therefore to split the townsinto eight groups-the first group of eleven townscomprising those with the lowest lung cancer ratesfor males aged 45-64, and the last group of tentowns comprising those with the highest rates. Theresults are summarized in Table III (opposite).There is a considerable range of variation in the
lung cancer rates, Group 1 having an average rateof 106 per 100,000 while Group 8 has an averagerate of 191 per 100,000. The trend in the death ratesis not, however, repeated to any marked extent inthe various indices of smoking habits. As far as theproportions of non-smokers and cigarette smokersonly are concerned, there is little indication that theaverage amount smoked varied very much from onegroup of towns to another. (This was also the casefor males aged 65-74 years.) At the most, if weconsider the number of cigarettes smoked per malein these groups of towns, we get an increase of about
* Using the "combined partial correlation co-efficient" describedby Stouffer (1934). Only two social indices have been used-thosegiving the highest values of r. The addition of the others has a negli-gible effect.
t This is equivalent to a low social index on the scale described.
20
AIR POLLUTION AND CAUSES OF DEATH
TABLE IIIDIFFERENCES IN SMOKING HABITS IN EIGHT GROUPS OF COUNTY BOROUGHS,
CLASSIFIED IN ORDER OF INCREASING MALE LUNG CANCER DEATH RATE IN 1948-54MARKET RESEARCH SURVEY DATA OBTAINED BY RESEARCH SERVICES LTD. (AUG. 1952 TO DEC. 1955) FOR
MALES AGED 45-64 YEARS
Non-Smokers Cigarette Smokers All SmokersNo. of Number of AverageCounty Persons Average Number Average Quan- Lung
Group Boroughs Interviewed Number Per Number of Cigarettes Number tity ofCigarette Cancercent. Smokedt Equivalents Death
Smokedt Rate
1 11 261 52 19 9 174 14-7 209 16 7 1062 11 186 46 24-7 122 15*2 140 17-6 1183 10 201 35 17 4 145 15-4 166 17-4 1254 10 235 49 20-9 162 15-0 186 17-6 1375 10 327 62 19*0 228 16-8 265 17*5 1476 10 395 69 17-5 288 14-2 326 17-8 1627 10 768 178 23-2 523 16-5 590 18-1 1718 10 514 86 16 7 381 16-8 428 18 3 191
tThese figures refer to quantities smoked on the day previous to the questionnaire.
18 per cent. related to a 63 per cent. increase in thelung cancer death rate.
It may be of course, that an index of presentsmoking habits is inadequate and that a measure ofsmoking habits 30 years ago is more relevant here.This may be so; but to explain away the differentialin lung cancer death rates between towns in termsof smoking habits would imply that substantialchanges had taken place in the smoking habits ofthe populations in whole groups of towns. Also, the"proportion of non-smokers" is not tied down toany consideration of the previous day's smokinghabits. It seems likely, therefore, that neither differ-ences in domestic or industrial air pollution, insmoking habits, or in social factors, can accountfor more than a relatively small proportion of thevariation observed in the death rates for lung cancerin the various county boroughs.*
In seeking for some other factor which could beresponsible for this variation, a number of analyseswere carried out. One interesting result which em-
erged was the fact that lung cancer seemed to behighly related to respiratory tuberculosis, in so faras those towns with a high death rate from onedisease tended also to have a high death rate fromthe other. The relevant value of r is 0-66 (a valuewhich is not altered when social class is taken intoaccount), whereas r = 0-41 in the comparison oflung cancer with bronchitis, and r = 0-27 in thecomparison of lung cancer with pneumonia. If it bepostulated that people who have had a certaindegree of respiratory tubercular infection are moreliable to lung cancer, then the variation betweentowns in the lung cancer death rate could be attri-buted, in part at least, to the fact that some towns
contained a greater proportion of such people thanothers-which is highly probable in view of the largevariation between these towns in mortality fromrespiratory tuberculosis. However, it has not beenpossible to follow up this idea in detail.
Table IV shows a puzzling feature of the data.When the "density aggregates" are studied, a cleartrend from rural area to conurbation is discernablefor lung cancer but such a trend is practically non-existent for "all non-respiratory diseases". It ispartly on the strength of such tables that air polu-tion has been hitherto considered to be a possibleimportant factor in the aetiology of lung cancer.When the 83 C.Bs are classified according to den-sity aggregate in this way, a similar trend appearsfor lung cancer but not for the non-respiratorydiseases. Yet Table I shows that, on the whole, there
TABLE IVTHE VARIATION IN CERTAIN DEATH RATES BY DENSITYAGGREGATES. MALES AGED 45-64 YEARS, ENGLAND
AND WALES, 1950-52(DEATH RATES PER 100,000-RURAL AREAS ALSO TAKEN
AS 100)
All Urban AreastCause of Death Conur- Rural
bations Large Medium Small Areas
Bronchitis .. 153 129 112 100 59259 219 190 169 100
Pneumonia .. 52 54 42 38 30173 180 140 127 100
Respiratory tuberculosis 89 90 76 68 47189 191 162 145 100
Lung cancer .. 159 147 125 113 86185 171 145 131 100
Other respiratory 25 33 26 32 27diseases .. 93 122 96 119 100
All non-respiratory 1,067 1,091 1,063 1,055 904diseases .. 118 121 118 117 100
tThe large, medium, and small urban areas have populations greaterthan 100,000, between 50,000 and 100,000, and below 50,000 respec-tively.
* It does not follow from this that there is no relation betweensmoking and lung cancer in individuals. It implies that smokingcannot be the only factor in the aetiology of lung cancer.
21
CHARLES DALY
is rather less correlation between air pollution andlung cancer than between air pollution and non-respiratory diseases. It would appear from thesefacts that lung cancer is related in some way to thesize of the town, though it is difficult to see how.This has been confirmed by a study of the mortalityrates in the 83 C.Bs, which showed a significantassociation between population and lung cancermortality but practically none between populationand respiratory tuberculosis mortality.One final point worth bearing in mind before the
density aggregates are used to draw conclusionsabout the effects of air pollution is that the largeurban areas (those with a population of 100,000 ormore-outside the conurbations) include such rela-tively non-polluted towns as Blackpool, Bourne-mouth, Norwich, and Southend.
OTHER CAUSES OF DEATH
One interesting feature of Table I insofar ascauses of death other than bronchitis and lungcancer are concerned, is the relatively high correla-tion between air pollution and all non-respiratorydiseases. Neither lung cancer, respiratory tubercu-losis, nor other respiratory diseases show any signi-ficant correlation with industrial air pollution, yetwith the non-respiratory diseases r= 0 35. Althoughfour of the causes of death studied showed closerrelationships with domestic air pollution, the valueof r = 0 50 obtained by correlating with the non-respiratory diseases is very highly significant. Onepossible explanation is that "good health" is beingmeasured here, and that this is associated with expo-sure to sunshine, which, in towns, is considerablyreduced by air pollution. When the non-respiratorydiseases are correlated with both pollution indices,after eliminating the effects of the two main socialindices, a value of r = 0 35 is obtained, which isstill relatively high.Pneumonia shows much the same tendencies as
bronchitis, and the relevant correlation co-efficientsin Tables I and II are very similar. However, whenpneumonia is correlated with both pollution indices,after eliminating the effects of social factors, r =0 28 which is very much less than the correspondingfigure of 0 *47 for bronchitis.
Respiratory tuberculosis shows some correlationwith domestic air pollution but little with industrialair pollution. As one would expect, it is most highlyassociated with overcrowding. When correlatedwith air pollution, after eliminating social factors,r = 0-33.
Other respiratory diseases do not appear to becorrelated with any of the indices studied.
AIR POLLUTION BY POWER STATIONS
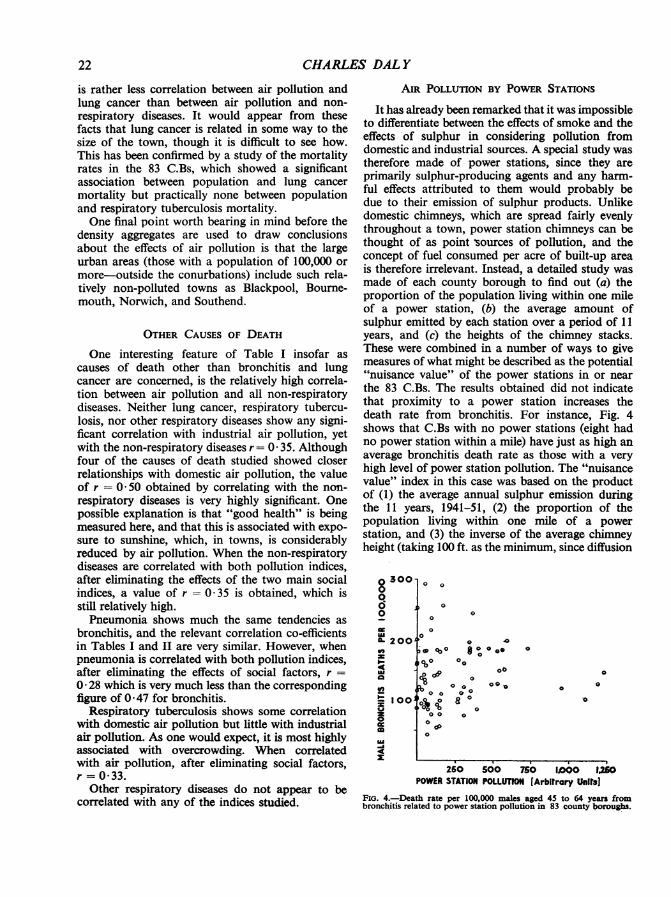
It has already been remarked that it was impossibleto differentiate between the effects of smoke and theeffects of sulphur in considering pollution fromdomestic and industrial sources. A special study wastherefore made of power stations, since they areprimarily sulphur-producing agents and any harm-ful effects attributed to them would probably bedue to their emission of sulphur products. Unlikedomestic chimneys, which are spread fairly evenlythroughout a town, power station chimneys can bethought of as point sources of pollution, and theconcept of fuel consumed per acre of built-up areais therefore irrelevant. Instead, a detailed study wasmade of each county borough to find out (a) theproportion of the population living within one mileof a power station, (b) the average amount ofsulphur emitted by each station over a period of 11years, and (c) the heights of the chimney stacks.These were combined in a number of ways to givemeasures of what might be described as the potential"'nuisance value" of the power stations in or nearthe 83 C.Bs. The results obtained did not indicatethat proximity to a power station increases thedeath rate from bronchitis. For instance, Fig. 4shows that C.Bs with no power stations (eight hadno power station within a mile) have just as high anaverage bronchitis death rate as those with a veryhigh level of power station pollution. The "nuisancevalue" index in this case was based on the productof (1) the average annual sulphur emission duringthe 11 years, 1941-51, (2) the proportion of thepopulation living within one mile of a powerstation, and (3) the inverse of the average chimneyheight (taking 100 ft. as the minimum, since diffusion
o 300-00o0
L 200J
Ina
cz
z
to
J2
o 0
00
0
o 40Co %0 *Oa@0 0Os c900o o0
0 o °%* * G *
Po a o o
'oa
o~
0
260 500 750 I.0D0 1.260POWER STATION POLLUTION [Arbitrary UnWist
FIG. 4.-Death rate per 100,000 males aged 45 to 64 years frombronchitis related to power station pollution in 83 county boroughs.
22

AIR POLLUTION AND CAUSES OF DEATH
effects will probably be similar below that height).No greater correlation was obtained when variousother combinations of these factors were studied.Admittedly, this is an indirect method of measuringpower-station pollution, but in considering as manyas 83 towns, it is not unreasonable to expect sometrend to be apparent if an effect really exists. Thiswork confirms some recent conclusions that powerstations make no appreciable difference to the levelsof sulphur dioxide in a built-up area (Jarvis andAustin, 1957).
SUMMARYIndices of air pollution from domestic and in-
dustrial sources in the 83 county boroughs of Eng-land and Wales have been calculated, using informa-tion about fuel consumption in defined built-upareas. These indices have been correlated with deathrates from various respiratory and other diseasesamong middle-aged males. The results show a rela-tively close association between these measures ofair pollution and bronchitis, and a relatively lowassociation between air pollution and lung cancer.Allowance for social class differences between townsreduces but does not abolish the correlation withbronchitis mortality. Various hypotheses for thevariations in mortality are put forward.An attempt has been made to measure the effect
of air pollution from sulphur products by studying
the power stations in or near each town. The resultsgive no reason to suppose that proximity to a powerstation has any noticeable effect on bronchitismortality.
This study has been made possible by the help andco-operation of many organizations, including theGeneral Register Office, the Ministry of Fuel and Power,the House Coal Distribution (Emergency) Scheme, theFuel Research Station of the D.S.I.R., the Ministry ofHousing and Local Government, the Central ElectricityAuthority, the Gas Council, the Tobacco Manufacturers'Standing Comnmittee, and the Royal GeogriphicalSociety. I should also like to thank Mr. W. T. W. Morganwho gave most invaluable help in calculating the built-upareas, Dr. J. N. Morris and Mr. J. A. Heady for muchadvice, and Mrs. V. Hall for most of the work ofcomputation.
REFERENCESBeaver Committee on Air Pollution (1954). Report, Cmd. 9322.H.M.S.O., London.
Daly, C. (1954). Brit. med. J., 2, 687.Department of Scientific and Industrial Research. (1955). "The
Investigations and Atmospheric Pollution: A Report on Observa-tions in the 10 years ended 31st March, 1954. 27th Report."H.M.S.O., London.
General Register Office (1951). "Classification of Occupations, 1950."H.M.S.O., London.
-(1957). Quarterly Return, No. 432, Appendix D (4th Qtr., 1956).H.M.S.O., London.
Jarvis, W. D., and Austin, L. G. (1957). J. Inst. Fuel, 30, 435.Ministry of Fuel and Power. (1955). "Statistical Digest, 1954."H.M.S.O., London.
Schilling, R. (1956). Personal communication.Stouffer, S. A. (1934). J. Amer. stat. Ass., 29, 70.Wailer, R. E. (1952). Brit. J. Cancer., 6, 8.Woolf, B. (1955). Ann. hum. Genet., 19, 251.
APPENDIX
FUEL CONSUMPTION DATA.-The sources of datawere as follows:
Domestic
(1) HOUSE COAL
(a) Distributed by Merchants.-These data,referring to distribution in "house coaldistricts", were obtained from the weeklyreturns of the House Coal Distribution(Emergency) Scheme;
(b) Distributedas Miners' Concessionary Coal.No direct data were available about thedistribution by the National Coal Boardof miners' coal in each county borough,but the General Register Office madeCensus material available concerning thenumber of miners in each town. By multi-plying by the average amount of coal
received annually by each miner, the re-quired estimates were obtained.
(2) COKE
(a) Distributed by Merchants.-As for 1(a).(b) Distributed directly by Gasworks.-The
Gas Council supplied rough estimates foreach county borough.
(3) ANTHRACITE AND BOILER FUEL.-Distributedby merchants, as for 1(a).
Industrial
(1) Data referring to consumption in local fueloverseer areas of both smokeless and othersolid fuels were obtained from the Ministryof Fuel and Power's Statistical Digest for1954.
23

CHARLES DALY
(2) Data for liquid fuels (gas/diesel oil, fuel oil,and creosote-pitch mixture) were obtainedpartly from the same source, and partlyfrom the more detailed records of theMinistry of Fuel and Power.
All these data refer to county boroughs, housecoal districts, and local fuel overseer's areas. Thesedo not coincide, but a practical example shows howcomparable statistics were obtained for one countyborough-the basic unit of area, since the deathrates are based on the populations living in eachcounty borough.
In the year May, 1951, to May, 1952, the period towhich most of the fuel consumption statistics refer, themerchants in the "house coal district" of Gloucestersupplied 51,756 tons of house coal to 35,060 registeredpremises. This is equivalent to 1-4762 tons per registeredpremise.
The relevant L.F.O. area comprises Gloucestercounty borough and Gloucester rural district, andonly their total number of registered premises isknown, in this case 37,156. The 1951 Census datashowed that there were 18,952 households in theC.B. and 8.904 in the rural district. On the whole,the number of registered premises is proportionalto the number of households so calculation gives:
(18,952 ± 8,904) = 25,281 households
in the county borough as the estimate. It was assumedthat these households received the same averagequantity of house coal as the 35,060 served by themerchants, giving as a final estimate 25,281 x 1 -4762= 37,320 tons of house coal consumed in the countyborough of Gloucester.
A similar procedure was carried out for coke andanthracite, and boiler fuel distributed by merchants,and it was estimated that 6,558 tons of coke and3,153 tons of anthracite or boiler fuel were alsoconsumed in the county borough in the stated period.About 4,200 tons of coke were distributed by gasworks
to "domestic and other users", and as the proportiongoing to "domestic users only" was about 33 per cent.in the whole South-Western region, it was assumed that33 per cent. of 4,200 = 1,400 tons were consumed bydomestic users in the county borough. The remaining2,800 tons were included in the industrial fuel statistics.
The number of miners living in Gloucester at thetime of the 1951 Census being negligible, the estima-tion of miners' concessionary coal is best illustratedby a town such as Doncaster, which then contained2,273 miners aged 15-64 years.
The 612,400 such miners in the whole of England andWales received a total of 5,200,000 tons of concessionarycoal in 1951/52, so that
5,200,000-1930tn2,273 x 19,300 tons612,300
may be taken as the amount of coal consumed byminers in this county borough.
Although most of the county boroughs comprisedcomplete L.F.O. areas, some of them had beenamalgamated with one or more urban or ruraldistrict to form a single L.F.O. area. Since the in-dustrial coal statistics only applied to the latter, itwas necessary to make some estimate of the pro-portion of industrial fuel consumed in the C.B.itself. This was done by using data supplied by theMinistry of Housing and Local Government on therateable value of industrial hereditaments in eachcounty borough, urban district, and rural district.
For example, Gloucester L.F.O. area consists ofGloucester C.B. and Gloucester R.D., in which the rate-able value of the industrial hereditaments were respec-tively £16,376 and £19,796. Since 77,400 tons of non-smokeless solid fuel were used by industrial consumersin the L.F.O. area, those in the C.B. presumably used
77,400 x (16,376 - 19 796)= 35,039 tons.
A similar procedure was carried out for the otherindustrial fuels.
Finally, when the fuel used by carbonization andbriquetting plants (i.e., gas works, coke ovens, etc.),is burnt, only a small proportion of the products ofcombustion are released to the atmosphere. TheBeaver Committee (1954) shows, for instance, that27 - 2 million tons of fuel were supplied to gas worksin 1953, but that only 6 2 million tons of fuel wereburnt. Allowance has therefore been made for thiseffect, though results are complicated by the factthat the fuel burnt in coke ovens consists of a gas,The resulting figures have been included in the in-dices of "industrial air pollution".
MEASUREMENT OF BUILT-UP AREAS.-The Ministryof Housing and Local Government gave access tothe 6-in. to the mile maps of present land utilizationwhich had been submitted under the Town andCountry Planning Act, 1947, by each county boroughand a number of other towns. These maps have beenbased on surveys made between 1947 and 1952, mostof them being completed between 1949 and 1951.The following procedure was adopted-all workbeing carried out independently by Mr. W. T. W.Morgan.
24

AIR POLLUTION AND CAUSES OF DEATH
The industrial and residential areas were tracedout in each town, the minimum qualification for a
"residential" area being defined beforehand as
"detached or semi-detached houses with largegardens. Excluded are those areas with detachedhouses having gardens of more than one-third of anacre usually not fronting a road". A line was thendrawn on the map at an arbitrary distance of halfan inch round these areas to eliminate subjectivejudgment in deciding whether an embayment of openland should be included in the built-up area or
whether a detached portion of the town was farenough away to require separate consideration. Asimilar procedure in reverse determined how muchof a large park or waste area in the middle of a townshould be included in the built-up area. The use ofthis "half inch line" does, of course, make the re-
sulting area for any single town slightly artificial,but as this study was designed for purposes of com-parison between towns this was felt to be unim-portant in comparison with its advantages. The"half inch line" also has the property of over-esti-mating the extent of a long, irregularly shaped townin comparison with that of a compact town. Thismeans that the air pollution of the former will beunder-estimated, which is as it should be, since morewill be lost by dispersion. Thus, the indices of airpollution take into account, not only fuel consump-
tion and built-up area, but also to some extent theshape of each town.
When a "pocket" of population exists away fromthe main part of the town, it is necessary to takeinto account the population density of each area;otherwise a large but lightly-populated districtwould have a disproportionate effect on the estimateof built-up area. This has been done by assumingthat the population in each separate area consumesthe same quantity of domestic fuel per head, calcu-lating the fuel consumption per acre of built-up areafor each part separately, and finding the weightedaverage of these values, using the population in eachpart as weights.
"ATTENUATION".-The formula used in calculat-ing correlation co-efficients where death rates arecompared with pollution or social indices is theusual one, except that the root mean square referringto the death rates in the denominator is given by:
1 83 2 82 83
AV 83 2(R -)(i3)2 > S
where R1 refers to the death rates, R is the averageof these death rates, and S,2 refers to the samplingvariances of each of these 83 death rates.
This contrasts with the usual term:
VLZ832(R183 2AV 83 1(R1 - IR).
PARTICULARS OF 83 COUNTY BOROUGHS SHOWING NUMBER OF MALES AGED 45-64 YEARS (AT THE 1951 CENSUS),
AIR POLLUTION AND SOCIAL INDICES (IN ARBITRARY UNITS), AND DEATH RATES (PER 100,000) FROM SIX GROUPS,OF CAUSES
Air Pollution Social Index Cause of Death (Rates per 100,000 Males aged 45-64)No. ofMales Popula- Respi- Cancer All other All Non-
County Borough aged Dom- Indus- Power Social Over- tion Edu- Bron- Pneu- ratory of Lung Respira- Respi-45-64 estic trial Sta- Class crowd- Den- ca- chitis monia Tuber- & Bron- tory ratory
tion ing sity tion culosis chus Diseases Diseases
Barnsley .. .. 8,366 67 87 47 52 69 54 95 135 48 70 102 20 1059Barrow-in-Furness .. 8,157 37 86 50 43 41 70 57 130 72 86 119 25 1168Bath. 9,093 21 29 298 16 26 20 19 75 52 50 135 35 916
Birkenhead .. .. 15,113 53 69 59 50 68 92 60 159 80 115 169 29 1222Birmingham .. .. 117,600 43 73 137 34 56 46 80 144 60 120 170 30 1027Blackburn .. .. 13,389 47 70 475 39 16 82 94 187 69 83 132 33 1177
Blackpool .. .. 19,736 46 37 88 18 14 44 58 112 26 72 119 22 1285Bolton .. .. 20,055 52 88 400 38 24 53 91 187 55 61 143 37 1250Bootle .. .. 7,258 66 74 0 74 93 135 76 201 67 154 179 26 1044
Bournemouth.. .. 16,226 18 2 0 0 19 3 29 87 26 85 130 26 1017Bradford .. .. 34,099 47 80 524 34 53 55 62 183 65 76 142 22 1223Brighton .. .. 17,577 28 16 0 22 38 97 46 102 33 77 167 24 1062
(contin.)
NOTES: Domestic Pollution-100 P1, where P, = tons of smoke produced per annum by domestic fuels per acre of built-up area.
Industrial Pollution-50 (Log P2 + 2), where P2 = tons of smoke produced per annum by industrial fuels per acre of built-up area.Power Station Pollution is defined in the text.Social Class-100 (SI- 2 9), where S, = the weighted social class score defined in the text.Overcrowding-5 (S2 8), where S2 = percentage of households living more than one person per room.Population Density-2 (S3 -20), where S3 is expressed in terms of persons per acre.Education-A (S4 - 60), where S4 = percentage of occupied males who left school before the age of 15 years.
25

CHARLES DALY26
(conitin.)
County Borough
BristolBurnleyBurton-upon-Trent
BuryCanterburyCarlisle.
ChesterCoventryCroydon
DarlingtonDerby.Dewsbury
DoncasterDudleyEastbourne
East HamExeter.Gateshead
GloucesterGreat YarmouthGrimsby
HalifaxHastingsHuddersfield
IpswichKingston-upon-HullLeeds.
LeicesterLincolnLiverpool
ManchesterMiddlesbrough
Newcastle-upon-TyneNorthampton. .
Norwich
NottinghamOldhamOxford
PlymouthPortsmouthPreston
ReadingRochdaleRotherham
St. HelensSalfordShetfield
SmethwickSouthamptonSouthend-on-Sea
SouthportSouth Shields..Stockport
Stoke-on-TrentSunderlandTynemouth
WakefieldWallaseyWalsall
No. ofMalesaged45-64
49,70310,4445,684
7,0652,9017,673
5,45829,17328,021
9,89216,2085,988
10,0826,7996,200
13,6188,56312,107
7,2955,50010,088
11,6706,73615,970
11,67530,93058,306
32,2867,899
77,461
75,42615,234
32,37112,48713,676
32,50114,30911,003
22,85124,66313,534
12,75310,7909,258
12,40718,52759,787
8,44919,90016,763
10,32311,37216,542
29,24618,3007,052
7,24310,88211,958
Air Pollution
Dom- Indus- Posestic trial St;
tic
33 6256 88 129 88 3
36 94 2'17 3944 60 1,11
39 6135 7530 33 3,
41 76 349 87 538 79 4
44 8633 7821 18
57 2918 2471 62
29 56 128 4249 72 2
5 1 84 321 7 132 85 3
25 59 152 75 349 68 7
42 67 237 7470 80
65 7757 108 1
63 68 1,241 5628 39
59 8 1 164 87 122 54
223953
224333
468047
602831
328144
526746
435337
444388
348768
1158 193
913314
1 55979
1026750
733374
wer Socialta- Class
44135360
17273104
024342
351581*15
130
67
07192
11474268
305125304
14334773326459588
166.86
237530146
14715976
95294560
14340
1,194
54056
577
039737
151156342
59349160
906448
334154
402435
31328
334039
34449
45225 1
284258
331830
32573 1
263058
4059
372232
424825
383047
294452
645540
383 16
04929
524844
341940
Social Index
Popula-Over- tioncrowd- Den-ing sity
31 3520 10022 27
19 5414 3065 39
64 5842 3420 35
60 7129 5762 37
22 4374 404 24
46 8028 34134 111
38 621 67
36 24
48 3613 2142 25
14 2050 6042 44
22 7824 6281 128
38 5672 112
104 9023 3623 30
39 4742 9829 13
512744
373052
895642
404514
129120
7412081
482058
Cause of Death (Rates per 100,000 Males aged 45-64)
Edu- Bron-ca- chitislion
569866
845468
567524
667984
639932
874591
468084
724274
628275
786473
7968
658264
8510642
66 1878 4065 93
41 5256 8746 92
134 103119 10346 93
37 933 1 6136 22
7 28103 7244 80
57 11090 8272 72
25 7563 1824 95
89185141
16894102
10595105
116124177
12325444
11785
218
14194103
16255123
86187186
98101200
258186
14812876
14729064
77111185
56164128
150292151
1628584
100183198
183183111
16695183
Pneu-monia
526463
321032
474035
425055
406341
563359
572657
404536
371016 1
413671
6888
543237
646635
534565
483342
556859
524442
366438
Respi-ratoryTuber-culosis
8292106
557997
1058763
787555
729262
7880153
1086899
719144
4011896
9896149
142119
126877 1
1008051
928892
727777
9414981
14412468
6515675
Cancerof Lung& Bron-chus
143122106
117118134
181116140
97130100
119132120
17290142
125101159
136121122
117174170
140119210
201168
172102116
163117166
112144152
141122119
157206160
183159166
144181174
54 131 17269 113 15638 122 152
59 5945 8865 152
All otherRespira-
toryDiseases
482618
473926
102915
193517
302525
193026
232630
382523
211627
271432
3440
301530
232430
331928
154017
354827
363323
293121
892838
All Non-Respi-ratoryDiseases
99713131110
13239701314
11691006901
114210691257
1082976963
95211791215
115910311137
132210081244
87511281142
100710241215
12151249
1191976903
10161241926
117410601241
90612901047
113312791072
10381092965
125411981154
112411871280
122 20 1021142 28 1212147 32 1064
(contin.)
1..l

AIR POLLUTION AND CAUSES OF DEATH 27
(contin.)
Air Pollution Social Index Cause of Death (Rates per 100,000 Males aged 45-64).
Males Popula- Respi- Cancer All other All Non-County Borough aged Dom- Indus Power Social Over tion Edu- Bron- Pneu- ratory of Lung Respira- Respi-
45-64 estic trial Sta- Class crowd- Den- ca- chitis monia Tuber- & Bron- tory ratorytion ing sity tion culosis chus Diseases Diseases
Warrington 8,984 39 91 362 65 70 71 110 245 60 78 183 22 1172West Bromwich 9,026 35 75 22 44 79 30 94 209 74 136 169 33 1061West Ham .. .. 17,086 74 93 346 69 90 134 101 181 67 105 197 34 1077
West Hartlepool 7,730 48 77 0 55 80 118 70 159 43 91 137 39 1173Wigan .. 9,764 58 84 96 55 72 46 101 236 41 85 126 50 1272Wolverhampton .. 17,669 40 91 27 33 44 26 79 139 78 125 119 27 1021
Worcester 6,766 32 48 134 27 38 17 60 93 42 110 116 17 985York.. . 12,120 37 66 494 35 24 33 60 126 37 68 106 19 1108Cardiff 27,199 53 43 239 33 55 88 53 126 44 116 159 28 1225
Merthyr Tydfil 7,396 65 10 8 53 39 28 62 182 50 110 129 131 1234Newport .. .. 12,119 36 78 946 45 62 53 59 121 31 106 172 34 1134Swansea .. .. 18,996 29 69 42 47 48 23 62 144 35 98 184 33 1175