air tanah - gadjah mada university · capillarity adhesion and surface tension together cause the...
TRANSCRIPT
Air tanah [email protected]
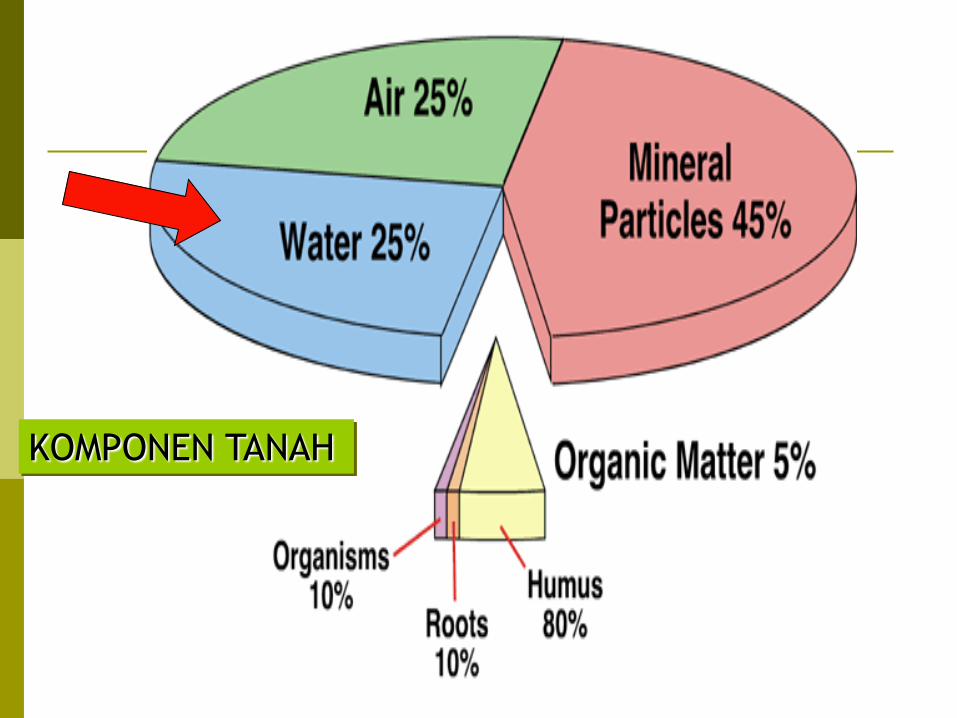
KOMPONEN TANAH

Volume
(1000 km3)
Percent of
Total Water
Percent of
Fresh Water
Oceans, Seas, & Bays 1,338,000 96.5 -
Ice caps, Glaciers, & Permanent Snow 24,064 1.74 68.7
Groundwater 23,400 1.7 -
Fresh (10,530) (0.76) 30.1
Saline (12,870) (0.94) -
Soil Moisture 16.5 0.001 0.05
Ground Ice & Permafrost 300 0.022 0.86
Lakes 176.4 0.013 -
Fresh (91.0) (0.007) .26
Saline (85.4) (0.006) -
Atmosphere 12.9 0.001 0.04
Swamp Water 11.47 0.0008 0.03
Rivers 2.12 0.0002 0.006
Biological Water 1.12 0.0001 0.003
Total 1,385,984 100.0 100.0

Properties
Molecular polarity and hydrogen bonding
Cohesion: the attraction of water molecules for each other primarily due to hydrogen bonding.
Adhesion (also called adsorption): the attraction of water molecules for solid surfaces.
Surface tension: the greater attraction of water molecules for each other than the air above at liquid-air interfaces primarily due to cohesion.
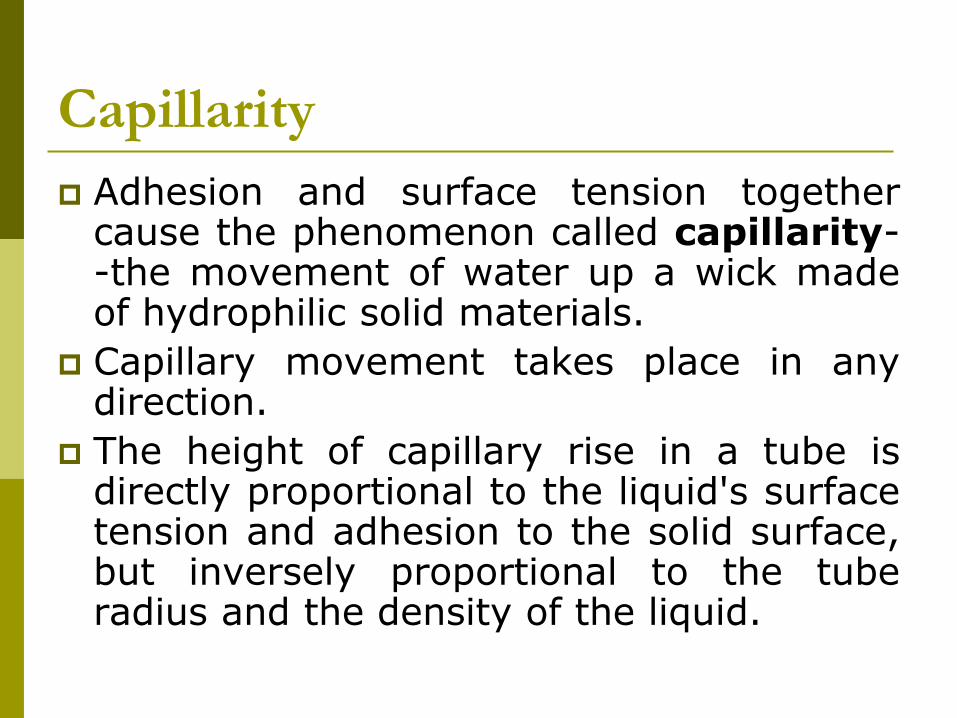
Capillarity
Adhesion and surface tension together cause the phenomenon called capillarity--the movement of water up a wick made of hydrophilic solid materials.
Capillary movement takes place in any direction.
The height of capillary rise in a tube is directly proportional to the liquid's surface tension and adhesion to the solid surface, but inversely proportional to the tube radius and the density of the liquid.
Water content
How much water is in soil ?
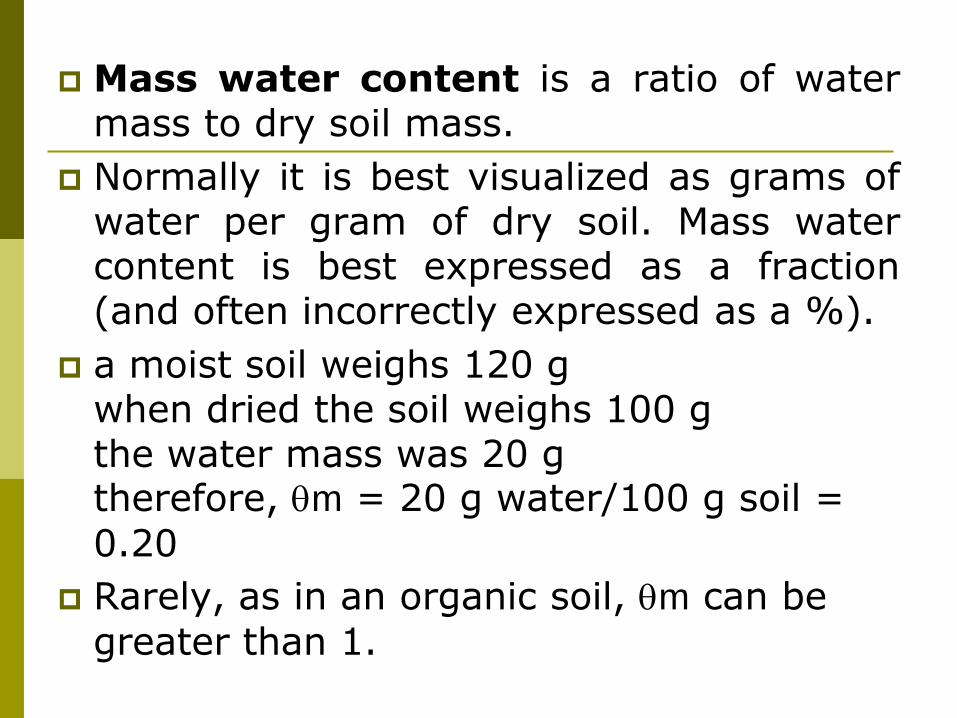
Mass water content is a ratio of water mass to dry soil mass.
Normally it is best visualized as grams of water per gram of dry soil. Mass water content is best expressed as a fraction (and often incorrectly expressed as a %).
a moist soil weighs 120 g when dried the soil weighs 100 g the water mass was 20 g therefore, qm = 20 g water/100 g soil =
0.20
Rarely, as in an organic soil, qm can be
greater than 1.
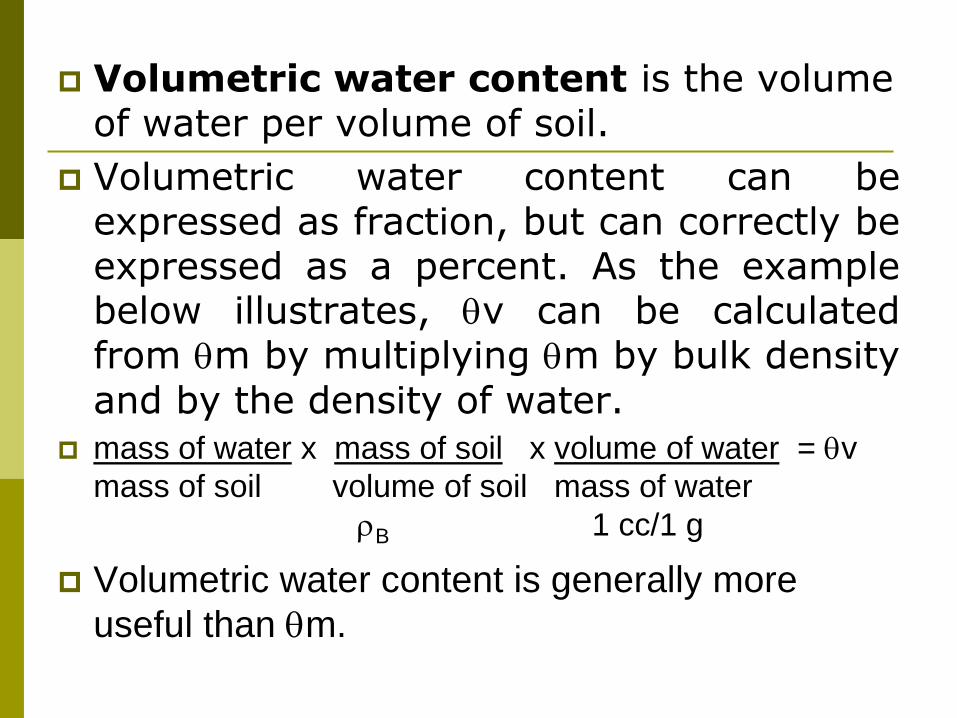
Volumetric water content is the volume of water per volume of soil.
Volumetric water content can be expressed as fraction, but can correctly be expressed as a percent. As the example below illustrates, qv can be calculated from qm by multiplying qm by bulk density and by the density of water.
mass of water x mass of soil x volume of water = qv
mass of soil volume of soil mass of water
rB 1 cc/1 g
Volumetric water content is generally more
useful than qm.
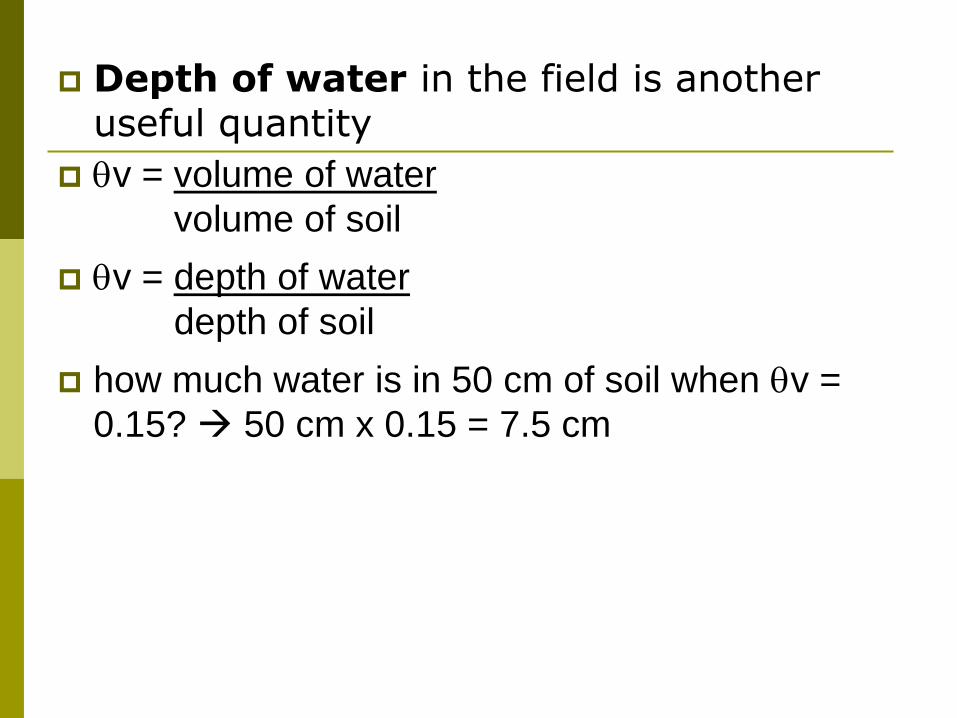
Depth of water in the field is another useful quantity
qv = volume of water
volume of soil
qv = depth of water
depth of soil
how much water is in 50 cm of soil when qv =
0.15? 50 cm x 0.15 = 7.5 cm
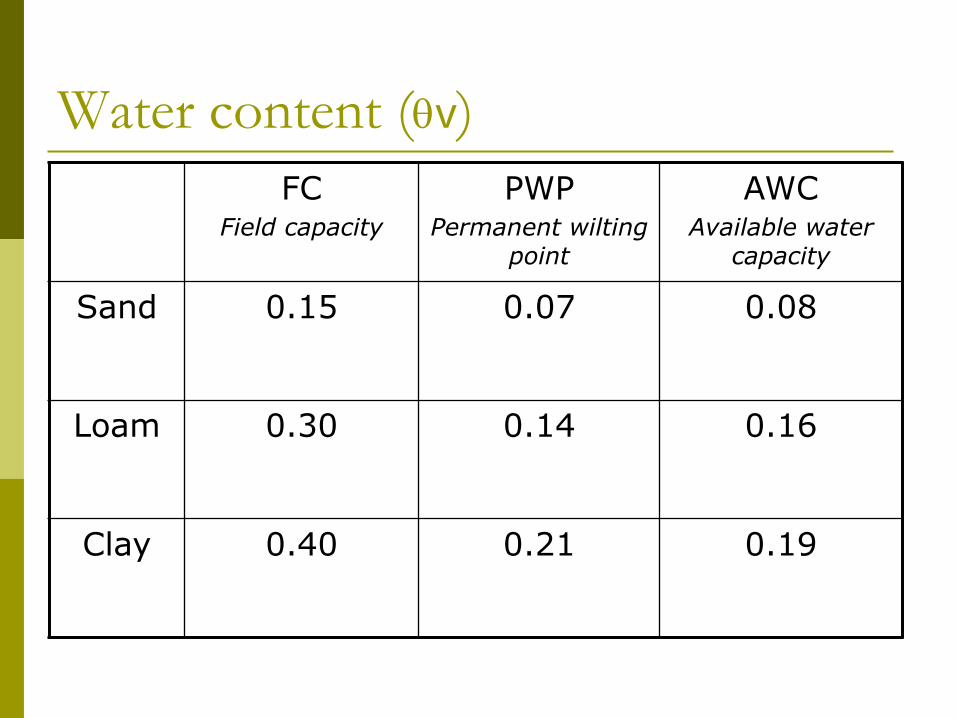
Water content (qv)
FC Field capacity
PWP Permanent wilting
point
AWC Available water
capacity
Sand 0.15 0.07 0.08
Loam 0.30 0.14 0.16
Clay 0.40 0.21 0.19
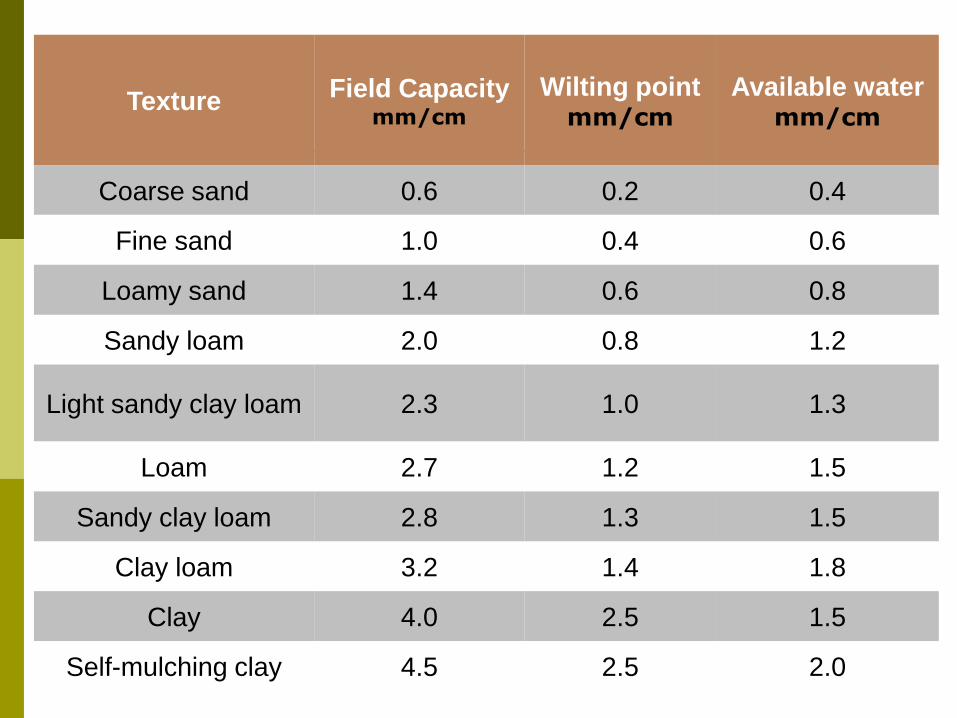
Texture Field Capacity
mm/cm
Wilting point mm/cm
Available water mm/cm
Coarse sand 0.6 0.2 0.4
Fine sand 1.0 0.4 0.6
Loamy sand 1.4 0.6 0.8
Sandy loam 2.0 0.8 1.2
Light sandy clay loam 2.3 1.0 1.3
Loam 2.7 1.2 1.5
Sandy clay loam 2.8 1.3 1.5
Clay loam 3.2 1.4 1.8
Clay 4.0 2.5 1.5
Self-mulching clay 4.5 2.5 2.0
soil water potential
When soil water status is expressed in energy forms and compared to pure water under standard temperature and pressure, the difference in energy level between this pure water and that of soil water is called soil water potential.
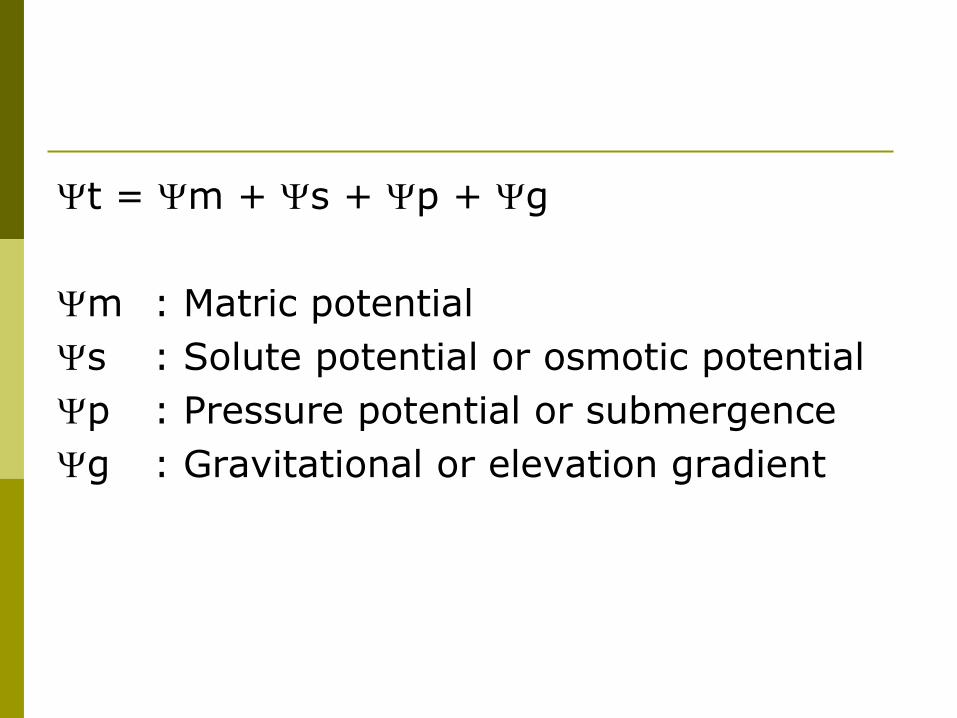
t = m + s + p + g
m : Matric potential
s : Solute potential or osmotic potential
p : Pressure potential or submergence
g : Gravitational or elevation gradient
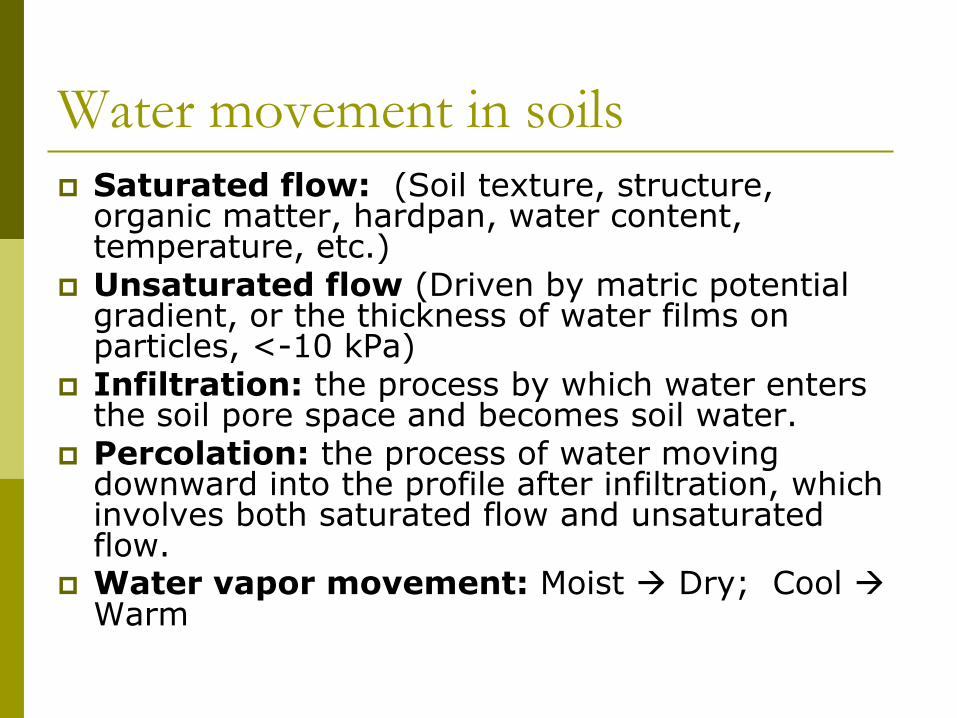
Water movement in soils
Saturated flow: (Soil texture, structure, organic matter, hardpan, water content, temperature, etc.)
Unsaturated flow (Driven by matric potential gradient, or the thickness of water films on particles, <-10 kPa)
Infiltration: the process by which water enters the soil pore space and becomes soil water.
Percolation: the process of water moving downward into the profile after infiltration, which involves both saturated flow and unsaturated flow.
Water vapor movement: Moist Dry; Cool Warm
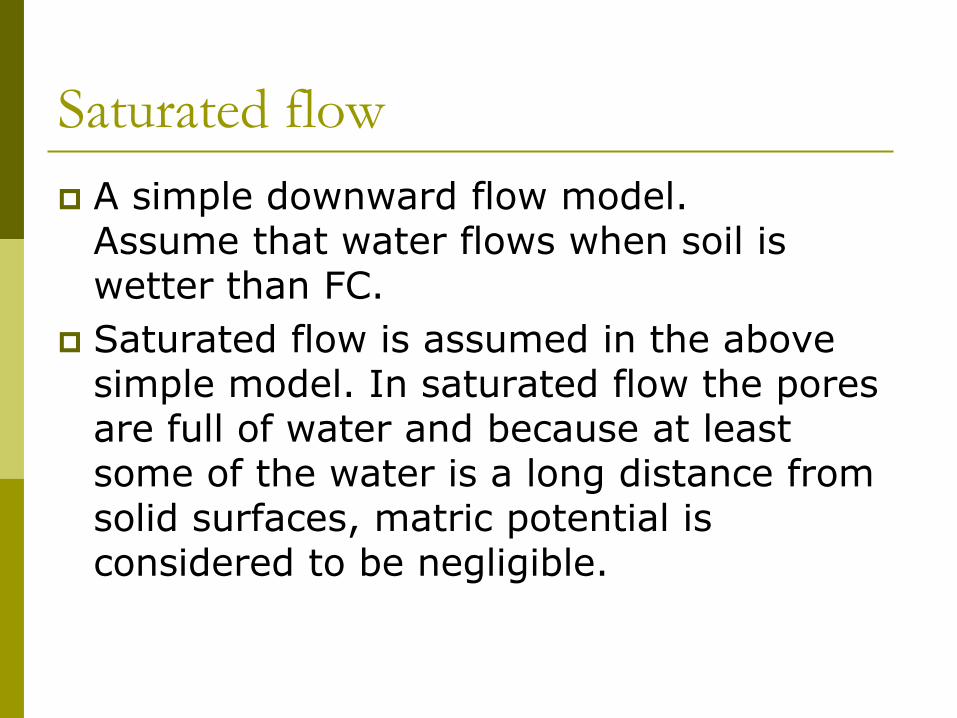
Saturated flow
A simple downward flow model. Assume that water flows when soil is wetter than FC.
Saturated flow is assumed in the above simple model. In saturated flow the pores are full of water and because at least some of the water is a long distance from solid surfaces, matric potential is considered to be negligible.
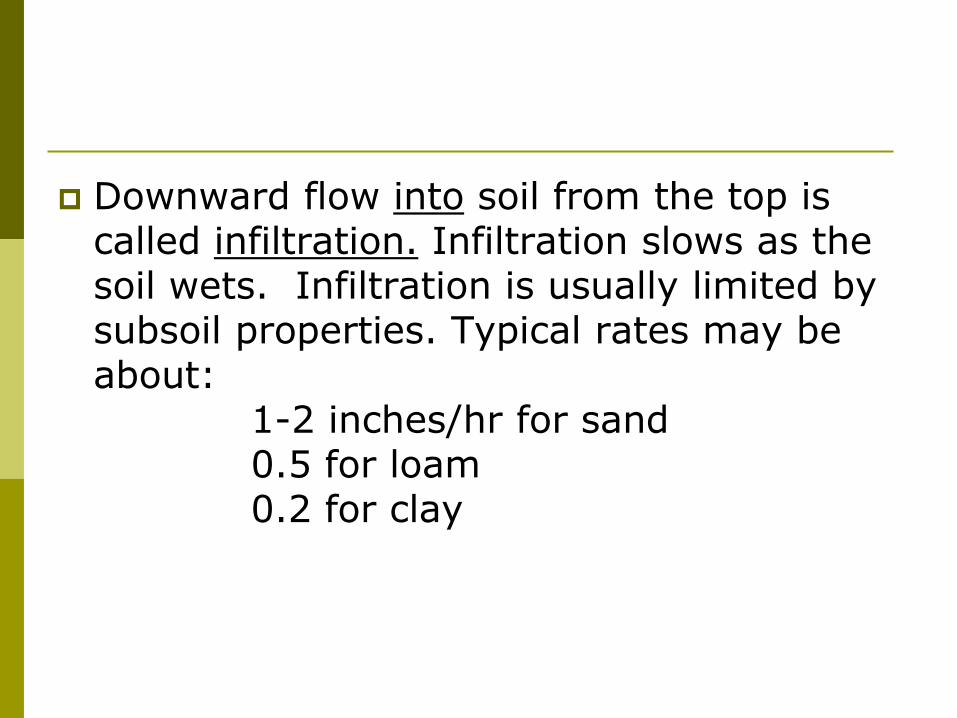
Downward flow into soil from the top is called infiltration. Infiltration slows as the soil wets. Infiltration is usually limited by subsoil properties. Typical rates may be about: 1-2 inches/hr for sand 0.5 for loam 0.2 for clay

Water flow through the wetted soil is called percolation. Transporting soluble material in percolating water is leaching. Leaching is important in environmental issues because potentially harmful nitrates and organic pesticides can leach into an aquifer used for drinking water.

Unsaturated flow Unsaturated flow occurs along soil surfaces, not
through large pores. Unsaturated flow is driven by matric forces that are much stronger than gravity.
Gravity is not sufficiently strong to exert a significant influence on unsaturated flow because when unsaturated, much of the soil water is affixed to solid surfaces. Unsaturated flow is slow. Even though the driving force is usually greater than for saturated flow, the resistance to flow is enormous. Water will flow toward a lower (more negative) potential regardless of direction.
In other words it will flow towards: drier medium small pores finer texture
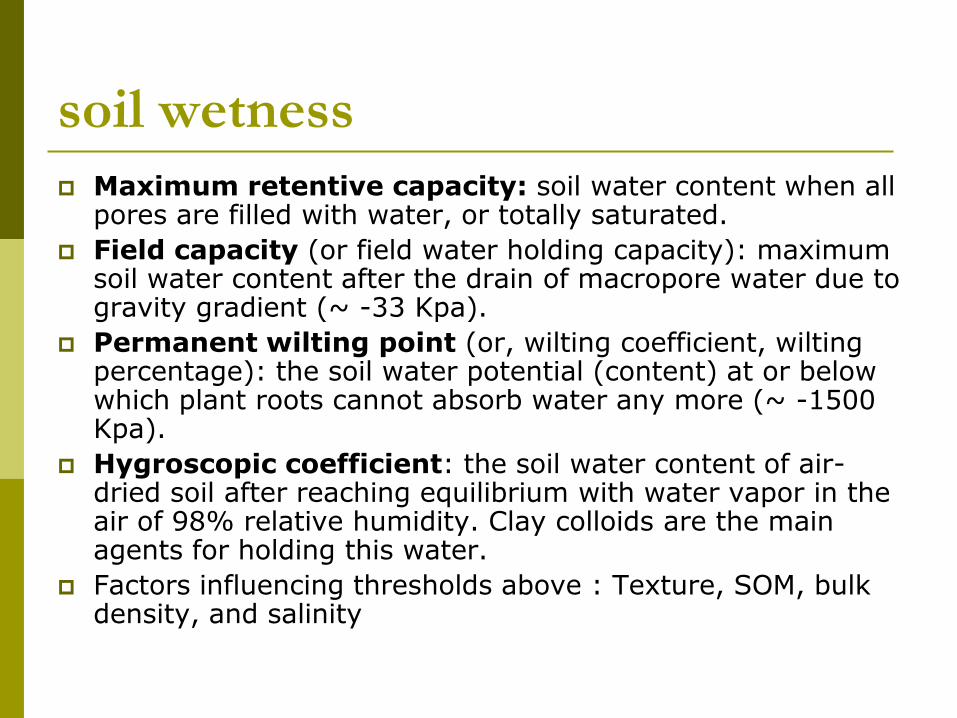
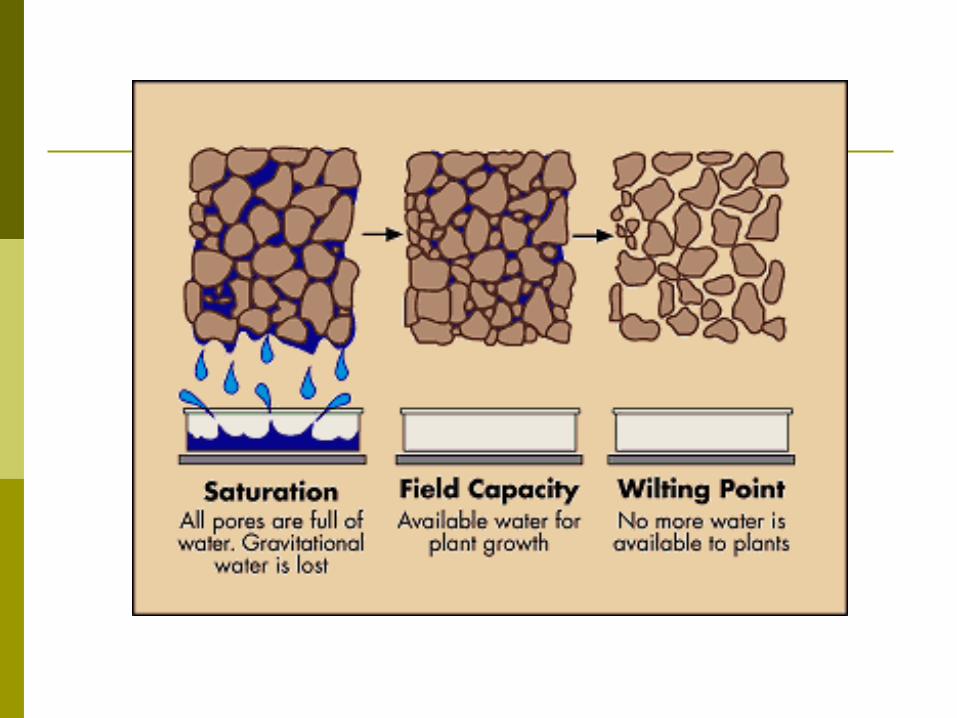
soil wetness
Maximum retentive capacity: soil water content when all pores are filled with water, or totally saturated.
Field capacity (or field water holding capacity): maximum soil water content after the drain of macropore water due to gravity gradient (~ -33 Kpa).
Permanent wilting point (or, wilting coefficient, wilting percentage): the soil water potential (content) at or below which plant roots cannot absorb water any more (~ -1500 Kpa).
Hygroscopic coefficient: the soil water content of air-dried soil after reaching equilibrium with water vapor in the air of 98% relative humidity. Clay colloids are the main agents for holding this water.
Factors influencing thresholds above : Texture, SOM, bulk density, and salinity
Plant water uptake
About 90% by Passive Absorption (or capillary action)
Water loss through Evapotranspiration.
The maximum ET loss that would occur under soil water content near field capacity is referred to as Potential ET (ETp), which is usually below Pan Evaporation (50-90% of Pan Evaporation)
Water Use Efficiency (WUE): the amount of water required to produce a unit weight of dry material, such the Transpiration Ratio (water/dry matter, ranges from 200:1 to1000:1).

Evaporation.
Most of the solar energy reaching the earth is spent evaporating water. For convenience, evaporation & transpiration are often lumped together and called evapotranspiration (ET). As soil dries evapotranspiration slows. ET + water retained in plants is called consumptive use.
Consumptive use varies greatly by time of the season. It may be as much as ~ ½ inch/day at the annual peak, such as on a warm day when the soil is moist and plants are large and active. Plants differ in water use efficiency (WUE). WUE is the water required per unit of material produced.

Water measurement
Water content Gravimetric. This involves collecting a sample, weighing it, drying it, and
then reweighing it. With these weights one can calculate qm.
Porous resistance blocks. These can be calibrated to measure either content or potential. Their performance is only acceptable in relatively dry soil where the q - y relation is more or less linear (see Figure 4-9 in the textbook). These are easy to use once calibrated, but are not particularly accurate.
Neutron probes. These provide high accuracy and non-destructive testing, by measuring water content surrounding an access tube installed in the soil. Because of the health risk and legal reporting requirements, their use is declining.
Time domain reflectometry. This relatively new method requires expensive instrumentation, but provides good accuracy. Also, some minor methods in use include: frequency domain reflectometry, capacitance probes.
Lysimeters are often used for "balance-sheet" studies in which one monitors water in and water out of a system.

Water potential Pressure plate. This is a lab apparatus used to determine water
content for a wide range of matric potentials with reasonable accuracy. Tests are slow and laborious.
Tensiometer. This is an instrument for field use. These are commonly used in irrigation applications (see Figure 4-12 in the textbook). They only work on the wet end of the water release curve, and only measure matric potential.
Psychrometer. These provide the most scientifically rigorous readings, yet provide rather poor precision; however, precision improves drastically as soil wetness decreases.
Piezometer. These are access tubes inserted in the soil. The tubes typically have a porous cup on the lower end to allow water in. They are useful for measuring pressure potential due to a water table.
Filter paper. Filter paper can be exposed to soil to measure the tendency for the paper to attract water from the soil. This is a low-tech method with accuracy similar to that of resistance blocks.
Water quality
Salinity
pH
specific ions likely to be toxic to plants: sodium, chloride, and boron