airborne monitoring of sulphur emissions from ships in ... · the danish environmental protection...
TRANSCRIPT

Airborne Monitoring of Sulphur Emissions from Ships in Danish Waters
2018 Campaign Results
Environmental Project no. 2061 January 2019

2 The Danish Environmental Protection Agency / Airborne Monitoring of Sulphur Emissions from ships – 2018 Campaign Results
Publisher: The Danish Environmental Protection Agency Author: Explicit ApS, www.explicit.dk Photos: Explicit ApS ISBN: 978-87-7038-023-2 The Danish Environmental Protection Agency publishes reports and papers about research and development projects within the environmental sector, financed by the Agency. The contents of this publication do not necessarily represent the official views of the Danish Environmental Protection Agency. By publishing this report, the Danish Environmental Protection Agency expresses that the content represents an important contribution to the related discourse on Danish environmental policy. Sources must be acknowledged.

The Danish Environmental Protection Agency / Airborne Monitoring of Sulphur Emissions from ships – 2018 Campaign Results 3
Contents
Summary 5
1. Operations 6 1.1 Measurement methodology and technology 6 1.2 Aircraft / aerial platforms 6 1.3 Operational observations 7
2. 2018 Campaign Results 9 2.1 Dataset composition 9 2.1.1 Period distribution and operational capacity 10 2.1.2 Measurement quality 11 2.2 Observed FSC levels 11 2.2.1 Distribution of FSC values by cut-off level 12 2.2.2 Distribution of FSC values by vessel type 13 2.2.3 Distribution of FSC values by geographical location 14 2.3 Other observations 14
3. Drone campaign at the Port of Aarhus 15 3.1 Objectives 15 3.2 Conditions and dataset composition 15 3.3 Comparative analysis 16

4 The Danish Environmental Protection Agency / Airborne Monitoring of Sulphur Emissions from ships – 2018 Campaign Results
Acronyms / Definitions 2017 Campaign DEPA 2017 Airborne Sulphur Monitoring Campaign 2018 Campaign DEPA 2018 Airborne Sulphur Monitoring Campaign AIS Automatic Identification System ANNEX VI MARPOL Annex VI for the Prevention of Air Pollution from Ships DEPA Danish Environmental Protection Agency DMA Danish Maritime Authority EMSS Explicit Mini Sniffer System EMSU Explicit Mini Sniffer Unit FSC Fuel Sulphur Content MARPOL International Convention for the Prevention of Pollution from Ships PSC Port State Control RSD Relative Standard Deviation SECA Sulphur Emission Control Area

The Danish Environmental Protection Agency / Airborne Monitoring of Sulphur Emissions from ships – 2018 Campaign Results 5
Summary
This report presents the results of the airborne activities to monitor ship sulphur emissions in Danish waters conducted during 2018 by Explicit ApS on behalf by the Danish Environmental Protection Agency (DEPA). The activity is part of the Danish Government’s programme to en-force the sulphur rules under MARPOL Annex VI. This year’s activities saw the deployment of multiple aerial platforms. In addition to the manned helicopters used for broader surveillance, the team also deployed drones at the entry to the Port of Aarhus in a special campaign to compare air samples with fuel samples taken by PSC from vessels at berth. Through all activities, the same measuring system was used; the Explicit Mini Sniffer System. Details on this, the applied analysis methodology and other operational factors where de-scribed in detail in last year’s report. The main findings of the 2018 report can be summarized as follows:
• Of the 614 ships measured during the period February-November 2018, 45 ships (7.3%) were found to have substantially elevated fuel sulphur content levels at or above 0.15 %, the limit at which the instrumentation with 95 % confidence can detect a breach of the 0.10 % SECA threshold.
• This finding – corresponding to approx. 1:14 ships recorded as non-compliant – rep-resents an increase from the 2017 level (5.4 %) and is likely be due to annual fluctua-tions.
• As with 2017, the Campaign found no distinct geographical patterns in the compli-ance behaviour. Various degrees of non-compliance are found throughout Danish waters, although there is a slight overrepresentation of non-compliance in Kattegat and Skagerrak.
• The data also shows no apparent directional patterns with similar levels of compli-ance found for both inbound and outbound ships as well as ships operating locally.
The 2018 Campaign also saw the deployment of drones at the entry to the Port of Aarhus. This was the first time, the sulphur enforcement programme included drones officially for oper-ational purposes. The objective of the Port of Aarhus Campaign was to assess the correlation between air sam-ples and PSC fuel samples in order to evaluate the alignment. Such a close comparison has never been done before, and so the 2018 Campaign marked an important advancement in our understanding of the reliance of airborne measurement techniques for sulphur enforcement. Comparing 14 datasets, the Port of Aarhus Campaign was able to demonstrate a high level of correlation between the air samples captured from vessel plumes as the ships entered the port and the subsequent FSC values measured in the fuel samples taken by PSC inspectors. On average the air samples only deviate by ±0.009 % FSC from the fuel samples, equal to less than 15 % average discrepancy. The results of the Port of Aarhus Campaign thus add to the supportive evidence in favour of the applicability of air sampling in general, and the Explicit Mini Sniffer System in particular, as a method for monitoring sulphur compliance.

6 The Danish Environmental Protection Agency / Airborne Monitoring of Sulphur Emissions from ships – 2018 Campaign Results
1. Operations
This year’s airborne sulphur monitoring operations saw the emis-sions detection technology deployed on multiple aerial platforms, both manned helicopters and drones.
All deployments in 2018 where conducted by Explicit ApS in collaboration with Charlie 9 Heli-copters ApS with the exception of the special comparative campaign detailed in chapter 3. 1.1 Measurement methodology and technology No changes were made to the sensor technology or analysis methodology compared to the setup used in the 2017 Campaign. This and its accompanying results were described in detail in last years’ report published by DEPA. The 2017 Campaign report is available (in English) on the DEPA website1. 1.2 Aircraft / aerial platforms The 2018 Campaign saw the deployment of three different aerial platforms (see Image A):
• An Airbus AS355NP twin-engine helicopter; • An Airbus AS350B3e single-engine helicopter; and • A DJI Matric 600 Pro drone.
The two helicopters were used for broader surveillance in Danish waters while the drone was used for the comparative campaign conducted in the Port of Aarhus in collaboration with the Danish Maritime Agency. All three platforms were equipped with the same sensor system, the Explicit Mini Sniffer Sys-tem, with the only difference being a dual unit configuration on the helicopters versus a single unit configuration on the drone. For more on the application of multiple parallel sampling, please see the 2017 Campaign report. The application of multiple different aircraft illustrates the adaptability of the monitoring system. While other (bigger) measuring instruments can require various levels of aircraft integration thus tying the equipment more closely to the host platform, the lightness and data infrastruc-ture of the Explicit Mini Sniffer System allows for the easy adaption and deployment on a multi-tude of aerial platforms.
1 https://mst.dk/service/publikationer/publikationsarkiv/2018/apr/airborne-monitoring-of-sulphur-emissions-from-ships-in-danish-waters/
Image A, from the top: The Airbus AS355NP, the Airbus AS350B3e and the DJI Matric 600 Pro.

The Danish Environmental Protection Agency / Airborne Monitoring of Sulphur Emissions from ships – 2018 Campaign Results 7
1.3 Operational observations All operations were carried out in according with DEPA instructions. No technical difficulties were experienced during missions. To cover all relevant areas of Danish waters, the following airports were utilized: Roskilde, Sindal, Aalborg, Maribo and Rønne. Overall, it is the assessment of the operational team that ships in Danish waters are increas-ingly becoming used to having their emissions inspected from the air following four years of airborne sulphur monitoring operations. The team thus made no observations of hostile or evasive actions in 2018 and fewer ships used the opportunity to communicate with the pilot team via maritime radio to clarify the helicopter’s intent.

8 The Danish Environmental Protection Agency / Airborne Monitoring of Sulphur Emissions from ships – 2018 Campaign Results
614 ship observations were collected and analyzed for sulphur compliance in 2018.

The Danish Environmental Protection Agency / Airborne Monitoring of Sulphur Emissions from ships – 2018 Campaign Results 9
2. 2018 Campaign Results
The 2018 Campaign was conducted during the months of Febru-ary through November 2018 covering all major shipping lanes in Danish waters.
2.1 Dataset composition The full dataset for the 2018 Campaign consists of 614 independent ship observations includ-ing the observations obtained as part of the Port of Aarhus Campaign. Due to their frequent operation in Danish waters, some vessels were measured multiple times during the year, how-ever no more than on four occasions. Ships were observed throughout Danish waters with an emphasis on the international shipping lanes and areas with the highest maritime traffic density. Except for 5 vessels anchored East of Skagen, all ships were observed while underway. The map in Figure 1 depicts the location of all measurements including vessel headings and corresponding FSC levels.
FIGURE 1. Geographical map of all measurements.
FSC levels: ≤ 0.100 % 0.101 – 0.129 % 0.130 – 0.149 % 0.150 – 0.179 % ≥ 0.180 %
10 The Danish Environmental Protection Agency / Airborne Monitoring of Sulphur Emissions from ships – 2018 Campaign Results
All ships were identified based on their AIS signals collected directly from the vessels by the operational team during flight. No third-party sources have been used to establish ship ID. A breakdown of the dataset according to primary vessel type, based on the AIS data, is presented in Table 1.
TABLE 1. Distribution of measurements by vessel type
Type Cargo Tanker Passenger Other Not available Total
Measurements 369 184 42 11 8 614
% of total 60.1 % 30.0 % 6.8 % 1.8 % 1.3 % 100 %
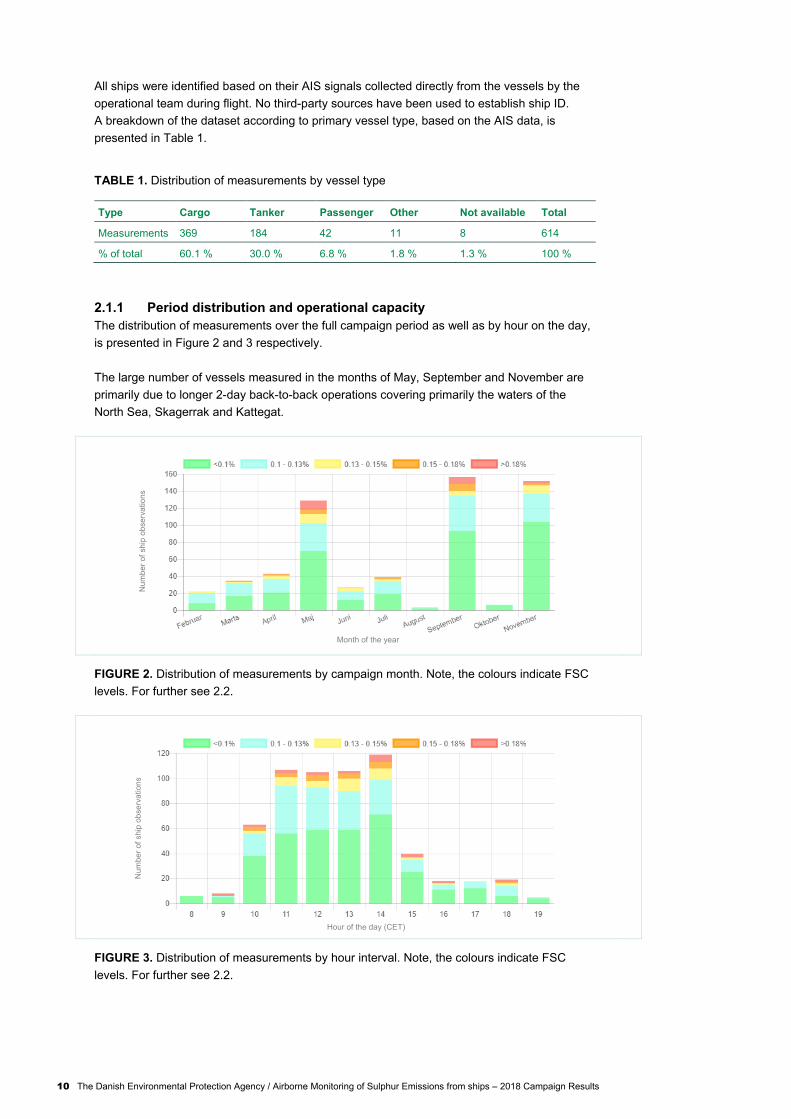
2.1.1 Period distribution and operational capacity The distribution of measurements over the full campaign period as well as by hour on the day, is presented in Figure 2 and 3 respectively. The large number of vessels measured in the months of May, September and November are primarily due to longer 2-day back-to-back operations covering primarily the waters of the North Sea, Skagerrak and Kattegat.
FIGURE 2. Distribution of measurements by campaign month. Note, the colours indicate FSC levels. For further see 2.2.
FIGURE 3. Distribution of measurements by hour interval. Note, the colours indicate FSC levels. For further see 2.2.
Num
ber o
f shi
p ob
serv
atio
ns
Month of the year
Num
ber o
f shi
p ob
serv
atio
ns
Hour of the day (CET)

The Danish Environmental Protection Agency / Airborne Monitoring of Sulphur Emissions from ships – 2018 Campaign Results 11
Over the course of the Campaign, the average amount of vessels the team was able to meas-ure (not including the Port of Aarhus Campaign) ranged from 8 – 12 vessels per flight hour, a slight improvement from the previous year. In a best-case scenario with optimal conditions and high traffic density, the manned helicopter is estimated to have a maximum operational capac-ity (i.e. hourly output) of up to 14 vessels per hour without compromising measurement quality. 2.1.2 Measurement quality Overall, the campaign was able to demonstrate – as was the case in 2017 – a consistently high quality level. Of the 614 ship observations, 577 measurements (94 %) were classified as high quality (≥ 6.00 in quality score) according to the quality scoring protocol. A breakdown of the quality scores is presented in Table 2. The methodology for the quality scoring protocol is described in detail in the 2017 Campaign report.
TABLE 2. Distribution by quality scores
Quality score Low (0-3) Medium (3-6) High (>6) Total
Measurements 14 23 577 614
% of total 2.3 % 3.7 % 94.0 % 100 %
2.2 Observed FSC levels Looking at the distribution of the measurements on different FSC levels, the 2018 data corre-sponds to the pattern observed in other surveillance findings, with an approximate normal distribution peaking in and around the 0.10 % regulatory threshold applicable within the SECA. As with previous reporting, the 2018 Campaign also demonstrates a ‘tail’ of values spread-out above the 0.15 % FSC level with no apparent link to known fuels (0.5 %, 1 %, 2 %, 3.5 % etc.). While we don’t know the exact cause of this pattern in the non-compliant range several expla-nations have been suggested such as discrepancies in the change-over procedures of the individual vessel, contaminated fuels, and/or intermittent operations such as manoeuvring which may affect the engine combustion. Regardless, the pattern is consistent and the ele-vated SO2 emissions evident.
The Airbus AS355NP in position for sampling. For more on plume navigation, please see the 2017 Campaign report.

12 The Danish Environmental Protection Agency / Airborne Monitoring of Sulphur Emissions from ships – 2018 Campaign Results
The measurement distribution by FSC level is presented in Figure 4.
FIGURE 4. Distribution of measurements by measured FSC. Note: The colours indicate differ-ence in vessel sizes according to their length2. The dotted lines indicate the various compli-ance cut-off levels for 1xRSD, 2xRSD and 3xRSD respectively. This year’s overall distribution profile shows a median FSC value of 0.098 % with a peak value also at 0.098 % FSC indicating full alignment with the dominating bunkering pattern of 0.10 % FSC within the SECA. This result is in line with the reported median in 2017 (0.101 %) and goes to confirm that the data shows no immediate bias. A breakdown of the distribution is presented below. Where relevant, the data is compared to the results of the 2017 Campaign. 2.2.1 Distribution of FSC values by cut-off level As shown in Figure 4, the threshold at which a measurement can be deemed to breach the regulator compliance threshold of 0.10 % FSC, depends on the RSD uncertainty applied to the measurement. The higher the RSD applied, the stronger the probability that the measurement is in fact above the SECA threshold. In Table 3, all measurements are grouped according to their RSD level.
TABLE 3. FSC distribution by level of uncertainty
FSC RSD Colour Measurements % of total
≤ 0.100 % N/A 352 57.3 %
0.101 – 0.129 % N/A 178 29.0 %
0.130 – 0.149 % 1 x RSD 39 6.4 %
0.150 – 0.179 % 2 x RSD 21 3.4 %
≥ 0.180 % 3 x RSD 24 3.9 %
Total 614 100 %
2 XS = <130m, S = 130-220m, M = 220-290m, L = 290-300m, XL = 300-366m, XXL = >366m.
SEC
A th
resh
old:
0.1
0 %
1 x
RSD
2 x
RSD
3 x
RSD
Num
ber o
f shi
p ob
serv
atio
ns
Fuel Sulphur Content (%)

The Danish Environmental Protection Agency / Airborne Monitoring of Sulphur Emissions from ships – 2018 Campaign Results 13
At the 95% coefficient level (2xRSD) – the recommended level used when interpreting fuel analysis results according to ISO 4259 – the number of vessels measured with elevated FSCs, indicating non-compliant fuel, was 45 or 7.3 % of the total. Comparing the results to 2017, the percentage of non-compliant vessels ≥ 0.15 % FSC has increased from 5.4 % to 7.3 % year-on-year. Similarly, the share of vessels ≥ 0.18 % FSC has increased from 2.7 % to 3.9 %. The exact cause of the year-of-year change is unknown and may likely be due to annual fluc-tuations. 2.2.2 Distribution of FSC values by vessel type In table 4, the FSC distribution is broken down by vessel type focusing only on cargo and tanker ships. These represent 90 % of the total dataset while the number of passenger and other types have been omitted due to their low number of measurements.
TABLE 4. FSC distribution by vessel type and level of uncertainty
FSC RSD Colour Cargo Tanker
No. % of total No. % of total
≤ 0.100 % N/A 207 56.1 110 59.8
0.101 – 0.129 % N/A 117 31.7 45 24.5
0.130 – 0.149 % 1 x RSD 17 4.6 12 6.5
0.150 – 0.179 % 2 x RSD 16 4.3 7 3.8
≥ 0.180 % 3 x RSD 12 3.3 10 5.4
Total 369 100 184 100

14 The Danish Environmental Protection Agency / Airborne Monitoring of Sulphur Emissions from ships – 2018 Campaign Results
While both cargo and tanker ships show an increase in non-compliance (≥0.15 % FSC) com-pared to 2017, tankers in 2018 displayed a slightly higher occurrence of non-compliance (9.2 %) than cargo ships (7.6 %), particularly in the high range ≥ 0.18 % FSC. This difference was not evident in 2017. A year-on-year comparison of the FSC values ≥ 0.15 % is shown in Figure 5.
FIGURE 5. Observations with FSC values at or above 0.15 % FSC as a percentage share of the total number of measurements in a group (all, cargo or tankers). 2.2.3 Distribution of FSC values by geographical location As illustrated by the map in Figure 1, there are no distinct geographical patterns in the compli-ance behaviour. Various degrees of non-compliance are found throughout Danish waters with perhaps a tendency towards more non-compliance in Kattegat and Skagerrak. Similarly, there are no clear directional patterns. Non-compliance is found just as frequently with vessels heading outbound towards the North Sea as inbound from the North Sea or with vessels operating within the surveyed area. 2.3 Other observations Similar to last year the 2018 Campaign also collected indicative data on vessel NOX emis-sions. While NOx emissions are not a subject to this report, the data has been provided to DEPA for possible further analysis. No other observations have been made regarding the dataset. For details on the operations, please see chapter 1.
0%
2%
4%
6%
8%
10%
2017 2018 2017 2018 2017 2018All Cargo Tankers
■ 0.150 – 0.179 % FSC ■ ≥0.180 % FSC
% o
f obs
erva
tions

The Danish Environmental Protection Agency / Airborne Monitoring of Sulphur Emissions from ships – 2018 Campaign Results 15
3. Drone campaign at the Port of Aarhus
In September 2018, Explicit conducted a special comparative campaign using drones at the entry to the Port of Aarhus. The campaign was aimed at assessing the correlation in FSC values between the airborne measurements and fuel samples taken by Port State Control.
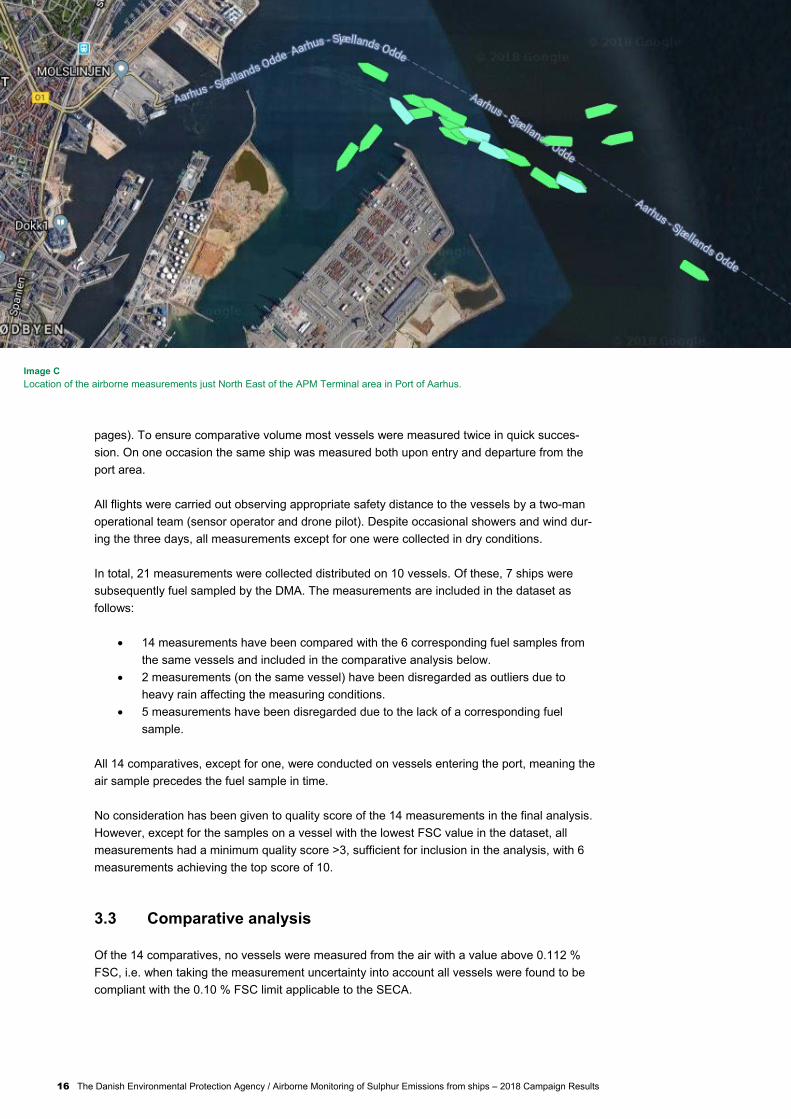
To collect air samples from the vessel exhaust plumes, Explicit deployed a DJI Matric 600 Pro drone equipped with a standalone version of the Explicit Mini Sniffer System (see Image B) and subsequently flew the drone into the plumes of ships entering or departing the port. Due to weight restrictions, the drone only carried a single Explicit Mini Sniffer Unit as opposed to the dual setup deployed on the manned helicopter. While the sensors are the same, the dif-ference between a single and dual configuration lies in the slightly higher measurement uncer-tainty associated with only a single EMSU. At the 0.10 % FSC level a dual unit setup has a measuring uncertainty of ± 25 % while the equivalent uncertainty on a single setup is ± 35 %. Once sampled, data was subsequently analysed and quality checked in the Explicit Emissions Lab according to the same procedure as with all other airborne samples collected during the 2018 Campaign. The fuel samples in port were extracted by port inspectors from the Danish Maritime Authority and subsequently analyzed by Saybolt Denmark A/S on behalf of DEPA. 3.1 Objectives The primary purpose of the Port of Aarhus Campaign was to assess the correlation between the FSC values calculated by the EMSS and the values established by fuel sampling the ves-sel bunker fuel at berth. According to MARPOL Annex VI as implemented by the EU Sulphur Directive, non-compli-ance with the SECA limit of 0.10 % FSC may only be legally determined via fuel sampling dur-ing PSC inspection. However, even if airborne samples may currently only be used for target-ing and as supportive evidence, a side-by-side comparison of the correlation between fuel samples and air samples advances the understanding of the alignment of the two measure-ment techniques and gives important insight into the potential reliance on air samples going forward. 3.2 Conditions and dataset composition All air samples were collected during the 3 days between 19 – 21 September 2018 North East of the North Pier and just inside the cargo terminal basin (see Image C and D on the next
Image B A standalone EMSS kit for mount on a DJI Matric 600 Pro.
16 The Danish Environmental Protection Agency / Airborne Monitoring of Sulphur Emissions from ships – 2018 Campaign Results
pages). To ensure comparative volume most vessels were measured twice in quick succes-sion. On one occasion the same ship was measured both upon entry and departure from the port area. All flights were carried out observing appropriate safety distance to the vessels by a two-man operational team (sensor operator and drone pilot). Despite occasional showers and wind dur-ing the three days, all measurements except for one were collected in dry conditions. In total, 21 measurements were collected distributed on 10 vessels. Of these, 7 ships were subsequently fuel sampled by the DMA. The measurements are included in the dataset as follows:
• 14 measurements have been compared with the 6 corresponding fuel samples from the same vessels and included in the comparative analysis below.
• 2 measurements (on the same vessel) have been disregarded as outliers due to heavy rain affecting the measuring conditions.
• 5 measurements have been disregarded due to the lack of a corresponding fuel sample.
All 14 comparatives, except for one, were conducted on vessels entering the port, meaning the air sample precedes the fuel sample in time. No consideration has been given to quality score of the 14 measurements in the final analysis. However, except for the samples on a vessel with the lowest FSC value in the dataset, all measurements had a minimum quality score >3, sufficient for inclusion in the analysis, with 6 measurements achieving the top score of 10. 3.3 Comparative analysis Of the 14 comparatives, no vessels were measured from the air with a value above 0.112 % FSC, i.e. when taking the measurement uncertainty into account all vessels were found to be compliant with the 0.10 % FSC limit applicable to the SECA.
Image C Location of the airborne measurements just North East of the APM Terminal area in Port of Aarhus.

The Danish Environmental Protection Agency / Airborne Monitoring of Sulphur Emissions from ships – 2018 Campaign Results 17
In Figure 6 all 14 comparatives have been plotted together. As shown by the slope of the re-gression line, the discrepancy between the air and fuel samples is very small (1.132x) and pre-dominantly caused by minor differences in the lowest end of the FSC spectrum, well below the 0.10 % threshold. The two datasets – the air samples and the fuel samples – thus display a notably close correlation.
FIGURE 6. FSC values (%) of the PSC fuel samples and the Explicit Mini Sniffer System.
y = 1,132x - 0,0129R² = 0,8816
0,020
0,040
0,060
0,080
0,100
0,120
0,020 0,040 0,060 0,080 0,100 0,120
Fuel
sam
ples
, FSC
%
EMSS, FSC %
FSC values % compared
Image D The drone navigating in the exhaust plume of a vessel.

18 The Danish Environmental Protection Agency / Airborne Monitoring of Sulphur Emissions from ships – 2018 Campaign Results
On average the air samples only deviate by ±0.009 % FSC from the fuel samples, equal to less than 15 % average discrepancy. The findings correspond to similar comparative results previously collected by Explicit and reported in the 2017 Campaign report. The results of the Port of Aarhus Campaign thus add to the supportive evidence in favour of the applicability of air sampling in general, and the Explicit Mini Sniffer System in particular, as a method for mon-itoring sulphur compliance. On a final note, the team would like to thank the DMA, the Port of Aarhus and APM Terminals for their collaboration in make the comparative campaign possible. Their support was greatly appreciated.

The Danish Environmental Protection Agency / Airborne Monitoring of Sulphur Emissions from ships – 2018 Campaign Results 19

The Danish Environmental Protection Agency Haraldsgade 53 DK-2100 København Ø www.mst.dk
Airborne Monitoring of Sulphur Emissionsfrom Ships in Danish Waters 2018 Explicit ApS has prepared the report for the Danish Environmental Protection Agency (DEPA). It outlines the results of the airborne monitoring of sulphur emissions from ships conducted in Danish waters in 2018 as part of the DEPA’s maritime sulphur en-forcement effort. The report also describes the methods and results of a special drone campaign conducted at the entry to the port of Aarhus in September 2018.