aircraft ground vibration testing at the nasa dryden ... · aircraft ground vibration testing at...
TRANSCRIPT

National Aeronautics andSpace Administration
NASA Technical Memorandum 104275
Aircraft Ground Vibration Testing at the NASA Dryden Flight Research Facility – 1993
Michael W. Kehoe and Lawrence C. Freudinger
June 1994

National Aeronautics andSpace Administration
Dryden Flight Research CenterEdwards, California 93523-0273
1994
NASA Technical Memorandum 104275
Aircraft Ground Vibration Testing at the NASA Dryden Flight Research Facility – 1993
Michael W. Kehoe and Lawrence C. FreudingerNASA Dryden Flight Research Facility Edwards, California

ABSTRACT
The NASA Dryden Flight Research Facility performs ground vibration testing to assess the structuralcharacteristics of new and modified research vehicles. This paper updates the research activities, tech-niques used, and experiences in applying this technology to aircraft since 1987. Test equipment, data anal-ysis methods, and test procedures used for typical test programs are discussed. The data presented illustratethe use of modal test and analysis in flight research programs for a variety of aircraft. This includes a tech-nique to acquire control surface free-play measurements on the X-31 airplane more efficiently, and toassess the effects of structural modifications on the modal characteristics of an F-18 aircraft. In addition,the status and results from current research activities are presented. These data show the effectiveness ofthe discrete modal filter as a preprocessor to uncouple response measurements into simple single-degree-of-freedom responses, a database for the comparison of different excitation methods on a JetStar airplane,and the effect of heating on modal frequency and damping.
NOMENCLATURE
DFRF Dryden Flight Research Facility, Edwards, CA
FEM finite element model
GVT ground vibration test
HARV High Alpha Research Vehicle
LVDT linear variable differential transformer
MIMO multiple-input–multiple-output
NASA National Aeronautics and Space Administration
PC personal computer
SDOF single degree of freedom
SISO single-input–single-output
UC - SDRL University of Cincinnati - Structural Dynamic Research Laboratory, Cincinnati, OH
INTRODUCTION
The National Aeronautics and Space Administration's (NASA) Dryden Flight Research Facility(DFRF) continually conducts flight research using a mix of new airframes and modified fleet aircraft.Since aircraft are flexible, they are prone to a variety of aeroelastic instabilities ranging from mere nui-sances to abrupt and catastrophic structural failures. Each proposed research program is evaluated to de-termine the potential for encountering such instabilities in flight. The measures used to ensure theprevention of these instabilities include predictive stability analyses1 ground vibration tests (GVT),2 open-and closed- loop flight control system tests,3 and flight flutter tests.4
A GVT measures the modal characteristics of a structure. This information is used to assess the signif-icance of structural modifications, verify or update the analytical models used in flutter analyses, planflight flutter tests, and interpret flight test results.
Research into improving and expanding the role of GVTs is required to support these flight test pro-grams properly as advances are made in flight technology. New materials, exotic configurations, thermaleffects from aerodynamic heating, and advanced flight control systems can have significant effects on thein-flight aeroelastic stability of these aircraft.
The purpose of this paper is to update the GVT paper published in 1987.2 Since that time, new equip-ment has been obtained, test techniques have been updated, and additional GVTs have been conducted.Current test techniques and lessons learned from recent tests are also presented in this paper. Also dis-cussed are current research activities in modal testing at elevated temperatures and efforts directed towarddeveloping automated test techniques.
TEST EQUIPMENT
A variety of equipment is required to conduct a GVT. The amount and type of equipment and the scopeof the test itself depend on the size of the vehicle or article being tested and the desired results. The equip-ment used at the DFRF is representative of equipment required to conduct vibration tests on fighter-sizevehicles or smaller.
SHAKERS
Electrodynamic shakers are the primary method of exciting an aircraft structure. The DFRF has a totalof 14 shakers. The specifications of these shakers can be found in reference 2. Each shaker is attached tothe aircraft by a telescoping thrust rod and a stinger.5 A force transducer is mounted atop the stinger andis attached to a locking swivel assembly, which is typically bolted or bonded directly to the structure.
Vacuum cups have also been used to attach shakers. These devices are used on control surfaces andcomposite structures where no means of direct attachment exist. A vacuum pump is required to maintainthe vacuum within the cup.
In addition to the shakers, impact hammers are available for use primarily with component tests suchas plates or avionic equipment racks.
INSTRUMENTATION
The majority of aircraft modal tests conducted at the DFRF use light weight (3 gram), high-sensitivity(1 volt per g), low-cost accelerometers. The magnitude limitation of these accelerometers is 10 gs and thefrequency range is from 1 to 1000 Hz. The DFRF has approximately 300 of these transducers so that anentire aircraft can be completely instrumented for any given test. The high sensitivity is ideal for obtaininggood signal-to-noise ratios even when the response amplitudes are low.
In addition, smaller quantities of other accelerometers are available for applications that exceed the op-erational limitations of the low-cost accelerometers. These include general-purpose and high-temperatureaccelerometers.
Some testing requires velocity or displacement measurements. For this purpose laser vibrometers andlinear variable differential transformers (LVDT) are also available for use.
2

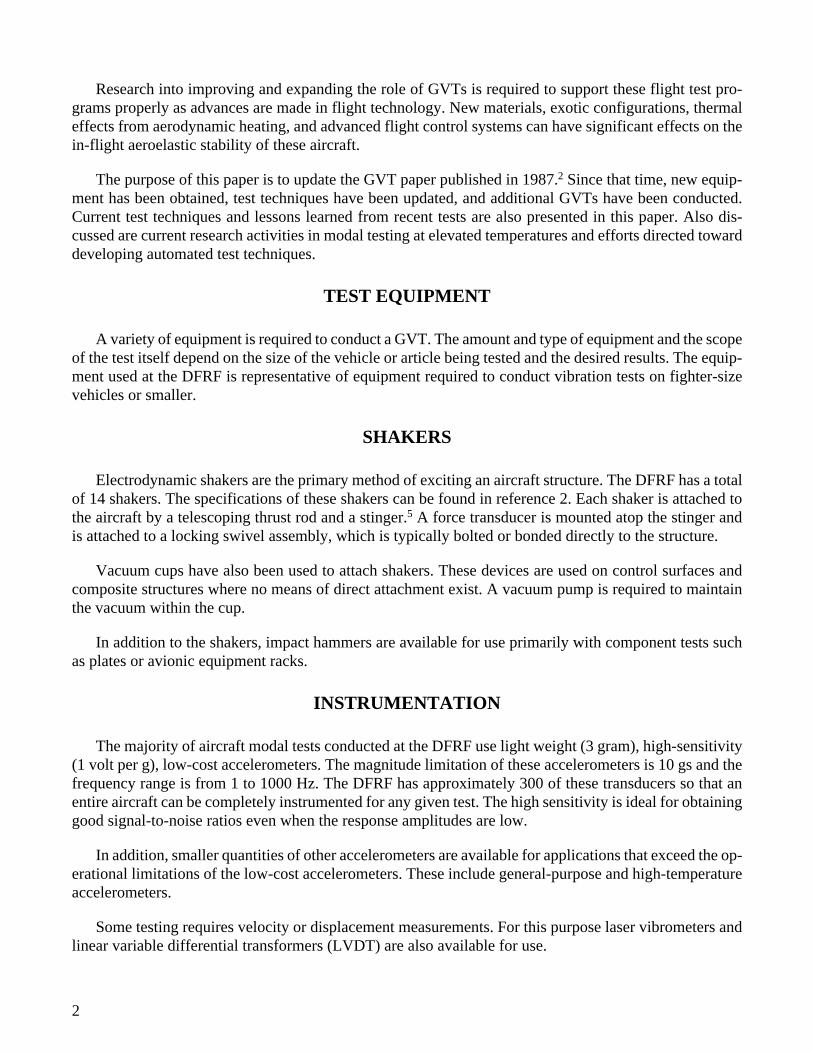
Vibration testing is also supported by instrumentation hardware such as oscilloscopes, voltmeters, stripcharts, amplifiers, and filters. These devices are also part of the GVT facility and the majority are rack-mounted on wheeled carts (Fig. 1). Thus, the equipment can be transported as needed to the test site(s),providing a significant amount of flexibility.
COMPUTERS
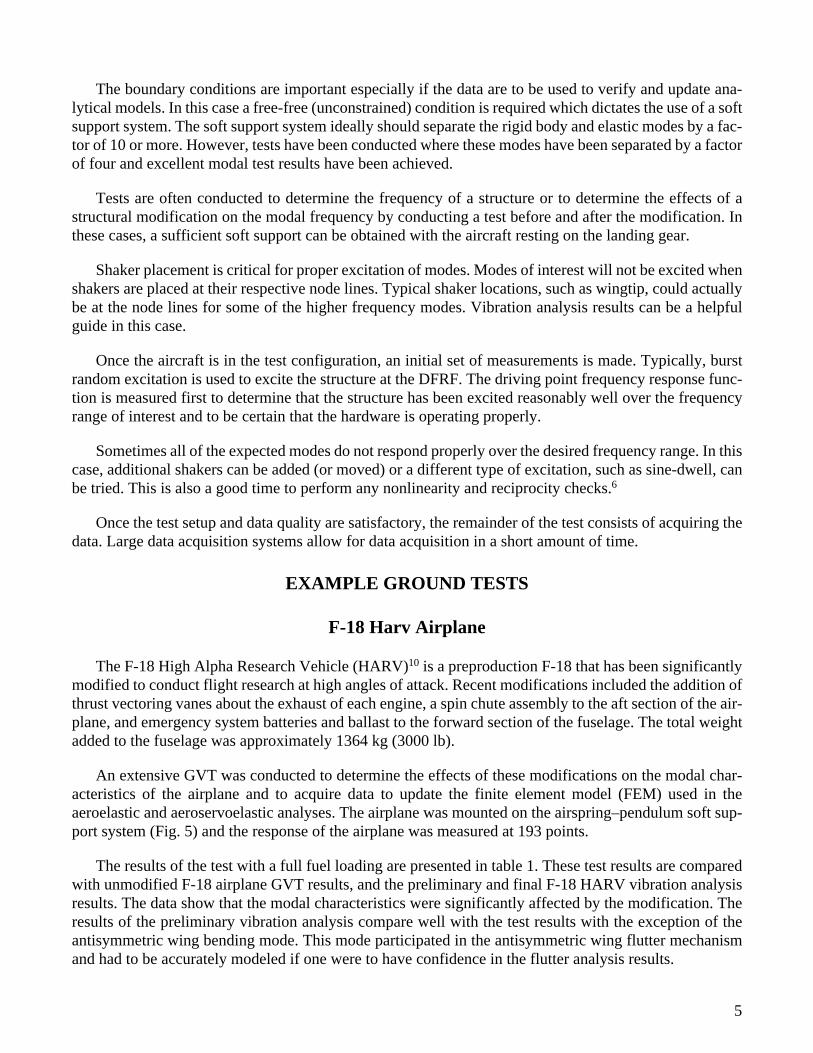
The DFRF uses commercially available, modular data acquisition hardware, supported by worksta-tion-based software. The workstation is shown in Figure 2. The current configuration has been upgradedfrom 8 input channels2 to 200 input channels of simultaneous data acquisition. The current system also hassix programmable signal generators. In addition, since the hardware is modular, up to three smaller testscan be conducted simultaneously. To help support these smaller tests, a 386 and a 486 personal computer(PC) are used for data acquisition and analyses in a manner similar to the workstation (Fig. 3).
SOFT SUPPORT SYSTEMS
Soft support systems are used to approximate free-free (unconstrained) boundary conditions by reduc-ing the frequency of the six rigid-body support modes as much as possible. At the DFRF, these supportsystems include an overhead airbag2, under-the-gear airbags2, and a jack point pendulum-supported pneu-matic spring system.
The pendulum-supported pneumatic spring system consists of three jack point support units (Fig. 4).Each unit has a pressurized air cylinder that is supported by three rods, which forms the pendulum. Thisarrangement attaches at each aircraft jack point and allows movement in all six rigid-body degrees of free-dom. The vertical plunge frequency of the air cylinder–pendulum arrangement is approximately 0.8 Hzwhile the other degree-of-freedom frequencies are 0.5 Hz. It is important that the support rigid-body fre-quencies are low so that there is sufficient separation between the rigid-body modes and the elastic modeson the airplane. This system requires that the airplane be hoisted for mounting onto the units.
Some tests, where the soft support is not required or practical, are conducted with the vehicle's landinggear resting directly on the floor. In this configuration, the landing gear struts are deflated to reduce po-tential nonlinear oscillations, and the tire pressure is reduced to one-half normal to provide a soft support.This approach is used with considerable caution because the rigid-body landing gear modes may be inad-equately isolated from the flexible-body dynamic modes.
EXCITATION TECHNIQUES
Most aircraft tests conducted at the DFRF excite the structure with multiple shakers, initially using ran-dom or burst random excitation. The advantages and disadvantages of using this type of signal are welldocumented in reference 6.
Often, there are tests in which the random excitation technique does not provide adequate excitationfor all the modes of interest. In these cases, slow sine sweep or sine-dwell techniques are used. It has beenfound through experience that no single method of excitation is superior for every test application.
3

Impact excitation7 is generally used for small structures or aircraft components. It provides an effectiveapproach when low-excitation input energy is needed.
MODAL PARAMETER ESTIMATION
The DFRF maintains several commercial software packages to extract modal parameters from mea-sured data. These packages provide many ways to estimate modal parameters, from single-input–single-output (SISO), single-degree-of-freedom (SDOF) techniques to multiple-input–multiple-output (MIMO),multiple-degree-of-freedom (MDOF) techniques.6 The approach typically taken is to first perform quick-look SISO pole estimation during the test using the mode indicator function8 as a guide. The MIMO esti-mation routines are usually used post-test when a complete analysis of the data is performed.
Unfortunately, none of the algorithms work well enough to be used with confidence in all cases andnone provide uncertainty bands with the parameter estimates. This drawback will most likely become acritical issue in the future.9
TEST PROCEDURES
The following section discusses typical measures taken to prepare the aircraft for a GVT.
The aircraft must be structurally complete with all structural load bearing doors and covers installedand secured. It may be necessary to remove some nonstructural panels to provide access for external hy-draulic lines and electrical power. All structural panel fasteners should be properly torqued. Loose fasten-ers or components rattling during the test can contaminate the response data, and it is worth the effort tominimize this source of error.
Major aircraft components should either be present on the aircraft, or properly mass represented andsecured to the aircraft. One needs to exercise a certain amount of judgment in this area. One kilogram (2.2lb) of mass missing on a control surface is critical while 10 kg (22 lb) of mass missing near the center ofgravity in the fuselage may not be critical.
Control surface free play must be removed to increase the linearity of the measured data.2 The typicalprocedure is to preload the surfaces with heavy weights (25 kg (55 lb)) suspended from elastic cord tapedto the control surface edge. The plunge frequency of the weight should be less than 1 Hz, so that theweight's influence on the elastic modes is minimal.
The amount of fuel in each tank is determined so that the test configuration represents the analyticalconfiguration as closely as possible. Special precautions must be taken with volatile fuels to reduce vaporsthat could ignite in the test area. The fuel system can be purged and filled with an inert fluid which hassimilar mass properties to reduce the hazards.
The aircraft hydraulic and flight control systems must be functional. These two systems work togetherin modern aircraft to provide the capability of positioning the control surfaces in a trimmed position forthe test. In addition, the hydraulic system provides stiffness for the control surface rotation modes. Theflight control system must be able to open the sensor feedback loops so that there is no control surface mo-tion commanded during the test. Most modern flight control systems provide such a mode.
4
The boundary conditions are important especially if the data are to be used to verify and update ana-lytical models. In this case a free-free (unconstrained) condition is required which dictates the use of a softsupport system. The soft support system ideally should separate the rigid body and elastic modes by a fac-tor of 10 or more. However, tests have been conducted where these modes have been separated by a factorof four and excellent modal test results have been achieved.
Tests are often conducted to determine the frequency of a structure or to determine the effects of astructural modification on the modal frequency by conducting a test before and after the modification. Inthese cases, a sufficient soft support can be obtained with the aircraft resting on the landing gear.
Shaker placement is critical for proper excitation of modes. Modes of interest will not be excited whenshakers are placed at their respective node lines. Typical shaker locations, such as wingtip, could actuallybe at the node lines for some of the higher frequency modes. Vibration analysis results can be a helpfulguide in this case.
Once the aircraft is in the test configuration, an initial set of measurements is made. Typically, burstrandom excitation is used to excite the structure at the DFRF. The driving point frequency response func-tion is measured first to determine that the structure has been excited reasonably well over the frequencyrange of interest and to be certain that the hardware is operating properly.
Sometimes all of the expected modes do not respond properly over the desired frequency range. In thiscase, additional shakers can be added (or moved) or a different type of excitation, such as sine-dwell, canbe tried. This is also a good time to perform any nonlinearity and reciprocity checks.6
Once the test setup and data quality are satisfactory, the remainder of the test consists of acquiring thedata. Large data acquisition systems allow for data acquisition in a short amount of time.
EXAMPLE GROUND TESTS
F-18 Harv Airplane
The F-18 High Alpha Research Vehicle (HARV)10 is a preproduction F-18 that has been significantlymodified to conduct flight research at high angles of attack. Recent modifications included the addition ofthrust vectoring vanes about the exhaust of each engine, a spin chute assembly to the aft section of the air-plane, and emergency system batteries and ballast to the forward section of the fuselage. The total weightadded to the fuselage was approximately 1364 kg (3000 lb).
An extensive GVT was conducted to determine the effects of these modifications on the modal char-acteristics of the airplane and to acquire data to update the finite element model (FEM) used in theaeroelastic and aeroservoelastic analyses. The airplane was mounted on the airspring–pendulum soft sup-port system (Fig. 5) and the response of the airplane was measured at 193 points.
The results of the test with a full fuel loading are presented in table 1. These test results are comparedwith unmodified F-18 airplane GVT results, and the preliminary and final F-18 HARV vibration analysisresults. The data show that the modal characteristics were significantly affected by the modification. Theresults of the preliminary vibration analysis compare well with the test results with the exception of theantisymmetric wing bending mode. This mode participated in the antisymmetric wing flutter mechanismand had to be accurately modeled if one were to have confidence in the flutter analysis results.
5

The stiffness of the wing fold mechanism was modeled as a spring in the FEM. Decreasing the stiffnessof this spring produced the results in the final vibration analysis shown in table 1. These results now agreeclosely with the experimentally measured values.
The F-18 HARV program is an example of how a GVT is used to qualify an airplane for flight. TheGVT determines the change in the modal characteristics caused by structural modifications. The test re-sults were used to update the FEM to more accurately represent the airplane. Consequently, flutter analysisresults with higher confidence were produced and this had the effect of reducing the number of flight flut-ter test points in the program.
X-31 Thrust Vectored Airplane
The X-31 (Fig. 6) is a single-engine experimental airplane with 17 control surfaces including 3 thrustvectoring vanes about the exhaust of the engine. The amount of control surface free play and its effect onthe aeroelastic stability was a concern for this airplane. Stringent free-play tolerances were specified andmeasurements were made every 100 flight hours.
Modal test equipment was used to measure the free play of the airplane's flight control surfaces in aquasi-static fashion. The technique involves oscillating a control surface with electrodynamic shakers at afrequency of 1 Hz. This frequency was selected as being low enough to avoid inertial effects but highenough to avoid leakage effects associated with the control surface actuator by-pass orifices. Each controlsurface was oscillated through its free-play region and into a region where the control surface displacementvaried linearly with input force. The surface displacement was measured with a linear variable differentialtransformer (LVDT). The shakers and the LVDT were mounted to the aircraft structure by means of vac-uum cups. This mounting method provided for quick setups and relocation of the test equipment. The over-all setup is shown in Figure 7.
A personal computer (PC) was used to acquire the shaker force and LVDT signals. These signals wereplotted against each other to form a Lissajous figure. A typical Lissajous figure is shown in Figure 8. Lineswere faired through the linear portions of the loaded and unloaded segments. The value of free play wasmeasured as the vertical distance between these lines at the origin of the Lissajous figure. Hysteresis andactuator stiffness could also be obtained from this figure if desired.
This method, which used modal test equipment, provided a quick and accurate means of measuringcontrol surface free play of an aircraft. This method was considered an improvement over the traditionalstatic method.
RESEARCH ACTIVITIES
Hot Structures Vibration Testing
Flight vehicles that fly at hypersonic speeds are subjected to high surface temperatures and large tem-perature gradients. These conditions affect the modal characteristics of the structure and can seriously af-fect the aeroelastic and aeroservoelastic stability of the vehicle. If FEM analysis methods are to be reliedupon to predict these instabilities, then accurate determination of the effect of heat on the modal charac-teristics of these structures is vital.
6

A series of heated structure vibration tests has been conducted on aluminum, titanium, and fiberglassplates at uniform, nonuniform, and transient heating profiles.11,12 Each plate was 30.5 cm (12 in.) wide,127 cm (50 in.) long, and typically 0.51 cm (0.2 in.) thick. A typical test setup is shown in Figure 9. Thisprogram was conducted to research the experimental test technique required for heated structures and toestablish an initial database for analysis code verification.
Figure 10 shows a comparison of the frequency response function of an aluminum plate at room tem-perature and heated to 204 °C (400 °F). In general, it has been found that modal frequency and amplitudedecreased and the damping increased as temperature was increased. Predictive vibration analyses havebeen performed on each plate tested and good correlation has been obtained with the experimental data.13
One finding of this research was that more development of experimental test methods and analytical pro-cedures are required for composite materials. There are plans to continue the research in the experimentaland analytical areas for composite structures.
On-Line Modal State Monitor
A joint research program to develop on-line parameter estimation schemes for nonstationary linearsystems is being conducted with the University of Cincinnati - Structural Dynamics Research Laboratory(UC - SDRL).14,15 This concept uses the discrete modal filter. The modal filter is simply a coordinate trans-formation from physical to modal coordinates. In modal coordinates, the response of the structure isviewed as a combination of independent single-degree-of-freedom oscillators. Expressing the response ofthe structure in this fashion makes it easier to understand the dynamics of the vibrating system.
To illustrate the usefulness of a modal filter, it was applied to a damped, six-mode analytical system.Figure 11 shows the response trace containing the six modes in physical coordinates and the decoupledresponse of the first three modes after applying the modal filter. This results is a single-degree-of-freedomtrace for each mode.
A test was conducted on a truss structure (Fig. 12) to show how the modal state monitor using the mod-al filter might be used. Data were acquired at 23 response points on this structure. The on-line monitor wasused to observe the structure for 128 sec. At 30 sec, the structure was modified by abruptly fixing a cornerof the structure to the ground. At 60 sec, the corner of the structure was abruptly released which returnedthe structure to its original state. The results for one mode of the structure are shown in Figure 13. Themonitor, using a simple recursive least-squares estimation algorithm, detected these changes and was con-verging on the new results. Although the convergence speed of this recursive least-square algorithm wasnot sufficient for tracking the change of this system in an on-line fashion, it does show the viability of thisapproach for implementing an on-line procedure. The modal filter is considered to be a promising datacondensation technique leading to more robust estimates and automated testing techniques.
Jetstar Ground Vibration Test Airplane
The DFRF has decommissioned a modified JetStar airplane and has retained it as a structural dynamicstest article. The airplane (Fig. 14) is structurally complete and provides a realistic test article on which toexperiment and develop new GVT techniques.
A database has been established with this airplane to compare different excitation methods. Thesemethods include sine dwell, single and multiple input random, and impulsive sine.2,16,17 Table 2 compares
7

frequency and damping values for each type of excitation. In general, the frequency values compared welland the damping values showed a fair comparison. Variations in the estimated damping values may becaused by data scatter or may be a result of using different estimation algorithms for each type of excita-tion.16, 17
This airplane will continue to be used as a test article for verification and development of new test tech-niques.
CONCLUDING REMARKS
The Dryden Flight Research Facility has upgraded its ground vibration test system from 8 to 200 dataacquisition channels. The current hardware configuration is modular and can be divided into three smallersystems which allows vibration tests to be conducted simultaneously. This equipment upgrade has im-proved data quality and larger amounts of data can now be acquired in less time.
The modal parameter estimation techniques have been maintained to the state-of-the-art level availablefrom commercial software packages. Current techniques provide many ways to estimate modal parame-ters, from single-input–single-output systems to multiple-input–multiple-output systems. Each techniquehas advantages and disadvantages and no one technique is solely relied upon for all testing.
Ground vibration testing continues to fulfill a vital role in assuring the absence of aeroelastic instabil-ities of new and modified research aircraft. Test data are used to assess the significance of structural mod-ifications, verify or update the analytical models used in flutter analyses, plan flight flutter tests, andinterpret flight test results. Research into improving and expanding the role of ground vibration testing ison going at the Dryden Flight Research Facility to support the flight test programs of the future properly.
REFERENCES
1. Bisplinghoff, Raymond L., Holt Ashley, and Robert L. Halfman, “Aeroelasticity,” Addison-WesleyPublishing Company, Reading, MA, 1962.
2. Kehoe, Michael W., Aircraft Ground Vibration Testing At The NASA Ames-Dryden Flight ResearchFacility Research Facility, NASA TM-88272, 1987.
3. Peloubet, R.P., Jr., R.L. Haller, C.N. McComb, and R.M. Bolding, “Ground Vibration Testing OfFighter Aircraft With Active Control Systems,” AFFDL-TR-76-110, Vol. 1–4, 1976.
4. Flutter Testing Techniques, NASA SP-415, 1975.
5. Ewins, D.J., “Modal Testing: Theory and Practice,” John Wiley and Sons Inc., 1984.
6. Allemang, Randall J. and David L. Brown, “Experimental Modal Analysis and Dynamic ComponentSynthesis,” Air Force Wright Aeronautical Laboratories Report AFWAL-TR-87-3069, Vol. 1–6,Dec. 1987.
7. Halvorsen, William G. and David L. Brown, “Impulse Technique for Structural Frequency ResponseTesting,” Sound and Vibration, Nov. 1987, pp. 8–21.
8

8. Williams, Roger, John Crowley, and Vold, “The Multivariate Mode Indicator Function inModal Analysis,” Third International Modal Analysis Conference, Jan. 1985.
9. Allemang, Randall J., "Modal Analysis -- Where Do We Go From Here?”, 11th International ModalAnalysis Conference, Kissimmee, FL, 1993.
10. Regenie, Victoria A., Donald H. Gatlin, Robert Kempel, and Neil W. Matheny, The F-18 High AlphaResearch Vehicle: A High-Angle-Of-Attack Testbed Aircraft, NASA TM-104253, 1992.
11. Kehoe, Michael W. and H. Todd Snyder, Thermoelastic Vibration Test Techniques, NASATM-101742, 1991.
12. Snyder, H. Todd and Michael W. Kehoe, Determination of the Effects of Heating on Modal Charac-teristics of an Aluminum Plate With Application to Hypersonic Vehicles, NASA TM-4274, 1991.
13. Kehoe, Michael W. and Vivian C. Deaton, Correlation of Analytical and Experimental Hot StructureVibration Results, NASA TM-104269, 1993.
14. Shelley, S.J., L.C. Freudinger, and R.J. Allemang, “Development of an On-Line Parameter Estima-tion System Using the Discrete Modal Filter,” 10th International Modal Analysis Conference, SanDiego, CA, Feb. 1992.
15. Shelley, Stuart J., Lawrence C. Freudinger, and Randall J. Allemang, “Development of an On-LineModal State Monitor,” 11th International Modal Analysis Conference, Kissimmee, FL, Feb. 1993.
16. Kehoe, Michael W., F.W. Cazier, Jr., and Joseph F. Ellison, Ground Vibration Test of the LaminarFlow Control JetStar Airplane, NASA TM- 86398, 1985.
17. Kehoe, Michael W. and David F. Voracek, Ground Vibration Test Results of a JetStar Airplane UsingImpulsive Sine Excitation, NASA TM-100448, 1989.
Havard
9

Table 1. Correlation of F-18 experimental and analytical vibration results.
Frequency, Hz
Mode description Unmodified F-18 GVT
F-18 HARV GVT
Preliminary analysis
Final analysis
Symmetric wing bending 5.94 6.02 5.98 5.71
Fuselage lateral bending 8.22 6.64 6.86 6.86
Fuselage vertical bending 9.57 7.76 7.49 7.44
Antisymmetric wing bending 8.78 8.33 9.21 8.44
Symmetric wing torsion 13.81 11.80 12.42 11.61
Antisymmetric wing torsion 12.29 12.13 12.68 12.01
Antisymmetric stabilizer bending 13.59 13.45 13.30 13.54
Symmetric stabilizer bending – – – 13.63 13.13 13.68
Wing fore/aft, vertical stabilizer bending – – – 15.09 15.01 14.98
Fuselage 2nd vertical bending – – – 15.23 15.94 15.17
Antisymmetric vertical stabilizer bending – – – 15.31 16.40 15.52
Symmetric vertical stabilizer bending – – – 15.68 16.85 15.92
2nd wing bending 16.11 17.00 17.97 16.94
Fuselage torsion – – – 22.00 19.20 18.69
10

Table 2. Modal parameter comparison for a modified JetStar airplane.
Sine dwell Single point random
Mode description Frequency, Hz
Damping, G
Frequency, Hz
Damping, G
Symmetric wing bending 4.90 0.018 4.92 0.020
Empennage roll, fuselage torsion 5.05 0.026 5.20 0.014
Empennage roll, engine pylon bending 5.75 0.026 5.97 0.014
Engine pylon bending/stabilizer bending 7.49 0.016 7.57 0.017
Symmetric stabilizer and fuselage vertical bending 9.18 0.014 9.27 0.012
Antisymmetric wing bending 10.86 0.037 10.79 0.034
Symmetric stabilizer, fuselage vertical bending and engine pylon pitch 11.05 0.075 11.25 0.032
Antisymmetric wing bending and engine pylon pitch 13.88 0.016 13.92 0.012
Symmetric 2nd wing bending and engine pylon pitch 16.12 0.059 16.32 0.075
Multiple input random Impulsive sine
Mode description Frequency, Hz
Damping, G
Frequency, Hz
Damping, G
Symmetric wing bending 4.92 0.011 4.94 0.021
Empennage roll, fuselage torsion 5.13 0.019 5.20 0.012
Empennage roll, engine pylon bending 5.87 0.017 5.95 0.014
Engine pylon bending/stabilizer bending 7.93 0.020 7.49 0.016
Symmetric stabilizer and fuselage vertical bending 9.14 0.024 9.22 0.013
Antisymmetric wing bending 10.47 0.032 10.64 0.018
Symmetric stabilizer, fuselage vertical bending and engine pylon pitch 10.96 0.052 10.96 0.024
Antisymmetric wing bending and engine pylon pitch 13.55 0.026 13.65 0.014
Symmetric 2nd wing bending and engine pylon pitch 16.22 0.056 16.22 0.088
11
EC 91 341-5Figure 1. Rack-mounted instrumentation cart.
EC 91341-11Figure 2. Modal analysis workstation.
12

EC 91 341-9Figure 3. Personal computer based data acquisition system.
Figure 4. Pendulum-supported pneumatic spring soft support system.
13

Figure 5. F-18 HARV airplane mounted on the pneumatic spring soft support system.
EC 92 09164-3Figure 6. X-31 airplane.
14

Figure 7. X-31 control surface free play test setup.
Figure 8. Typical Lissajous figure depicting free play on a control surface.
930490Load, kg (lb)
Displacement, cm (in.)
0.20 cm (0.08 in.)
0.10 cm (0.04 in.)
0
–0.20 cm (–0.08 in.)
0.034 in.
0.033 in.
0–45 kg (–100 lb)
–91 kg (–200 lb)
–0.10 cm (–0.04 in.)
45 kg (100 lb)
91 kg (200 lb)
0.15 cm (0.06 in.)
0.05 cm (0.02 in.)
–0.05 cm (–0.02 in.)
–0.15 cm (–0.06 in.)
15

Figure 9. Hot structure vibration test setup.
16

Figure 10. Comparison of frequency response plots obtained at room and elevated temperature.
Figure 11. Unfiltered and modally filtered time histories.
930493
Mode 1
Time history
Amplitude
Amplitude Total response time history
Mode 2
Mode 3
17

Figure 12. Truss structure assembly.930494
51 cm (20 in)
150 cm (59 in)
452 cm (178 in)
18

Figure 13. Frequency and damping estimates for one mode of a nonstationary system.
19

Figure 14. JetStar airplane.
20

REPORT DOCUMENTATION PAGE
Form ApprovedOMB No. 0704-0188
Public reporting burden for this collection of information is estimated to average 1 hour per response, including the time for reviewing instructions, searching existing data sources, gathering and maintaining the data needed, and completing and reviewing the collection of information. Send comments regarding this burden estimate or any other aspect of this col-lection of information, including suggestions for reducing this burden, to Washington Headquarters Services, Directorate for Information Operations and Reports, 1215 Jefferson Davis Highway, Suite 1204, Arlington, VA 22202-4302, and to the Office of Management and Budget, Paperwork Reduction Project (0704-0188), Washington, DC 20503.
1. AGENCY USE ONLY (Leave blank) 2. REPORT DATE 3. REPORT TYPE AND DATES COVERED
4. TITLE AND SUBTITLE 5. FUNDING NUMBERS
6. AUTHOR(S)
8. PERFORMING ORGANIZATION REPORT NUMBER
7. PERFORMING ORGANIZATION NAME(S) AND ADDRESS(ES)
9. SPONSORING/MONOTORING AGENCY NAME(S) AND ADDRESS(ES) 10. SPONSORING/MONITORING AGENCY REPORT NUMBER
11. SUPPLEMENTARY NOTES
12a. DISTRIBUTION/AVAILABILITY STATEMENT 12b. DISTRIBUTION CODE
Unclassified—Unlimited Subject Category 05
13. ABSTRACT (Maximum 200 words)
14. SUBJECT TERMS 15. NUMBER OF PAGES
16. PRICE CODE
17. SECURITY CLASSIFICATION OF REPORT
18. SECURITY CLASSIFICATION OF THIS PAGE
19. SECURITY CLASSIFICATION OF ABSTRACT
20. LIMITATION OF ABSTRACT
NSN 7540-01-280-5500
Standard Form 298 (Rev. 2-89)
Prescribed by ANSI Std. Z39-18298-102
Aircraft Ground Vibration Testing at the NASA Dryden Research Facility – 1993
RTOP505-63-50
Michael W. Kehoe and Lawrence C. Freudinger
NASA Dryden Flight Research CenterP.O. Box 273Edwards, California 93523-0273
H-1966
National Aeronautics and Space AdministrationWashington, DC 20546-0001 NASA TM-104275
The NASA Dryden Flight Research Facility performs ground vibration testing to assess the structural charac-teristics of new and modified research vehicles. This paper updates the research activities, techniques used, andexperiences in applying this technology to aircraft since 1987. Test equipment, data analysis methods, and testprocedures used for typical test programs are discussed. The data presented illustrate the use of modal test andanalysis in flight research programs for a variety of aircraft. This includes a technique to acquire control surfacefree-play measurements on the X-31 airplane more efficiently, and to assess the effects of structural modifica-tions on the modal characteristics of an F-18 aircraft. In addition, the status and results from current researchactivities are presented. These data show the effectiveness of the discrete modal filter as a preprocessor touncouple response measurements into simple single-degree-of-freedom responses, a database for the compari-son of different excitation methods on a JetStar airplane, and the effect of heating on modal frequency anddamping.
Ground vibration test, Hot structures, Modal analysis, Modal filterAO3
24
Unclassified Unclassified Unclassified Unlimited
April 1994 NASA Technical Memorandum
For sale by the National Technical Information Service, Springfield, Virginia 22161-2171
Also presented at the 12th International Modal Analysis Conference (IMAC), Honolulu, HI, Feb. 2, 1994. Sponsored by SEM.