airline cost management group (acmg) report - iata - · pdf file ·...
TRANSCRIPT
Airline Cost Management Group (ACMG) Enhanced Report - Sep 2014
1
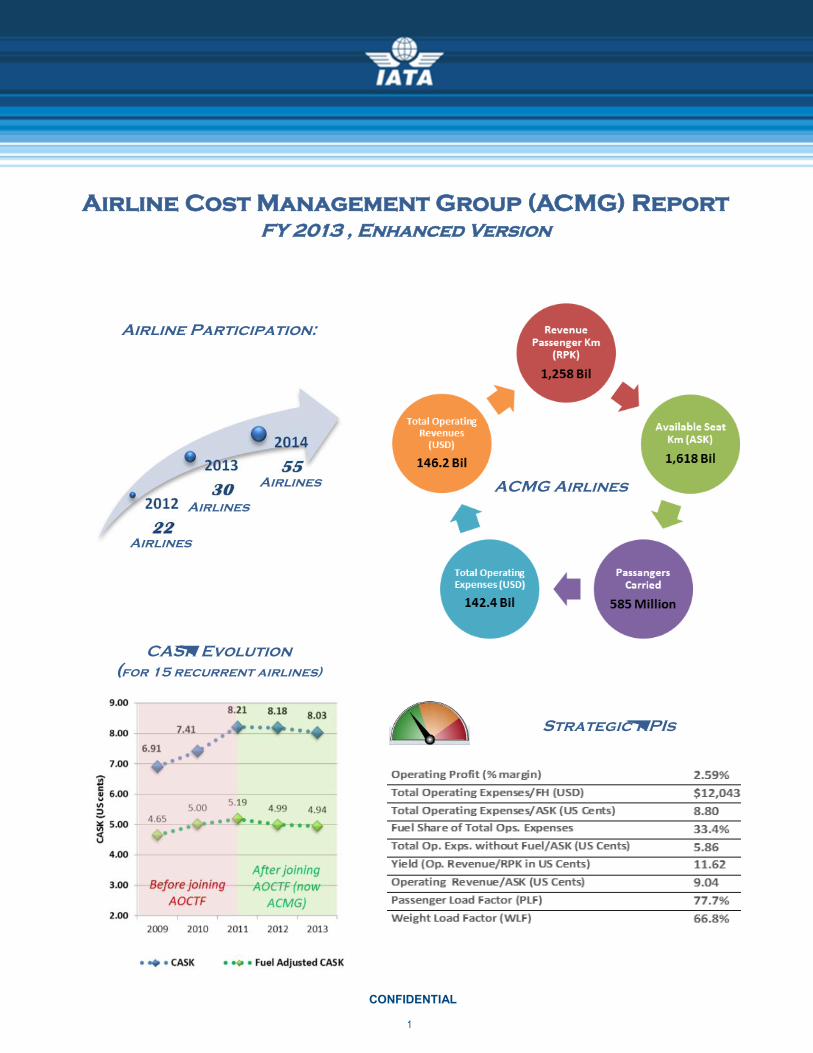
Airline Participation:
Airline Cost Management Group (ACMG) Report
FY 2013 , Enhanced Version
CONFIDENTIAL
ACMG Airlines
Strategic KPIs
CASK Evolution
(for 15 recurrent airlines)
Airlines
Airlines
Airlines

Airline Cost Management Group (ACMG) Enhanced Report - Sep 2014
2
Table of Contents
CONFIDENTIAL
Executive Summary ......................................................................................................................................... 3
Definitions & Acronyms .................................................................................................................................... 4
Data & Analysis Methodology ................................................................................................................................. 4
1. Introduction....................................................................................................................................... 5
Airline Industry Landscape 2013 .............................................................................. 6
2. Overview of the ACMG Airlines ....................................................................................................... 7
3. Airline Cost Structure ..................................................................................................................... 14
4. Strategic Key Performance Indicators .......................................................................................... 16
Financial Performance .................................................................................................. 17
Special focus on impact of currency exchange fluctuations ........................... 19
Yearly Trends Analysis ................................................................................................. 20
5. Operational Key Performance Indicators ..................................................................................... 22
Fuel Cost and Efficiency .............................................................................................. 22
Special focus on impact of fuel hedging .......................................................... 26
Employment Cost Structure ......................................................................................... 27
Staff Productivity .......................................................................................................... 30
6. Aircraft Type Analysis .................................................................................................................... 32
7. Detailed Analysis of B737NG and A320 Family ........................................................................... 35
B737NG .......................................................................................................................... 35
A320 Family ................................................................................................................... 37
8. Specialized ACMG Report .............................................................................................................. 40
ACMG Steering Committee .................................................................................................................................. 41
ACMG Developments ........................................................................................................................................... 42
Disclaimer
This study is to inspire discussions around the cost drivers and cost elements related to airline/aircraft operations. It is intended to provide high level
benchmarks that individual airlines could analyze to achieve efficiencies and cost savings.
This study is not meant to derive direct cost comparisons. Every airline operates in a unique environment not only in terms of geographic location, net-
work schedule, and fleet types. Elements such as aircraft age, fleet size, proximity to major OEMs, currency exchange rates, and many other parameters
play a very significant role, making direct comparisons unreal. Cost Benchmark is not a science and no existing normalization is available that allows any
form of direct comparisons. In addition, our sample includes airlines of different size, A/C size, and operational profile.
This report, including the collection of data, and publication of the results, complies strictly with all relevant competition laws. It is exclusively available to
the airlines which participated in the data collection. Any use by third parties must first be cleared with IATA.
Despite our efforts to provide accurate and up-to-date information, IATA declines any responsibility for inaccurate, incomplete, or outdated information
that may be posted herein, and expressly disclaims liability for errors or omissions in its contents. IATA disclaims all warranties of any kind, either ex-
pressed or implied, including, but not limited to, implied warranties of satisfactory quality, fitness for a particular purpose, or non-infringement. IATA shall
not be liable for any loss which may arise from the use of the information contained in this presentation.

Airline Cost Management Group (ACMG) Enhanced Report - Sep 2014
3
This publication builds upon the FY2012 Report which has already
been tailored to improve the value to ACMG (formerly AOCTF)
member airlines with new segments on airline staff and financial
performance. FY2013 report clearly defines Strategic and
Operational Key Performance Indicators (KPIs) and adds additional
bits and pieces, largely an influence of diligent ACMG Steering
Committee (SC).
Before diving into the contents, why the name change?
In order to better reflect the mission and objectives of IATA’s cost
management initiative, in the past several years known as Airline
Operational Cost Task Force (AOCTF), the name has been changed
to Airline Cost Management Group (ACMG) and the terms of
reference expanded.
Amidst the biggest yearly membership growth so far (from 30 to
55 airlines) our SC decided to take a broader look on the airline
costs and add even more value to participating airlines.
The report examines airline costs for 2013. More precisely, it
consolidates and analyzes ACMG airlines’ operational data, cost
structures, and unit costs.
A total of 55 airlines from all major regions with 585 million
passengers carried submitted data for 2013. One third of them
rank among Top 50 airlines by financial results! (IATA WATS 2013).
The statistical snapshot shows the ACMG member airlines now
represent more than 20% of the industry, offering an invaluable
insight into the real data and operations.
ACMG airlines operated 3,730 aircraft, including 47% Boeing/
McDonnell-Douglas, 35% Airbus, 8% Bombardier, and 4% Embraer
aircraft. They mostly favored narrowbodies (NB), and new and
more fuel efficient aircraft. NBs represented approx. 58%,
widebodies 24%, while regional jets and turboprops held 9% and
6% market share, respectively. The average age of ACMG fleet
was 9.88 years. Majority of the airlines were essentially without
cargo traffic, however those with a significant cargo activity were
generally larger, representing 40% of total ATK and 37% of total
ASK.
This year the analysis was structured around Strategic KPIs,
usually of much interest to senior level management, comprising
key statistical and financial figures, and Operational Key
Performance Indicators examining the areas of fuel cost and
efficiency, staff productivity, and employment costs.
Relevant benchmarking is provided in all those areas. Whereas
this Report focuses on a group as a whole, specialized reports,
either focusing on a region, similar fleet size, or similar stage
length, will be available upon request. Please check page 41 for
more information on this newest and utmost valuable feature.
Again, we “rewarded” the most dedicated ACMG members with
yearly trends analysis; a priceless insight into real savings of
devoted ACMG members.
It shows their unit costs have been decreasing consistently ever
since they joined ACMG* (formerly AOCTF). Consequently millions
of dollars have been saved.
Another interesting finding shows that the low cost carriers are
not necessary the profitable carriers as the “revenue size
indicated against RASK and CASK chart” illustrates there is still
profitability in the higher RASK levels. The ACMG airlines** are
profitable as a whole; with an overall average operating margin of
2.6%. However, 24 airlines in the group still incurred losses.
Passenger volumes continued to increase steadily, while cargo
demand has rebounded throughout 2013, which resulted in
encouraging RPK and RTK increases. ACMG carriers were
successfully keeping passenger and freight capacity growth
slightly slower than expansion in demand which led passenger
load factor to a record high of 77.7% (and weight load factor to
66.8%).
The ACMG fleet analysis showed that B737NG and A320 family
were two most popular aircraft families representing 26.1% and
22.8% of ACMG active fleet count, respectively.
Last but not least, ACMG delivered the 2nd Airline Cost
Conference last month, featuring many prominent speakers, and
received excellent feedback from the airline participants.
Executive Summary
CONFIDENTIAL
* The first Report of the revitalized AOCTF was covering years 2009/10/11 together whereas every subsequent Report is covering only one year at a time
** 52 airlines provided validated revenue and expenditure data
Airline Cost Management Group (ACMG) Enhanced Report - Sep 2014
4
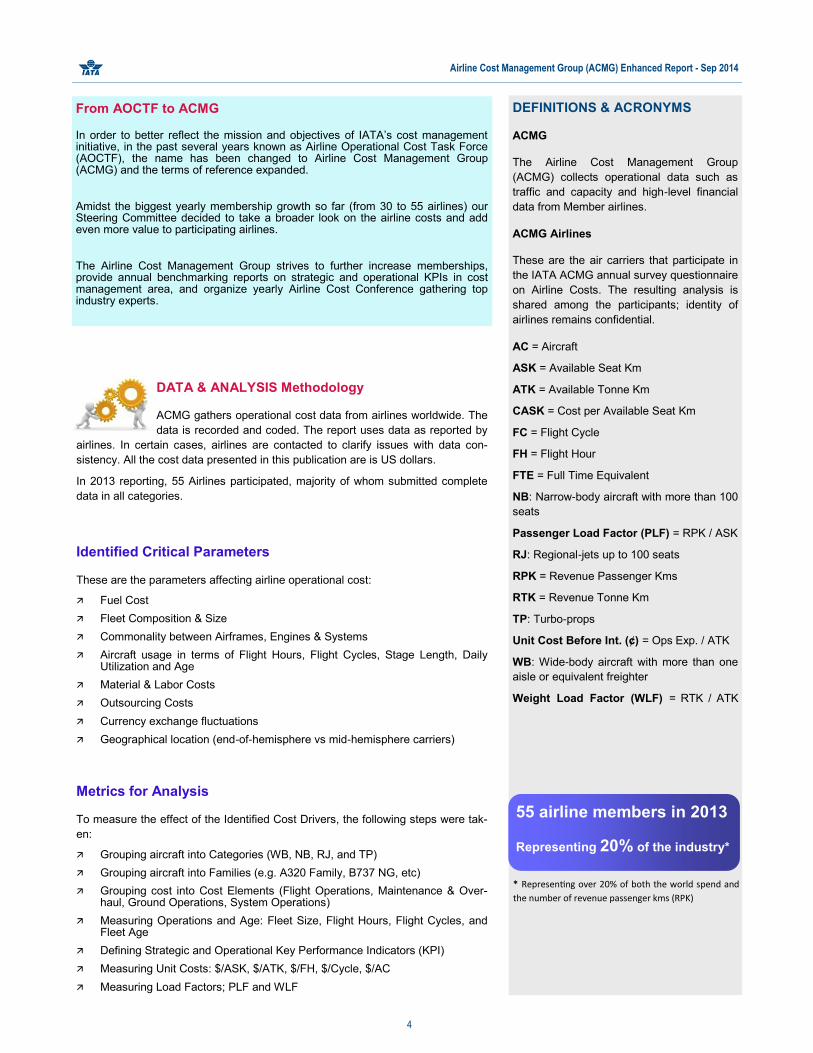
DEFINITIONS & ACRONYMS
ACMG
The Airline Cost Management Group
(ACMG) collects operational data such as
traffic and capacity and high-level financial
data from Member airlines.
ACMG Airlines
These are the air carriers that participate in
the IATA ACMG annual survey questionnaire
on Airline Costs. The resulting analysis is
shared among the participants; identity of
airlines remains confidential.
AC = Aircraft
ASK = Available Seat Km
ATK = Available Tonne Km
CASK = Cost per Available Seat Km
FC = Flight Cycle
FH = Flight Hour
FTE = Full Time Equivalent
NB: Narrow-body aircraft with more than 100
seats
Passenger Load Factor (PLF) = RPK / ASK
RJ: Regional-jets up to 100 seats
RPK = Revenue Passenger Kms
RTK = Revenue Tonne Km
TP: Turbo-props
Unit Cost Before Int. (¢) = Ops Exp. / ATK
WB: Wide-body aircraft with more than one
aisle or equivalent freighter
Weight Load Factor (WLF) = RTK / ATK
DATA & ANALYSIS Methodology
ACMG gathers operational cost data from airlines worldwide. The
data is recorded and coded. The report uses data as reported by
airlines. In certain cases, airlines are contacted to clarify issues with data con-
sistency. All the cost data presented in this publication are is US dollars.
In 2013 reporting, 55 Airlines participated, majority of whom submitted complete
data in all categories.
Identified Critical Parameters
These are the parameters affecting airline operational cost:
Fuel Cost
Fleet Composition & Size
Commonality between Airframes, Engines & Systems
Aircraft usage in terms of Flight Hours, Flight Cycles, Stage Length, Daily Utilization and Age
Material & Labor Costs
Outsourcing Costs
Currency exchange fluctuations
Geographical location (end-of-hemisphere vs mid-hemisphere carriers)
Metrics for Analysis
To measure the effect of the Identified Cost Drivers, the following steps were tak-
en:
Grouping aircraft into Categories (WB, NB, RJ, and TP)
Grouping aircraft into Families (e.g. A320 Family, B737 NG, etc)
Grouping cost into Cost Elements (Flight Operations, Maintenance & Over-haul, Ground Operations, System Operations)
Measuring Operations and Age: Fleet Size, Flight Hours, Flight Cycles, and Fleet Age
Defining Strategic and Operational Key Performance Indicators (KPI)
Measuring Unit Costs: $/ASK, $/ATK, $/FH, $/Cycle, $/AC
Measuring Load Factors; PLF and WLF
55 airline members in 2013
Representing 20% of the industry*
* Representing over 20% of both the world spend and
the number of revenue passenger kms (RPK)
From AOCTF to ACMG
In order to better reflect the mission and objectives of IATA’s cost management initiative, in the past several years known as Airline Operational Cost Task Force (AOCTF), the name has been changed to Airline Cost Management Group (ACMG) and the terms of reference expanded.
Amidst the biggest yearly membership growth so far (from 30 to 55 airlines) our Steering Committee decided to take a broader look on the airline costs and add even more value to participating airlines.
The Airline Cost Management Group strives to further increase memberships, provide annual benchmarking reports on strategic and operational KPIs in cost management area, and organize yearly Airline Cost Conference gathering top industry experts.

Airline Cost Management Group (ACMG) Enhanced Report - Sep 2014
5
1. INTRODUCTION
This publication builds upon the FY2012 Report which has already been tailored to improve the value to ACMG member airlines with
new segments on airline staff and financial performance. FY2013 report clearly defines Strategic and Operational Key Performance
Indicators (KPIs) and adds additional bits and pieces, largely an influence of recently formed ACMG Steering Committee (SC).
Keeping SC’s suggestions in mind the ACMG team, holding expertise in operational costs area, analyzed thoroughly the data sub-
mitted by 55 airlines.
This Enhanced version of the ACMG Report is following a very successful Airline Cost Conference in Geneva, where many partici-
pating airlines gathered to discuss the benchmarking results (on an industry-wide basis as individual data is confidential) and latest
trends in cost management area. Their feedback as well as Special focus on impact of Fuel Hedging and Exchange rates fluctua-
tions are included.
The report examines airline costs for 2013. More precisely, it consolidates and analyzes ACMG airlines’ operational data, cost struc-
tures, and unit costs.
It starts with an overview of the participating airlines and continues with an insight into operational cost structure.
Then it focuses on two major groups of KPIs; Strategic Key Performance Indicators and Operational Key Performance Indicators.
Strategic KPIs, usually of much interest to senior level management, comprise key statistical and financial figures. Benchmarking on
financial performance is also provided before the section ends with yearly trends analysis for many recurrent airlines; a priceless
insight into real savings of devoted ACMG members.
Section 5 examines main areas of Operational Key Performance Indicators; namely fuel cost and efficiency, staff productivity, and
employment costs.
In the last part, the report looks into Top 12 reported aircraft types and provides operational and cost data for each type. At the end,
the two most popular aircraft families were selected (A320 and B737NG) and analyzed in greater detail, offering valuable bench-
marking on its use by different airlines.
One should carefully look into the results of our analysis as main findings are highlighted in hopes to aid towards more efficient cost
management. Tackling airline costs in a prudent manner should consequently improve airlines’ bottom lines, the area where air line
industry has been struggling.
About Airline Cost Management Group (ACMG)
IATA is leading an initiative to develop and expand the ACMG (formerly known as the AOCTF) - a group of airlines focusing on
matters concerning airline costs and measures to optimize them. ACMG’s main task is to undertake annual collections of detailed
airline cost data for major cost areas, including flight, maintenance, ground, and system, broken down by aircraft type when applica-
ble. As the final delivery of ACMG data collection, this annual Report provides ACMG member airlines access to a key source of
data, unavailable elsewhere, that can be used to benchmark carriers against their peers at a global level.
Throughout past few years the number of ACMG member airlines increased significantly, ensuring greater data diversity and sup-porting more accurate or representative benchmark information. Last year, 30 ACMG airlines reported $87.4B expenditures, which represented more than 13% of world spend and this year record high 55 ACMG airlines reported $139.7B expenditures, which represents more than 20% of world spend! One third of them rank among Top 50 airlines by financial results! (IATA WATS 2013)
The recent successes of ACMG are undoubtedly related to the formation of its Steering Committee, which has been excellently
operating under the guidance of Chairman Richard W. Creagh (UIA). Nevertheless, he concluded his 2-year mandate during the
Airline Cost Conference and was pleased to pass the torch to his Vice-Chairman Josua du Plessis (SAA).
Whereas ACMG is a unique opportunity for airlines to exchange cost related industry experience, relevant trend information, new
developments, and best practices, participating in the ACMG Steering Committee is an additional opportunity to network with cost
management counterparts from all over the world.
Last but not least, IATA is fully aware of airline concerns regarding the confidentiality of such proprietary and competitive infor-
mation. Maintaining the confidentiality of all data is guaranteed. All of the data submitted to IATA is de-identified (each airline has
been arbitrarily attributed a two-letter code), and only published as industry or airline group aggregate information. Correspondingly,
the report is exclusively available to the airlines which participated in the data collection.
Notes:
Airline codes used in this report were carefully created to hide the identity of the participating airlines.
Unless otherwise specified or illustrated all 55 airlines are included in the analysis. When the number of included airlines is clearly seen from the chart, no addition-
al explanation follows. When any ratio was calculated, only the data that include all the involved items was used; consequently the number of airlines varies.
Airline Cost Management Group (ACMG) Enhanced Report - Sep 2014
6
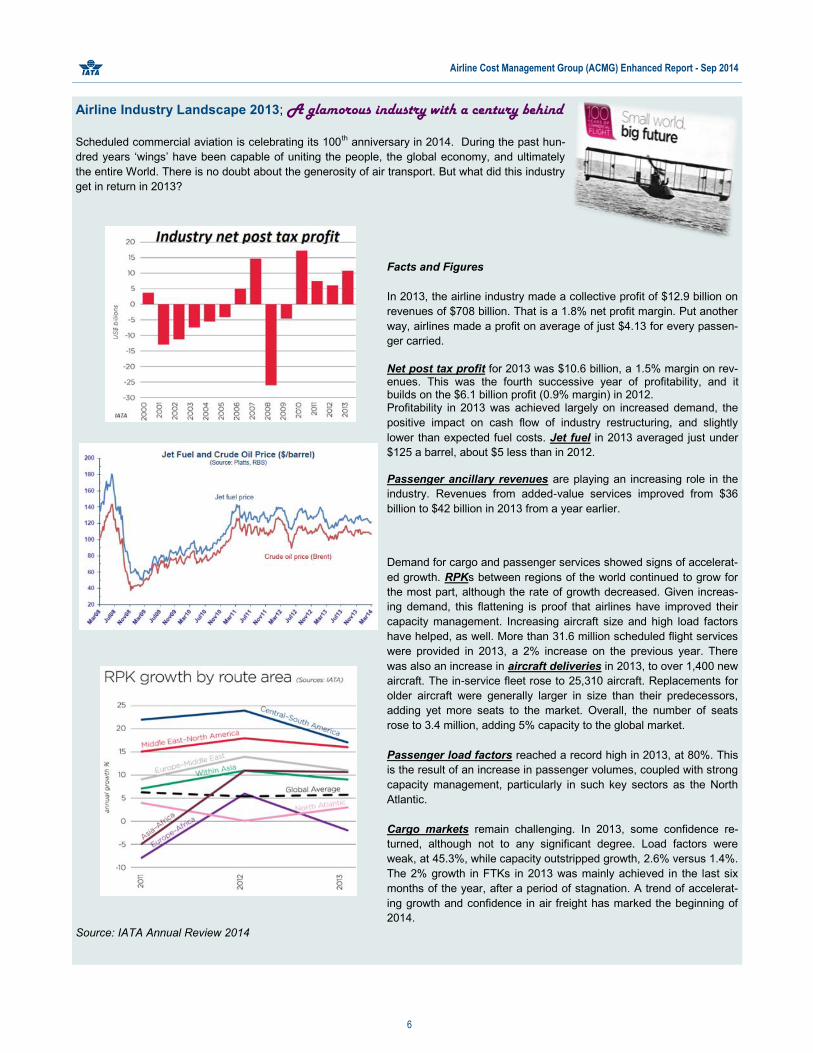
Airline Industry Landscape 2013; A glamorous industry with a century behind
Scheduled commercial aviation is celebrating its 100th anniversary in 2014. During the past hun-
dred years ‘wings’ have been capable of uniting the people, the global economy, and ultimately
the entire World. There is no doubt about the generosity of air transport. But what did this industry
get in return in 2013?
Facts and Figures
In 2013, the airline industry made a collective profit of $12.9 billion on
revenues of $708 billion. That is a 1.8% net profit margin. Put another
way, airlines made a profit on average of just $4.13 for every passen-
ger carried.
Net post tax profit for 2013 was $10.6 billion, a 1.5% margin on rev-enues. This was the fourth successive year of profitability, and it builds on the $6.1 billion profit (0.9% margin) in 2012. Profitability in 2013 was achieved largely on increased demand, the
positive impact on cash flow of industry restructuring, and slightly
lower than expected fuel costs. Jet fuel in 2013 averaged just under
$125 a barrel, about $5 less than in 2012.
Passenger ancillary revenues are playing an increasing role in the
industry. Revenues from added-value services improved from $36
billion to $42 billion in 2013 from a year earlier.
Demand for cargo and passenger services showed signs of accelerat-
ed growth. RPKs between regions of the world continued to grow for
the most part, although the rate of growth decreased. Given increas-
ing demand, this flattening is proof that airlines have improved their
capacity management. Increasing aircraft size and high load factors
have helped, as well. More than 31.6 million scheduled flight services
were provided in 2013, a 2% increase on the previous year. There
was also an increase in aircraft deliveries in 2013, to over 1,400 new
aircraft. The in-service fleet rose to 25,310 aircraft. Replacements for
older aircraft were generally larger in size than their predecessors,
adding yet more seats to the market. Overall, the number of seats
rose to 3.4 million, adding 5% capacity to the global market.
Passenger load factors reached a record high in 2013, at 80%. This
is the result of an increase in passenger volumes, coupled with strong
capacity management, particularly in such key sectors as the North
Atlantic.
Cargo markets remain challenging. In 2013, some confidence re-
turned, although not to any significant degree. Load factors were
weak, at 45.3%, while capacity outstripped growth, 2.6% versus 1.4%.
The 2% growth in FTKs in 2013 was mainly achieved in the last six
months of the year, after a period of stagnation. A trend of accelerat-
ing growth and confidence in air freight has marked the beginning of
2014.
Source: IATA Annual Review 2014
Airline Cost Management Group (ACMG) Enhanced Report - Sep 2014
7
2.1. Fleet Counts
Below are the aircraft count snapshots based on all 55 airlines. On the following pages one can obtain more information about the
fleet composition and size, as well as its age.
2. OVERVIEW of the ACMG AIRLINES
A total of 55 airlines from all major regions with 585 million passengers carried submitted data for 2013, which is a significant in-crease from the year before. One third of them rank among Top 50 airlines by financial results! (IATA WATS 2013)
Although participation is confidential, we can reveal that Star Alliance is heavily represented in this study with more than half of its member airlines reporting their data to ACMG.
Consequently, since so many airlines are new in ACMG, our analysis is largely focused on year 2013.
Nevertheless, 15 dedicated airlines consistently submitting their data over past many years were “rewarded” with the trends analysis
covering years 2009/10/11/12/13. As an incentive to airlines to consistently provide data we also performed trends analysis covering
years 2012 and 2013 with 23 recurrent airlines included.
Last but not least, although most airlines have submitted complete data, in particular cases, airlines which have not provided com-
plete data in relevant category were excluded from the sample used for that particular category analysis.
Fully available only to the Airline Cost Man-
agement Group (ACMG) member airlines.
Please contact us on [email protected] to
find out how you can get involved free of
charge!
Fully available only to the Airline Cost Man-
agement Group (ACMG) member airlines.
Please contact us on [email protected] to
find out how you can get involved free of
charge!
Fully available only to the Airline Cost Man-
agement Group (ACMG) member airlines.
Please contact us on [email protected] to
find out how you can get involved free of
charge!
Fully available only to the Airline Cost Man-
agement Group (ACMG) member airlines.
Please contact us on [email protected] to
find out how you can get involved free of
charge!

Airline Cost Management Group (ACMG) Enhanced Report - Sep 2014
8
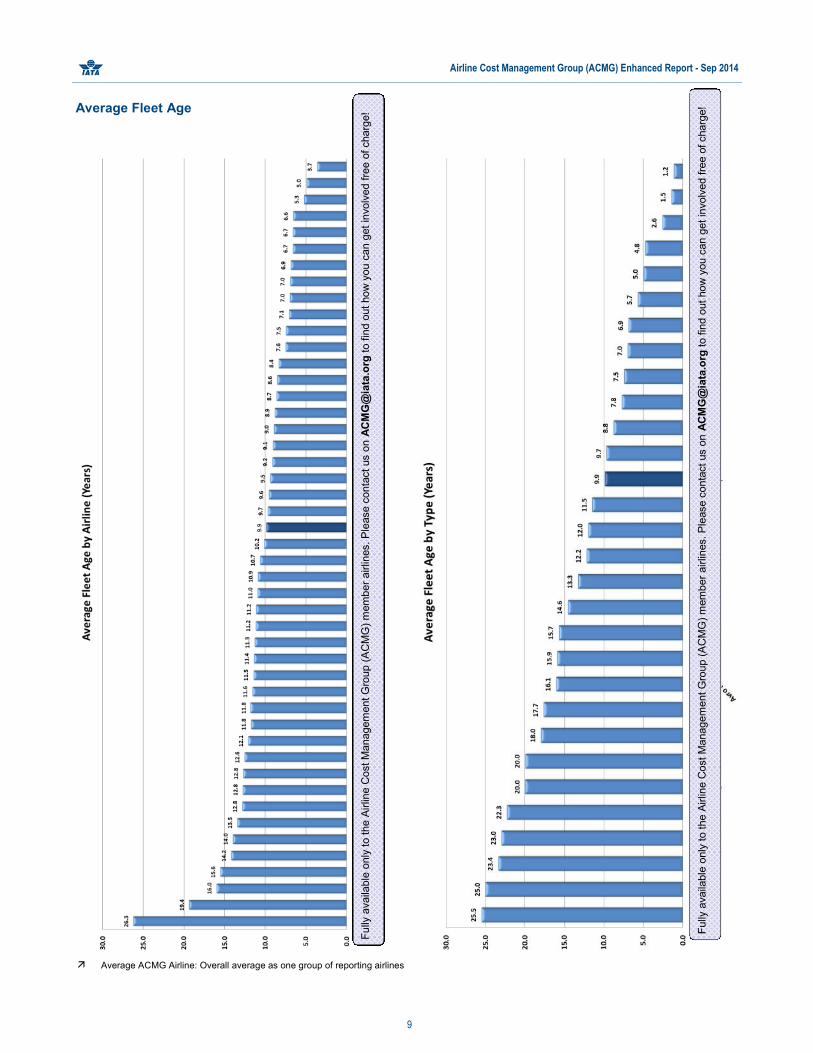
Parked aircraft represented roughly 2.5% of total fleet. Although not clearly seen from the diagrams, the introduction of new and
more fuel efficient aircraft while retiring old fleets continued in 2013. The efficiency implications of modernizing the fleets are pre-
sented throughout this Report. The financial implications are most clearly visible in Section 4.2 - Yearly Trends Analysis.
Top 12 active aircraft types accounted for 90% of the total active fleet. They are thoroughly analyzed in Section 7 - Aircraft Type
Analysis, with the exception of B717, which was operated by only one reporting airline. Consequently, we included A380 in the
abovementioned analysis.
Participating Airlines Fleet Size Fleet ≤ 10 10 < Fleet ≤ 30 30 < Fleet ≤ 100 Fleet > 100 Total
Europe 7 10 7 3 27
Americas 1 1 3 5
Asia Pacific 3 2 1 5 11
Middle East and North Africa 2 4 1 7
Africa 2 3 5
Total 12 15 16 12 55
Airline Cost Management Group (ACMG) Enhanced Report - Sep 2014
9
Average Fleet Age
Average ACMG Airline: Overall average as one group of reporting airlines
Fu
lly a
vaila
ble
only
to the A
irlin
e C
ost M
anagem
ent G
roup (
AC
MG
) m
em
ber
airlin
es. P
lease c
onta
ct us o
n A
CM
G@
iata
.org
to fin
d o
ut
how
you c
an g
et
involv
ed f
ree o
f charg
e!
Fu
lly a
vaila
ble
only
to the A
irlin
e C
ost M
anagem
ent G
roup (
AC
MG
) m
em
ber
airlin
es. P
lease c
onta
ct us o
n A
CM
G@
iata
.org
to fin
d o
ut
how
you c
an g
et
involv
ed f
ree o
f charg
e!

Airline Cost Management Group (ACMG) Enhanced Report - Sep 2014
10
2.2. Load Factors
Fu
lly a
vaila
ble
only
to the A
irlin
e C
ost M
anagem
ent G
roup (
AC
MG
) m
em
ber
airlin
es. P
lease c
onta
ct us o
n A
CM
G@
iata
.org
to fin
d o
ut
how
you c
an g
et
involv
ed f
ree o
f charg
e!
Fu
lly a
vaila
ble
only
to the A
irlin
e C
ost M
anagem
ent G
roup (
AC
MG
) m
em
ber
airlin
es. P
lease c
onta
ct us o
n A
CM
G@
iata
.org
to fin
d o
ut
how
you c
an g
et
involv
ed f
ree o
f charg
e!

Airline Cost Management Group (ACMG) Enhanced Report - Sep 2014
11
2.3. Average Stage Length
The below diagram is a clear indicator of the diversity of participating airlines. Whereas this Report focuses on a group as a whole,
specialized reports, either focusing on a region, similar fleet size, or similar stage length, will be available upon request. Please
check the last page for more information on this newest and utmost valuable feature.
Fu
lly a
vaila
ble
only
to the A
irlin
e C
ost M
anagem
ent G
roup (
AC
MG
) m
em
ber
airlin
es. P
lease c
onta
ct us o
n A
CM
G@
iata
.org
to fin
d o
ut
how
you c
an g
et
involv
ed f
ree o
f charg
e!

Airline Cost Management Group (ACMG) Enhanced Report - Sep 2014
12
2.4. Cargo vs Pax Operators
In order to characterize the nature of airlines’ main operations (Cargo vs Pax airlines), a cluster analysis approach based on RTK-
Freight/RTK parameter has been used.
The airlines were clustered into three classes which have been identified by Lorenzo Castelli, Walter Ukovich in their study Charac-
terizing cargo airlines in Europe: a cluster analysis approach.
Class 1 includes airlines essentially without cargo traffic, class 2 carriers devoted to passenger traffic, but a significant cargo activity,
and class 3 airlines mostly devoted to cargo traffic.
It clearly shows the majority of the ACMG airlines are devoted to passenger operations, thus ASK and RPK unit measures are very
appropriate when comparing reporting airlines. Nevertheless, as there are also some large airlines partially devoted to cargo activity,
one might look into ATK and RTK unit measures for a thorough comparison among the reporting airlines. The reason is that passen-
gers are included into tonne kilometers units through their average weight (normally 90-100kg per pax) whereas cargo is not includ-
ed into passenger kilometers units.
IndexClass 1 - Airlines essentially
without cargo traffic
Class 2- Carriers devoted to passenger
traffic, but a significant cargo activity
Class 3 - Airlines mostly
devoted to cargo traffic
RTK-Freight/RTK ≤ 0,155 more than 0,155 and less than 0,578 > 0,578
Class 2- Carriers devoted to passenger
traffic, but a significant cargo activity
Class 3 - Airlines mostly
devoted to cargo traffic
EE GG CM DD
FA GZ PP
IA MC ID
JJ 3T N2
LL QQ CB
MB RR JS
RP KK MM
SS AS BL
UL TT 9B
Z1 KV JR
Z5 3F 8T
HH JU 77
NN CC TH
2K TX TF
GC FF WW
X6 EY RE
KT U2
JA BB
C3 AG
16 airlines representing 1 airline representing
40% of total ATK 7% of total ATK
37% of total ASK non-significant ASK
Class 1 - Airlines essentially without cargo traffic
38 airlines representing
53% of total ATK
63% of total ASK
Fully available only to the Airline Cost Management Group (ACMG) member airlines.
Please contact us on [email protected] to find out how you can get involved free of charge!

Airline Cost Management Group (ACMG) Enhanced Report - Sep 2014
13
2.5. Airline Staff
This year the ACMG survey encompassed even more detailed employment data with a separate reporting on flight deck crew and
cabin crew block hours. 50 ACMG airlines reported a total of more than 300,000 employees in 7 different staff categories, along with
their total salaries. This consequently allows us to offer a very beneficial insight into the employment cost structure in Section 5 -
Operational KPIs. Moreover, staff productivity, as well as employment of flight deck crew and cabin crew members are also exam-
ined in that section.
FOR MORE INFORMATION ON ACMG
Contact us: [email protected]
Visit our website: www.iata.org/ACMG
Airline Cost Management Group (ACMG) Enhanced Report - Sep 2014
14
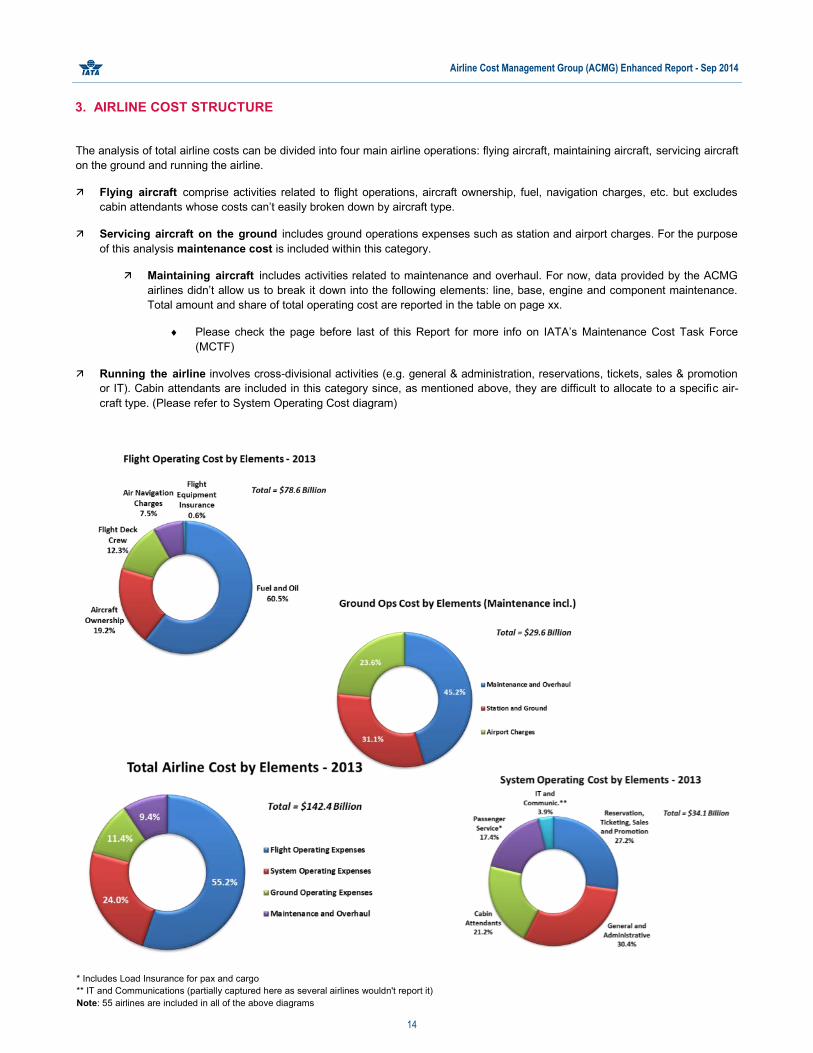
The analysis of total airline costs can be divided into four main airline operations: flying aircraft, maintaining aircraft, servicing aircraft
on the ground and running the airline.
Flying aircraft comprise activities related to flight operations, aircraft ownership, fuel, navigation charges, etc. but excludes
cabin attendants whose costs can’t easily broken down by aircraft type.
Servicing aircraft on the ground includes ground operations expenses such as station and airport charges. For the purpose
of this analysis maintenance cost is included within this category.
Maintaining aircraft includes activities related to maintenance and overhaul. For now, data provided by the ACMG
airlines didn’t allow us to break it down into the following elements: line, base, engine and component maintenance.
Total amount and share of total operating cost are reported in the table on page xx.
Please check the page before last of this Report for more info on IATA’s Maintenance Cost Task Force
(MCTF)
Running the airline involves cross-divisional activities (e.g. general & administration, reservations, tickets, sales & promotion
or IT). Cabin attendants are included in this category since, as mentioned above, they are difficult to allocate to a specific air-
craft type. (Please refer to System Operating Cost diagram)
* Includes Load Insurance for pax and cargo
** IT and Communications (partially captured here as several airlines wouldn't report it)
Note: 55 airlines are included in all of the above diagrams
3. AIRLINE COST STRUCTURE

Airline Cost Management Group (ACMG) Enhanced Report - Sep 2014
15
Figures from the above table are displayed graphically in the diagram below. Not surprisingly, fuel and oil represented the largest
chunk of airline cost by far. Please mind that this cost structure represents more than 20% of the industry (55 ACMG airlines).
*Includes Load Insurance for pax and cargo
**Flight Equipment Insurance plus IT and Communications (partially captured here as several airlines wouldn't report it)
55 Participating Airlines Total $ US Cents/RPK US Cents/ASK US Cents/RTK US Cents/ATK $/FH $/pax
Fuel and Oil $47.6 Bil 3.78 2.94 30.89 20.65 4,022 81.3
Maintenance and Overhaul $13.4 Bil 1.07 0.83 8.70 5.82 1,133 22.9
General and Administrative $10.4 Bil 0.83 0.64 6.75 4.51 878 17.8
Flight Deck Crew $9.7 Bil 0.77 0.60 6.30 4.21 820 16.6
Reservation, Ticketing, Sales and Promotion $9.3 Bil 0.74 0.57 6.02 4.02 784 15.9
Station and Ground $9.2 Bil 0.73 0.57 5.99 4.01 780 15.8
Aircraft Ownership $15.1 Bil 1.20 0.93 9.79 6.55 1,275 25.8
Airport Charges $7.0 Bil 0.56 0.43 4.55 3.04 592 12.0
Cabin Attendants $7.2 Bil 0.57 0.45 4.69 3.14 611 12.4
Passenger Service* $5.9 Bil 0.47 0.37 3.86 2.58 503 10.2
Air Navigation Charges $5.9 Bil 0.47 0.36 3.82 2.55 497 10.1
Other** $1.7 Bil 0.14 0.11 1.13 0.76 148 3.0
Total $142.4 Bil 11.32 8.80 92.49 61.83 12,043 243.5
*Includes Load Insurance for pax and cargo
**Flight Equipment Insurance plus IT and Communications (partially captured here as several airlines wouldn't report it)
The following table shows total airline cost structure comprised of different cost groups. Moreover, several unit costs are offered for
more flexible benchmarking self-evaluation.
Fully available only to the Airline Cost Management Group (ACMG) member airlines.
Please contact us on [email protected] to find out how you can get involved free of
charge!

Airline Cost Management Group (ACMG) Enhanced Report - Sep 2014
16
4. STRATEGIC KEY PERFORMANCE INDICATORS
Strategic KPIs, usually of much interest to senior level management, comprise key statistical and financial figures. Benchmarking on
financial performance is also provided before the section ends with yearly trends analysis for many recurrent airlines; a priceless
insight into real savings of devoted ACMG members.
Strategic KPIs
ACMG Statistical Snapshot
Note: Expense and cost are very much related in this study; expense is an accounting term for a cost of resources used up or consumed while a company is
performing its main revenue-generating activities
Strategic KPIs* ACMG Airlines
Total Operating Expenses/FH (USD) $12,043Total Operating Expenses/ASK (US Cents) 8.80Total Operating Expenses/ATK (US Cents) 61.83Fuel Share of Total Ops. Expenses 33.4%Total Ops Expenses without Fuel/ASK (US Cents) 5.86Yield (Op. Revenue/RPK in US Cents) 11.62Operating Revenue/ASK (US Cents) 9.04Operating Profit (% margin) 2.59%Passenger Load Factor (PLF) 77.7%Weight Load Factor (WLF) 66.8%Daily Utilization (Hours) 9.48Average Fleet Age (Years) 9.88
* Based on 55 reporting airlines
Statistical Snapshot* ACMG Airlines Industry total** ACMG share
Revenue Passenger Km (RPK) 1,257.9 Bil 5,839.4 Bil 21.5%Available Seat Km (ASK) 1,617.9 Bil 7,327.0 Bil 22.1%Revenue Tonne Km (RTK) 154.0 Bil 738.3 Bil 20.9%Available Tonne Km (ATK) 230.3 Bil 1,097.5 Bil 21.0%Passengers Carried 584.8 Mil 3.1 Bil 18.7%Total Flight Hours 11.8 Mil
Total Flight Cycles 5.729 MilTotal Operating Expenses (USD) 142.4 Bil 686.0 Bil 20.8%
Total Operating Revenues (USD) 146.199 Bil 708.000 Bil 20.6%
* Based on 55 reporting airlines
** According to IATA WATS FY2013

Airline Cost Management Group (ACMG) Enhanced Report - Sep 2014
17
4.1. Financial Performance
The ACMG airlines* are profitable as a whole; with an overall average operating margin of 2.6%. However, 24 airlines in the group
still incurred losses.
From the below bubble chart, it is clear that the sample of airlines used in this compact represents a wide range of different cost
basis as well as revenue levels. It can be seen that the low cost carriers are not necessarily profitable and higher cost loss making.
The average of the RASK for each 0.5c interval value of CASK shows for the cohort two clear areas that are profitable (CASK 7.5
US cents and 10 US cents). The percentage profit margin though seems to be higher for the lower cost option.
Revenue size indicated against RASK and CASK
On the following page respective airlines’ revenues and costs per unit (both ASK and ATK) are graphically displayed. Average
ACMG airline** earned 8.9 US cents/ASK and expensed 8.7 US cents/ASK.
* 52 airlines provided validated revenue and expenditure data
** Average ACMG Airline: Overall average as one group of 52 included airlines

Airline Cost Management Group (ACMG) Enhanced Report - Sep 2014
18
Financial Performance Industry Benchmarking
Fully
ava
ilable
on
ly t
o t
he A
irlin
e C
ost
Ma
na
ge
me
nt
Gro
up
(A
CM
G)
mem
ber
airlin
es.
Ple
ase
co
nta
ct
us o
n A
CM
G@
iata
.org
to
fin
d o
ut
how
yo
u c
an
get
involv
ed f
ree o
f ch
arg
e!
Fully
ava
ilable
on
ly t
o t
he A
irlin
e C
ost
Ma
na
ge
me
nt
Gro
up
(A
CM
G)
mem
ber
airlin
es.
Ple
ase
co
nta
ct
us o
n A
CM
G@
iata
.org
to
fin
d o
ut
how
yo
u c
an
get
involv
ed f
ree o
f ch
arg
e!

Airline Cost Management Group (ACMG) Enhanced Report - Sep 2014
19
Special focus on impact of exchange rates fluctuations
One of our identified critical parameters affecting airline operational cost, which is very difficult to account for, is currency exchange
fluctuations. Given that majority of costs are tied to US dollars and revenues come in various currencies, respective currency ex-
change rates can significantly affect the bottom line. In the same vein, it can affect benchmarking, although less so since this study
is predominantly benchmarking costs.
For the purpose of this report, 35 airlines have reported their gains or losses obtained from foreign exchange transactions, including
foreign exchange hedge. Below diagram illustrates:
absolute ($) values of foreign exchange financial impact, and
relative (%) impact on airlines’ bottom lines; a share in respective airline’s profit or loss.
19 airlines have seen their bottom lines improving due to favorable exchange rates, while 16 airlines were not so fortunate and lost
significant amount of money. Collectively, 35 airlines lost 375 million dollars.
Successful currency management and exchange rate risk mitigation could easily add 10-20 % to the bottom line. On the opposite
side, lack of it could erode the profits or increase the losses by as much as 50 %!
In conclusion, exchange rate risks are definitely worth airlines’ close attention as they can, in this razor-thin profit margin industry,
mean the difference between a net profit or loss.
Fully available only to the Airline Cost Management Group (ACMG) member airlines.
Please contact us on [email protected] to find out how you can get involved free of charge!
Airline Cost Management Group (ACMG) Enhanced Report - Sep 2014
20
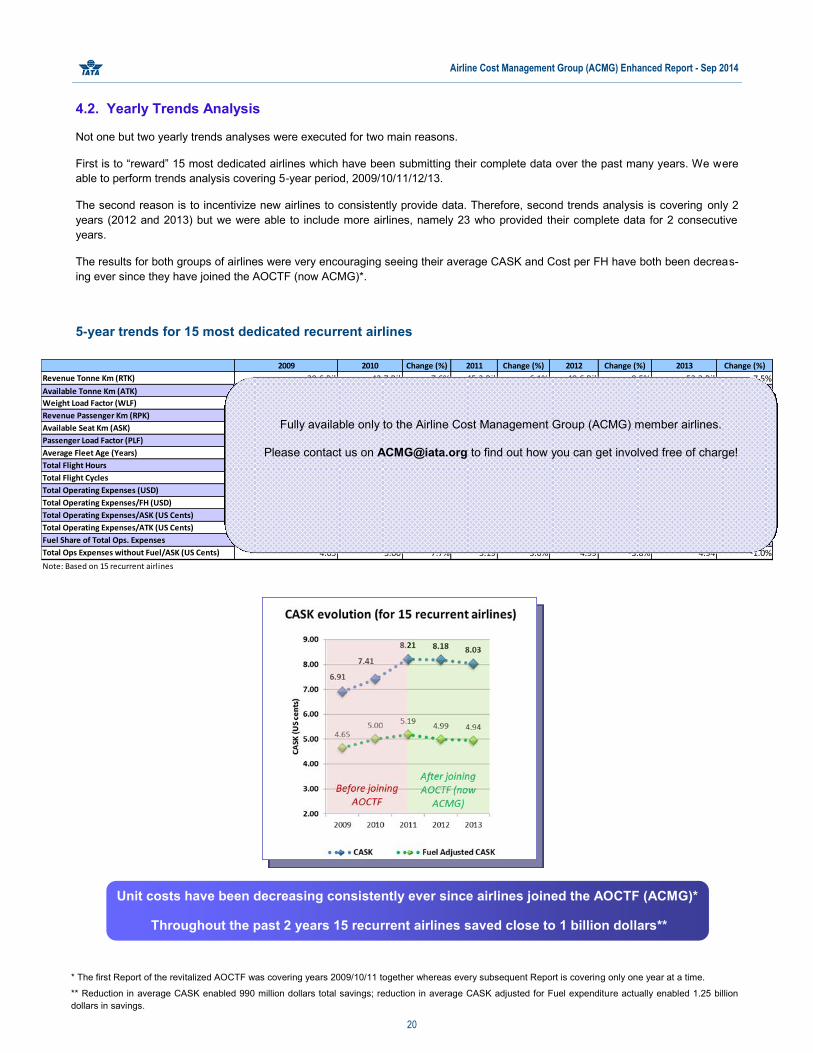
4.2. Yearly Trends Analysis
Not one but two yearly trends analyses were executed for two main reasons.
First is to “reward” 15 most dedicated airlines which have been submitting their complete data over the past many years. We were
able to perform trends analysis covering 5-year period, 2009/10/11/12/13.
The second reason is to incentivize new airlines to consistently provide data. Therefore, second trends analysis is covering only 2
years (2012 and 2013) but we were able to include more airlines, namely 23 who provided their complete data for 2 consecutive
years.
The results for both groups of airlines were very encouraging seeing their average CASK and Cost per FH have both been decreas-
ing ever since they have joined the AOCTF (now ACMG)*.
Unit costs have been decreasing consistently ever since airlines joined the AOCTF (ACMG)*
Throughout the past 2 years 15 recurrent airlines saved close to 1 billion dollars**
* The first Report of the revitalized AOCTF was covering years 2009/10/11 together whereas every subsequent Report is covering only one year at a time.
** Reduction in average CASK enabled 990 million dollars total savings; reduction in average CASK adjusted for Fuel expenditure actually enabled 1.25 billion
dollars in savings.
5-year trends for 15 most dedicated recurrent airlines
2009 2010 Change (%) 2011 Change (%) 2012 Change (%) 2013 Change (%)
Revenue Tonne Km (RTK) 39.6 Bil 42.7 Bil 7.6% 45.3 Bil 6.1% 49.6 Bil 9.5% 53.3 Bil 7.5%
Available Tonne Km (ATK) 61.4 Bil 63.9 Bil 4.1% 69.7 Bil 9.0% 75.3 Bil 8.1% 82.0 Bil 8.9%
Weight Load Factor (WLF) 64.6% 66.8% +2.2 pt 65.0% -1.8 pt 65.9% +0.9 pts 65.0% -0.9 ptsRevenue Passenger Km (RPK) 312.4 Bil 327.1 Bil 4.7% 349.7 Bil 6.9% 380.6 Bil 8.8% 424.6 Bil 11.6%
Available Seat Km (ASK) 428.6 Bil 434.2 Bil 1.3% 471.7 Bil 8.6% 500.4 Bil 6.1% 552.0 Bil 10.3%
Passenger Load Factor (PLF) 72.9% 75.3% +2.4 pts 74.1% -0.8 pts 76.1% +2.0 pts 76.9% +0.8 pts
Average Fleet Age (Years) 9.08 8.88 -2.2% 8.85 -0.4% 8.31 -6.1% 7.76 -6.6%Total Flight Hours 2.449 Mil 2.554 Mil 4.3% 2.757 Mil 8.0% 3.0 Mil 7.8% 3.3 Mil 10.6%Total Flight Cycles 914.082 K 945.648 K 3.5% 1.007 Mil 6.5% 1.1 Mil 9.9% 1.2 Mil 11.6%
Total Operating Expenses (USD) $29.6 Bil $32.2 Bil 8.6% $38.7 Bil 20.4% $40.9 Bil 5.7% $44.3 Bil 8.3%
Total Operating Expenses/FH (USD) $12,098 $12,597 4.1% $14,052 11.5% $13,772 -2.0% $13,477 -2.1%
Total Operating Expenses/ASK (US Cents) 6.91 7.41 7.2% 8.21 10.9% 8.18 -0.4% 8.03 -1.9%Total Operating Expenses/ATK (US Cents) 48.28 50.35 4.3% 55.61 10.5% 54.39 -2.2%
Fuel Share of Total Ops. Expenses 32.7% 32.4% -0.3 pts 36.9% +4.5 pts 39.0% +2.1 pts 38.5% -0.5 pts
Total Ops Expenses without Fuel/ASK (US Cents) 4.65 5.00 7.7% 5.19 3.6% 4.99 -3.8% 4.94 -1.0%
Note: Based on 15 recurrent airlines
Fully available only to the Airline Cost Management Group (ACMG) member airlines.
Please contact us on [email protected] to find out how you can get involved free of charge!
Airline Cost Management Group (ACMG) Enhanced Report - Sep 2014
21
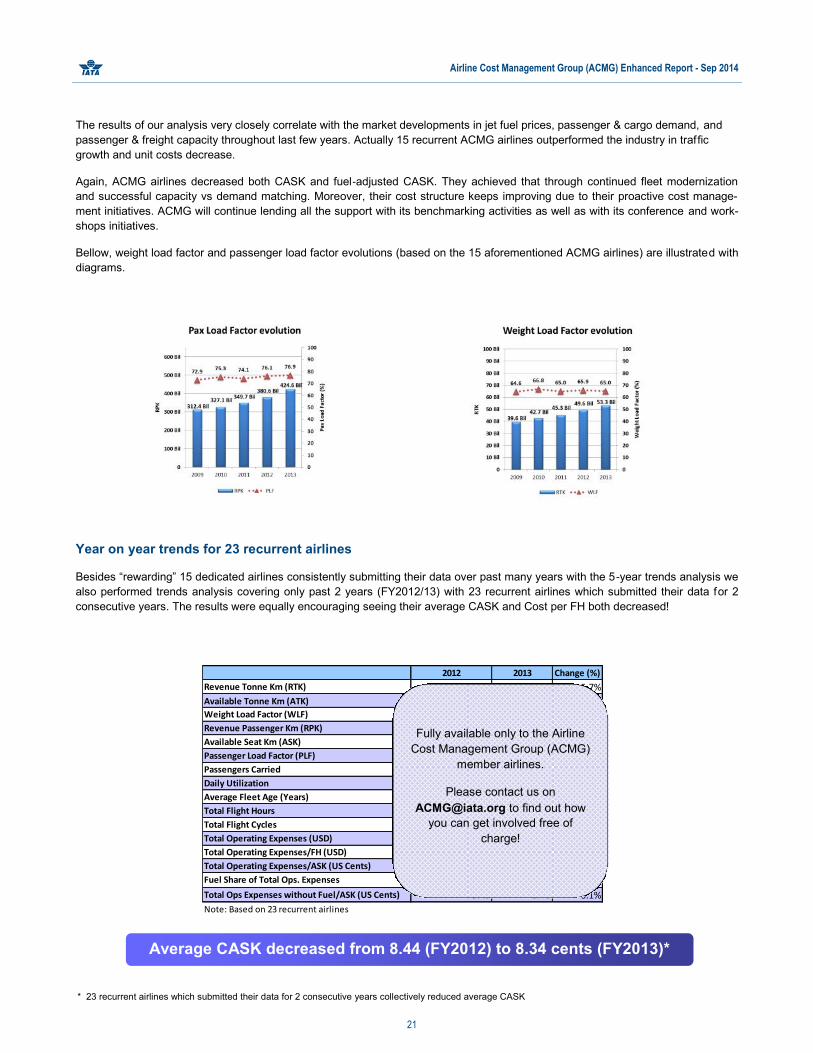
The results of our analysis very closely correlate with the market developments in jet fuel prices, passenger & cargo demand, and
passenger & freight capacity throughout last few years. Actually 15 recurrent ACMG airlines outperformed the industry in traffic
growth and unit costs decrease.
Again, ACMG airlines decreased both CASK and fuel-adjusted CASK. They achieved that through continued fleet modernization
and successful capacity vs demand matching. Moreover, their cost structure keeps improving due to their proactive cost manage-
ment initiatives. ACMG will continue lending all the support with its benchmarking activities as well as with its conference and work-
shops initiatives.
Bellow, weight load factor and passenger load factor evolutions (based on the 15 aforementioned ACMG airlines) are illustrated with
diagrams.
Year on year trends for 23 recurrent airlines
Besides “rewarding” 15 dedicated airlines consistently submitting their data over past many years with the 5-year trends analysis we
also performed trends analysis covering only past 2 years (FY2012/13) with 23 recurrent airlines which submitted their data for 2
consecutive years. The results were equally encouraging seeing their average CASK and Cost per FH both decreased!
Average CASK decreased from 8.44 (FY2012) to 8.34 cents (FY2013)*
2012 2013 Change (%)
Revenue Tonne Km (RTK) 85.3 Bil 90.2 Bil 5.7%
Available Tonne Km (ATK) 131.4 Bil 139.5 Bil 6.2%Weight Load Factor (WLF) 64.9% 64.6% -0.3 pt
Revenue Passenger Km (RPK) 709.7 Bil 770.8 Bil 8.6%
Available Seat Km (ASK) 914.6 Bil 988.7 Bil 8.1%Passenger Load Factor (PLF) 77.6% 78.0% +0.4 pts
Passengers Carried 320.3 Mil 351.4 Mil 9.7%
Daily Utilization 9.43 10.35 9.7%Average Fleet Age (Years) 10.13 10.23 1.0%
Total Flight Hours 6.75 Mil 7.38 Mil 9.3%
Total Flight Cycles 3.06 Mil 3.48 Mil 13.5%Total Operating Expenses (USD) $77.2 Bil $82.4 Bil 6.8%
Total Operating Expenses/FH (USD) $11,437 $11,168 -2.3%
Total Operating Expenses/ASK (US Cents) 8.44 8.34 -1.2%Fuel Share of Total Ops. Expenses 35.0% 34.3% -0.7 pts
Total Ops Expenses without Fuel/ASK (US Cents) 5.49 5.48 -0.1%
Note: Based on 23 recurrent airlines
* 23 recurrent airlines which submitted their data for 2 consecutive years collectively reduced average CASK
Fully available only to the Airline
Cost Management Group (ACMG)
member airlines.
Please contact us on
[email protected] to find out how
you can get involved free of
charge!

Airline Cost Management Group (ACMG) Enhanced Report - Sep 2014
22
5. OPERATIONAL KEY PERFORMANCE INDICATORS
Operational Key Performance Indicators examine the following areas:
Fuel cost and efficiency
Staff productivity
Employment costs.
5.1. Fuel Cost and Efficiency
Fuel cost consistently remains the biggest concern of airlines which unfortunately have little control over its price. The only efficiency
they can gain is to decrease the fuel consumption; of course not by less flying but with more efficient fuel management, fleet and
routes!
On the next pages, the ACMG airlines are benchmarked on the following fuel indicators:
Fuel and CO2 burned per RTK
Fuel burned per 100 passenger kms
The 2 diagrams clearly show some airlines are more fuel efficient than others; besides different aircraft types they operate
there is a number of factors to look into within the operations of every respective airline.
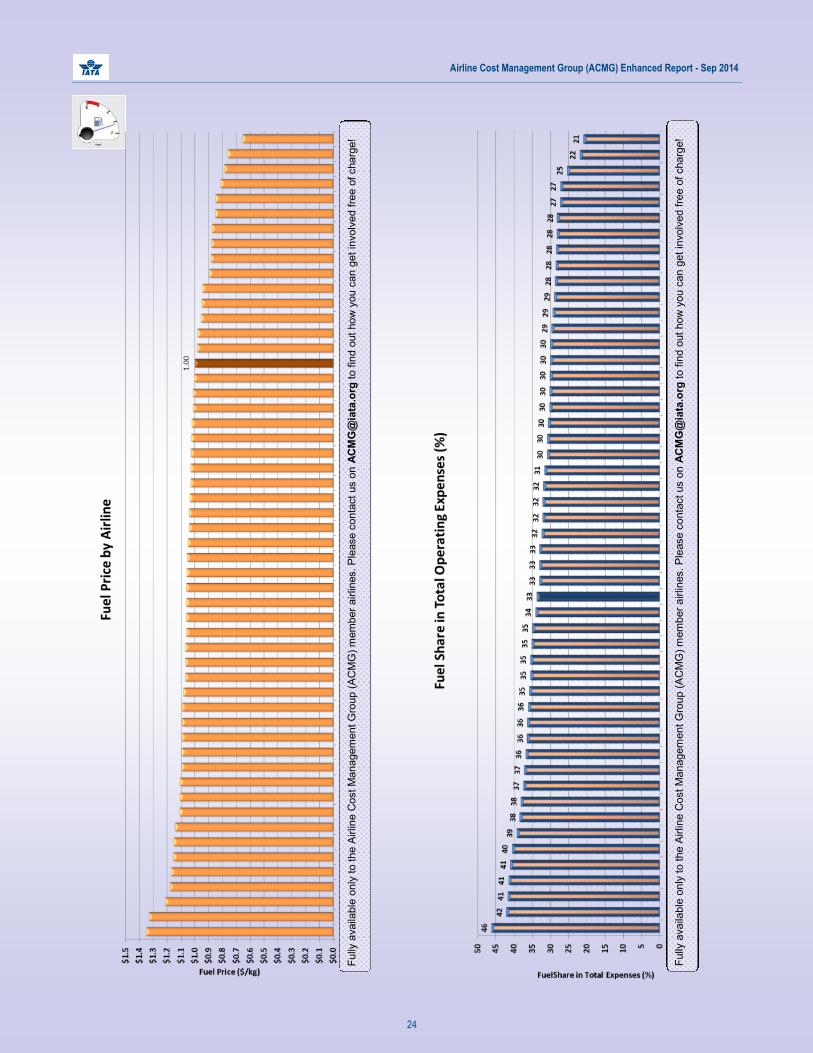
Average Fuel price
Average ACMG Airline paid $1.00 per kg of jet fuel. Again, the scope of this analysis doesn’t permit looking into more de-
tails (such as currency exchange rates effect, fuel purchasing strategy, geographical location, etc.) but the diagram should
be a good inspiration for some airlines to further look into their fuel supply chain.
Fuel share in total operating expenses
The proportion of fuel and oil expenses in total operating expenses ranges between 21% and 46%, with the average of
33.4%.

Airline Cost Management Group (ACMG) Enhanced Report - Sep 2014
23
Fu
lly a
vaila
ble
only
to the A
irlin
e C
ost M
anagem
ent G
roup (
AC
MG
) m
em
ber
airlin
es. P
lease c
onta
ct us o
n A
CM
G@
iata
.org
to fin
d o
ut
how
you c
an g
et
involv
ed f
ree o
f charg
e!
Fu
lly a
vaila
ble
only
to the A
irlin
e C
ost M
anagem
ent G
roup (
AC
MG
) m
em
ber
airlin
es. P
lease c
onta
ct us o
n A
CM
G@
iata
.org
to fin
d o
ut
how
you c
an g
et
involv
ed f
ree o
f charg
e!
Airline Cost Management Group (ACMG) Enhanced Report - Sep 2014
24
Fu
lly a
vaila
ble
only
to the A
irlin
e C
ost M
anagem
ent G
roup (
AC
MG
) m
em
ber
airlin
es. P
lease c
onta
ct us o
n A
CM
G@
iata
.org
to fin
d o
ut
how
you c
an g
et
involv
ed f
ree o
f charg
e!
Fu
lly a
vaila
ble
only
to the A
irlin
e C
ost M
anagem
ent G
roup (
AC
MG
) m
em
ber
airlin
es. P
lease c
onta
ct us o
n A
CM
G@
iata
.org
to fin
d o
ut
how
you c
an g
et
involv
ed f
ree o
f charg
e!

Airline Cost Management Group (ACMG) Enhanced Report - Sep 2014
25
The fuel indicators graphically displayed on the previous pages are gathered in the table below.
FA 407.68 1,284.18 3.96 1.03 31.7%
Z1 327.70 1,032.25 3.28 1.02 35.1%
RE 379.84 1,196.51 5.06 0.81 40.6%
AG 303.70 956.64 3.67 1.03 29.8%
U2 285.35 898.85 3.25 1.06 37.7%
WW 302.72 953.57 3.62 1.06 40.1%
BL 376.70 1,186.62 4.32 0.79 36.0%
8T 266.70 840.10 3.73 1.01 37.0%
MB 284.93 897.54 2.81 1.35 41.3%
77 282.58 890.12 4.10 1.06 29.8%
JS 398.42 1,255.02 4.45 0.85 35.1%
CC 342.41 1,078.58 3.52 1.02 28.3%
CM 339.82 1,070.42 3.64 1.07 41.1%
CB 368.50 1,160.79 3.76 1.07 36.4%
KV 329.33 1,037.40 3.24 1.08 33.7%
9B 260.12 819.36 3.78 0.94 29.6%
TH 285.28 898.63 3.83 1.09 45.8%
TX 374.03 1,178.19 3.41 1.06 35.7%
EY 327.23 1,030.79 3.31 1.00 41.7%
MM 296.00 932.41 3.82 0.98 34.7%
3F 407.89 1,284.84 3.77 0.31 11.1%
UL 244.64 770.61 2.88 1.04 29.2%
ID 408.57 1,287.00 3.89 1.05 36.0%
RR 318.81 1,004.26 3.01 0.88 20.5%
JR 301.33 949.18 3.51 0.76 36.7%
TF 387.33 1,220.08 4.27 0.89 29.0%
FF 262.32 826.31 2.68 1.15 38.0%
MC 348.89 1,099.01 3.08 1.11 34.6%
2K 498.57 1,570.49 3.66 0.85 26.9%
GZ 343.89 1,083.27 3.23 1.01 32.6%
NN 286.86 903.62 2.82 1.06 31.7%
PP 362.53 1,141.98 3.53 1.03 35.4%
EE 356.64 1,123.42 3.19 1.04 38.9%
KK 278.47 877.17 2.72 0.88 30.2%
C3 433.76 1,366.36 3.41 1.06 30.5%
TT 595.44 1,875.63 4.95 0.66 28.1%
N2 369.09 1,162.64 3.44 1.07 26.8%
GG 431.88 1,360.42 3.20 0.95 29.6%
3T 340.36 1,072.14 3.19 1.09 31.3%
RP 235.15 740.72 2.22 1.09 29.7%
Z5 305.48 962.26 2.73 0.98 32.6%
BB 311.88 982.41 3.03 1.15 31.5%
LL 309.47 974.82 2.79 1.10 27.8%
JA 418.34 1,317.77 3.58 1.03 21.5%
KT 459.44 1,447.25 4.07 1.11 25.0%
AS 370.60 1,167.39 3.39 1.17 32.0%
JU 425.38 1,339.96 3.98 1.21 27.7%
SS 424.24 1,336.36 3.21 0.88 28.0%
GC 527.96 1,663.06 3.95 1.18 10.3%
IA 441.95 1,392.14 3.40 1.14 30.5%
HH 408.84 1,287.84 3.34 1.09 28.6%
Fule Price
($ per kg)
% of Total
Expenses
More than 1 billion
100 million to 1
billion
Up to 100 million
Airline Fuel Expense in $ Fuel burned per RTK
(grams)
CO2 per RTK
(grams)
Fuel burned per 100
passenger kms (liters)
Fully available only to the Airline Cost Management Group (ACMG) member airlines.
Please contact us on [email protected] to find out how you can get involved free of charge!
Airline Cost Management Group (ACMG) Enhanced Report - Sep 2014
26
Special focus on impact of fuel hedging
Whereas many airlines advocate fuel hedging as a proper mechanism to alleviate the impact of the jet fuel volatility there are many
who believe fuel hedging is not airlines’ core competency and rather shy away from it.
In our study, 23 airlines reported their fuel hedging financial results. Below diagram shows 16 airlines managed to decrease fuel
expenses while 7 airlines increased their fuel expenses by fuel hedging. Collectively, 23 airlines saved close to 100 million dollars.
Nevertheless, as many believe current fuel prices are unjustified one might think twice before hedging at these high price levels.
Fully available only to the Airline Cost Management Group (ACMG) member airlines.
Please contact us on [email protected] to find out how you can get involved free of charge!

Airline Cost Management Group (ACMG) Enhanced Report - Sep 2014
27
5.2 Employment Cost Structure
50 ACMG airlines reported a total of more than 300,000 employees in 7 different staff categories, along with their total salaries. This
consequently allows us to offer a very beneficial insight into the employment cost structure below.
Indeed, outsourcing practices differ significantly from airline to airline, but given the large sample we can take below diagrams as an
industry average employment cost structure.
Cabin attendants represent the largest staff group (30%), followed by administrative employees (20%). Nevertheless, the largest
chunk of salaries is paid to flight deck crew (29%), followed by cabin attendants (24%) and administrative employees (20%).

Airline Cost Management Group (ACMG) Enhanced Report - Sep 2014
28
Employment Cost (by Regions)
Examination of average employment cost, more specifically flight deck crew, cabin crew, and general & administrative compensation
cost shows the differences among regions as well as among 50 ACMG airline participants. As expected the deviations are much
bigger within cabin crew and general & administrative categories than within flight deck crew compensation.
Again, as outsourcing practices differ significantly from airline to airline, it is not appropriate to benchmark this number within the
industry. However, it is a measure that an airline may want to monitor on an annual basis.
Fully available only to the Airline Cost Management Group (ACMG) member airlines.
Please contact us on [email protected] to find out how you can get involved free of charge!
Airline Cost Management Group (ACMG) Enhanced Report - Sep 2014
29
Employment Cost - continued
Besides employment cost by regions all the reported average compensations for flight deck crew, cabin crew, and gen-
eral&administration staff are presented below.
Moreover, the ratio (by number of posts) between these types of employees are calculated on the right. Given the extremely sensi-
tive nature of these figures airlines are listed as positions sorted by flight deck crew cost.
Airline Position Flight Deck Crew Cabin Crew General and Admin #Flight Deck Crew to
#Gen & Admin
#Cabin Crew to
#Gen & Admin
#Cabin Crew to
#Flight Deck Crew
1 $38,125 $11,607 $17,496 0.62 1.24 2.01
2 $43,032 $19,217 $16,619 0.86 0.29 0.333 $44,338 $6,443 $22,791 1.10 2.04 1.86
4 $47,598 $21,496 $6,976 0.34 0.53 1.555 $58,822 $16,083 $18,524 0.30 1.20 3.94
6 $64,097 $11,438 $32,899 2.11 4.00 1.907 $64,425 $8,793 $16,503 0.33 0.78 2.37
8 $71,522 $6,844 $8,016 0.31 0.73 2.39
9 $77,156 $20,564 $19,569 0.16 0.28 1.7810 $81,297 $19,161 $21,970 0.59 0.83 1.40
11 $85,014 $15,404 $16,698 0.51 1.74 3.4212 $85,458 $57,824 $18,128 0.67 0.85 1.27
13 $86,120 $13,467 $29,227 0.46 0.99 2.1214 $88,379 $35,252 $80,700 2.30 1.70 0.74
15 $90,772 $22,587 $17,711 0.48 1.20 2.4916 $92,722 $17,541 $21,594 0.45 1.13 2.49
17 $95,450 $19,463 $22,917 0.48 0.64 1.33
18 $105,542 $15,543 $46,102 0.43 1.06 2.4719 $108,233 $17,319 $25,465 0.69 1.13 1.64
20 $109,482 $22,031 $14,761 0.18 0.47 2.5921 $111,646 $18,746 $32,242 0.98 2.12 2.17
22 $112,581 $23,042 $36,518 2.43 5.20 2.1423 $113,557 $16,664 $29,168 0.31 0.53 1.71
24 $115,360 $18,575 $44,115 0.97 1.49 1.5425 $115,464 $33,173 $27,090 0.57 1.57 2.7626 $117,346 $48,466 $46,998 1.01 0.89 0.88
27 $117,600 $47,040 $64,680 2.46 4.93 2.0028 $119,302 $40,774 $57,606 0.83 1.73 2.10
29 $122,494 $36,354 $60,200 2.44 2.57 1.0530 $124,620 $34,523 $25,063 0.60 0.75 1.26
31 $125,851 $68,912 $114,106 3.20 5.43 1.7032 $137,951 $35,887 $65,826 0.27 1.41 5.32
33 $140,769 $53,067 $111,199 0.79 0.51 0.65
34 $146,533 $50,155 $130,493 1.39 2.06 1.4835 $158,590 $30,581 $57,192 1.63 3.59 2.21
36 $160,292 $68,269 $190,360 2.16 7.09 3.2837 $162,222 $51,111 $121,053 2.37 2.37 1.00
38 $162,436 $25,438 $59,570 0.89 4.30 4.8139 $172,968 $73,214 $73,980 1.62 3.79 2.34
40 $176,066 $72,094 $66,588 1.18 2.17 1.8441 $178,020 $24,870 $44,559 0.47 1.02 2.19
42 $188,130 $43,847 $44,169 0.40 0.99 2.49
43 $188,429 $64,402 $48,012 0.97 2.62 2.7144 $196,140 $36,928 $74,723 0.66 1.51 2.28
45 $207,203 $62,183 $90,944 0.69 1.52 2.2046 $219,086 $58,400 $137,059 0.35 1.19 3.39
47 $232,259 $82,345 $90,277 1.03 2.66 2.5748 $243,052 $83,102 $95,760 0.54 1.94 3.60
49 $284,111 $92,287 $112,164 0.40 1.35 3.36
50 $297,018 $92,260 $97,814 0.94 4.17 4.44
* Sorted by flight deck crew cost
Average cost per employee type* Employee type ratio
Fully available only to the Airline Cost Management Group (ACMG) member airlines.
Please contact us on [email protected] to find out how you can get involved free of charge!
Airline Cost Management Group (ACMG) Enhanced Report - Sep 2014
30
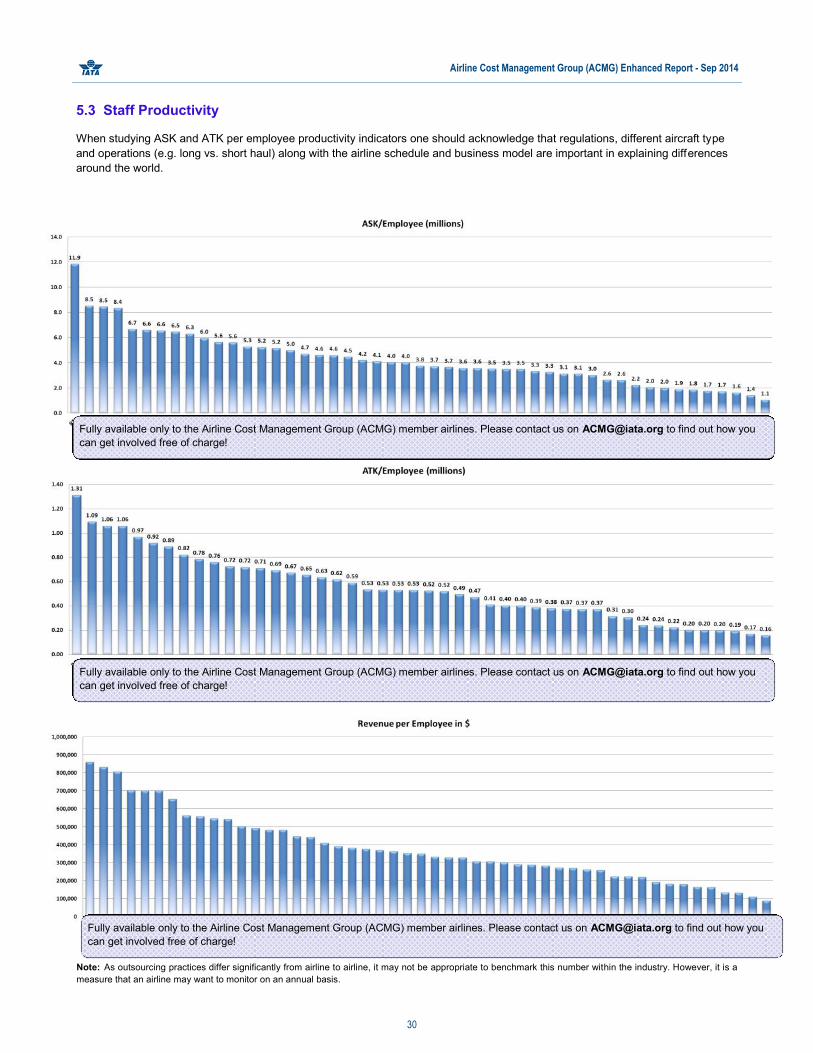
5.3 Staff Productivity
When studying ASK and ATK per employee productivity indicators one should acknowledge that regulations, different aircraft type
and operations (e.g. long vs. short haul) along with the airline schedule and business model are important in explaining differences
around the world.
Note: As outsourcing practices differ significantly from airline to airline, it may not be appropriate to benchmark this number within the industry. However, it is a
measure that an airline may want to monitor on an annual basis.
Fully available only to the Airline Cost Management Group (ACMG) member airlines. Please contact us on [email protected] to find out how you
can get involved free of charge!
Fully available only to the Airline Cost Management Group (ACMG) member airlines. Please contact us on [email protected] to find out how you
can get involved free of charge!
Fully available only to the Airline Cost Management Group (ACMG) member airlines. Please contact us on [email protected] to find out how you
can get involved free of charge!

Airline Cost Management Group (ACMG) Enhanced Report - Sep 2014
31
Flight Deck Crew and Cabin Attendants employment
Similar to the previous page, when observing the first two diagrams one should acknowledge that regulations, different aircraft type
and operations (e.g. long vs. short haul) along with the airline schedule and business model are important in explaining differences
around the world.
The third diagram, however, is directly comparing monthly use of workforce for 23 airlines that correctly provided separate f light deck
crew and cabin crew block hours.
Fully available only to the Airline Cost Management Group (ACMG) member airlines. Please contact us on [email protected] to find out how you
can get involved free of charge!
Fully available only to the Airline Cost Management Group (ACMG) member airlines. Please contact us on [email protected] to find out how you
can get involved free of charge!
Fully available only to the Airline Cost Management Group (ACMG) member airlines. Please contact us on
[email protected] to find out how you can get involved free of charge!

Airline Cost Management Group (ACMG) Enhanced Report - Sep 2014
32
6. AIRCRAFT TYPE ANALYSIS
6.1. Overview
6.2. Operational Data
Top 12 active aircraft accounted for 90% of the total active
fleet. Nevertheless, due to incomplete data submissions by
some airlines a number of them are excluded from the de-
tailed analysis on the next pages. The total number of thor-
oughly analyzed aircraft therefore sums up to 2,483 aircraft,
representing 67% of the total reported aircraft.
Also, as B717 was operated by only one reporting airline it
was excluded from the abovementioned analysis. A380 has
been included.
In general, the results support airlines’ efforts to modernize
their fleet.
6.3. Unit Costs
A320 Family 807 26
B737 NG 497 17
A330 233 21
B777 229 14
A340 158 12
Dash 8 146 6
B737 Classic 93 11
B747 78 10
EMB-190 74 6
CRJ 64 4
B767 63 8
A380 41 4
Fleet Type # Active Aircraft# of Airlines
reporting
A320 Family $24.0 Mil $8,229 7.85 33.7%
B737 NG $21.7 Mil $6,859 6.31 44.1%
A330 $50.9 Mil $12,052 5.81 47.5%
B777 $61.3 Mil $14,318 5.81 48.7%
A340 $66.8 Mil $14,732 6.55 53.4%
Dash 8 $8.8 Mil $3,921 15.54 23.4%
B737 Classic $17.2 Mil $7,771 9.81 35.5%
B747 $78.1 Mil $19,242 5.84 54.9%
EMB-190 $18.2 Mil $7,102 10.36 33.1%
CRJ $12.7 Mil $5,009 11.33 36.0%
B767 $38.5 Mil $9,798 5.87 51.1%
A380 $103.4 Mil $22,877 5.74 55.9%
Fuel as % of Direct
Operating* $
*Direct Operating Cost includes Flying Cost, Ground and Maintenance Cost, and excludes
System Operating Cost
Fleet Type Direct Operating
$*/AC
Direct Operating
$*/FH
Direct Operating
$*/ASK (in US cents)
Weight Load Factor
A320 Family 8.62 9.4 2,355,213 1,292,185 1.8 76.6% 67.7%
B737 NG 9.90 6.6 1,568,863 890,746 1.8 74.5% 65.9%
A330 12.01 5.4 984,109 195,071 5.0 77.3% 67.4%
B777 12.39 7.7 979,393 162,911 6.0 78.9% 65.1%
A340 12.05 11.8 715,917 85,928 8.3 80.4% 72.5%
Dash 8 6.59 13.3 328,268 324,428 1.0 70.5% 66.7%
B737 Classic 6.78 19.6 206,583 159,345 1.3 73.6% 68.3%
B747 11.60 14.5 316,633 40,428 7.8 82.4% 76.3%
EMB-190 8.08 5.7 189,803 109,406 1.7 80.1% 65.5%
CRJ 6.42 8.1 162,645 120,160 1.4 71.6% 62.8%
B767 11.97 17.7 247,790 45,282 5.5 79.7% 55.7%
A380 13.90 2.6 185,293 19,466 9.5 81.4% 79.1%
Fleet Type Average Fleet Age Flight CyclesFlight Hours Hour-to-Cycle ratioDaily Utilization Pax Load Factor
Fully available only to the Airline Cost Management Group (ACMG) member airlines.
Please contact us on [email protected] to find out how you can get involved free of charge!
Fully available only to the Airline Cost Management Group
(ACMG) member airlines.
Please contact us on [email protected] to find out how you
can get involved free of charge!
Airline Cost Management Group (ACMG) Enhanced Report - Sep 2014
33
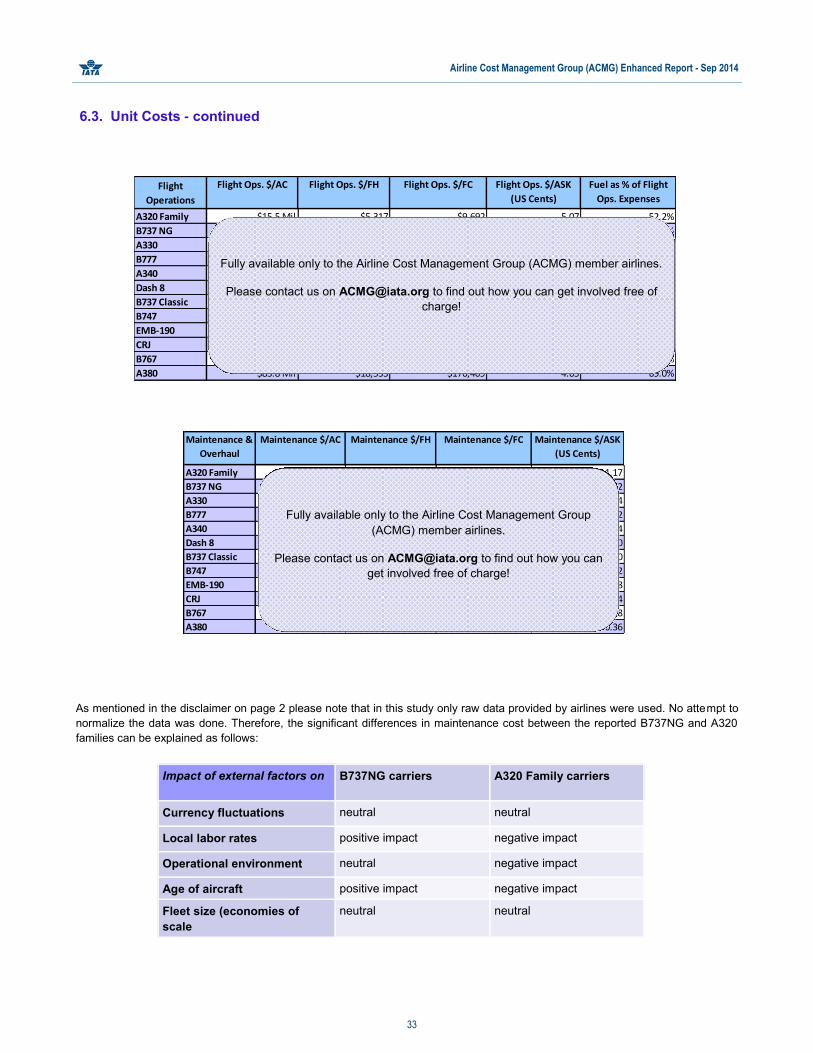
As mentioned in the disclaimer on page 2 please note that in this study only raw data provided by airlines were used. No attempt to
normalize the data was done. Therefore, the significant differences in maintenance cost between the reported B737NG and A320
families can be explained as follows:
Impact of external factors on B737NG carriers A320 Family carriers
Currency fluctuations neutral neutral
Local labor rates positive impact negative impact
Operational environment neutral negative impact
Age of aircraft positive impact negative impact
Fleet size (economies of
scale
neutral neutral
6.3. Unit Costs - continued
A320 Family $15.5 Mil $5,317 $9,692 5.07 52.2%
B737 NG $16.6 Mil $5,270 $9,282 4.85 57.4%
A330 $37.8 Mil $8,940 $45,099 4.31 64.0%
B777 $47.0 Mil $10,978 $66,001 4.46 63.5%
A340 $51.7 Mil $11,396 $94,948 5.07 69.0%
Dash 8 $5.2 Mil $2,311 $2,338 9.16 39.8%
B737 Classic $10.8 Mil $4,890 $6,339 6.17 56.4%
B747 $57.8 Mil $14,228 $111,430 4.32 74.3%
EMB-190 $11.1 Mil $4,317 $7,489 6.30 54.5%
CRJ $9.0 Mil $3,562 $4,822 8.06 50.7%
B767 $29.1 Mil $7,411 $40,554 4.44 67.5%
A380 $83.8 Mil $18,533 $176,409 4.65 69.0%
Flight Ops. $/FC Flight Ops. $/ASK
(US Cents)Flight
Operations
Flight Ops. $/AC Flight Ops. $/FH Fuel as % of Flight
Ops. Expenses
A320 Family $3.6 Mil $1,223 $2,229 1.17
B737 NG $2.1 Mil $670 $1,180 0.62
A330 $5.6 Mil $1,336 $6,740 0.64
B777 $7.6 Mil $1,764 $10,607 0.72
A340 $8.6 Mil $1,895 $15,788 0.84
Dash 8 $1.7 Mil $758 $767 3.00
B737 Classic $2.5 Mil $1,109 $1,438 1.40
B747 $8.2 Mil $2,028 $15,882 0.62
EMB-190 $3.3 Mil $1,287 $2,233 1.88
CRJ $1.7 Mil $679 $919 1.54
B767 $5.1 Mil $1,299 $7,111 0.78
A380 $6.4 Mil $1,419 $13,508 0.36
Maintenance $/AC Maintenance $/FHMaintenance &
Overhaul
Maintenance $/FC Maintenance $/ASK
(US Cents)
Fully available only to the Airline Cost Management Group (ACMG) member airlines.
Please contact us on [email protected] to find out how you can get involved free of
charge!
Fully available only to the Airline Cost Management Group
(ACMG) member airlines.
Please contact us on [email protected] to find out how you can
get involved free of charge!
Airline Cost Management Group (ACMG) Enhanced Report - Sep 2014
34
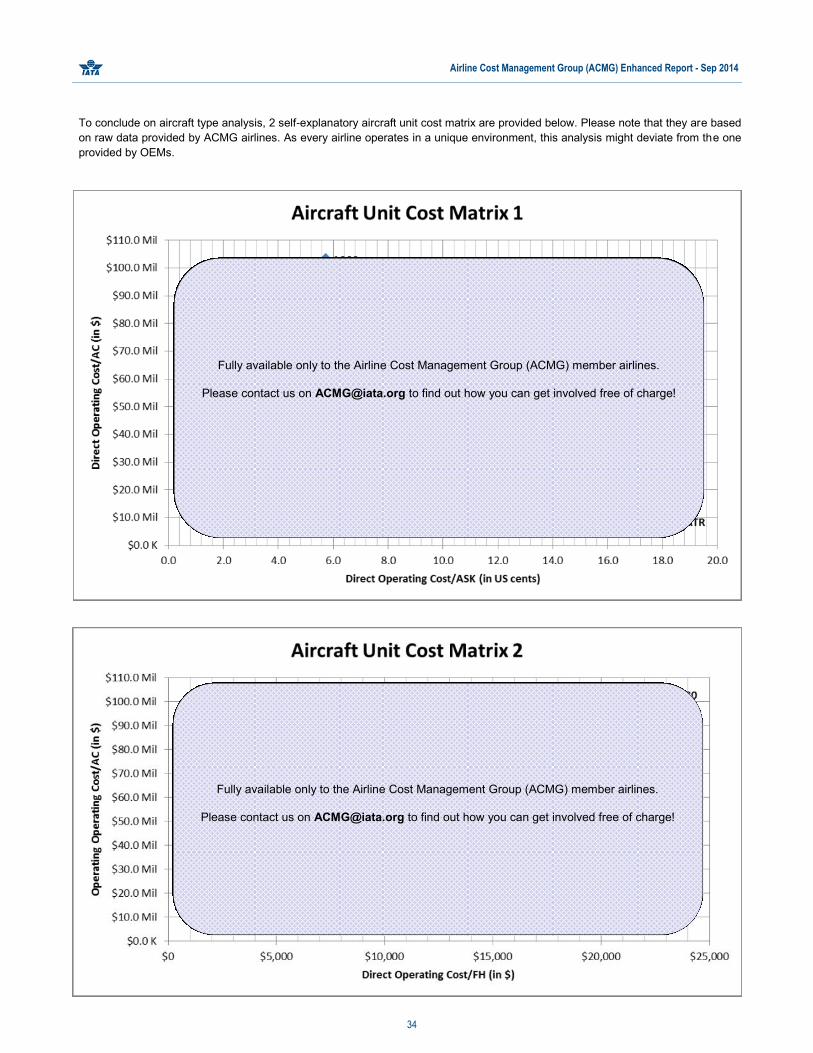
To conclude on aircraft type analysis, 2 self-explanatory aircraft unit cost matrix are provided below. Please note that they are based
on raw data provided by ACMG airlines. As every airline operates in a unique environment, this analysis might deviate from the one
provided by OEMs.
Fully available only to the Airline Cost Management Group (ACMG) member airlines.
Please contact us on [email protected] to find out how you can get involved free of charge!
Fully available only to the Airline Cost Management Group (ACMG) member airlines.
Please contact us on [email protected] to find out how you can get involved free of charge!

Airline Cost Management Group (ACMG) Enhanced Report - Sep 2014
35
7. DETAILED ANALYSIS of B737NG and A320 Family
To conduct the aircraft type analysis we selected two most popular aircraft families; B737NG and A320 Family representing 26.1%
and 22.8% of ACMG active fleet count, respectively.
The purpose of this section is for a respective airline to compare its aircraft utilization with other involved airlines. Nevertheless, the
average values are provided on previous pages should they be of reader’s interest.
7.1. B737NG
A strong trend of introducing new and more fuel efficient aircraft while retiring old fleets paved the way for B737NG Family. It is the
most popular aircraft family in our analysis with total of 974 reported aircraft.
17 airlines reported B737NG in their active fleet and 16 of them are represented in most of the charts.
Fully available only to the Airline Cost Management Group (ACMG) member airlines. Please contact us on [email protected] to find out
how you can get involved free of charge!
Fully available only to the Airline Cost Management Group (ACMG) member airlines. Please contact us on [email protected] to
find out how you can get involved free of charge!

Airline Cost Management Group (ACMG) Enhanced Report - Sep 2014
36
Note: Direct
Fully available only to the Airline Cost Management Group (ACMG) member airlines. Please contact us on [email protected] to find out
how you can get involved free of charge!
Fully available only to the Airline Cost Management Group (ACMG) member airlines. Please contact us on [email protected] to find out
how you can get involved free of charge!
Fully available only to the Airline Cost Management Group (ACMG) member airlines. Please contact us on [email protected] to find out
how you can get involved free of charge!
Airline Cost Management Group (ACMG) Enhanced Report - Sep 2014
37
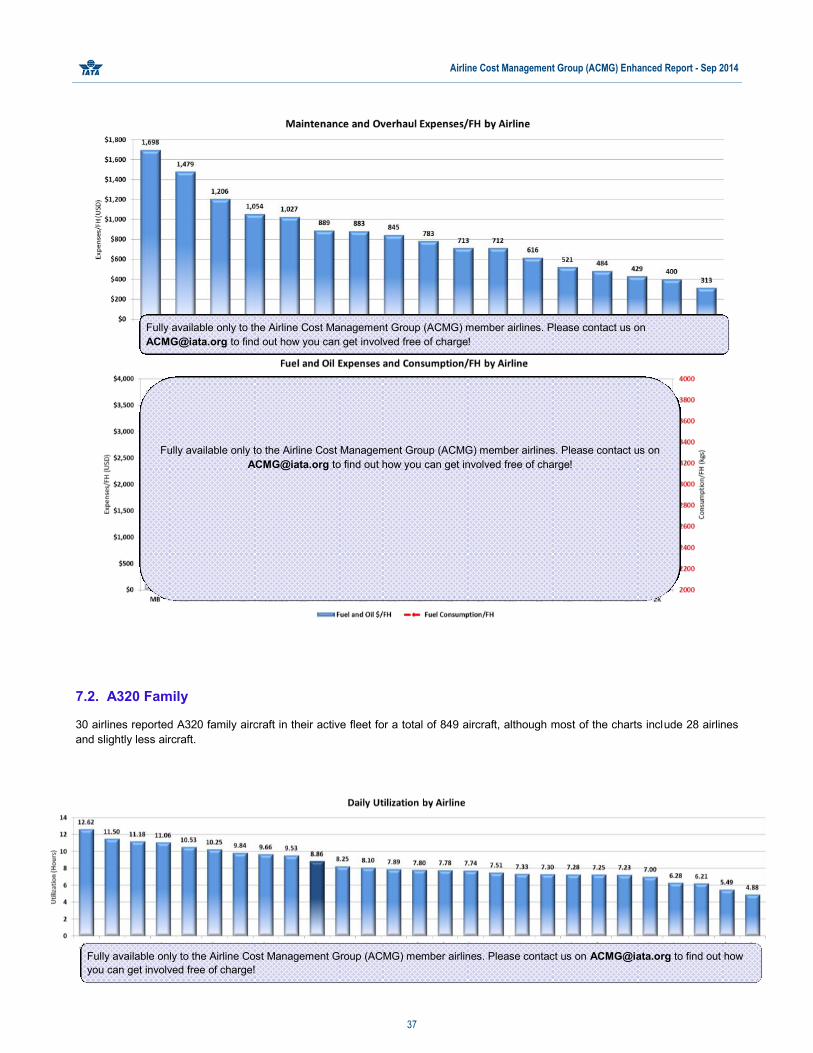
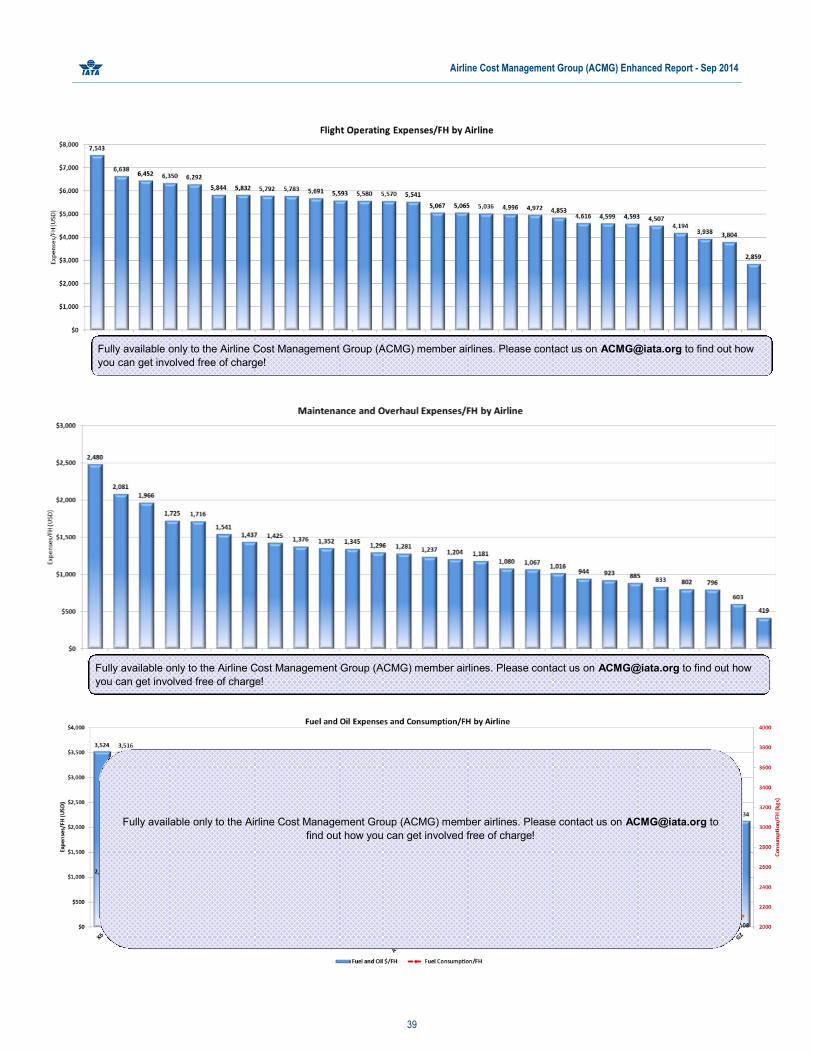
7.2. A320 Family
30 airlines reported A320 family aircraft in their active fleet for a total of 849 aircraft, although most of the charts include 28 airlines
and slightly less aircraft.
Fully available only to the Airline Cost Management Group (ACMG) member airlines. Please contact us on
[email protected] to find out how you can get involved free of charge!
Fully available only to the Airline Cost Management Group (ACMG) member airlines. Please contact us on
[email protected] to find out how you can get involved free of charge!
Fully available only to the Airline Cost Management Group (ACMG) member airlines. Please contact us on [email protected] to find out how
you can get involved free of charge!

Airline Cost Management Group (ACMG) Enhanced Report - Sep 2014
38
Note:
Fully available only to the Airline Cost Management Group (ACMG) member airlines. Please contact us on [email protected] to find out how
you can get involved free of charge!
Fully available only to the Airline Cost Management Group (ACMG) member airlines. Please contact us on [email protected] to find out how
you can get involved free of charge!
Fully available only to the Airline Cost Management Group (ACMG) member airlines. Please contact us on [email protected] to find out how
you can get involved free of charge!
Airline Cost Management Group (ACMG) Enhanced Report - Sep 2014
39
Fully available only to the Airline Cost Management Group (ACMG) member airlines. Please contact us on [email protected] to
find out how you can get involved free of charge!
Fully available only to the Airline Cost Management Group (ACMG) member airlines. Please contact us on [email protected] to find out how
you can get involved free of charge!
Fully available only to the Airline Cost Management Group (ACMG) member airlines. Please contact us on [email protected] to find out how
you can get involved free of charge!
Airline Cost Management Group (ACMG) Enhanced Report - Sep 2014
40
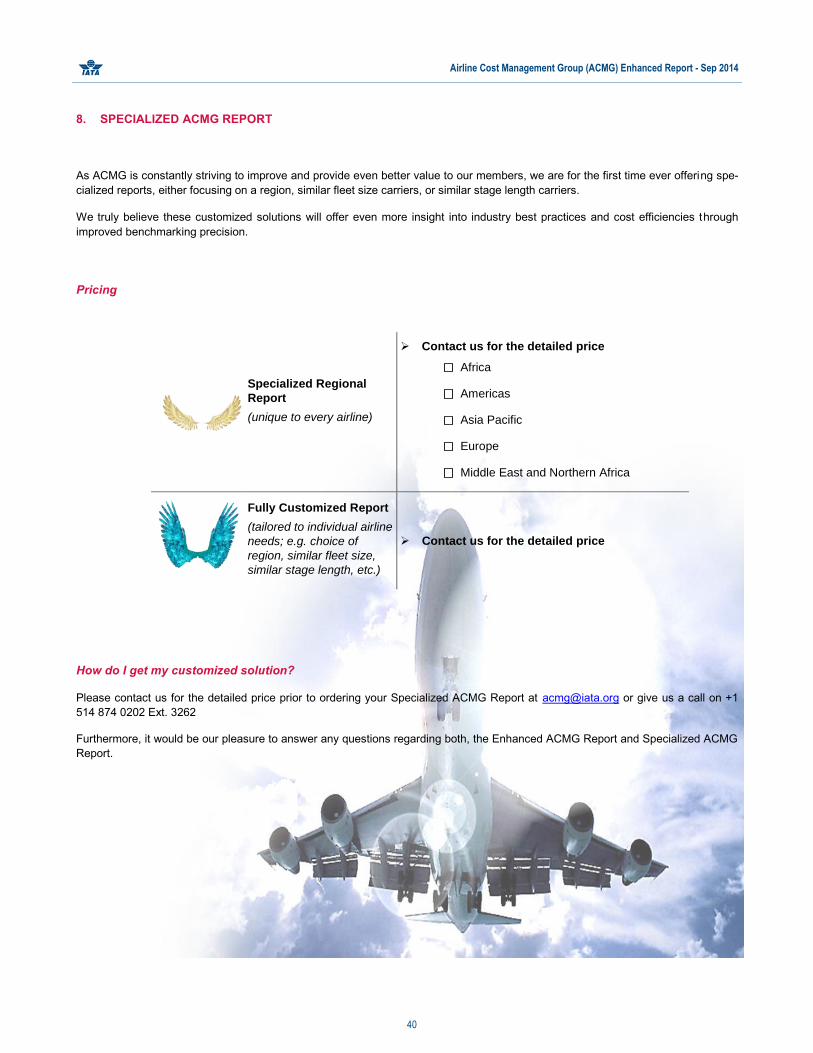
8. SPECIALIZED ACMG REPORT
As ACMG is constantly striving to improve and provide even better value to our members, we are for the first time ever offering spe-
cialized reports, either focusing on a region, similar fleet size carriers, or similar stage length carriers.
We truly believe these customized solutions will offer even more insight into industry best practices and cost efficiencies through
improved benchmarking precision.
Pricing
How do I get my customized solution?
Please contact us for the detailed price prior to ordering your Specialized ACMG Report at [email protected] or give us a call on +1
514 874 0202 Ext. 3262
Furthermore, it would be our pleasure to answer any questions regarding both, the Enhanced ACMG Report and Specialized ACMG
Report.
Specialized Regional
Report
(unique to every airline)
Contact us for the detailed price
Africa
Americas
Asia Pacific
Europe
Middle East and Northern Africa
Fully Customized Report
(tailored to individual airline
needs; e.g. choice of
region, similar fleet size,
similar stage length, etc.)
Contact us for the detailed price

Airline Cost Management Group (ACMG) Enhanced Report - Sep 2014
41
Chris MARKOU
Assistant Director,
IATA Operations
IATA’S MAINTENANCE
COST TASK FORCE (MCTF)
Similar in concept to the ACMG,
IATA developed the MCTF almost
50 years ago to serve as a focal
point for gathering industry infor-
mation on commercial airline
maintenance costs, including MRO
(Maintenance, Repair and Over-
haul) cost strategies.
Objectives and Activities
Define and standardize the re-
porting of commercial airline
maintenance costs
Benchmark with own airline’s
historical data and compare with
industry best practices
Identify high cost drivers and
target areas for Maintenance
Cost reduction, as an individual
operator or as part of an airline
group (i.e. Cargo, Low-Cost,
Latin American, etc.).
Collaborate with OEMs and other
suppliers to define and imple-
ment Aircraft Maintenance Cost
Reduction initiatives
Provide a forum for airlines to
exchange/share knowledge, best
practices and industry know-how
(Lean Six Sigma, outsourcing
trends, etc.), as well as to net-
work in the airline Maintenance
world
Organize IATA’ s annual Mainte-
nance Cost Conference with
airline industry experts, OEMs
and MROs.
Contact
Website: www.iata.org/mctf
Email: [email protected]
Geraldine CROS
Operational Cost Manager,
IATA Operations
CONTRIBUTORS
ACMG’s STEERING COMMITTEE
MEMBERS
The ACMG’s Steering Committee (SC) is made up of Member Airlines, IATA represent-atives and Strategic Partners.
Up to 10 Airlines can have seats on this Steering Committee, including Chairman and Vice Chairman, for a 2-year mandate.
ACTIVITIES
The SC collaborates to define efficient ways to monitor cost structures and trends (KPIs and metrics) as well as cost management best practices.
The SC may also initiate cost-related surveys to investigate the most relevant cost driv-ers.
Standard definitions and data collection toolset are debated amongst the committee members.
The committee communicates by email on a regular basis, and will hold telephone con-ferences and/or face-to-face meetings at least once a year.
BENEFITS FOR MEMBERS
Be an active member of a worldwide airline industry community
Be updated with the industry trends in terms of cost performance, cost monitoring and cost management
Get the opportunity to network with airline industry professionals involved in finance and cost management, and exchange experience and best practices
PARTICIPATION
Membership to the ACMG and its Steering Committee is open to all airlines, including cargo, charter and low cost carriers, one last spot available!
Visit ACMG website (www.iata.org/ACMG) and download the nomination form
Contact ACMG at [email protected] to submit the completed nomination form
We look forward to having you onboard!
Klemen FERJAN
Cost Management Consultant,
IATA Operations
Steering Committee formed in 2013, consists of 9 airline members:
Chairman, Josua du Plessis, SAA
Vice-Chairman, Ramanpreet Boparai / Dimitrios Tziortzis, Air Canada
Larry Gibbons, Atlas Air
Hassan Mohamed, Egyptair
Valdimar Bjornsson, Primera Air
Ashraf Suleman, Saudi Airlines
Luis Miguel Pestana Rosa, TAP Portugal
Faik Ozan Dulger, Turkish Airlines
Yuliya Gerasymchuk, Ukraine International Airlines
Airline Cost Management Group (ACMG) Enhanced Report - Sep 2014
42
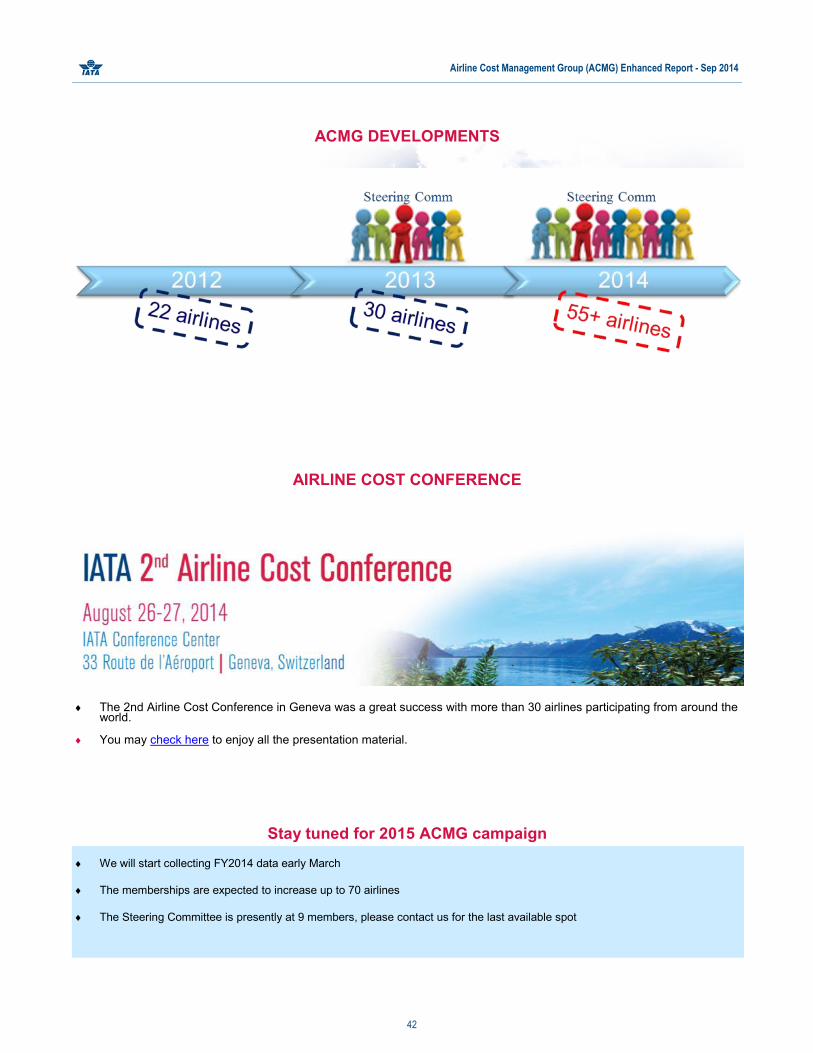
ACMG DEVELOPMENTS
AIRLINE COST CONFERENCE
The 2nd Airline Cost Conference in Geneva was a great success with more than 30 airlines participating from around the world.
You may check here to enjoy all the presentation material.
Stay tuned for 2015 ACMG campaign
We will start collecting FY2014 data early March
The memberships are expected to increase up to 70 airlines
The Steering Committee is presently at 9 members, please contact us for the last available spot