alcoa 3q08 analyst presentation
Post on 21-Oct-2014
1.755 views
DESCRIPTION
TRANSCRIPT

d Q C f
October 7 2008
3rd Quarter 2008 Analyst Conference
October 7, 2008

Forward Looking Statements
Today’s discussion may include “forward-looking statements” within the meaning of the Private Securities Litigation Reform Act of 1995the meaning of the Private Securities Litigation Reform Act of 1995. Such statements relate to future events and expectations and involve known and unknown risks and uncertainties. Alcoa’s actual
lt ti diff t i ll f th j t d i thresults or actions may differ materially from those projected in the forward-looking statements. For a summary of the specific risk factors that could cause results to differ materially from those expressed in the forward-looking statements, please refer to Alcoa’s Form 10-K for the year ended December 31, 2007 and Forms 10-Q for the quarters ended March 31 2008 and June 30Forms 10 Q for the quarters ended March 31, 2008 and June 30, 2008, and other reports filed with the Securities and Exchange Commission.
2
C
Executive Vice President and Chief Financial Officer
Chuck McLane
Executive Vice President and Chief Financial Officer

3rd Quarter 2008 Financial Overview
– Net income of $268m, or $0.33 per share – includes $29m or $0.04 per share for restructuring
– Sequentially, currency translation was a negative $52m, or $0.06 per share
Typical sequential seasonal decline amplified by weakening– Typical sequential seasonal decline amplified by weakening markets
– Revenues of $7.2 billion – up from $6.5 billion in 3Q 2007, l di di t d b iexcluding divested businesses
– Increases in input costs persist
– Cash on hand at $831m with debt-to-capital at 36 3%– Cash on hand at $831m with debt-to-capital at 36.3%
– Trailing 12-month ROC stands at 11.5%, excluding growth investments
4

Margin squeeze impacting entire industry
Alumina EBITDA Change – 1H 08 vs 1H 07
Alcoa (-27%)
Competitor A (-40%)
Competitor B (-40%)
Smelting EBITDA Change – 1H 08 vs 1H 07
Competitor C (-23%)
Alcoa (-22%)
Competitor A ( 44%)Competitor A (-44%)
Competitor B (-13%)
Competitor C (-21%)
5
Competitor C (-21%)
Source: Company filings

The industry is facing significant input cost escalation
7,412 7,123$526
110%
Caustic Soda ( per dmt)
88%
Calcined Coke (per mt) Ocean Freight (Baltic Dry Index)
(4%)$958
$250
110%
$510
3Q07 3Q083Q07 3Q08
Natural Gas (US Henr H b per MMBt ) Fuel Oil (Low Sulfur Oil Index per bbl)
Source: CMAI Source: PACE Source: Bloomberg
U S Dollar*
3Q07 3Q08
Natural Gas (US Henry Hub per MMBtu)
47%
Fuel Oil (Low Sulfur Oil Index per bbl)
77%
U.S. Dollar
(6%)
$6.18
$9.06
$57
$10194100
Source: BloombergSource: Bloomberg Source: Bloomberg3Q07 3Q08 3Q07 3Q08 3Q07 3Q08
6
Source: BloombergSource: Bloomberg Source: Bloomberg
* Relative USD value vs weighted average of Alcoa exposure to AUD, CAD, BRL, & EUR
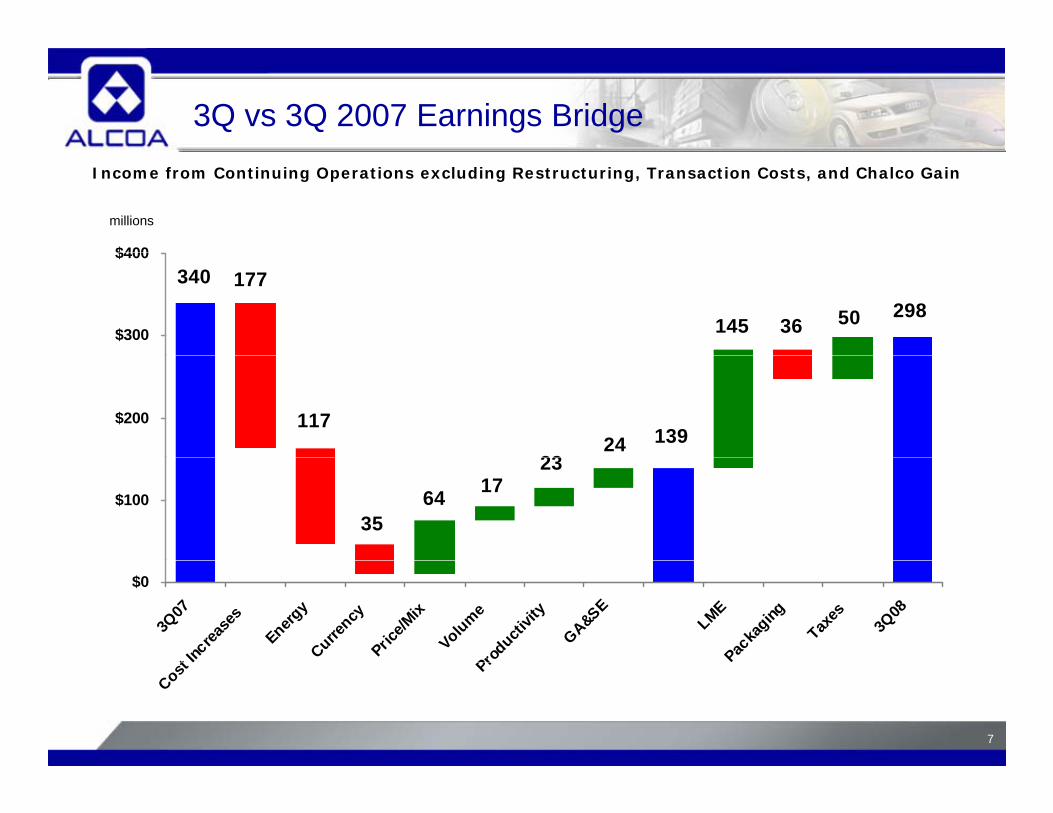
3Q vs 3Q 2007 Earnings BridgeIncome from Continuing Operations excluding Restructuring, Transaction Costs, and Chalco Gain
millions
$400340
2985036145
177
$300
$400
1392423
117$200
1723
6435
$100
$0
3Q07
t Increa
ses
Energy
Currency
Price/M
ixVolume
Producti
vity
GA&SE
LMEPac
kaging
Taxes
3Q08
7
Cost Pr

Sequential Income Statement
In Millions 2Q 08 3Q 08 Change
Sales $7,620 $7,234 (5%)Cost of Goods Sold $6,090 $5,944 (2%) % of Sales 79.9% 82.2% 2.3 ptsSG&A $306 $283 (8%)
% f S l 4 0% 3 9% (0 1 ) % of Sales 4.0% 3.9% (0.1 pts)Restructuring and Other Charges $2 $43 nmInterest Expense $87 $97 11%Oth E /(I ) $(97) $17Other Expense/(Income) $(97) $17 nmEffective Tax Rate 27.3% 24.9% (2.4 pts)Minority Interests $70 $84 20%
Net Income $546 $268 (51%)
Earnings per Diluted Share $0.66 $0.33 (50%)
8

3Q vs 2Q 2008 Earnings BridgeIncome from Continuing Operations Excluding Restructuring
millions
539 76$600
396
539
239817927
4534
18
76
$400
$500
23298
27
$300
$400
$100
$200
$0
2Q08
Seaso
nality
t Increa
ses
Energy
Currency
Price/M
ix
VolumePro
ductivit
y
GA&SE
LME
3Q08
9
Se
Cost I Pro
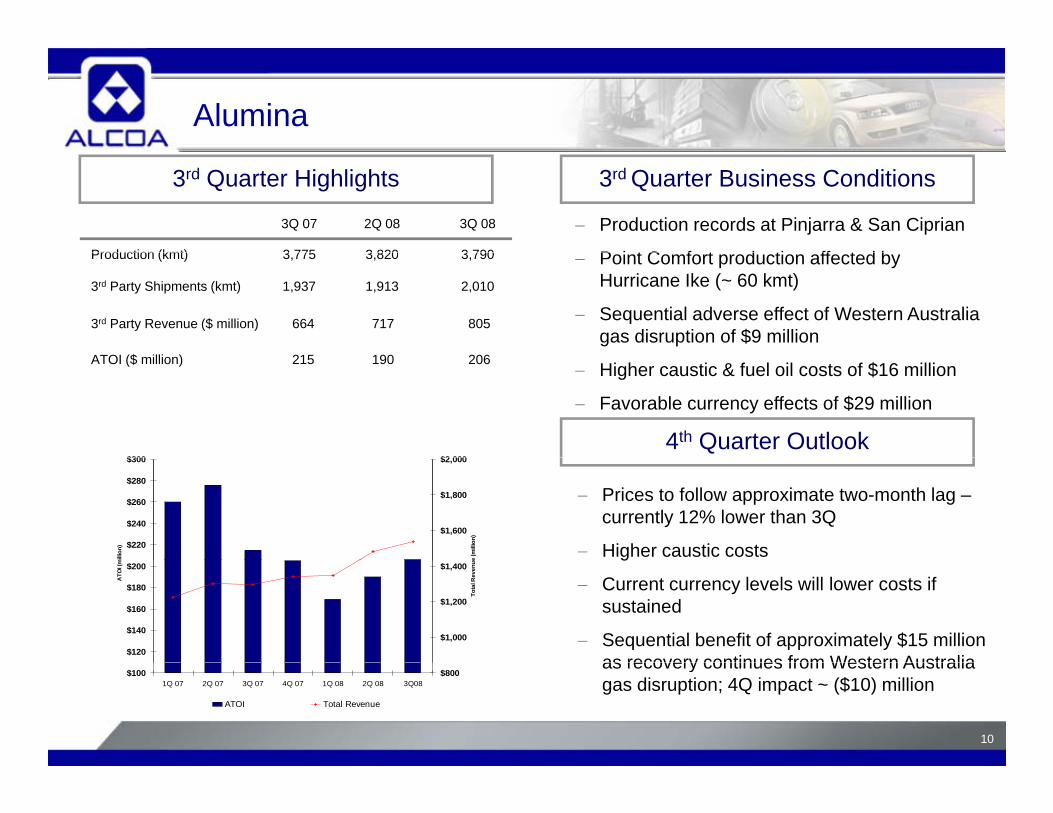
Alumina
3Q 07 2Q 08 3Q 08
Production (kmt) 3 775 3 820 3 790
− Production records at Pinjarra & San Ciprian
P i t C f t d ti ff t d b
3rd Quarter Highlights 3rd Quarter Business Conditions
Production (kmt) 3,775 3,820 3,790
3rd Party Shipments (kmt) 1,937 1,913 2,010
3rd Party Revenue ($ million) 664 717 805
ATOI ($ illi ) 215 190 206
− Point Comfort production affected by Hurricane Ike (~ 60 kmt)
− Sequential adverse effect of Western Australia gas disruption of $9 million
ATOI ($ million) 215 190 206− Higher caustic & fuel oil costs of $16 million
− Favorable currency effects of $29 million
4th Quarter Outlook$300 $2 000
− Prices to follow approximate two-month lag –currently 12% lower than 3Q
− Higher caustic costs $220
$240
$260
$280
$300
mill
ion)
$1,600
$1,800
$2,000e
(mill
ion)
g
− Current currency levels will lower costs if sustained
− Sequential benefit of approximately $15 million as recovery continues from Western Australia
$120
$140
$160
$180
$200
ATO
I (m
$1,000
$1,200
$1,400
Tota
l Rev
enue
10
as recovery continues from Western Australia gas disruption; 4Q impact ~ ($10) million
$1001Q 07 2Q 07 3Q 07 4Q 07 1Q 08 2Q 08 3Q08
$800
ATOI Total Revenue

Primary Metals
3rd Quarter Highlights3Q 07 2Q 08 3Q 08
Production (kmt) 934 1,030 1,011
3rd Quarter Business Conditions
− Realized pricing down 4% sequentially
Hi h t f b d t d LME( ) , ,
3rd Party Shipments (kmt) 584 750 704
3rd Party Revenue ($ million) 1,600 2,437 2,127
3rd Party Price ($/mt) 2,734 3,058 2,945
− Higher costs for carbon products and LME-linked costs
− Iceland efficiency & volume gains of $14 million
ATOI ($ million) 283 428 297
4th Q t O tl k
− Favorable currency effects of $29 million
$550 $5,000
4th Quarter Outlook− Current cash LME ~ $2,250/mt
− Higher input costs continue$300
$350
$400
$450
$500
(mill
ion)
$3,500
$4,000
$4,500
enue
(mill
ion)
− Current currency levels will lower costs if sustained
− Sequential negative impact of complete Rockdale curtailment expected to be $50
$100
$150
$200
$250
ATO
I
$2,500
$3,000
$ ,
Tota
l Rev
e
11
approximately $30 million during the period$01Q 07 2Q 07 3Q 07 4Q 07 1Q 08 2Q 08 3Q08
$2,000
ATOI Total Revenue
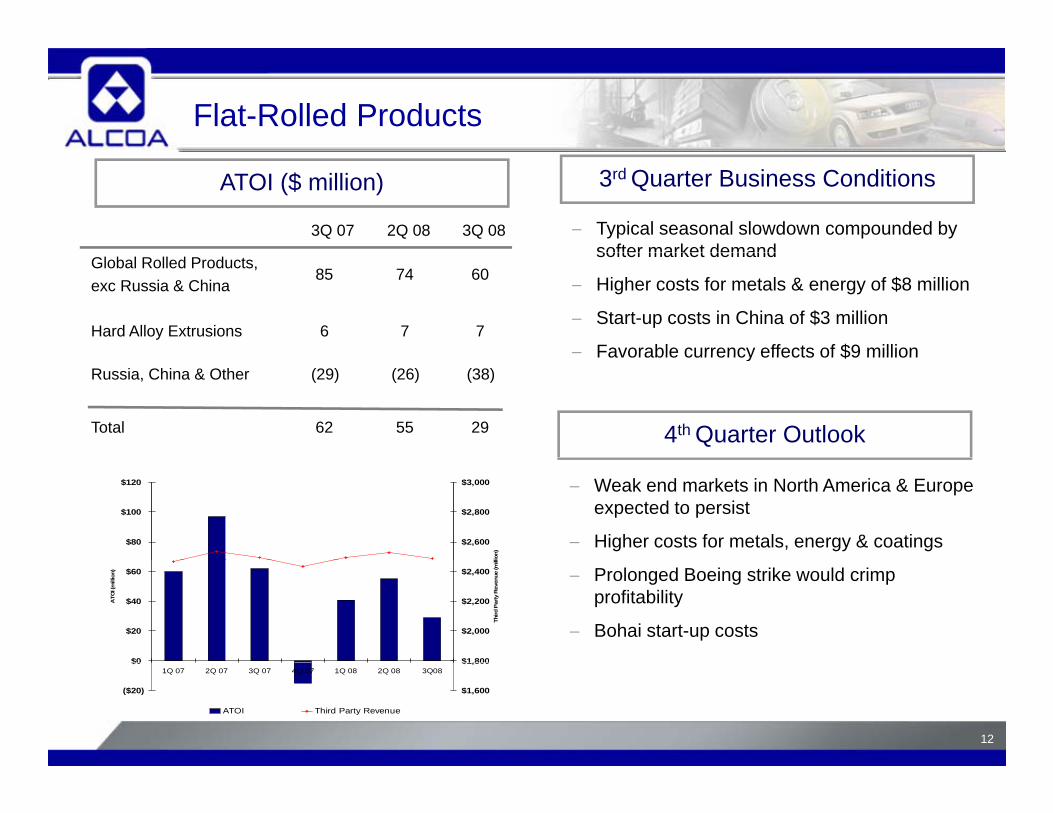
Flat-Rolled Products
3rd Quarter Business Conditions
3Q 07 2Q 08 3Q 08
ATOI ($ million)
− Typical seasonal slowdown compounded by softer market demand
Global Rolled Products,exc Russia & China
85 74 60
Hard Alloy Extrusions 6 7 7
softer market demand
− Higher costs for metals & energy of $8 million
− Start-up costs in China of $3 million
− Favorable currency effects of $9 million
4th Quarter Outlook
Russia, China & Other (29) (26) (38)
Total 62 55 29
Favorable currency effects of $9 million
− Weak end markets in North America & Europe expected to persist
− Higher costs for metals, energy & coatings$80
$100
$120
$2,600
$2,800
$3,000lio
n)
− Prolonged Boeing strike would crimp profitability
− Bohai start-up costs$0
$20
$40
$60
ATO
I (m
illio
n)
$1,800
$2,000
$2,200
$2,400
Third
Par
ty R
even
ue (m
ill
12
($20)
$01Q 07 2Q 07 3Q 07 4Q 07 1Q 08 2Q 08 3Q08
$1,600
$1,800
ATOI Third Party Revenue
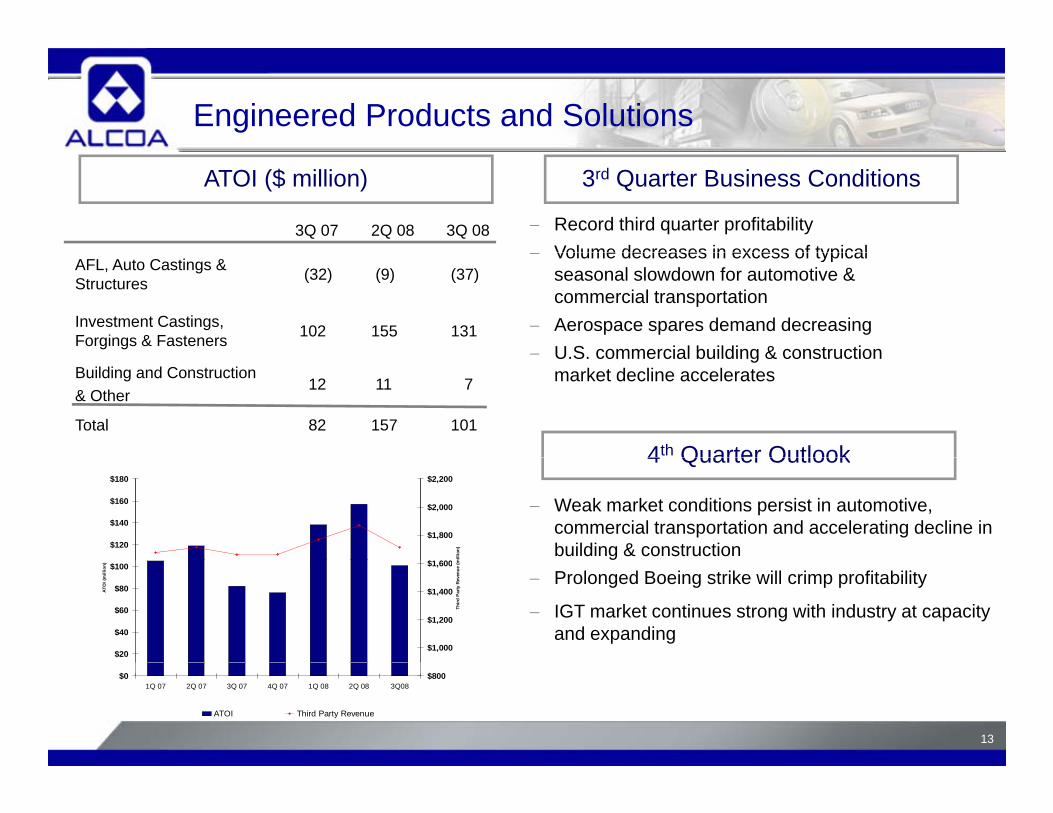
Engineered Products and Solutions
3Q 07 2Q 08 3Q 08 − Record third quarter profitability Volume decreases in excess of typical
ATOI ($ million) 3rd Quarter Business Conditions
AFL, Auto Castings & Structures (32) (9) (37)
Investment Castings, Forgings & Fasteners 102 155 131
− Volume decreases in excess of typical seasonal slowdown for automotive & commercial transportation
− Aerospace spares demand decreasing− U S commercial building & construction
Building and Construction & Other
12 11 7
Total 82 157 101
U.S. commercial building & construction market decline accelerates
4th Quarter Outlook4 Quarter Outlook
− Weak market conditions persist in automotive, commercial transportation and accelerating decline in building & construction$120
$140
$160
$180
$1 600
$1,800
$2,000
$2,200
mill
ion)
− Prolonged Boeing strike will crimp profitability
− IGT market continues strong with industry at capacity and expanding
$20
$40
$60
$80
$100
ATO
I (m
illio
n)
$1,000
$1,200
$1,400
$1,600
Thir
d P
arty
Rev
enue
(m
13
$01Q 07 2Q 07 3Q 07 4Q 07 1Q 08 2Q 08 3Q08
$800
ATOI Third Party Revenue

Cash Flow Statement
In Millions 3Q 07 2Q 08 3Q 08
Net Income $555 $546 $268DD&A 338 321 317Change in Working Capital 345 234 (519)Change in Working Capital 345 234 (519)Other Adjustments (440) (46) 259Pension Contributions (206) (48) (418)
Cash From Operating Activities $592 $1,007 $(93)
Dividends to Shareholders $(150) $(140) $(140)Change in Debt (494) 199 1,573Dividends to Minority Interests (106) (78) (76)Contributions from Minority Interests 152 181 130yShare Repurchases (1,295) (175) (477)Share Issuances 391 154 1Other Financing Activities 41 11 (7)
Cash From Financing Activities $(1 461) $152 $1 004Cash From Financing Activities $(1,461) $152 $1,004
Capital Expenditures $(941) $(796) $(877)Sales of Assets/Investments 2,041 149 115Additions to Investments (67) (22) (39)
14
Other Investing Activities (25) (86) (56)
Cash From Investing Activities $1,008 $(755) $(857)

Management actions leading to better capital structure
9.88.6
9.2
6 3% 6 2%
Long-Term Debt Maturity Profile ($Millions)Refinancing Impacts2007 New Issue 2008 New Issue
3.9
6.3%5.6%
5.2%
6.2%
Pre NewIssue
Post NewIssue
Pre NewIssue
Post NewIssue
Weighted Life (Years) Weighted Interest Rate
Cash & CP History ($Millions) January 2007 and July 2008 issuances increased average debt maturity1,600
Annual maturities are manageable over the long-term
Minimal 2009 maturities400
800
1,200
15
Liquidity is strong due to higher cash balances
0Q4'07 Q1'08 Q2'08 Q3'08
Commercial Paper Cash
President and Chief Executive Officer
Klaus Kleinfeld
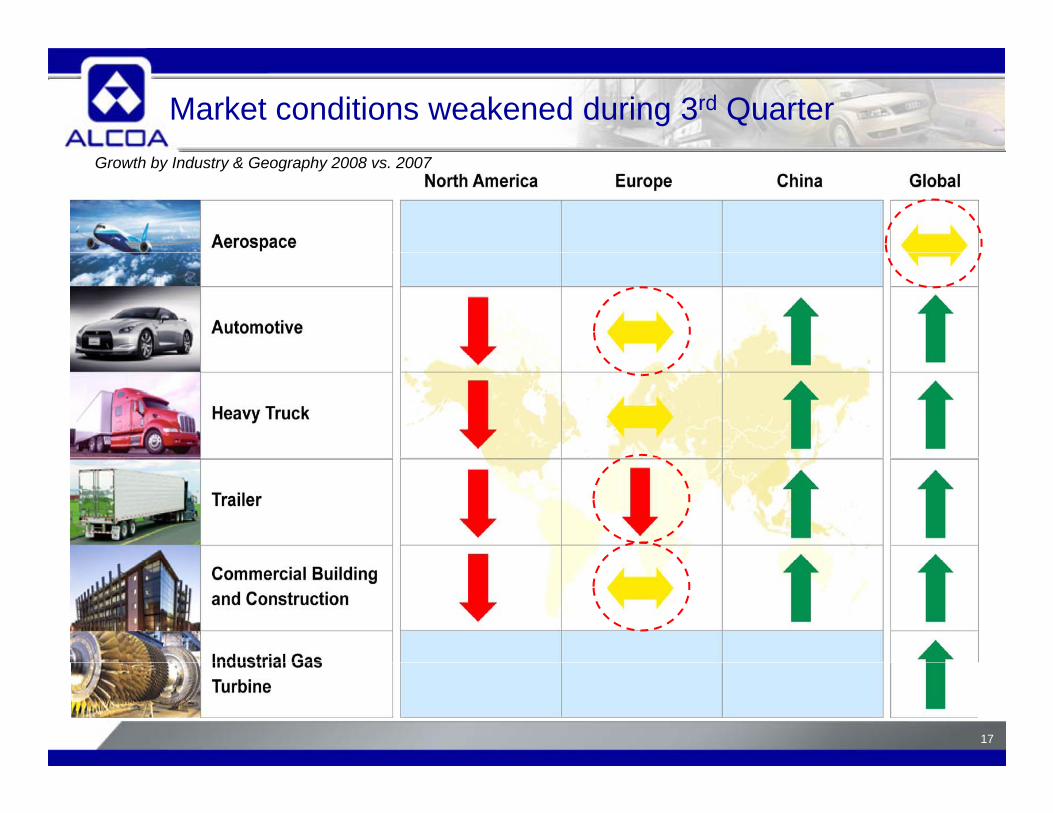
Market conditions weakened during 3rd QuarterGrowth by Industry & Geography 2008 vs. 2007
17
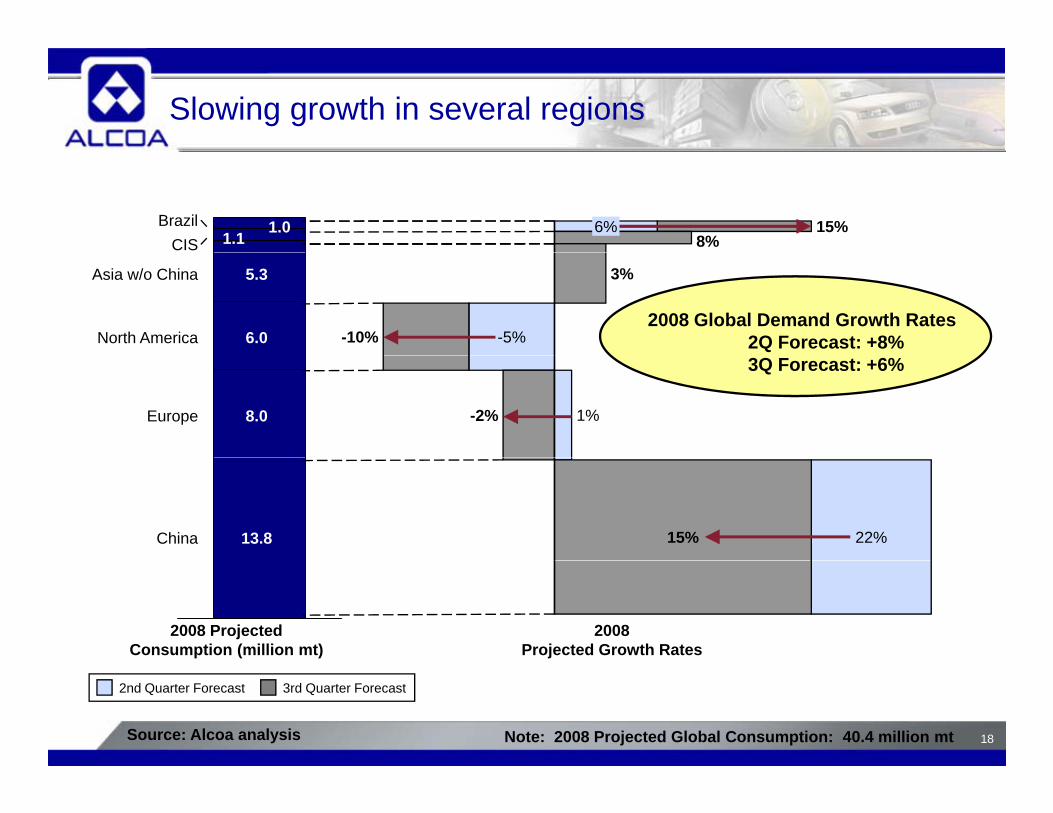
Slowing growth in several regions
1.01.1
BrazilCIS
6% 15%8%
5.3
6.0
Asia w/o China
North America
3%
-5%-10%2008 Global Demand Growth Rates
2Q Forecast: +8%
8.0Europe 1%-2%
3Q Forecast: +6%
13.8China 22%15%
2008 ProjectedConsumption (million mt)
2008Projected Growth Rates
18Source: Alcoa analysis
2nd Quarter Forecast 3rd Quarter Forecast
Note: 2008 Projected Global Consumption: 40.4 million mt
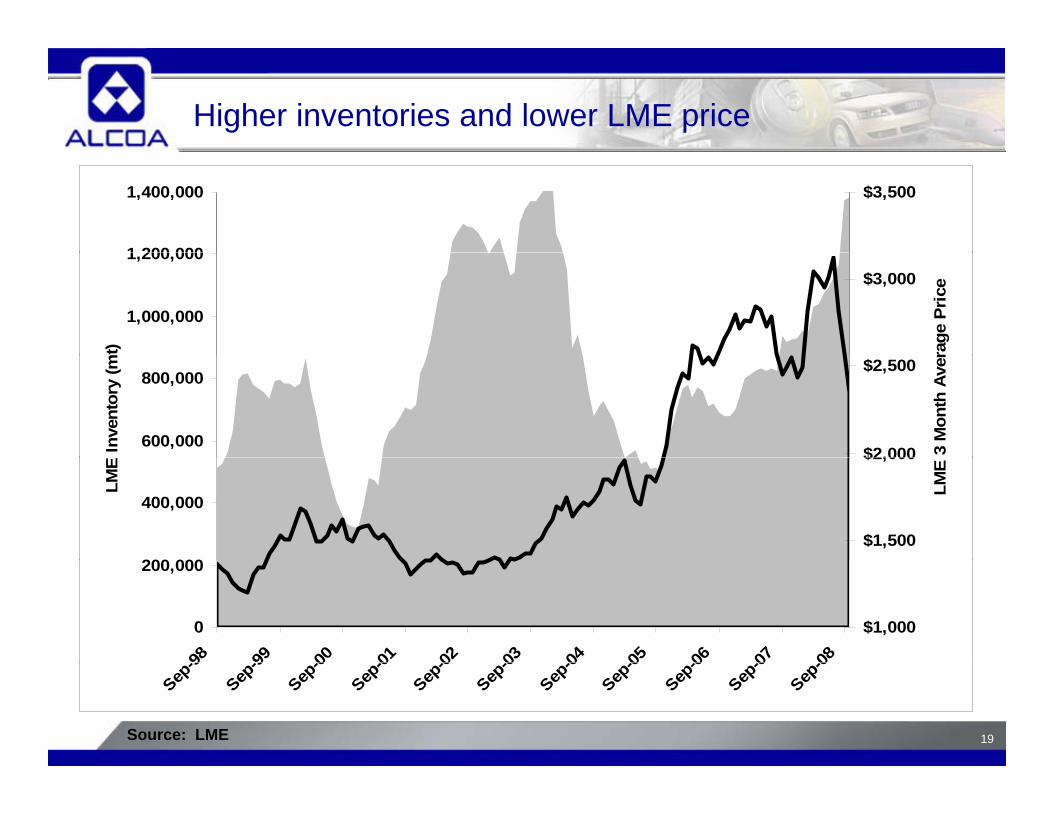
Higher inventories and lower LME price
1 200 000
1,400,000 $3,500
1,000,000
1,200,000
mt)
$3,000
rage
Pri
ce
600,000
800,000
Inve
ntor
y (m
$2,000
$2,500
3 M
onth
Ave
r
200 000
400,000
LME
$1,500
$2,000
LME
0
200,000
-98 -99 -00 -01 -02 -03 -04 -05 -06 -07 -08
$1,000
19Source: LME
Sep-9
Sep-9
Sep-0
Sep-0
Sep-0
Sep-0
Sep-0
Sep-0
Sep-0
Sep-0
Sep-0

About 1/3 of global production under water
Global Smelting Cash Cost Curve (per mt)
Cash cost (per mt)
$3,200
$3,600
2007
2008
Current LME price = $2,200/mt$2,400
$2,8002005
2006 2007
~ 1/3 total$1,600
$2,000
~ 1/3 total
$800
$1,200
20Source: CRU International, Alcoa analysis
Worldwide Capacity (million mt)
Note: 2008 cost curve adjusted to reflect current LME, FX, coke costs
0 5 10 15 20 25 30 35 40 45

Market remains optimistic on aluminum prospects
$3 600
Forward Curve of LME Aluminum Pricing
$3 200
$3,400
$3,600
June 30, 2008
$3,000
$3,200
per m
t)
Sept 30, 2008
$2,600
$2,800(p
+23%
$2,200
$2,400
3 mo 15 mo 27 mo 39 mo 51 mo 63 mo 123 mo
Sept 30, 2007
21
3 mo 15 mo 27 mo 39 mo 51 mo 63 mo 123 mo
Source: Bloomberg

Taking decisive actions
Alcoa Actions
Decelerating Aluminum Growth Review Upstream Footprint
MARKE
End Market WeaknessReview Product PortfolioCapture Pricing OpportunitiesBalance Capacity with Demand
ET
CON
Cost Pressures Complete Repowering EffortsCapture Procurement Opportunities
NDITI
Global Liquidity Crisis Suspend Share RepurchasesStop Non-Critical Capital Spend
ONS
22
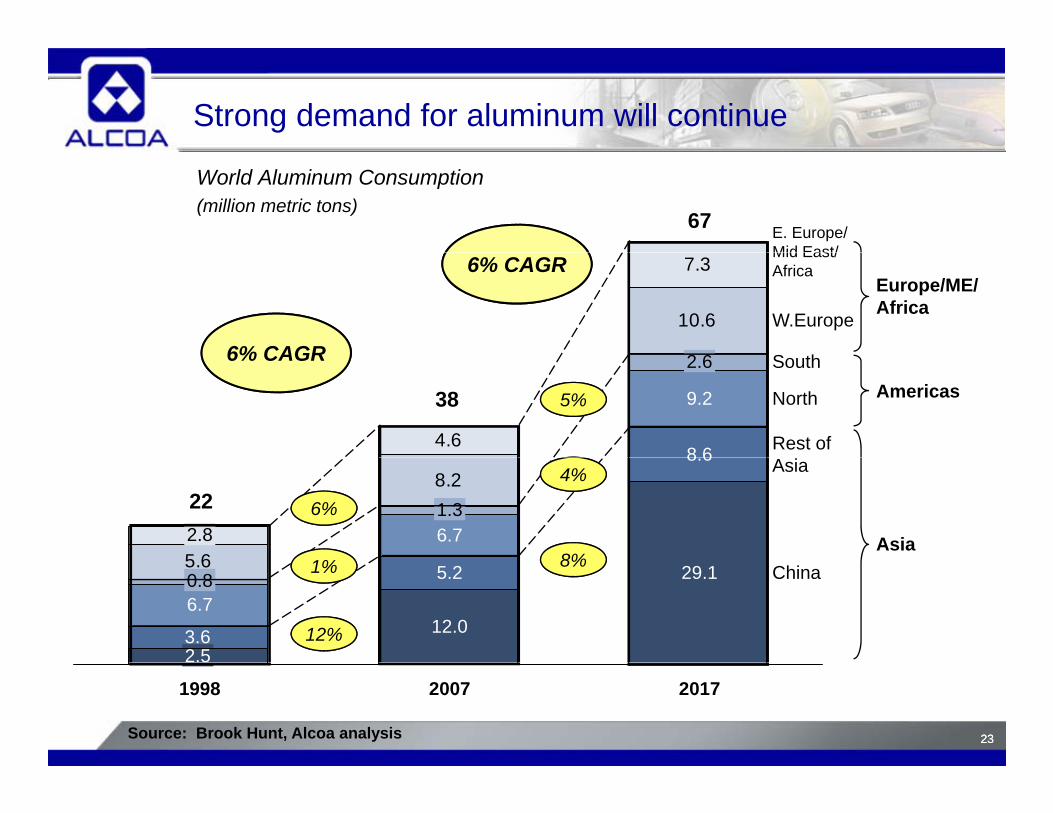
Strong demand for aluminum will continue
World Aluminum Consumption(million metric tons)
67 E. Europe/Mid East/
10.6
7.3Mid East/Africa
W.Europe
S th6% CAGR
6% CAGREurope/ME/Africa
2 6
4.6 Rest of
North9.2
8 6
South
38
6% CAGR
Americas5%
2.6
8.2
5 6
22Asia
2.8
8.6
6.7 Asia1%
6%
8%
4%
1.3
5.6 China
6.7
3.6
29.15.2
12.012%
1% 8%
2.5
0.8
2323Source: Brook Hunt, Alcoa analysis
1998 20172007
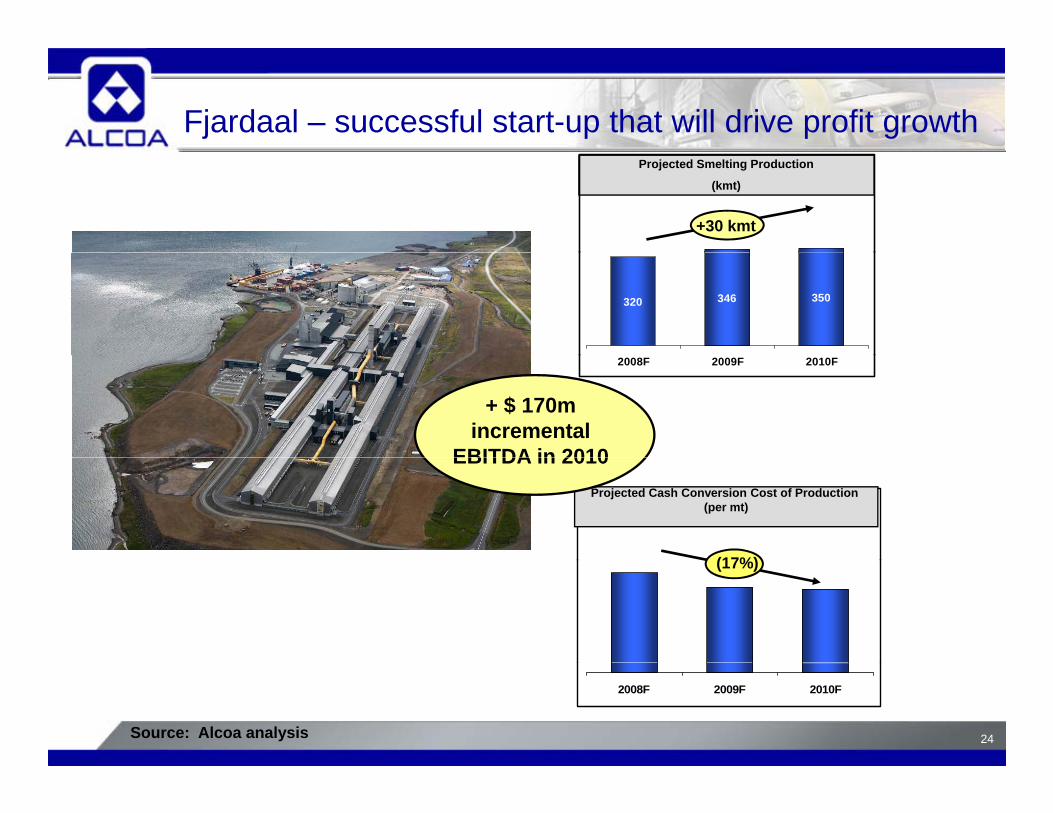
Fjardaal – successful start-up that will drive profit growth
+30 kmt
Projected Smelting Production
(kmt)
320 346 350
+ $ 170m incremental
EBITDA in 2010
2008F 2009F 2010F
Projected Cash Conversion Cost of Production (per mt)
(17%)
EBITDA in 2010
(17%)
24
2008F 2009F 2010F
Source: Alcoa analysis
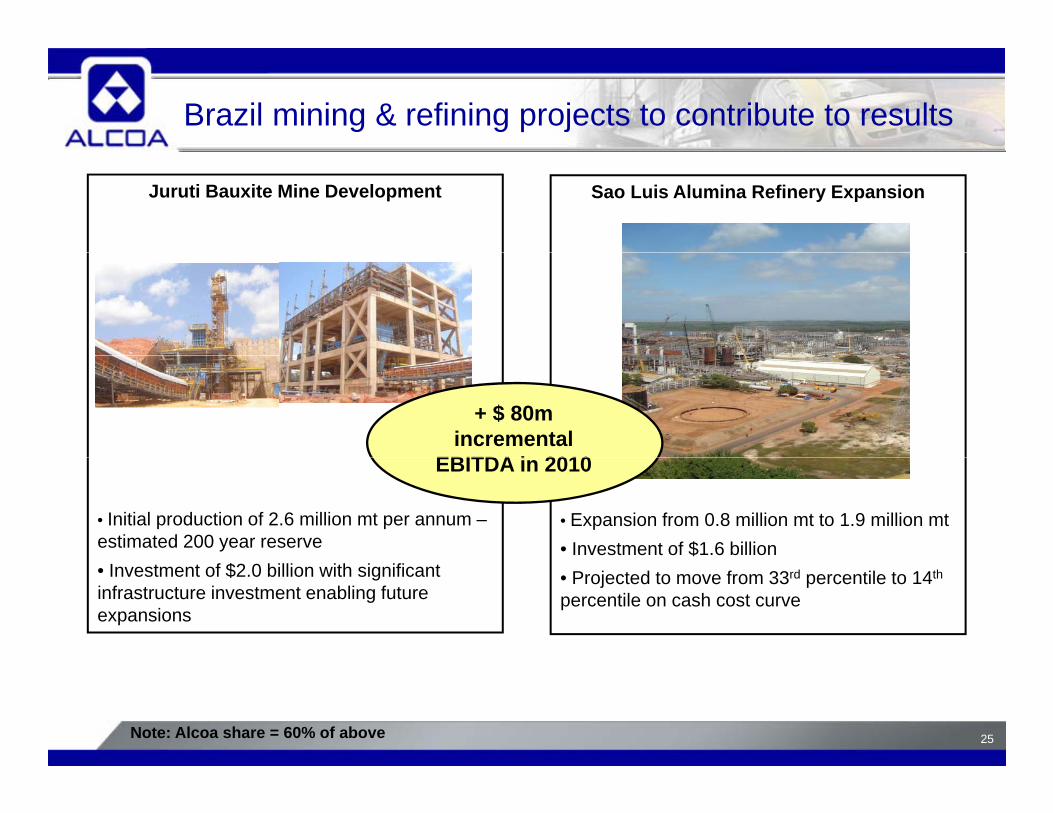
Brazil mining & refining projects to contribute to results
Sao Luis Alumina Refinery ExpansionJuruti Bauxite Mine Development
+ $ 80m incremental
EBITDA i 2010
• Expansion from 0.8 million mt to 1.9 million mt • Investment of $1.6 billion
• Initial production of 2.6 million mt per annum –estimated 200 year reserve
EBITDA in 2010
• Projected to move from 33rd percentile to 14th
percentile on cash cost curve • Investment of $2.0 billion with significant infrastructure investment enabling future expansions
25Note: Alcoa share = 60% of above
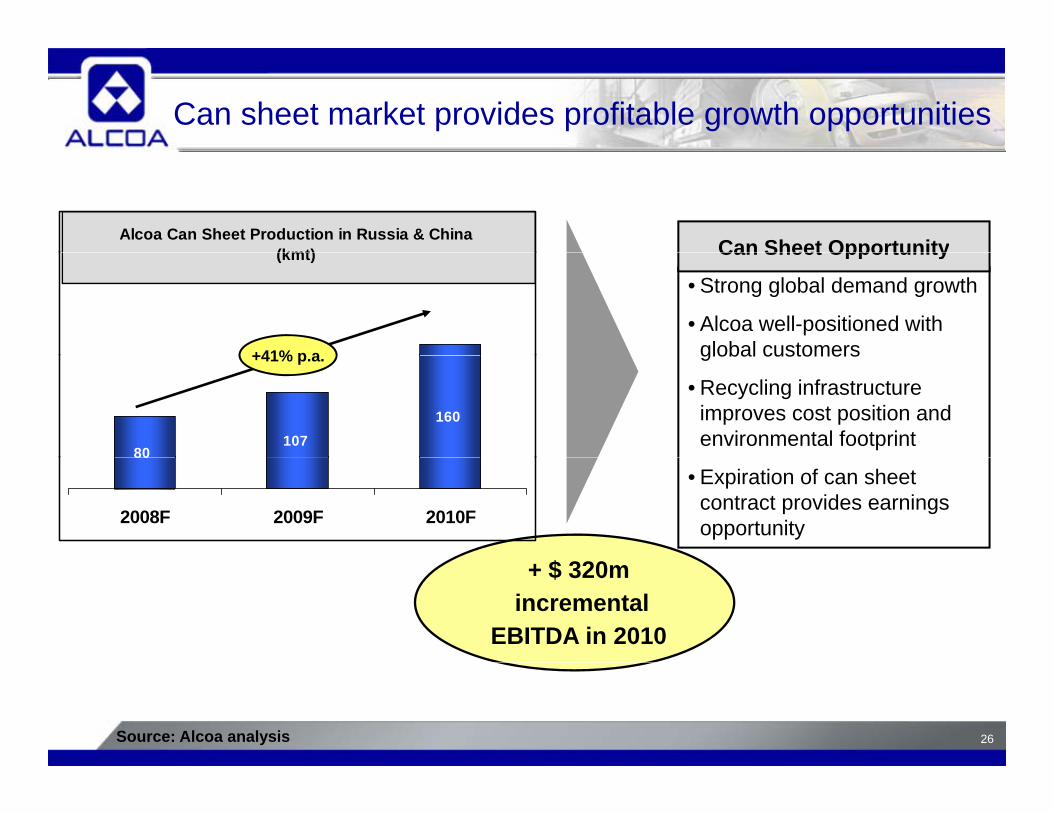
Can sheet market provides profitable growth opportunities
Can Sheet OpportunityAlcoa Can Sheet Production in Russia & China
(kmt)
• Strong global demand growth
• Alcoa well-positioned with global customers
Can Sheet Opportunity
+41% p a
(kmt)
global customers
• Recycling infrastructure improves cost position and environmental footprint
+41% p.a.
80107
160
• Expiration of can sheet contract provides earnings opportunity
$
2008F 2009F 2010F
+ $ 320mincremental
EBITDA in 2010
26Source: Alcoa analysis
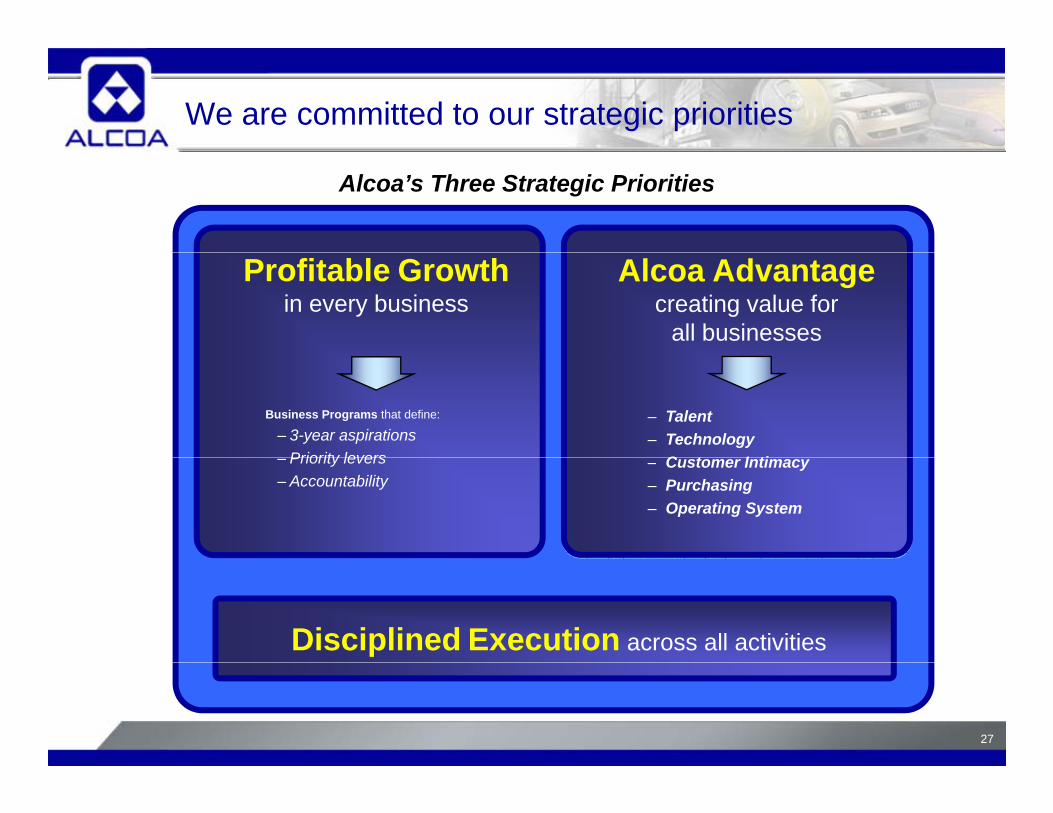
We are committed to our strategic priorities
Alcoa’s Three Strategic Priorities
Alcoa Advantagecreating value for
all businesses
Profitable Growthin every business
– Talent– Technology
C t I ti
Business Programs that define:
– 3-year aspirationsPriority levers – Customer Intimacy
– Purchasing – Operating System
– Priority levers– Accountability
Disciplined Execution across all activities
27
For Additional Information, Contact:
Greg Aschman Director Investor RelationsDirector, Investor Relations
AlcoaAlcoa 390 Park AvenueNew York, N.Y. 10022-4608New York, N.Y. 10022 4608Telephone: (212) 836-2674Facsimile: (212) 836-2813www.alcoa.com
28
29
APPENDIX30
APPENDIX

Reconciliation of ATOI to Consolidated Net Income
3Q082Q081Q0820074Q073Q072Q071Q07(in millions) 3Q082Q081Q0820074Q073Q072Q071Q07(in millions)
10129401010911Interest income
(5)(44)(31)(24)910(16)(27)Impact of LIFO
Unallocated amounts (net of tax):
$ 633$ 830$ 666$ 3,135$ 518$ 678$ 991$ 948Total segment ATOI
10129401010911Interest income
(5)(44)(31)(24)910(16)(27)Impact of LIFO
Unallocated amounts (net of tax):
$ 633$ 830$ 666$ 3,135$ 518$ 678$ 991$ 948Total segment ATOI
(29)(2)(30)(307)1(311)21(18)Restructuring and other charges
(77)(91)(82)(388)(100)(101)(101)(86)Corporate expense
(84)(70)(67)(365)(64)(76)(110)(115)Minority interests
(63)(57)(64)(261)(53)(98)(56)(54)Interest expense
(29)(2)(30)(307)1(311)21(18)Restructuring and other charges
(77)(91)(82)(388)(100)(101)(101)(86)Corporate expense
(84)(70)(67)(365)(64)(76)(110)(115)Minority interests
(63)(57)(64)(261)(53)(98)(56)(54)Interest expense
$ 268$ 546$ 303$ 2,564$ 632$ 555$ 715$ 662Consolidated net income
(116)(32)(98)741303446(22)14Other
(1)––(7)8(3)(1)(11)Discontinued operations
$ 268$ 546$ 303$ 2,564$ 632$ 555$ 715$ 662Consolidated net income
(116)(32)(98)741303446(22)14Other
(1)––(7)8(3)(1)(11)Discontinued operations
In the first quarter of 2008, management approved a realignment of Alcoa's reportable segments to better reflect the core businesses in which Alcoa operates and how it is managed. This realignment consisted of eliminating the Extruded and End Products segment, and realigning its component businesses as follows: the building and construction systems business is reported in the Engineered Products and Solutions segment; the hard alloy extrusions business and the Russian extrusions business are reported in the Flat-Rolled Products segment; and the remaining segment components, consisting primarily of the equity investment/income of Alcoa's interest in the Sapa AB joint venture, and the Latin American extrusions business, are reported in Corporate. Additionally, the Russian forgings business was moved from the Engineered Products and Solutions segment to the Flat-Rolled Products segment, where all Russian operations are now reported. Prior period amounts were reclassified to reflect the new segment structure. Also, the Engineered Solutions segment was renamed the Engineered Products and Solutions segment.
31
g ee ed oducts a d So ut o s seg e t
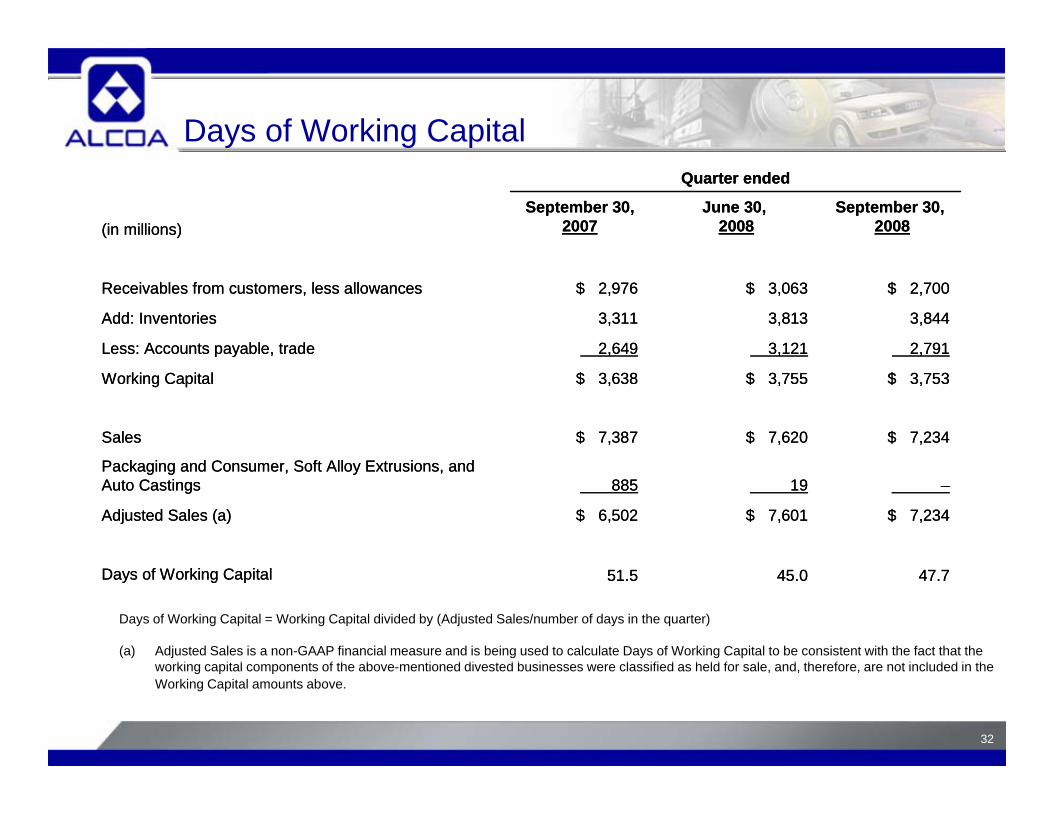
Days of Working Capital
September 30,2008
June 30,2008
September 30, 2007(in millions)
Quarter ended
September 30,2008
June 30,2008
September 30, 2007(in millions)
Quarter ended
2,7913,1212,649Less: Accounts payable, trade
3,8443,8133,311Add: Inventories
$ 2,700$ 3,063$ 2,976Receivables from customers, less allowances
2,7913,1212,649Less: Accounts payable, trade
3,8443,8133,311Add: Inventories
$ 2,700$ 3,063$ 2,976Receivables from customers, less allowances
$ 7,234$ 7,620$ 7,387Sales
$ 3,753$ 3,755$ 3,638Working Capital
,,,p y ,
$ 7,234$ 7,620$ 7,387Sales
$ 3,753$ 3,755$ 3,638Working Capital
,,,p y ,
$ 7,234$ 7,601$ 6,502Adjusted Sales (a)
–19885Packaging and Consumer, Soft Alloy Extrusions, and Auto Castings
$ 7,234$ 7,601$ 6,502Adjusted Sales (a)
–19885Packaging and Consumer, Soft Alloy Extrusions, and Auto Castings
Days of Working Capital = Working Capital divided by (Adjusted Sales/number of days in the quarter)
(a) Adjusted Sales is a non-GAAP financial measure and is being used to calculate Days of Working Capital to be consistent with the fact that the ki it l t f th b ti d di t d b i l ifi d h ld f l d th f t i l d d i th
47.745.051.5Days of Working Capital 47.745.051.5Days of Working Capital
32
working capital components of the above-mentioned divested businesses were classified as held for sale, and, therefore, are not included in the Working Capital amounts above.
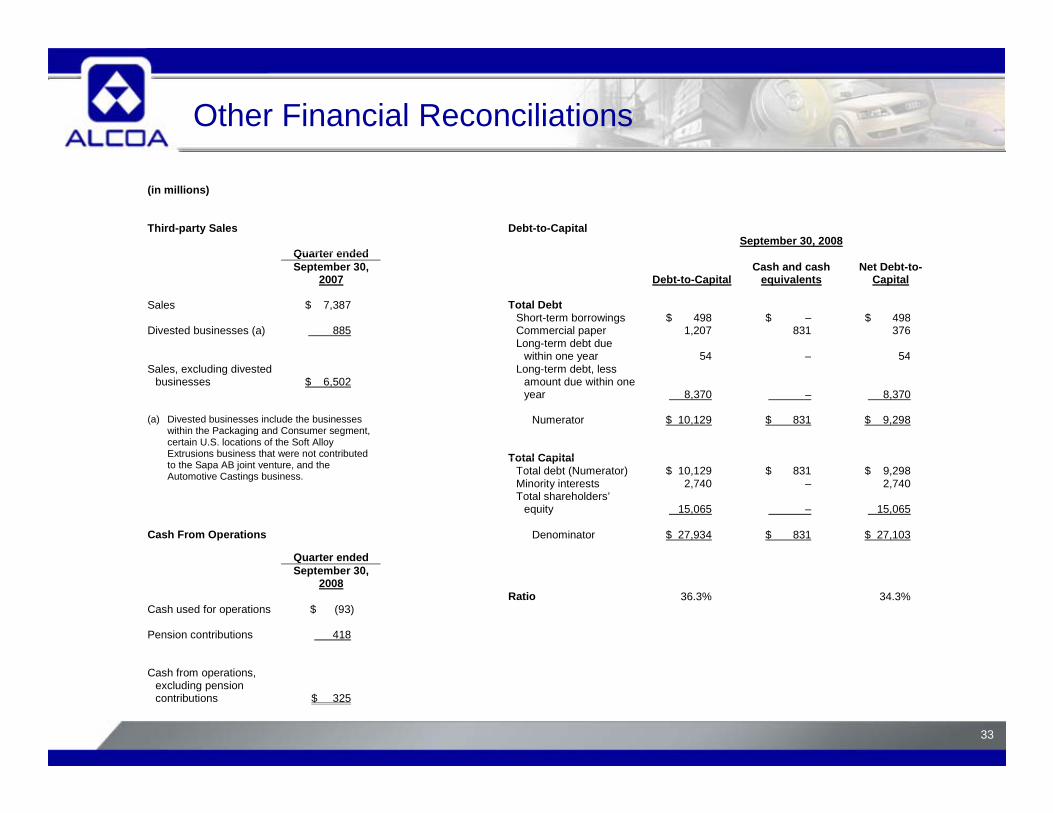
Other Financial Reconciliations
(in millions)
September 30, 2008
Quarter ended
Third-party Sales
Debt-to-Capital
Quarter ended September 30,
2007
Debt-to-Capital Cash and cash
equivalents Net Debt-to-
Capital Sales $ 7,387 Total Debt Short-term borrowings $ 498 $ – $ 498 Divested businesses (a) 885 Commercial paper 1,207 831 376 Long-term debt due
within one year 54
54 within one year 54 – 54Sales, excluding divested
businesses
$ 6,502
Long-term debt, less amount due within one year 8,370 – 8,370
Numerator $ 10,129 $ 831 $ 9,298
Total Capital
(a) Divested businesses include the businesses within the Packaging and Consumer segment, certain U.S. locations of the Soft Alloy Extrusions business that were not contributed Total Capital
Total debt (Numerator) $ 10,129 $ 831 $ 9,298 to the Sapa AB joint venture, and the Automotive Castings business.
Minority interests 2,740 – 2,740
Total shareholders’ equity 15,065 – 15,065
Denominator $ 27,934 $ 831 $ 27,103
Quarter ended
Cash From Operations
Quarter ended September 30,
2008 Ratio 36.3% 34.3% Cash used for operations $ (93) Pension contributions 418
33
Cash from operations,
excluding pension contributions
$ 325

Reconciliation of Adjusted Income
(in millions) Quarter ended 3Q07 2Q08 3Q08 Net income $ 555 $ 546 $ 268 Loss from
discontinued operations
(3)
–
(1) Income from
continuing operations
558
546
269
Discrete tax items 464 (9) – Gain on sale of
Chalco investment
(1,140)
–
– Transaction costs* 55 – – Restructuring and
other charges**
403 2 29
Income from continuing operations – as adjusted
$ 340
$ 539
$ 298
* Transaction costs include investment banking, legal, audit-related, and other third-party expenses, and interest expense related to the offer for Alcan. All costs except for interest expense are included in Selling, general administrative, and other expenses on the Statement of Consolidated Income.
** In the third quarter of 2007, Restructuring and other charges include a $93 after-tax goodwill impairment charge related to the Electrical and Electronic Solutions business.
34
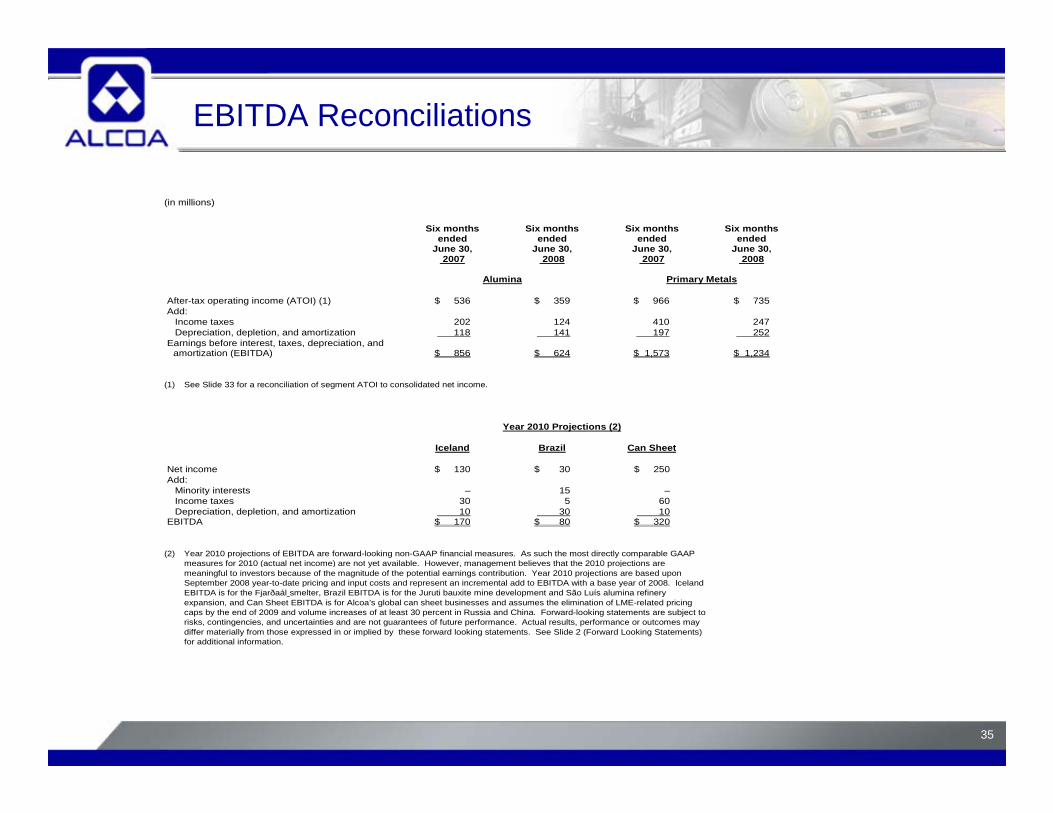
EBITDA Reconciliations
(in millions)
Six months
ended June 30,
Six months ended
June 30,
Six months ended
June 30, Six months
ended June 30,,
2007 ,
2008 ,
2007 ,
2008
Alumina Primary Metals After-tax operating income (ATOI) (1) $ 536 $ 359 $ 966 $ 735 Add:
Income taxes 202 124 410 247 Depreciation, depletion, and amortization 118 141 197 252
Earnings before interest, taxes, depreciation, and amortization (EBITDA)
$ 856
$ 624
$ 1,573
$ 1,234amortization (EBITDA) $ 856 $ 624 $ 1,573 $ 1,234
(1) See Slide 33 for a reconciliation of segment ATOI to consolidated net income. Year 2010 Projections (2) Iceland Brazil Can Sheet Net income $ 130 $ 30 $ 250 Add:
Minority interests – 15 – Income taxes 30 5 60 Depreciation, depletion, and amortization 10 30 10
EBITDA $ 170 $ 80 $ 320 (2) Year 2010 projections of EBITDA are forward-looking non-GAAP financial measures. As such the most directly comparable GAAP
f 2010 ( t l t i ) t t il bl H t b li th t th 2010 j ti
measures for 2010 (actual net income) are not yet available. However, management believes that the 2010 projections are meaningful to investors because of the magnitude of the potential earnings contribution. Year 2010 projections are based upon September 2008 year-to-date pricing and input costs and represent an incremental add to EBITDA with a base year of 2008. Iceland EBITDA is for the Fjarðaál smelter, Brazil EBITDA is for the Juruti bauxite mine development and São Luís alumina refinery expansion, and Can Sheet EBITDA is for Alcoa’s global can sheet businesses and assumes the elimination of LME-related pricing caps by the end of 2009 and volume increases of at least 30 percent in Russia and China. Forward-looking statements are subject to risks, contingencies, and uncertainties and are not guarantees of future performance. Actual results, performance or outcomes may differ materially from those expressed in or implied by these forward looking statements. See Slide 2 (Forward Looking Statements) for additional information.
35

Reconciliation of Return on Capital
3Q'08 2Q'08 1Q'08 4Q'07 3Q'07 2Q'07 1Q'07Bloomberg Bloomberg Bloomberg Bloomberg Bloomberg Bloomberg Bloomberg
(In Millions) Method Method Method Method Method Method Method
Net income $1,749 $2,036 $2,205 $2,564 $2,291 $2,273 $2,302Minority interests $285 $277 $317 $365 $399 $432 $446Interest expense (after-tax) $312 $267 $266 $262 $246 $270 $281
Numerator (sum total) $2,346 $2,580 $2,788 $3,191 $2,936 $2,975 $3,029
Average Balances
Short-term borrowings $537 $568 $524 $516 $497 $451 $441Short-term debt $126 $352 $358 $356 $525 $359 $360Commercial paper $782 $819 $864 $1,164 $1,275 $1,169 $972Long-term debt $7,351 $6,523 $6,374 $5,574 $5,390 $5,709 $5,767Preferred stock $55 $55 $55 $55 $55 $55 $55Minority interests $2,532 $2,519 $2,320 $2,130 $1,927 $1,809 $1,669Common equity $15 435 $16 695 $15 563 $15 269 $15 255 $15 571 $14 621
C ( OC) OC
Common equity $15,435 $16,695 $15,563 $15,269 $15,255 $15,571 $14,621
Denominator (sum total) $26,818 $27,531 $26,058 $25,064 $24,924 $25,123 $23,885
Return on Capital 8.7% 9.4% 10.7% 12.7% 11.8% 11.8% 12.7%
36
Return on Capital (ROC) is presented based on Bloomberg Methodology which calculates ROC based on trailing four quarters.
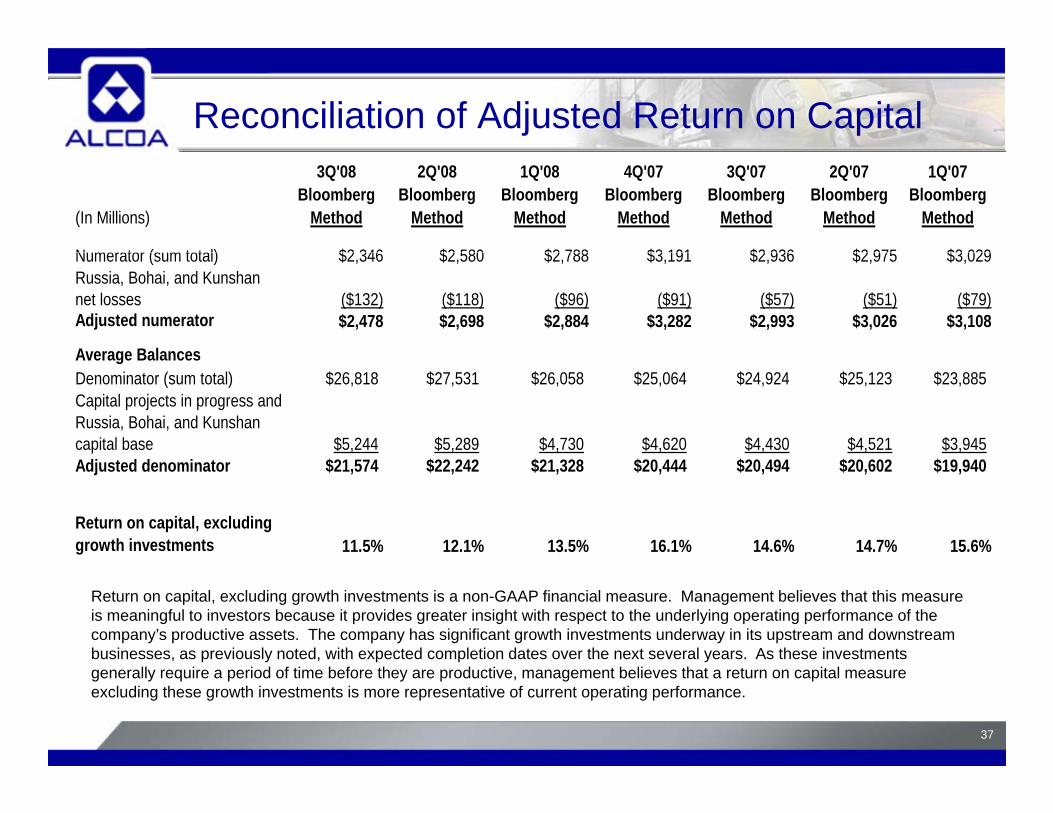
Reconciliation of Adjusted Return on Capital3Q'08 2Q'08 1Q'08 4Q'07 3Q'07 2Q'07 1Q'07
Bloomberg Bloomberg Bloomberg Bloomberg Bloomberg Bloomberg Bloomberg(In Millions) Method Method Method Method Method Method Method
Numerator (sum total) $2 346 $2 580 $2 788 $3 191 $2 936 $2 975 $3 029Numerator (sum total) $2,346 $2,580 $2,788 $3,191 $2,936 $2,975 $3,029Russia, Bohai, and Kunshan net losses ($132) ($118) ($96) ($91) ($57) ($51) ($79)Adjusted numerator $2,478 $2,698 $2,884 $3,282 $2,993 $3,026 $3,108
Average BalancesAverage BalancesDenominator (sum total) $26,818 $27,531 $26,058 $25,064 $24,924 $25,123 $23,885Capital projects in progress and Russia, Bohai, and Kunshan capital base $5,244 $5,289 $4,730 $4,620 $4,430 $4,521 $3,945Adjusted denominator $21,574 $22,242 $21,328 $20,444 $20,494 $20,602 $19,940
Return on capital, excluding growth investments 11.5% 12.1% 13.5% 16.1% 14.6% 14.7% 15.6%
Return on capital, excluding growth investments is a non-GAAP financial measure. Management believes that this measure is meaningful to investors because it provides greater insight with respect to the underlying operating performance of the company’s productive assets. The company has significant growth investments underway in its upstream and downstream businesses, as previously noted, with expected completion dates over the next several years. As these investments
37
generally require a period of time before they are productive, management believes that a return on capital measure excluding these growth investments is more representative of current operating performance.